Abstract
Micro-drilling resistance method is a widely used tree ring micro-destructive detection technology. To solve the problem that the detection signal of the analog micro-drilling resistance method has excessive noise interference and cannot intuitively identify tree ring information, this research proposes a digital micro-drilling resistance method and provides a recommended hardware implementation. The digital micro-drilling resistance method adopts the photoelectric encoder instead of ADC as the signal sampling module. Through the theoretical analysis of the DC motor characteristic, the PWM closed-loop speed control, the detection principle of the digital method is given. Additionally, the experimental equipment that can complete the detection of the digital method and the analog method simultaneously is designed to carry out comparative experiments. The experimental results show that: (1) The detection results of the digital method have a better-quality signal which can intuitively identify the tree rings. (2) The average correlation coefficient reaches 0.9365 between the detection results of the digital method and the analog method. (3) The average Signal-to-Noise Ratio (SNR) of the digital method is 39.0145 dB, which is 19.2590 dB higher than that of the analog method. The average noise interference energy in the detection result of the digital method is only 1.27% of the analog method. In summary, hardware implementation of the digital micro-drilling resistance method can correctly reflect the tree ring information and significantly improve the signal quality of the micro-drilling resistance technology. This research is helping to improve the identification accuracy of micro-drilling resistance technology, and to develop the application of tree ring micro-destructive detection technology in the high-precision field.
1. Introduction
Tree rings are the chronology of tree growth. The detection of tree rings can reveal the growth of trees, judge their age, and provide an important basis for the cultivation, utilization, and protection of trees [1]. In addition, tree rings also record the impact of external factors such as environment and climate on tree growth [2]. Tree ring detection has become an important way of obtaining forest growth and ecological environment information [3,4,5,6]. Dendrochronology which is widely used in archaeology, climatology, ecology, and geomorphology, has also become an interdisciplinary subject [7].
Facing the goal of developing better-quality forestry, it is imperative to develop modern and smart forestry and improve the level of digitalization and intelligence [8,9]. Electronic and intelligent tools are constantly being applied to tree ring detection. In the traditional tree ring detection method of tree disc sampling, the STD4800 scanner is introduced to obtain high-definition tree disk images [10]. Then digital image recognition is carried out through a special tree ring analysis system such as WinDendro [11,12,13,14]. It also can use the LINTAB CNC measuring platform and TSAP standard annual ring analysis software to observe the tree disk by the high-resolution microscope [15,16,17,18]. With the support of electronic tools, the detection accuracy of the tree disc sampling method is very satisfactory. However, the great damage caused by felling trees is unavoidable with the tree disk sampling method. The increment borer sampling method is an improved method [19,20]. Taking the widely used HAGLOF increment borer as an example, it drills a hollow cone tube with a diameter of 5~12 mm into the tree trunk to obtain tree core samples [21,22,23]. However, the penetrating wound left on the trunk after the increment borer sampling greatly increases the risk of disease infection of the tree, which causes great damage [24].
With the strengthening of forest protection, the tree-ring detection technology is developing in the direction of reducing the detection damage, and the non-destructive or micro-destructive detection method of tree rings has attracted more and more attention. From the traditional tree disk sampling method and the increment borer sampling method to the computer tomography technology and the micro-drilling resistance technology, the detection of tree rings is constantly trying new methods and technologies in forestry operations [25,26]. However, the non-destructive tree ring detection equipment represented by computer tomography has the disadvantages of high cost and large equipment size, so it is difficult to be widely used in wild forestry practice [27,28,29]. Therefore, the micro-drilling resistance tree ring detection technology has high expectations and has become a widely used technology in the micro-destructive detection of tree rings.
The micro-drilling resistance tree ring detection technology refers to using a slender drill needle to drill into the tree’s interior using a motor drive, detecting the tree ring by sensing the resistance change during the drilling process [30]. The essence of micro-drilling resistance technology is to build a sensor system that measures the change in density and resistance caused by tree ring distribution [31]. The diameter of the micro-drill drilled into the tree is generally less than 3 mm [32], so the damage to the tree’s phloem will be significantly reduced, and the sieve tube that transports nutrients will not affect the growth of the entire tree due to individual damage. Therefore, the micro-drilling resistance technology can be regarded as a method of tree ring micro-destructive detection. With the application of electrical recording in micro-drilling resistance equipment, research on tree rings, internal structure, density, elastic modulus, etc., has been gradually carried out by analyzing resistance signal waveforms [33,34,35,36]. The device, capable of acquiring resistance waveforms, was named Resistograph by Rinntech.
Concerning the requirements of micro-destructive detection, obtaining a higher quality signal and higher detection accuracy has become a research hotspot of the micro-drilling resistance method. Rinn, F gives the recommended micro-drill bit shape and mechanical structure to improve the tree rings sensitivity of the drill pin and reduce the interference of mechanical vibration in the detection process [37]. Cao, Y et al. attempt to improve detection accuracy by selecting the best detection path concerning the tree pith [38]. Oh, J et al. showed the most proper feed speed to better evaluate the number of tree rings for each tree species [15].
For the widely used and fully disclosed analog micro-drilling resistance method, the main factor that affects the detection and identification accuracy is the excessive noise interference in the output signal [39,40]. The signal in the analog method transmits in analog quantities form, which results in poor anti-interference ability. And the complex signal sampling process inevitably introduces noise interference, which causes poor signal quality. These shortcomings, determined by the principle of the analog method, limit the detection accuracy and mean the original waveform cannot be visually identified, so the original waveform has to be processed by a filtering algorithm to identify the tree rings. The researchers use various filtering algorithms to improve the original detection signal from the analog method. For example, Pan H’s research uses Kalman filtering to process the detection signal, and the processed signal is used to evaluate the tree age [41]. The research of Yao, J et al. use an adaptive filtering algorithm to improve the accuracy of tree ring identification [42]. The research of Hu, X et al. uses the FIR filtering algorithm and IIR filtering algorithm to process the output signals and evaluate the filtering results [43]. However, the filtering algorithms can only reduce the influence of noise interference but cannot eliminate it. At the same time, the filtering process also brings side effects. On the one hand, the complex filtering algorithm reduces the real-time performance of the result. On the other hand, the threshold setting of filtering parameters is still quite difficult. The strict filtering parameter settings will lead to the lack of effective signal, while the loose filtering parameter settings will lead to difficulties in tree ring identification, which will greatly reduce detection accuracy.
To solve the problem that the detection signal of the analog micro-drilling resistance method has excessive noise interference and cannot intuitively identify the tree ring information, this research proposes a digital micro-drilling resistance method. The digital micro-drilling resistance method attempts to design a new detection principle and hardware implementation to realize the transmission of the signals in the digital quantities form, fundamentally eliminate part of the noise interference, and improve the signal quality. Compared with the analog method, the digital method has the advantages of less noise interference, a simple detection circuit, and easy identification of tree rings.
This research aims to improve the signal quality and the detection accuracy of tree ring micro-drilling detection technology, and to develop the application of tree ring micro-destructive detection technology in the high-precision field. By reading this article, readers will acquire the sensor principle and hardware implementation of the digital micro-drilling resistance method, which has better signal quality and more easily identifiable waveforms than the widely used analog micro-drilling resistance method.
2. Background
2.1. Dendrochronological Basis for Micro-Drilling Resistance Technology
Tree rings refer to the concentric rings on the cross-section of the tree trunk, and their density and resistance characteristics are the basic principles of micro-drilling resistance technology. Each round consists of earlywood and latewood, generally representing secondary wood formed within a year.
The climate in spring and summer is warm and humid, which is suitable for tree growth. The cambium cells grow and divide rapidly, and the formed xylem cells have a larger size, thinner cell wall, less fiber content, and more ducts for transporting water. Therefore, this part of the tree ring is loose in texture with a lighter color, and it is used to be called earlywood or spring wood. On the contrary, the activity of cambium cells is significantly weakened in autumn and winter, and the formed xylem cells become narrow, thick, and fiber-rich. Therefore, the part of the tree ring in autumn and winter is dense in texture with a darker color, habitually called latewood or autumn wood [39].
The microscopic structure of conifers is simple and regular, and mainly composed of tracheids and xylem rays. The xylem rays of conifers are very thin and invisible to the naked eye. In general, the tree ring circle of a coniferous tree is obvious, and the difference between early and late wood is obvious. The earlywood has a thin wall with a large cavity and a lighter color, while the latewood has a thick wall with a small cavity and a darker color.
The broad-leaved wood is mainly composed of vessel, wood fiber, axial parenchyma, and xylem ray. The structure is complicated. The size and distribution of the vessel holes are divided into ring-porous trees, diffuse-porous trees, and semi-ring-porous trees. In the ring-porous trees, the diameter of the vessels in the earlywood is significantly larger, while the vessels in the latewood are quite small, so the density differences are very obvious and the tree rings are easy to identify. The vessel size and distribution of diffuse-porous trees reflect consistency or slight graduality. Therefore, there is no significant boundary from earlywood to latewood; only a thin boundary exists between the latewood of the previous growing season and the earlywood of the next growing season, so it is not easy to distinguish. The semi-ring-porous trees are an intermediate type between the ring-porous and the diffuse-porous. In the earlywood part, there will be bands formed by large vessels, or rings formed by many small vessels, making the earlywood more obvious [44,45].
The micro-drilling resistance technology can reflect the density during the drilling process and distinguish the earlywood and the latewood through the obvious change in the wood density. Then the operator can carry out tree ring identification and analysis to infer the tree’s age.
2.2. Classification of Micro-Drilling Resistance Method
According to the different sensor principles for determining resistance changes, this research divides the micro-drilling resistance technology into three types: mechanical method, analog method, and digital method.
2.2.1. Mechanical Micro-Drilling Resistance Method
The mechanical micro-drilling resistance method refers to driving the micro-drill using a DC motor on a constant voltage and relying on the mechanical vibration to perceive the measurement results and identify the change in the tree’s internal resistance. The sensor principle of the method is based on the mechanical characteristic of the DC motor. And the motor running at a constant voltage can be called the open-loop control mode. When the wood density contacted by the micro-drill increases or decreases, the output torque of the DC motor will increase or decrease accordingly, and the drilling needle driven by the DC motor will suddenly decelerate or accelerate. This sudden speed change can be perceived by the user through the instrument’s mechanical vibration or be recorded by the spring-loader [46]. The mechanical method does not set up a signal detection circuit, so the measurement results cannot be quantified. Therefore, the mechanical method is difficult to identify the subtle resistance changes caused by the tree rings and gradually withdraws from the application of tree ring detection. As the first micro-drilling resistance detection method, the mechanical method realizes the micro-destructive detection of the tree’s internal material by simple equipment and sensor principles. IML-RESI MD300 is a representative micro-destructive detection equipment based on the mechanical micro-drilling resistance method [47]. MD300 is a drilling instrument working purely mechanically that does not electronically record a measurement curve. The user feels the result and can read the penetration depth on the 300 mm scale. Often an abrupt and fast penetration is perceptible when the instrument detects a rot zone. It is currently used in the detection of hollows, rots, and cracks in trees, and other fields which do not require high precision. Since the mechanical method is replaced by the analog method in tree ring detection, the mechanical method will not be involved in the following experiments and comparative analysis.
2.2.2. Analog Micro-Drilling Resistance Method
To solve the problem acknowledging that the measurement results of the mechanical method cannot be quantified and the automation degree of the detection process is low, the analog micro-drilling resistance method came into being. The analog micro-drilling resistance method refers to using a closed-loop control motor to drive the micro-drill rotated at a constant speed, converting the resistance amplitude into an analog signal by connecting a sampling resistor in the motor armature circuit, and finally transferring the signal to SoC (System-on-a-Chip) by the ADC (Analog-to-Digital Converter) sampling module. The analog method solves the disadvantage that the mechanical method cannot quantify the results and has become a widely used method for micro-drilling resistance technology. The design principle of the tree ring micro-destructive detection equipment published by Hu, X and Chen, X can be considered the analog method [39,40]. Currently, the tree ring micro-destructive detection system designed by Beijing Forestry University (BJFU) and the tree-ring acupuncture instrument designed by the Chinese Academy of Forestry (CAF) are both designed by the analog micro-drilling resistance method. Using the equipment based on the analog method, the operator can automatically complete the drilling and simply obtain the result data by sending control commands through the button. And in the process of detection, the results can be printed on wax paper in real-time waveforms or stored on an SD card. The distribution of earlywood and latewood in tree rings was analyzed by the peaks and troughs of the waveform. The analog method that can quantify the measurement results ensures the feasibility of the micro-drilling resistance method for tree ring detection [48,49].
2.2.3. Digital Micro-Drilling Resistance Method
The digital micro-drilling resistance method proposed in this research is a new micro-drilling resistance tree ring detection method, which is based on the principle of the DC motor output characteristic and the PWM closed-loop speed control. The digital micro-drilling resistance method uses a photoelectric encoder to obtain digital signals for transmission, which is different from the widely used analog method and does not need to use the ADC conversion module, which avoids noise interference during signal sampling and improves the anti-interference ability of the signal. Compared with the analog method, the digital method has the advantages of less noise interference, a simple detection circuit, and easy identification of tree rings.
Table 1 shows the comparison of the mechanical method, the analog method, and the digital method proposed in this research.

Table 1.
Comparison of the mechanical method, the analog method, and the digital method.
3. Materials and Methods
In this section, the principle of the digital micro-drilling resistance method is firstly deduced by formula. The recommended hardware implementation of the digital micro-drilling resistance method is also given. The experimental equipment which can complete the detection of the digital method and the analog method is designed to simultaneously carry out comparative experiments. Finally, the experimental sample is introduced.
3.1. Principle of Digital Micro-Drilling Resistance Method
The digital micro-destructive resistance method proposed in this research is based on the output torque characteristic of the DC motor and the PWM closed-loop speed control. It uses the photoelectric encoder to obtain the detection data. The formula is derived as follows.
The digital micro-drilling resistance method detects the resistance torque given by the tree rings on the micro-drill bit to obtain the density change of the tree rings.
Equation (1) is the theorem of rigid body rotation with a fixed axis:
: combined external torque acting on the drill; : moment of Inertia of the drill; : angular acceleration of the drill; : angular velocity of the drill; : time.
The moment of inertia of the drill needle is determined by three factors: the quality, the mass distribution, and the position of the rotating axis. During the detection, the moment of inertia of the drill is a constant value.
Equation (2) is derived from the force analysis of the micro-drill:
: electromagnetic torque; : load torque or resistance torque; : no-load torque.
The direction of electromagnetic torque is opposite to the direction of resistance torque and no-load torque . Therefore, the scalarized Equation (2) combines with Equation (1) to form Equation (3):
Shift the terms of Equation (3) to get the value of load torque :
To obtain a linear relationship between the and the , the angular acceleration of the micro-drill must always be equal to zero—that is, the derivative of the angular velocity with time is always equal to zero. The drill needle must move at a constant angular velocity during the drilling process. In this case, Equation (4) can be simplified to Equation (5):
The no-load torque of the motor is much smaller than the resistance torque during drilling, so can be ignored. Under the condition that the drill needle is kept moving at a constant angular velocity and the load torque is ignored, the Equation (5) can be approximated as:
The above derivation converts the resistance torque into the measurement of the electromagnetic torque of the motor and provides an electrical way to measure the resistance torque .
Equation (7) is the torque characteristic of the DC brush motor:
: torque constant; : flux per pole, determined by the characteristic of the motor; : armature current.
Equation (8) can be obtained by combining Equations (6) and (7):
Equation (8) shows that the armature current is linearly proportional to the resistance torque . Through the value of the armature current , the resistance change in the drilling process can be obtained, and the tree ring detection can be realized.
Different from the analog method in which the armature current is obtained by the sampling resistance method, the digital method converts into a digital signal and transmits it to the SoC.
The DC motor voltage balance equation is shown in Equation (9):
: armature voltage; : armature electromotive force; armature resistance.
The principle of electromagnetics shows that the relationship between the motor speed and the armature electromotive force is shown in Equation (10):
: potential coefficient.
The relationship between the motor speed and the rotational angular velocity is shown in Equation (11):
The prerequisite of Equation (8) is that the angular velocity is a constant value, so during the detection process, the motor speed is a constant value, and the armature electromotive force is also a constant value.
The PID algorithm and PWM technology control a constant angular velocity of the micro-drill during the detection process. PWM is a method for the SoC to control analog circuits by outputting digital signals [50,51]. And PWM control technology obtains the required waveform or equivalent amplitude according to the principle of area equivalence by modulating the width of the pulse. The rectangular wave voltage PWM is shown in Equation (12):
: PWM duty ratio; : maximum voltage.
Equation (13) can be derived from Equations (8)–(10):
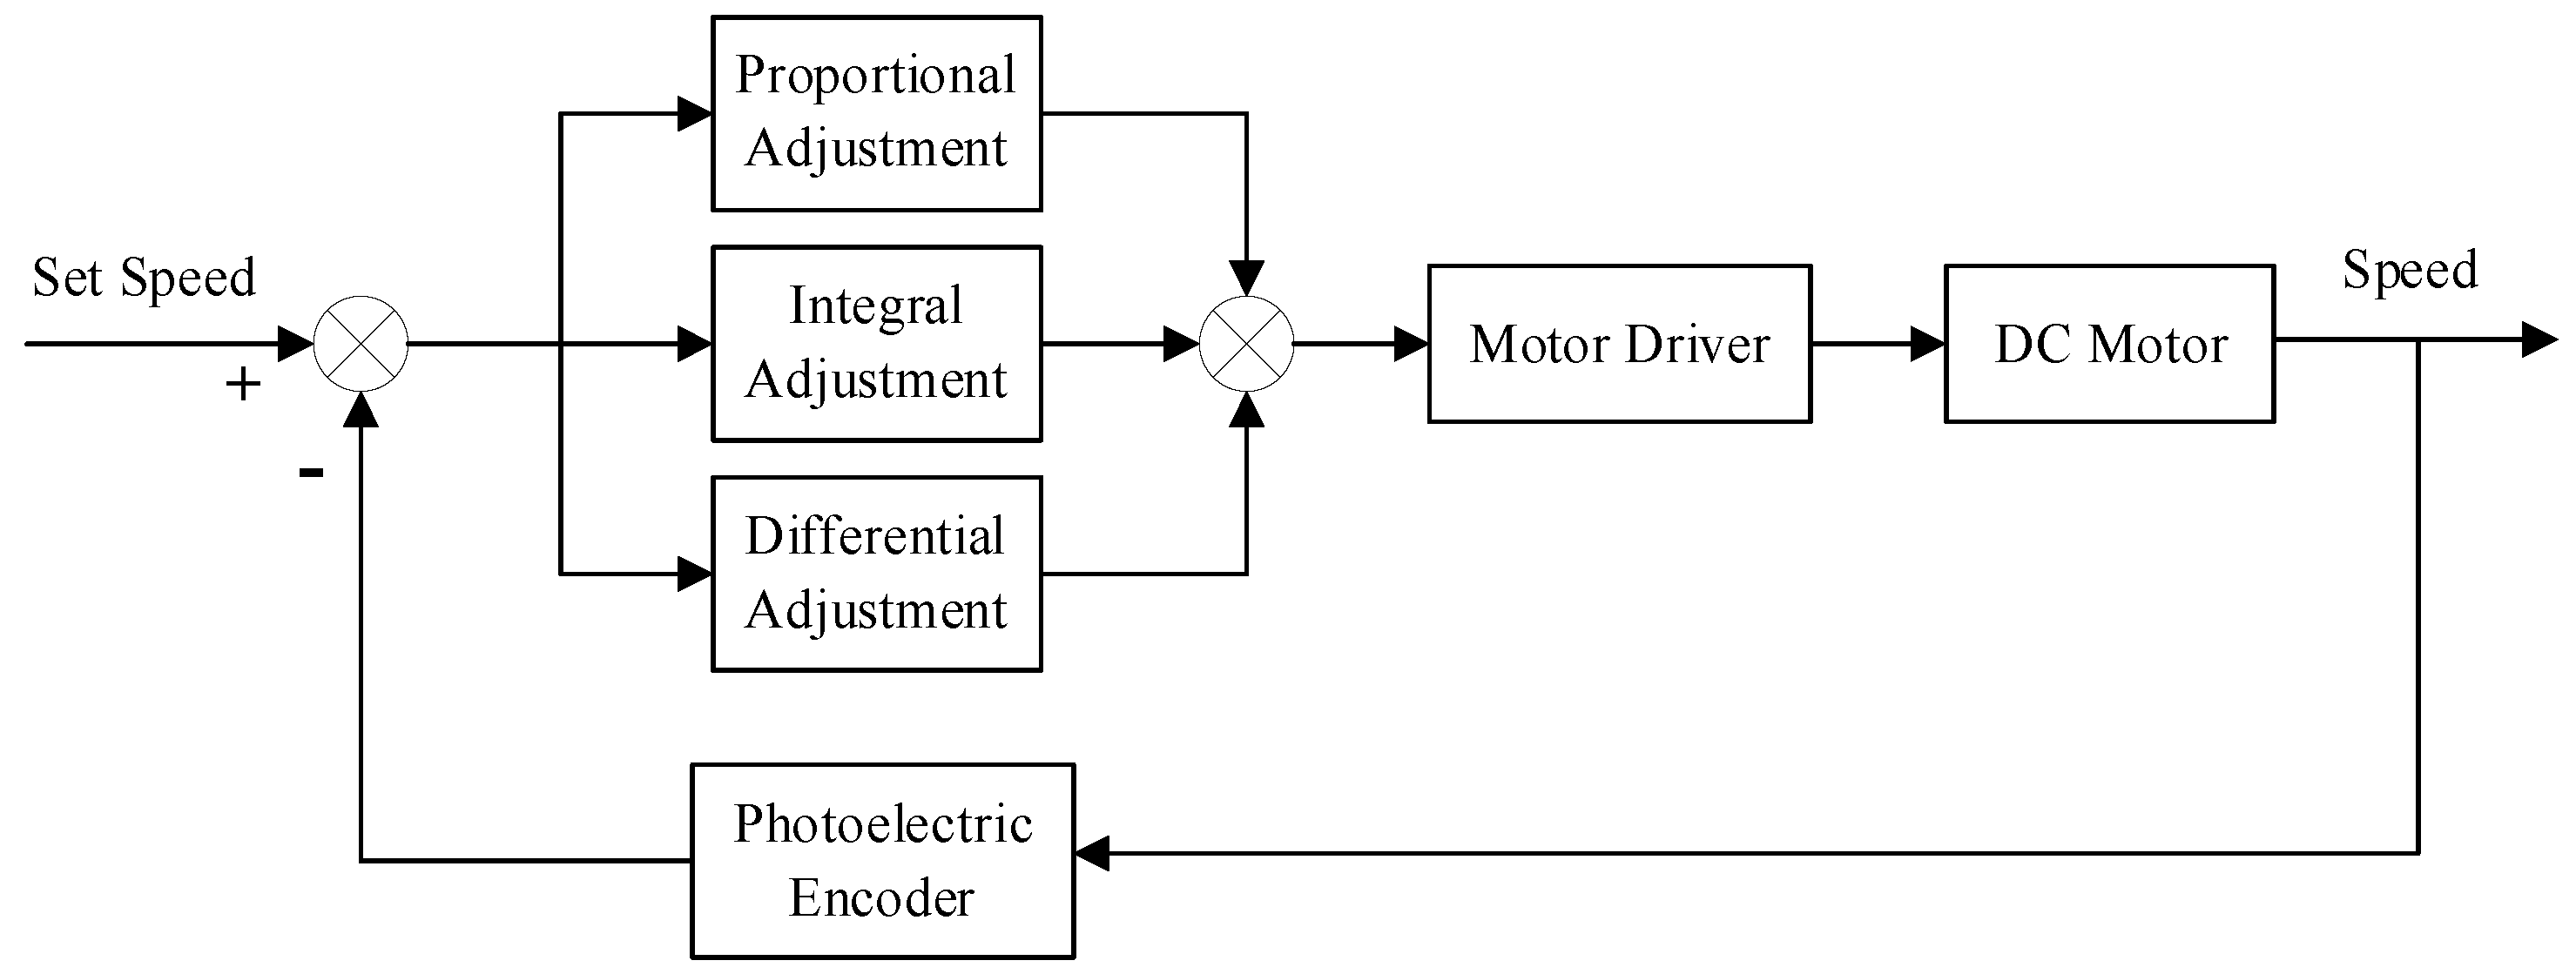
The PID algorithm is a method of control by deviation, where P means proportional, I means integral, and D means differential. The algorithm is simple, robust, reliable, and widely used in various control fields [52,53,54]. And Figure 1 shows the structure diagram of the PID speed closed-loop control algorithm.

Figure 1.
The structure diagram of the PID speed closed-loop control algorithm.
is calculated by SoC according to PID speed closed-loop control algorithm and speed error, as shown in Equation (14):
: pulse width time; : cycle time of PWM; : speed error; : proportional adjustment coefficient; : integral adjustment coefficient: : differential adjustment coefficient.
The PWM cycle time is a constant value during the control process, and the rotational speed error is calculated by the photoelectric encoder.
The above formula derivation proves the relationship shown in Equation (15):
and are proportional to the resistance torque , and the resistance change can be reflected by the value change of or . The detection signal is sampled and transmitted as a digital signal, and ADC is not used in the whole signal flow process. Therefore, this research named the method “digital micro-drilling resistance method”.
3.2. Hardware Implementation of Digital Micro-Drilling Resistance Method
According to the principle of the digital micro-drilling resistance method, we give the recommended hardware system architecture and hardware implementation scheme. The hardware system architecture of the digital micro-drilling resistance method is shown in Figure 2, which consists of a SoC module, a DC motor drive module, a digital signal sampling module, and a data transmission module.
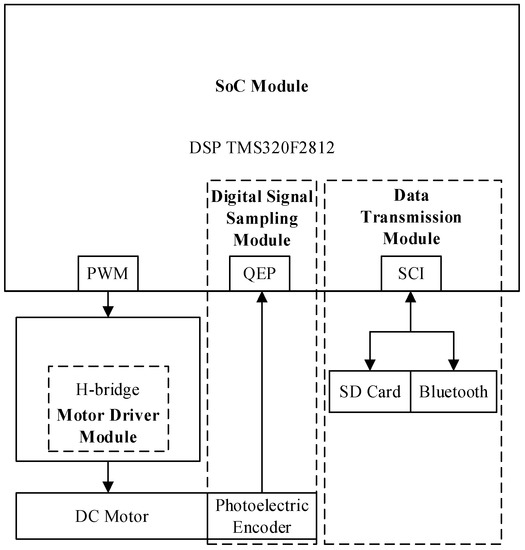
Figure 2.
The hardware system architecture.
3.2.1. SoC Module
The SoC module is composed of DSP chip and peripheral circuits. As the core of the detection and control circuit, the DSP chip adopts a TMS320F2812 high-speed real-time digital signal processing chip. The chip is a high-performance 32-bit data processor with excellent digital signal processing and motion control capabilities. Abundant peripheral functions and interfaces can meet the needs of digital micro-drilling resistance methods. The PWM function realizes the control of the DC motor, the Serial Communication Interface (SCI) realizes the transmission of detection data, and the Quadrature Encoder Pulse (QEP) module is used for digital encoder signal sampling [55,56].
3.2.2. H-Bridge Motor Driver Module
The RE35 DC motor is selected as the drive motor for the high-speed rotation of the micro-drill. The motor has the characteristics of low-speed fluctuation, high conversion efficiency, high operation stability, and easy control.
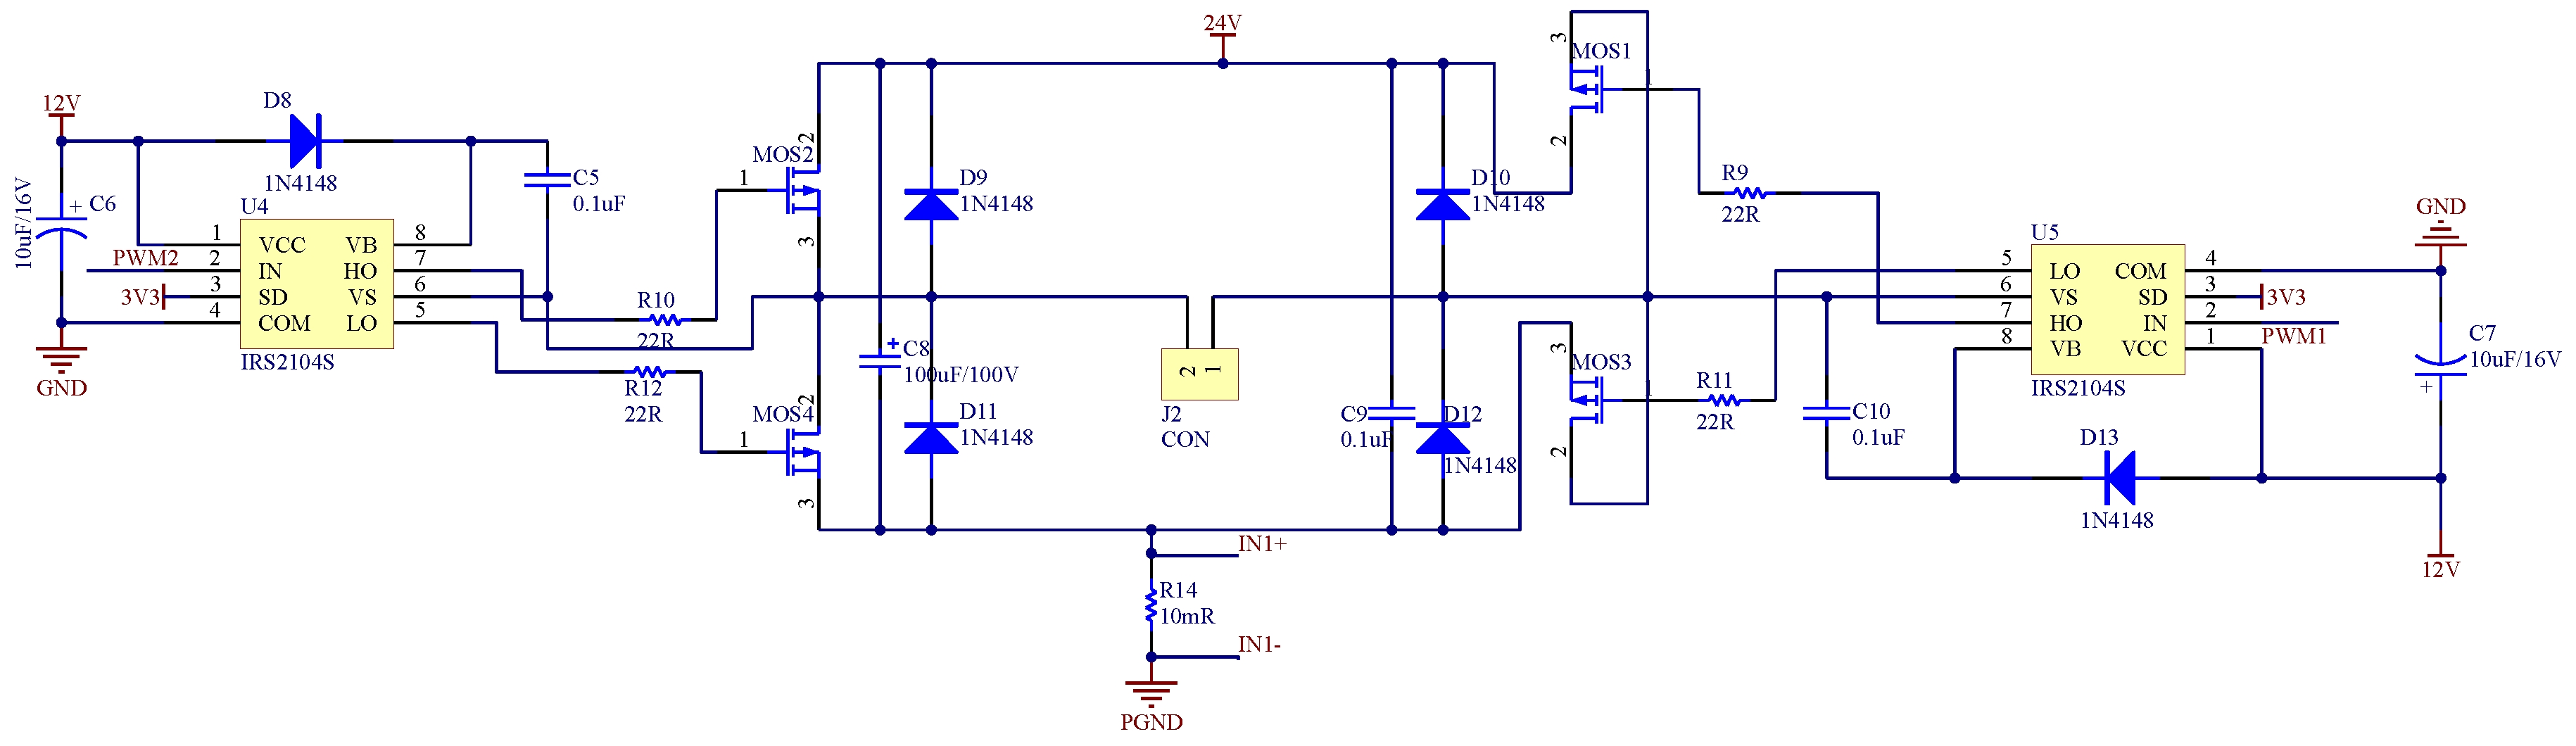
In the process of drilling into the tree and exiting the tree, the micro-drill needs to rotate in the opposite direction, so the first control requirement for the motor is to realize forward and reverse control. At the same time, the principle of the micro-drilling resistance method requires that the motor must rotate at a constant angular velocity to ensure the validity of tree ring identification. Therefore, the second control requirement for the motor is to realize speed control. Further, the principle of the digital micro-drilling resistance method requires the use of a PWM voltage modulation signal to control the speed of the motor. For this purpose, the H-bridge motor driver circuit, as shown in Figure 3, is designed.
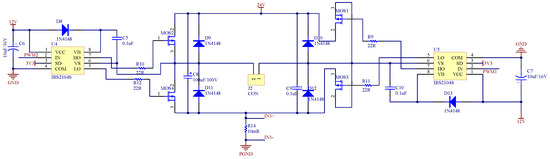
Figure 3.
The H-bridge motor driver circuit.
The H-bridge motor driver circuit is composed of 4 MOSFETs distributed on 4 bridge arms, and the on and off of the MOSFET is controlled by the PWM signal [57]. The PWM control signals of MOS1 and MOS3, MOS2 and MOS4, are complementary channels. PWM1 and PWM2 are a pair of control signals with opposite polarities but the same period and duty cycle so that the two MOSFETs on the diagonal can be turned on and off simultaneously. The H-bridge motor driver circuit can control the forward and reverse rotation of the motor and has the advantages of small speed regulation static difference, large range, and fast dynamic response, which meets the control requirements of the micro-drill drive motor.
The maximum output voltage of the DSP pin is 3.3 V, which cannot meet the turn-on requirements of driving the upper bridge arm. It is necessary to use a bootstrap circuit to boost the PWM signal to control the MOSFET. The bootstrap circuit comprises a half-bridge driver chip IR2104S, a bootstrap diode, and a bootstrap capacitor. IR2104S can output a pair of complementary drive levels with a dead zone only by inputting one PWM control signal. The DSP outputs PWM1 and PWM2, two control signals to control two IR2104S chips, achieve the control of the four MOS tubes in the H-bridge circuit, and realize the adjustment of the motor speed and steering.
3.2.3. Digital Signal Sampling Module
A HEDL-5540 1024-line incremental photoelectric encoder is installed at the rear of the RE35 DC motor, as shown in Figure 4.
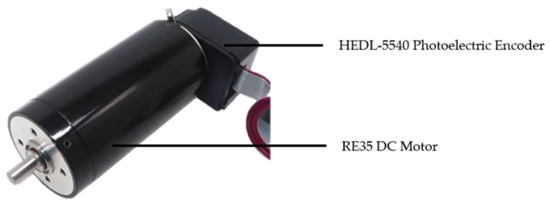
Figure 4.
The RE35 DC motor with HEDL-5540 photoelectric encoder.
The digital signal sampling module is used to receive the rotational speed digital signal transmitted by the HEDL-5540 1024-line incremental photoelectric encoder. The HEDL-5540 encoder is a device that converts the mechanical geometric displacement on the output shaft of the motor into a digital pulse signal through photoelectric conversion. There are three square wave pulse output signals: A, B, and I. Pulse A and B measure the rotation direction and speed, and their phase difference is 90°. Pulse I is used to locate the reference point. The square wave pulses A, B, and I output by the encoder are respectively connected with the QEP1, QEP2, and QEPI pins of the DSP, and the digital signal of the rotational speed detected by the encoder is transmitted to the DSP.
The number of pulses sent by the HEDL-5540 encoder per motor revolution is 1024. Assuming that the total number of pulses measured within a fixed time interval is , the calculation formula of the motor speed per minute is shown in Equation (16):
In the specific implementation, the DSP timer works in the directional increase/decrease mode, the clock source is set to the QEP circuit module, and the initial value of the timer’s count register is set to the intermediate value 0x7FFF. If the phase of the pulse signal A input by the QEP1 pin is ahead of the pulse signal B input by the QEP2 pin, the count register will count up; otherwise, the count register will count down. The motor direction is judged by the sign of the difference between the end value of the count register and the initial value within a fixed time interval, and the speed value is judged by the absolute value. It should be noted that the QEP module of the DSP counts both the upper and lower edges of the pulse, so the clock input frequency generated by the QEP module is 4 times the frequency of the A or B pulse signal.
3.3. Experimental Equipment
To verify the theoretical derivation of the digital micro-drilling resistance method, and compare the difference in detection results between the digital and analog methods under the same condition, a tree ring detection experimental equipment which can complete the detection of the digital method and the analog method simultaneously is designed to carry out comparative experiments.
3.3.1. Mechanical Structure
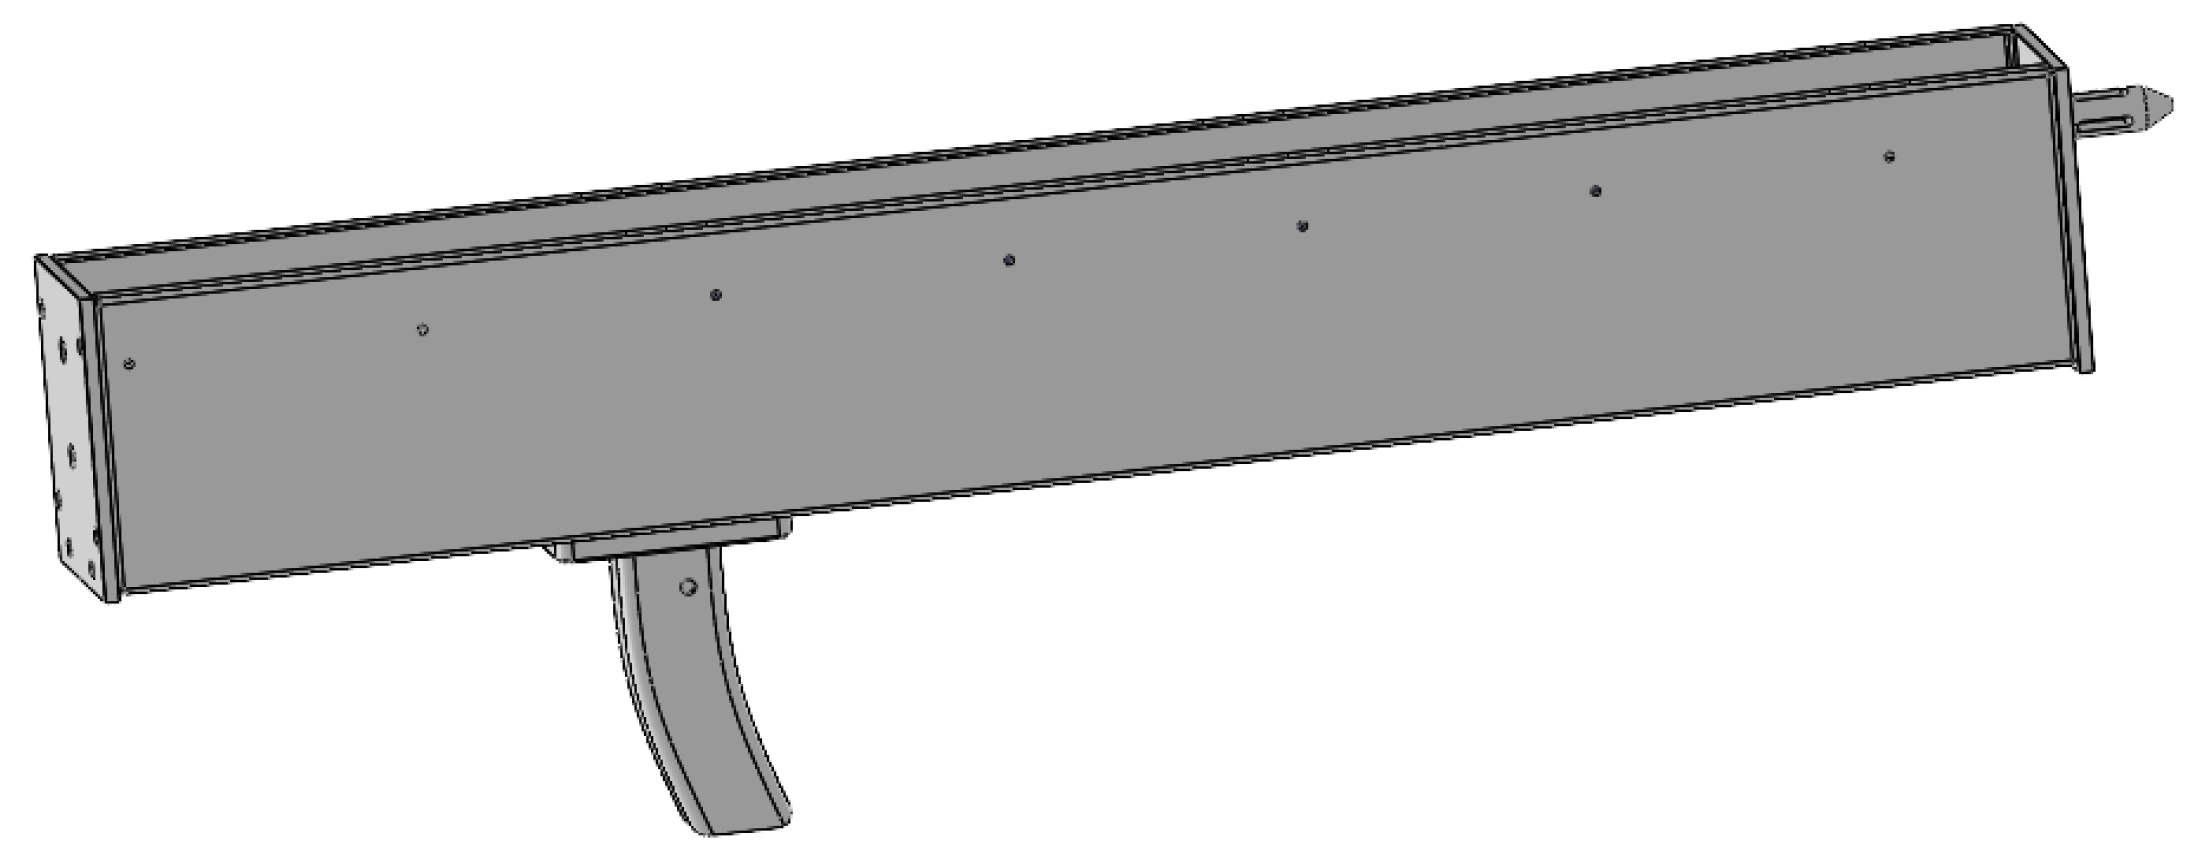
The experimental equipment adopts the hand-held mechanical structure and dual-motor transmission structure shown in Figure 5 and Figure 6, similar to the mechanical structure proposed by Hu X. in [39].

Figure 5.
The hand-held mechanical structure.
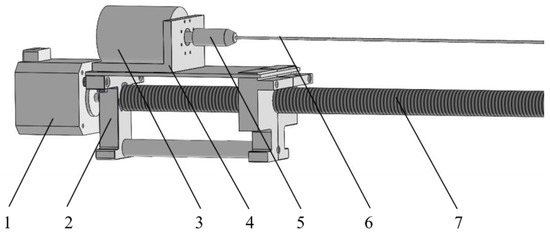
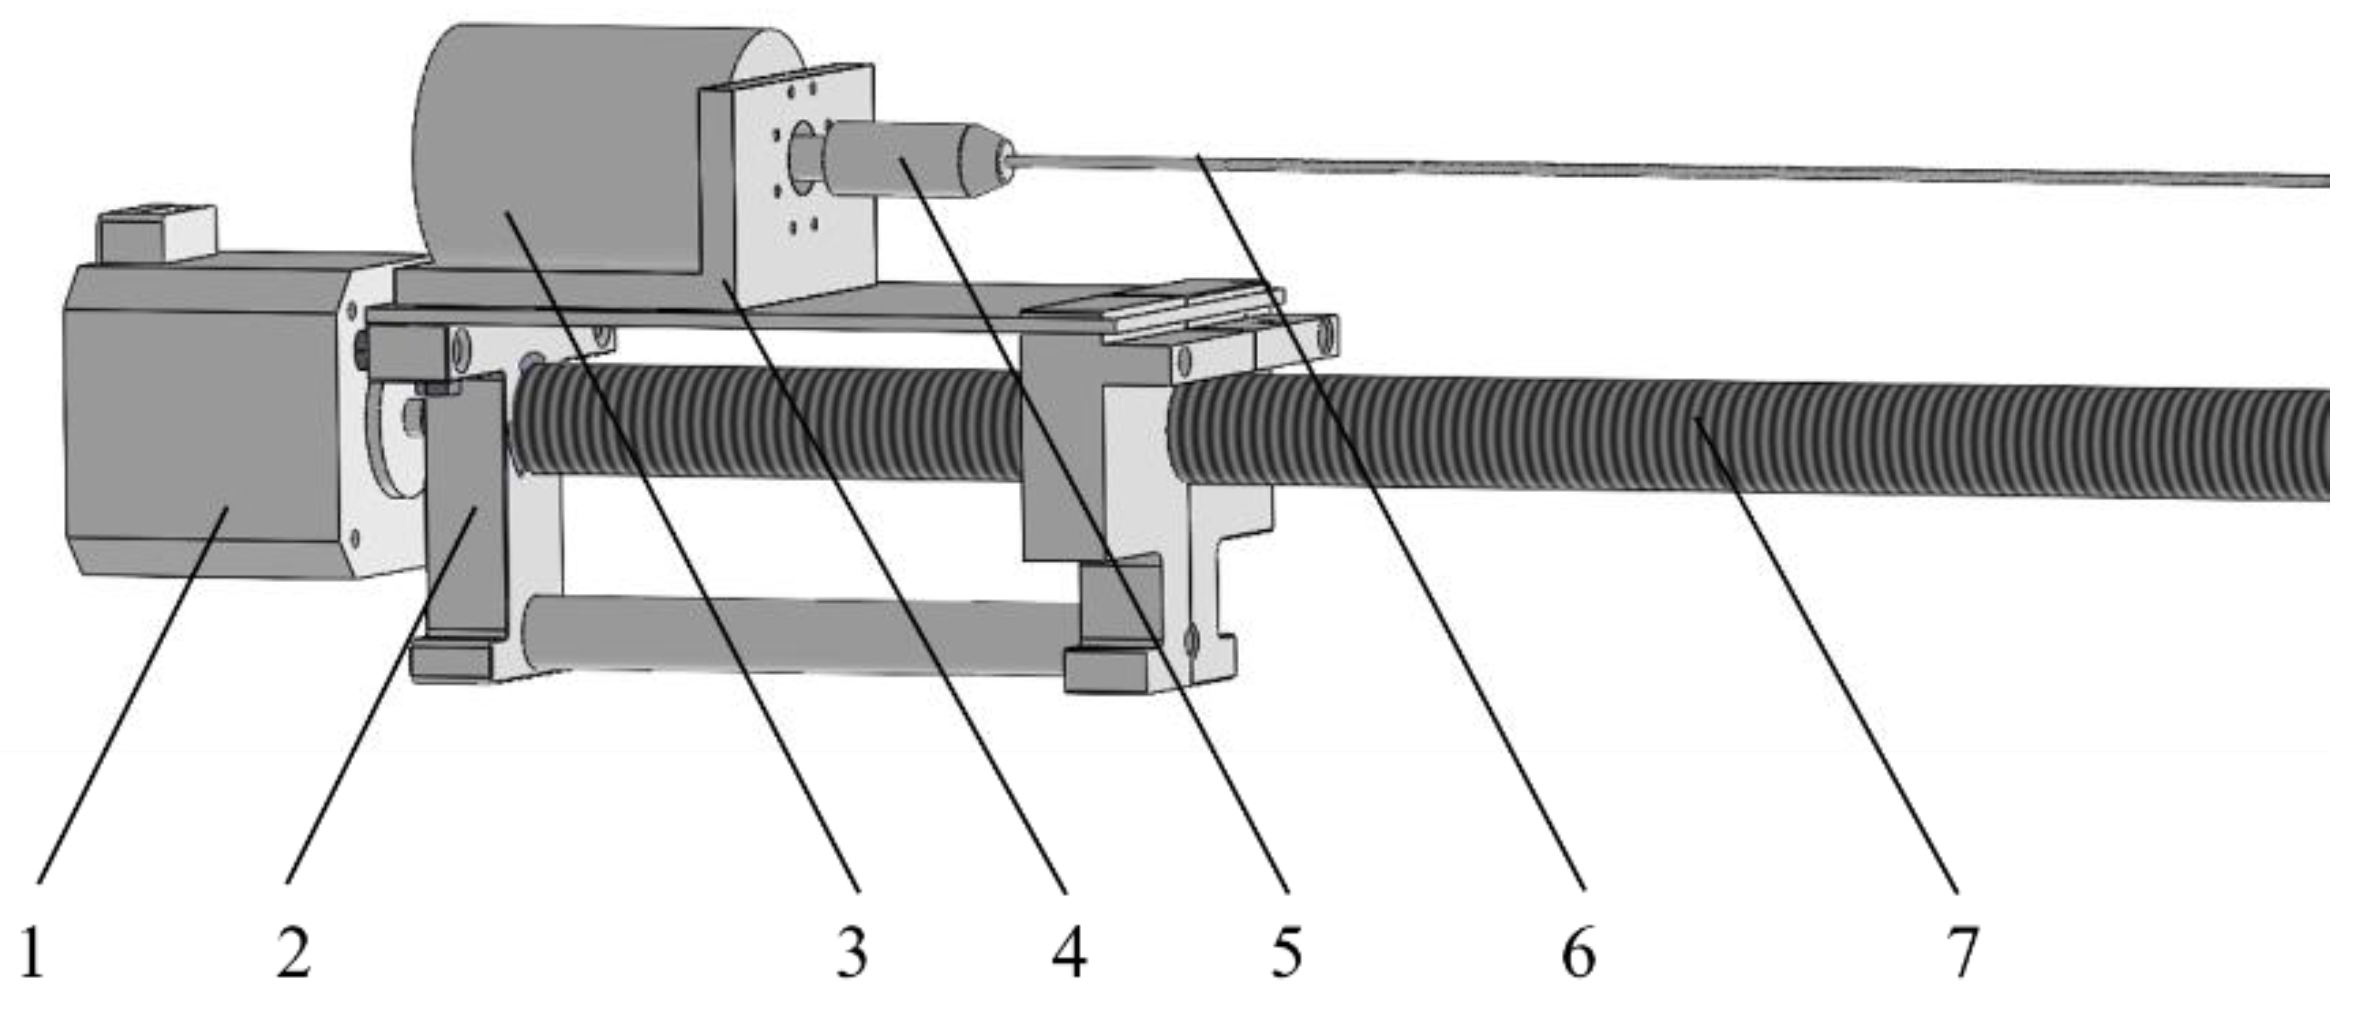
Figure 6.
The dual-motor transmission structure. (1. Stepper motor; 2. Sliding base; 3. DC motor; 4. Motor base; 5. Drill clip; 6. Micro-drill; 7. Lead screw).
The DC motor drives the micro-drill to rotate at high speed. The stepping motor drives the forward and backward of the micro-drill. The maximum diameter of the micro-drill is 3 mm. The operator points the equipment at the tree trunk and then uses the button to send instructions and detect tree rings.
3.3.2. Hardware Circuit
To compare the difference in detection results between the digital and the analog micro-drilling resistance methods, a special hardware circuit with both detection methods is designed for the experiment. The special hardware circuit can output the detection results of digital and analog methods at the same time, effectively controlling the influence of irrelevant variables on the detection results.
The experimental hardware circuit is based on the hardware implementation of the digital micro-drilling resistance method, and an analog signal sampling module is added. The hardware architecture is shown in Figure 7.
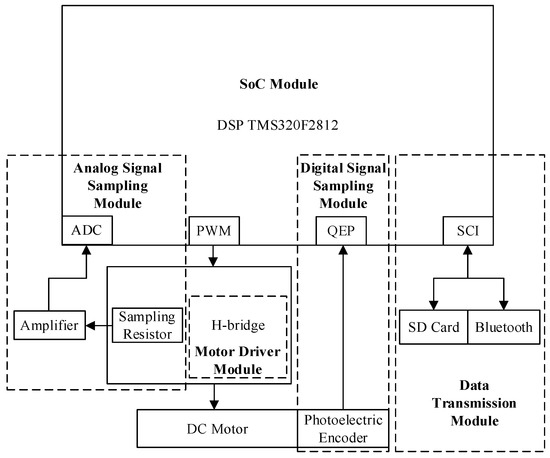
Figure 7.
The experimental hardware architecture.
To realize the output of analog detection results, a sampling resistor is added to the armature of the H-bridge motor driver circuit. The INA282 bi-directional current sense amplifier is connected to the sampling resistor. The amplified current signal is transmitted to the ADC pin of the DSP to obtain the detection result. During the detection process, the digital and analog detection circuits operate simultaneously. The analog results sampled by ADC and the digital results calculated by the photoelectric encoder are both stored in the SD card or sent out by SCI. In the detection, the analog and digital detection results are output simultaneously to ensure the consistency of the measurement object and the measurement environment, which reduces the interference of various uncontrollable factors and provides reliable hardware for the comparison experiments carried out in this research.
3.4. Experimental Sample
In this research, tree disk samples were used for the micro-drilling resistance method detection experiment to compare with the actual tree rings. The tree disk samples used in this experiment are sampled from the Jingouling Forest Farm in Wangqing County, Yanbian Prefecture, Jilin Province, China. The Jingouling Forest Farm is located in the upper reaches of the Tumen River on the northwest slope of the Changbai Mountains, located at E 130°5′ to 130°20′ and N 43°17′ to 43°25′, and the altitude spans from 550 m to 1100 m [58]. The forest vegetation in this area is stratified in the vertical direction. The climate in this region is affected by tropical marine air mass or degenerated marine air mass from May to August every year and is affected by Siberia continental air mass from October to March of the following year, and the seasonal climate cycle changes significantly. The growing season of trees is mainly concentrated in the summer, from July to September, when the temperature is suitable and the rainfall is sufficient. In winter, there is a freezing period of more than 4.5 months. This makes the growth rate of plants in the area cyclically change, so tree rings generally grow one ring per year.
In the experiment, Larch and Fir tree discs from Jingouling Forest Farm were selected as samples. Larch (Larix gmelinii (Rupr.) Kuzen) is a deciduous tree of the Pinaceae and Larix genus. Larch is the main forest species in Northeast China, widely used for afforestation and forest regeneration, as well as for various wood and industrial materials. The density of the tree rings changes sharply in the earlywood and latewood, making the growth rings clearly visible, the wood grain is straight, and the structure is thicker, which makes it easy to identify the tree rings. Fir (Abies nephrolepis (Trautv.) Maxim.) is a Pinaceae and Abies genus tree with strong adaptability and a preference for cold and wet environments. The density difference between the earlywood and latewood of Fir is smaller than that of Larch, which requires higher detection accuracy.
4. Results
In the experiment, Larch and Fir discs are detected 4 times using the above-mentioned experimental equipment, which can complete the detection of the digital method and the analog method simultaneously. The information of the experimental discs is shown in Table 2, and the detection results of Larch SN. 29-1043-52471 and Fir SN. 30-1013-34894 are selected to show the analysis process.
Table 2.
The information of the experimental discs.
4.1. Original Detection Results
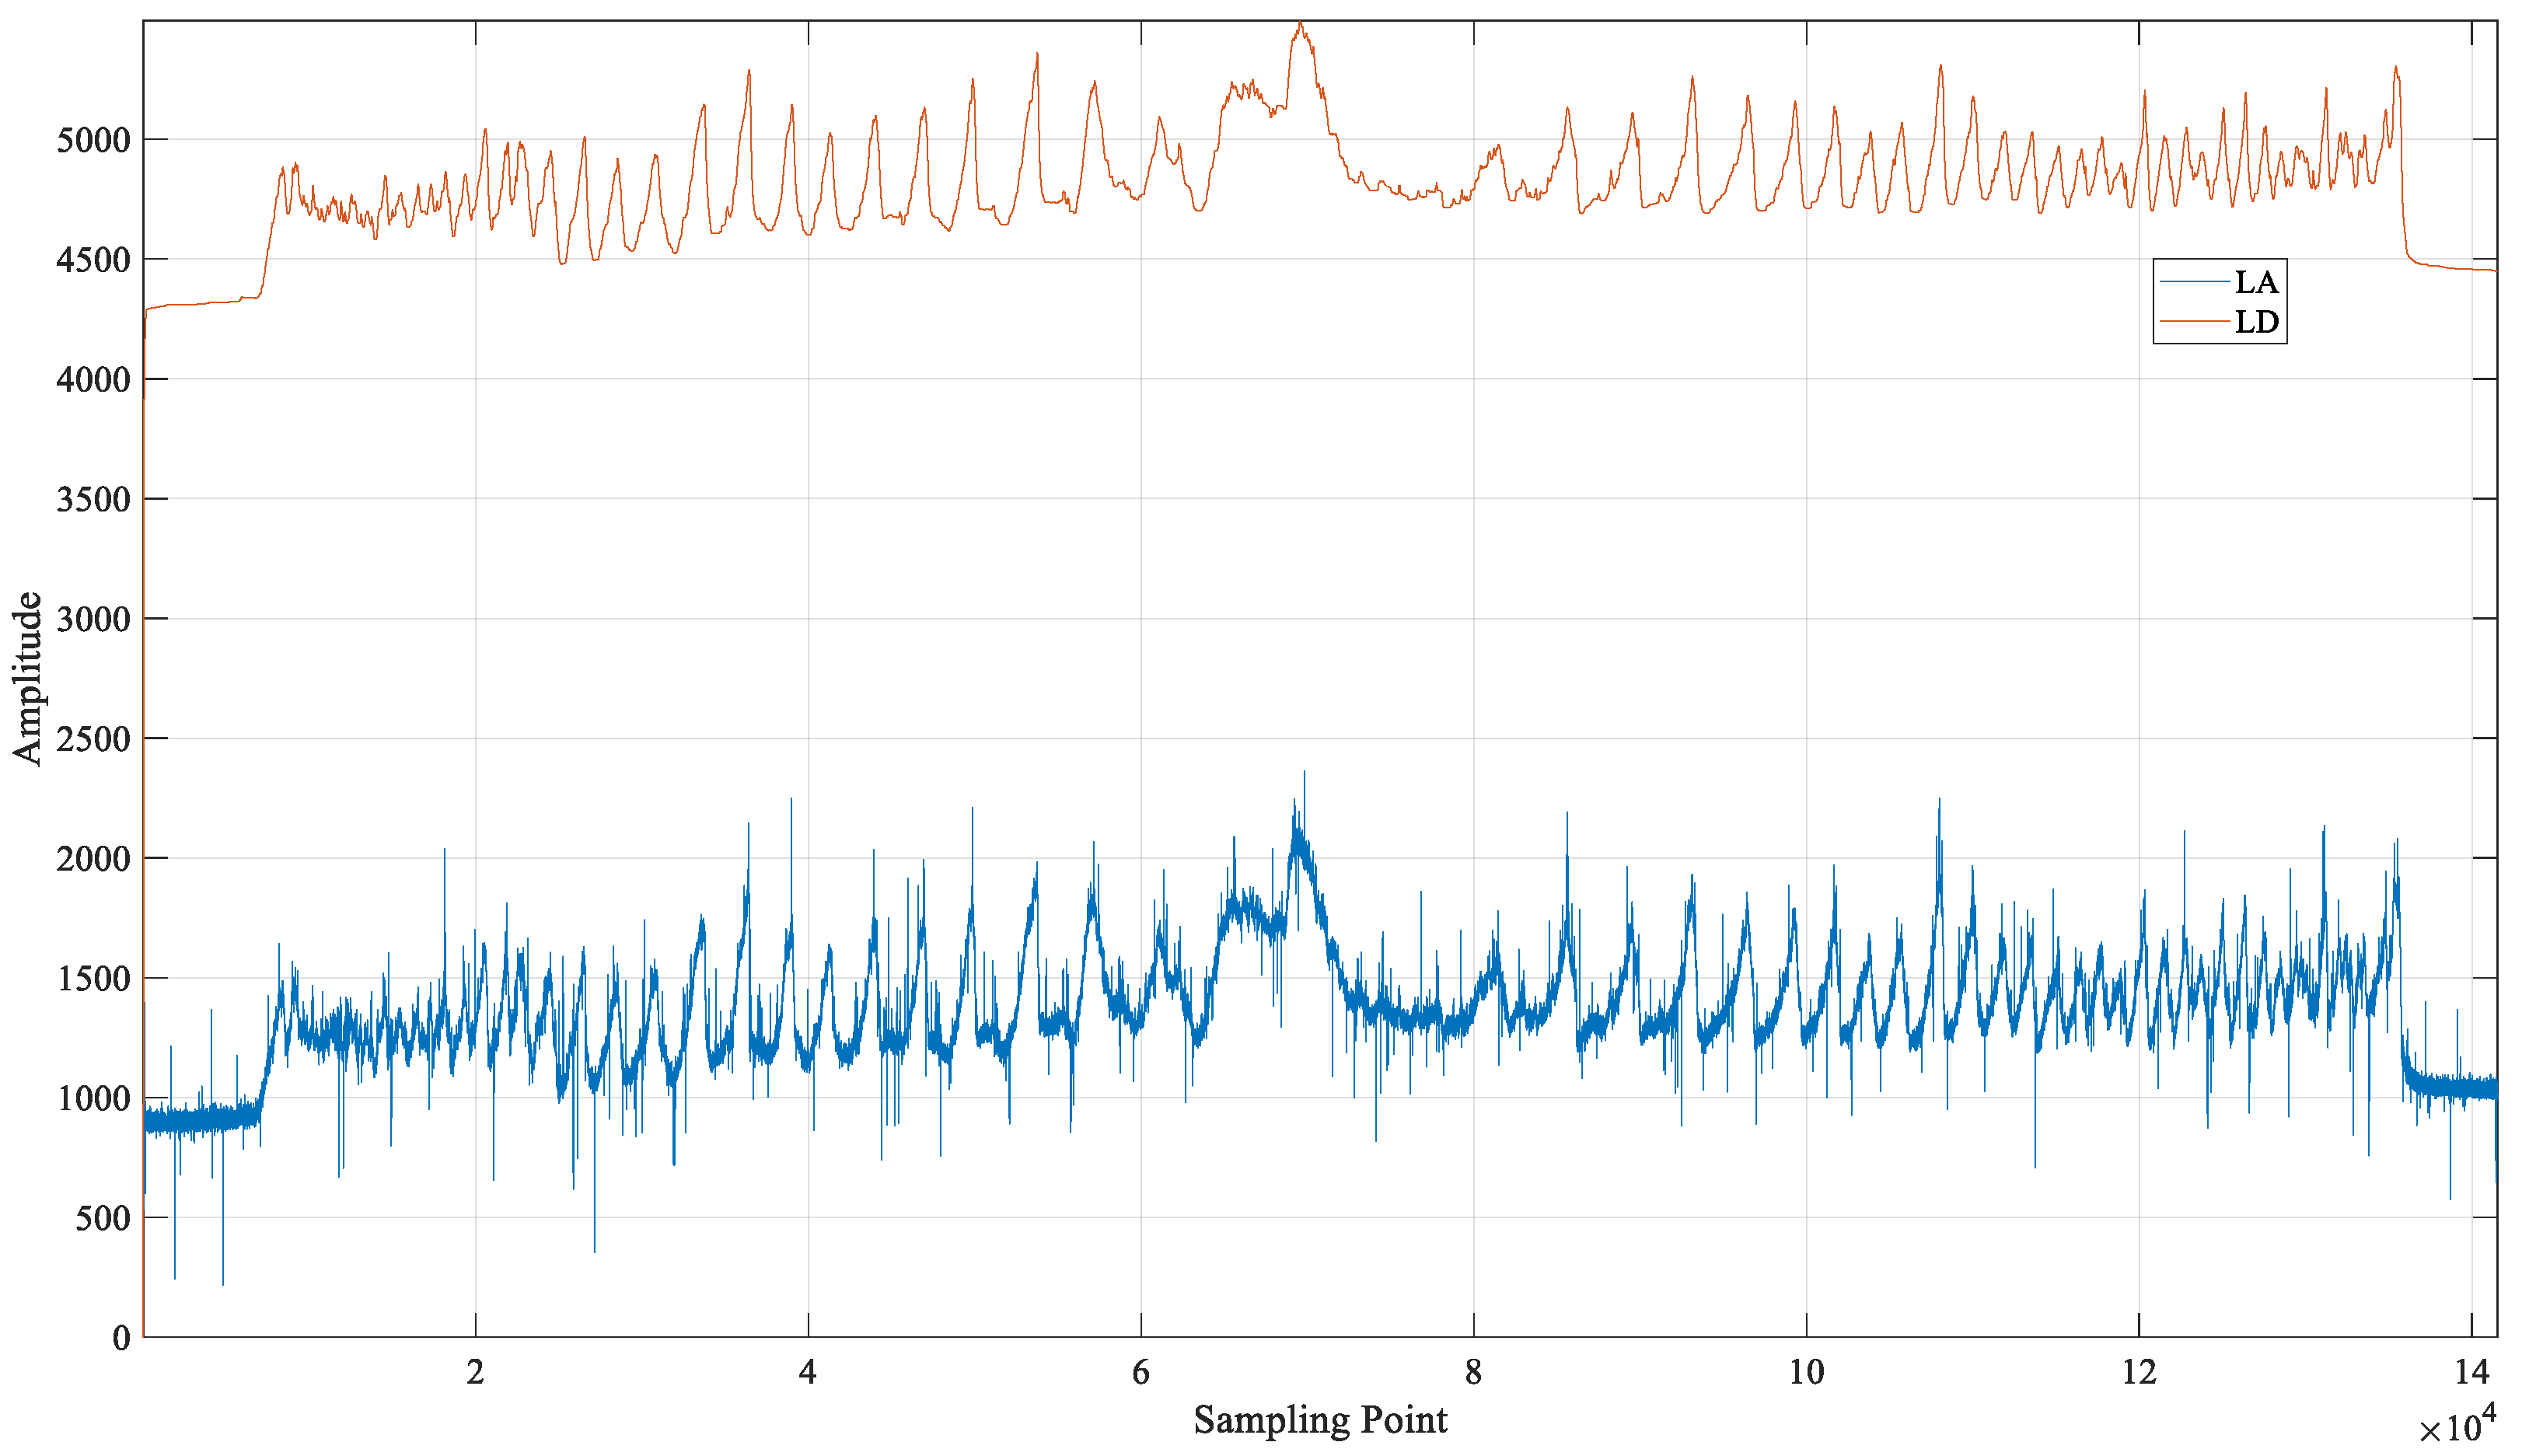
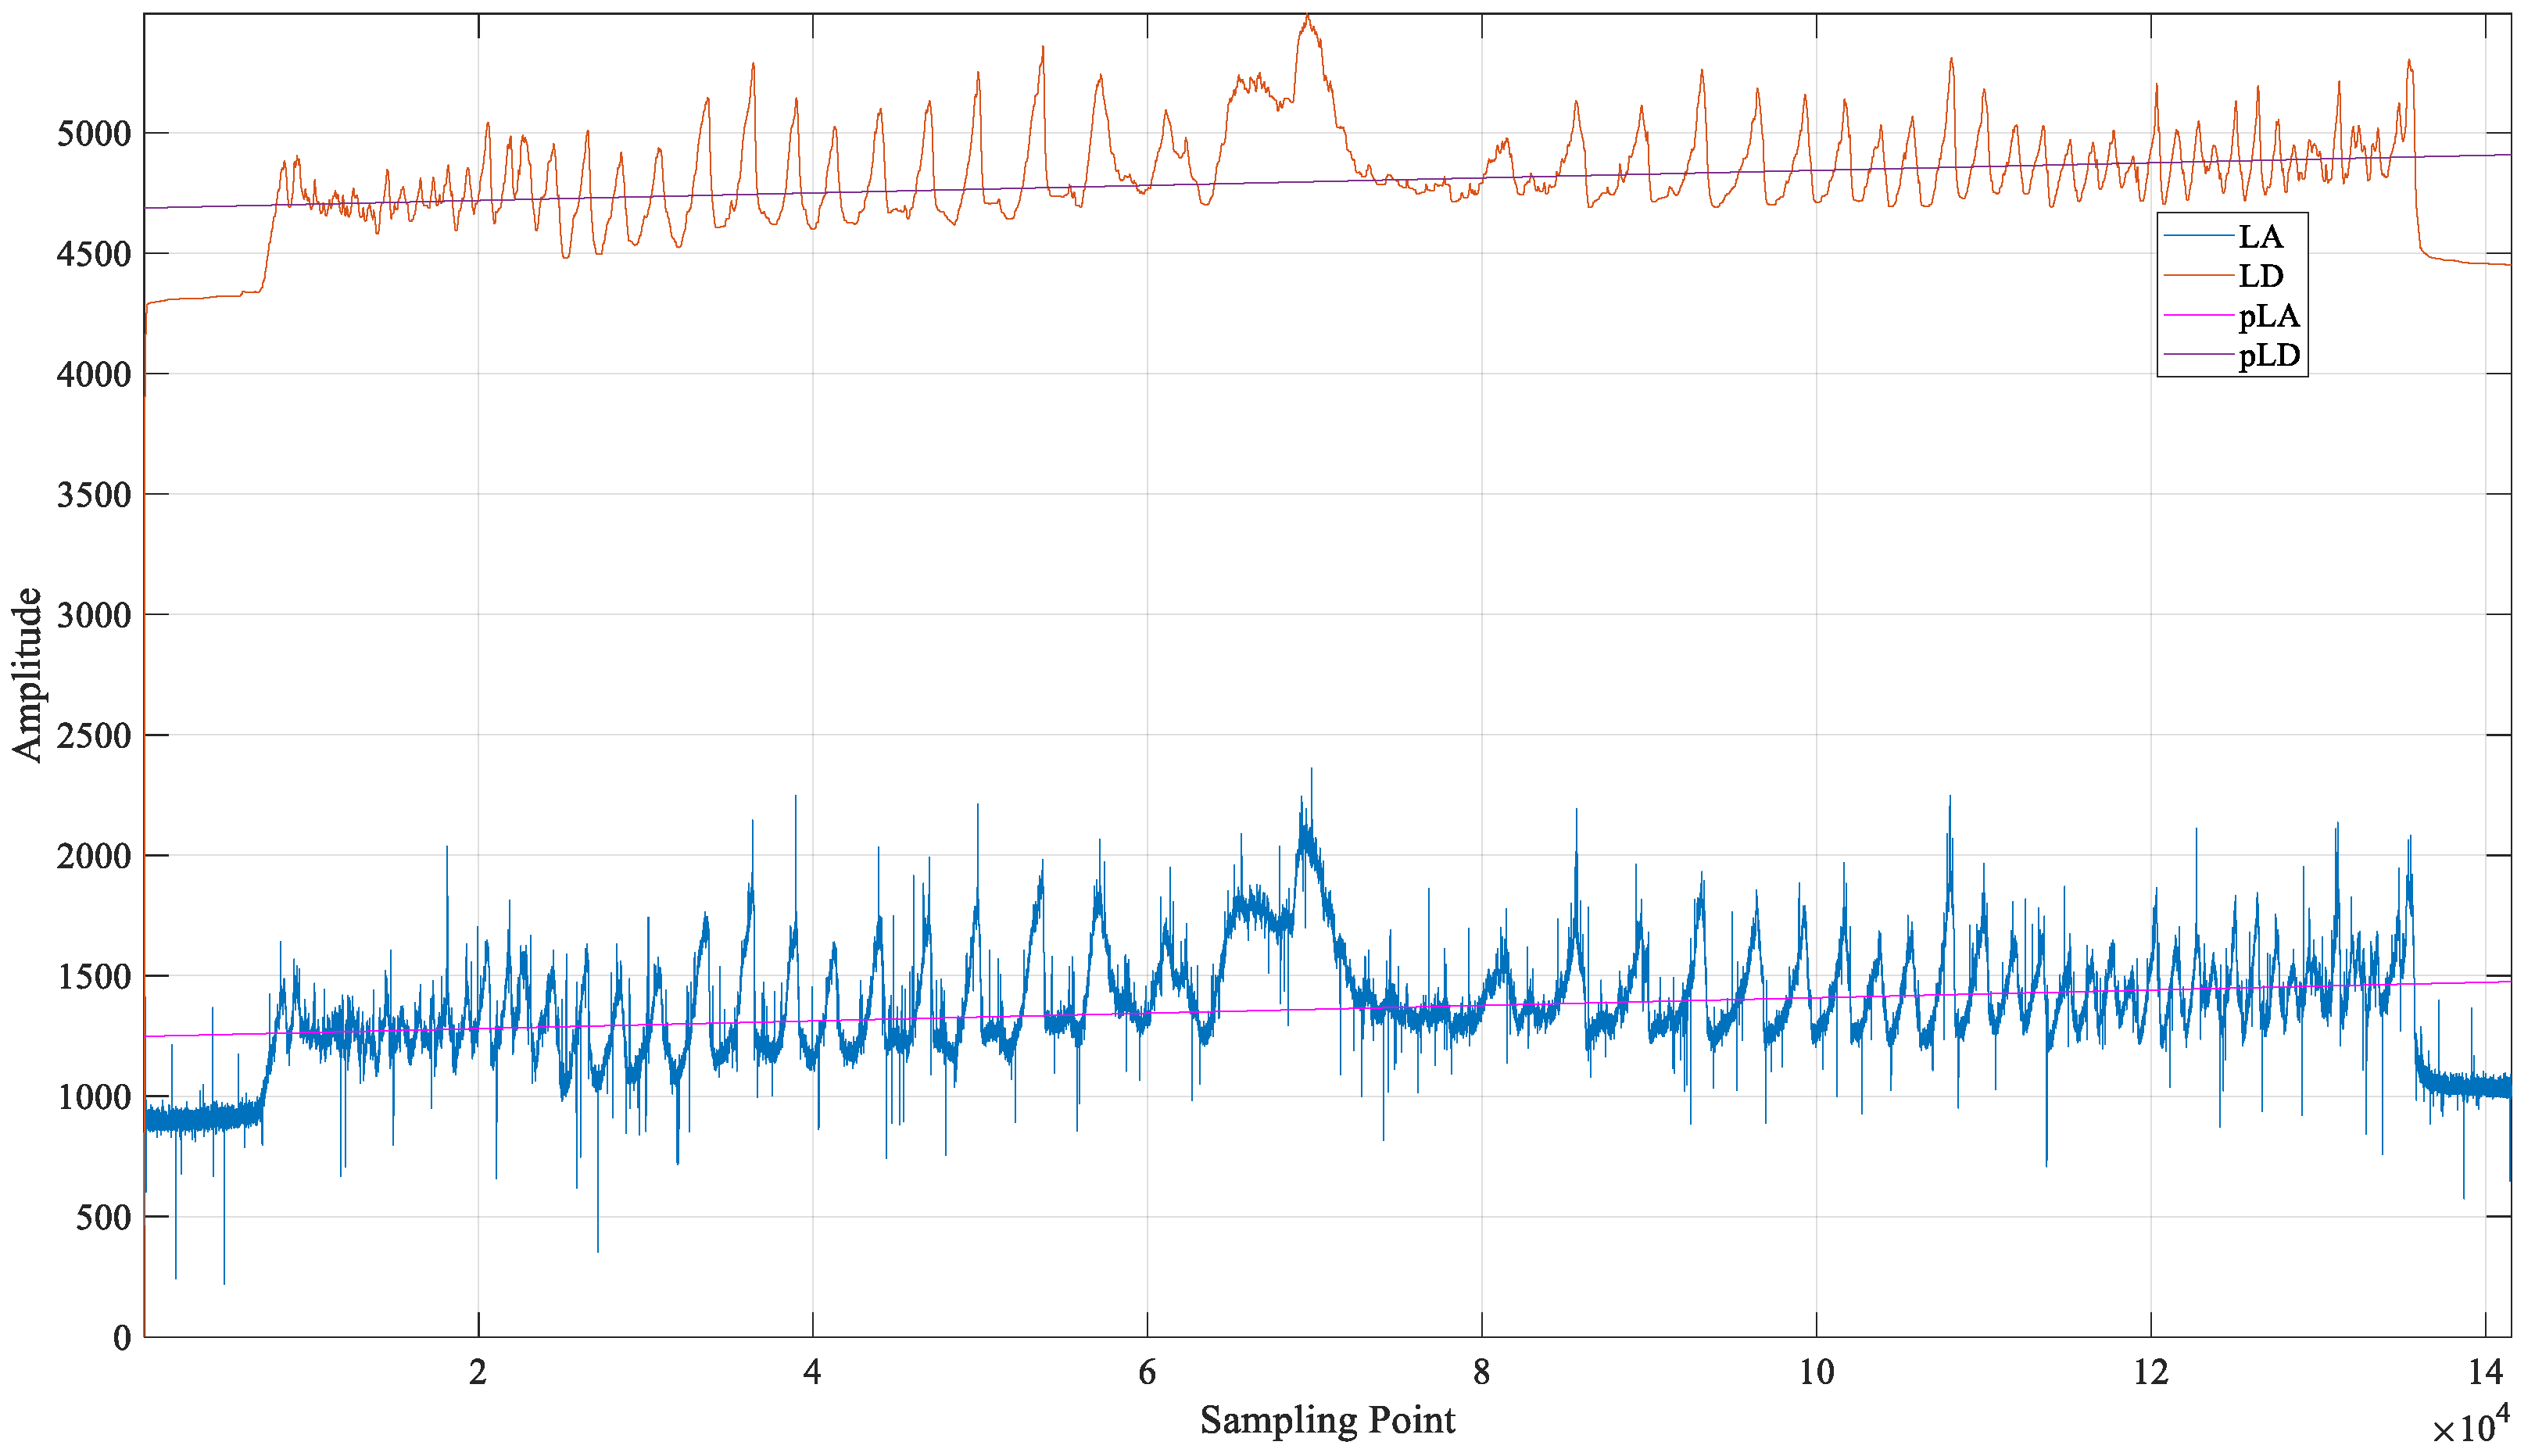
Figure 8 shows the waveforms of the original detection results for the digital and analog outputs of the Larch disc (SN. 29-1043-52471). LD refers to the detection result of the Larch disc, shown in red. LA refers to the detection result of the Larch disc, shown in blue. Figure 9 shows the waveforms of the original detection results of the digital and analog outputs of the Fir disc (SN. 30-1013-34894). FD refers to the detection result of the Fir disc, shown in red. FA refers to the detection result of the Fir disc, shown in blue.
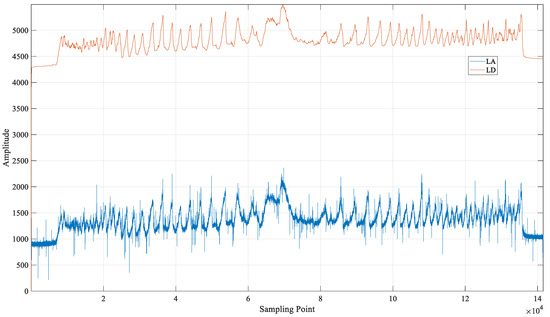
Figure 8.
The waveforms of the original detection results for the digital and analog outputs of the Larch disc (SN. 29-1043-52471).
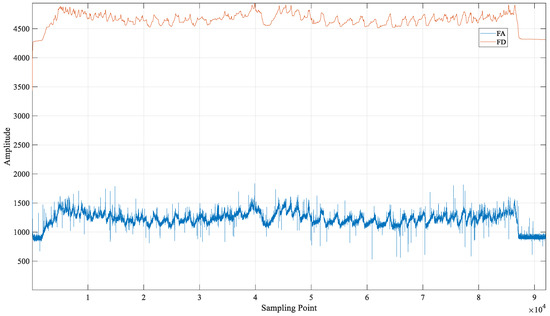
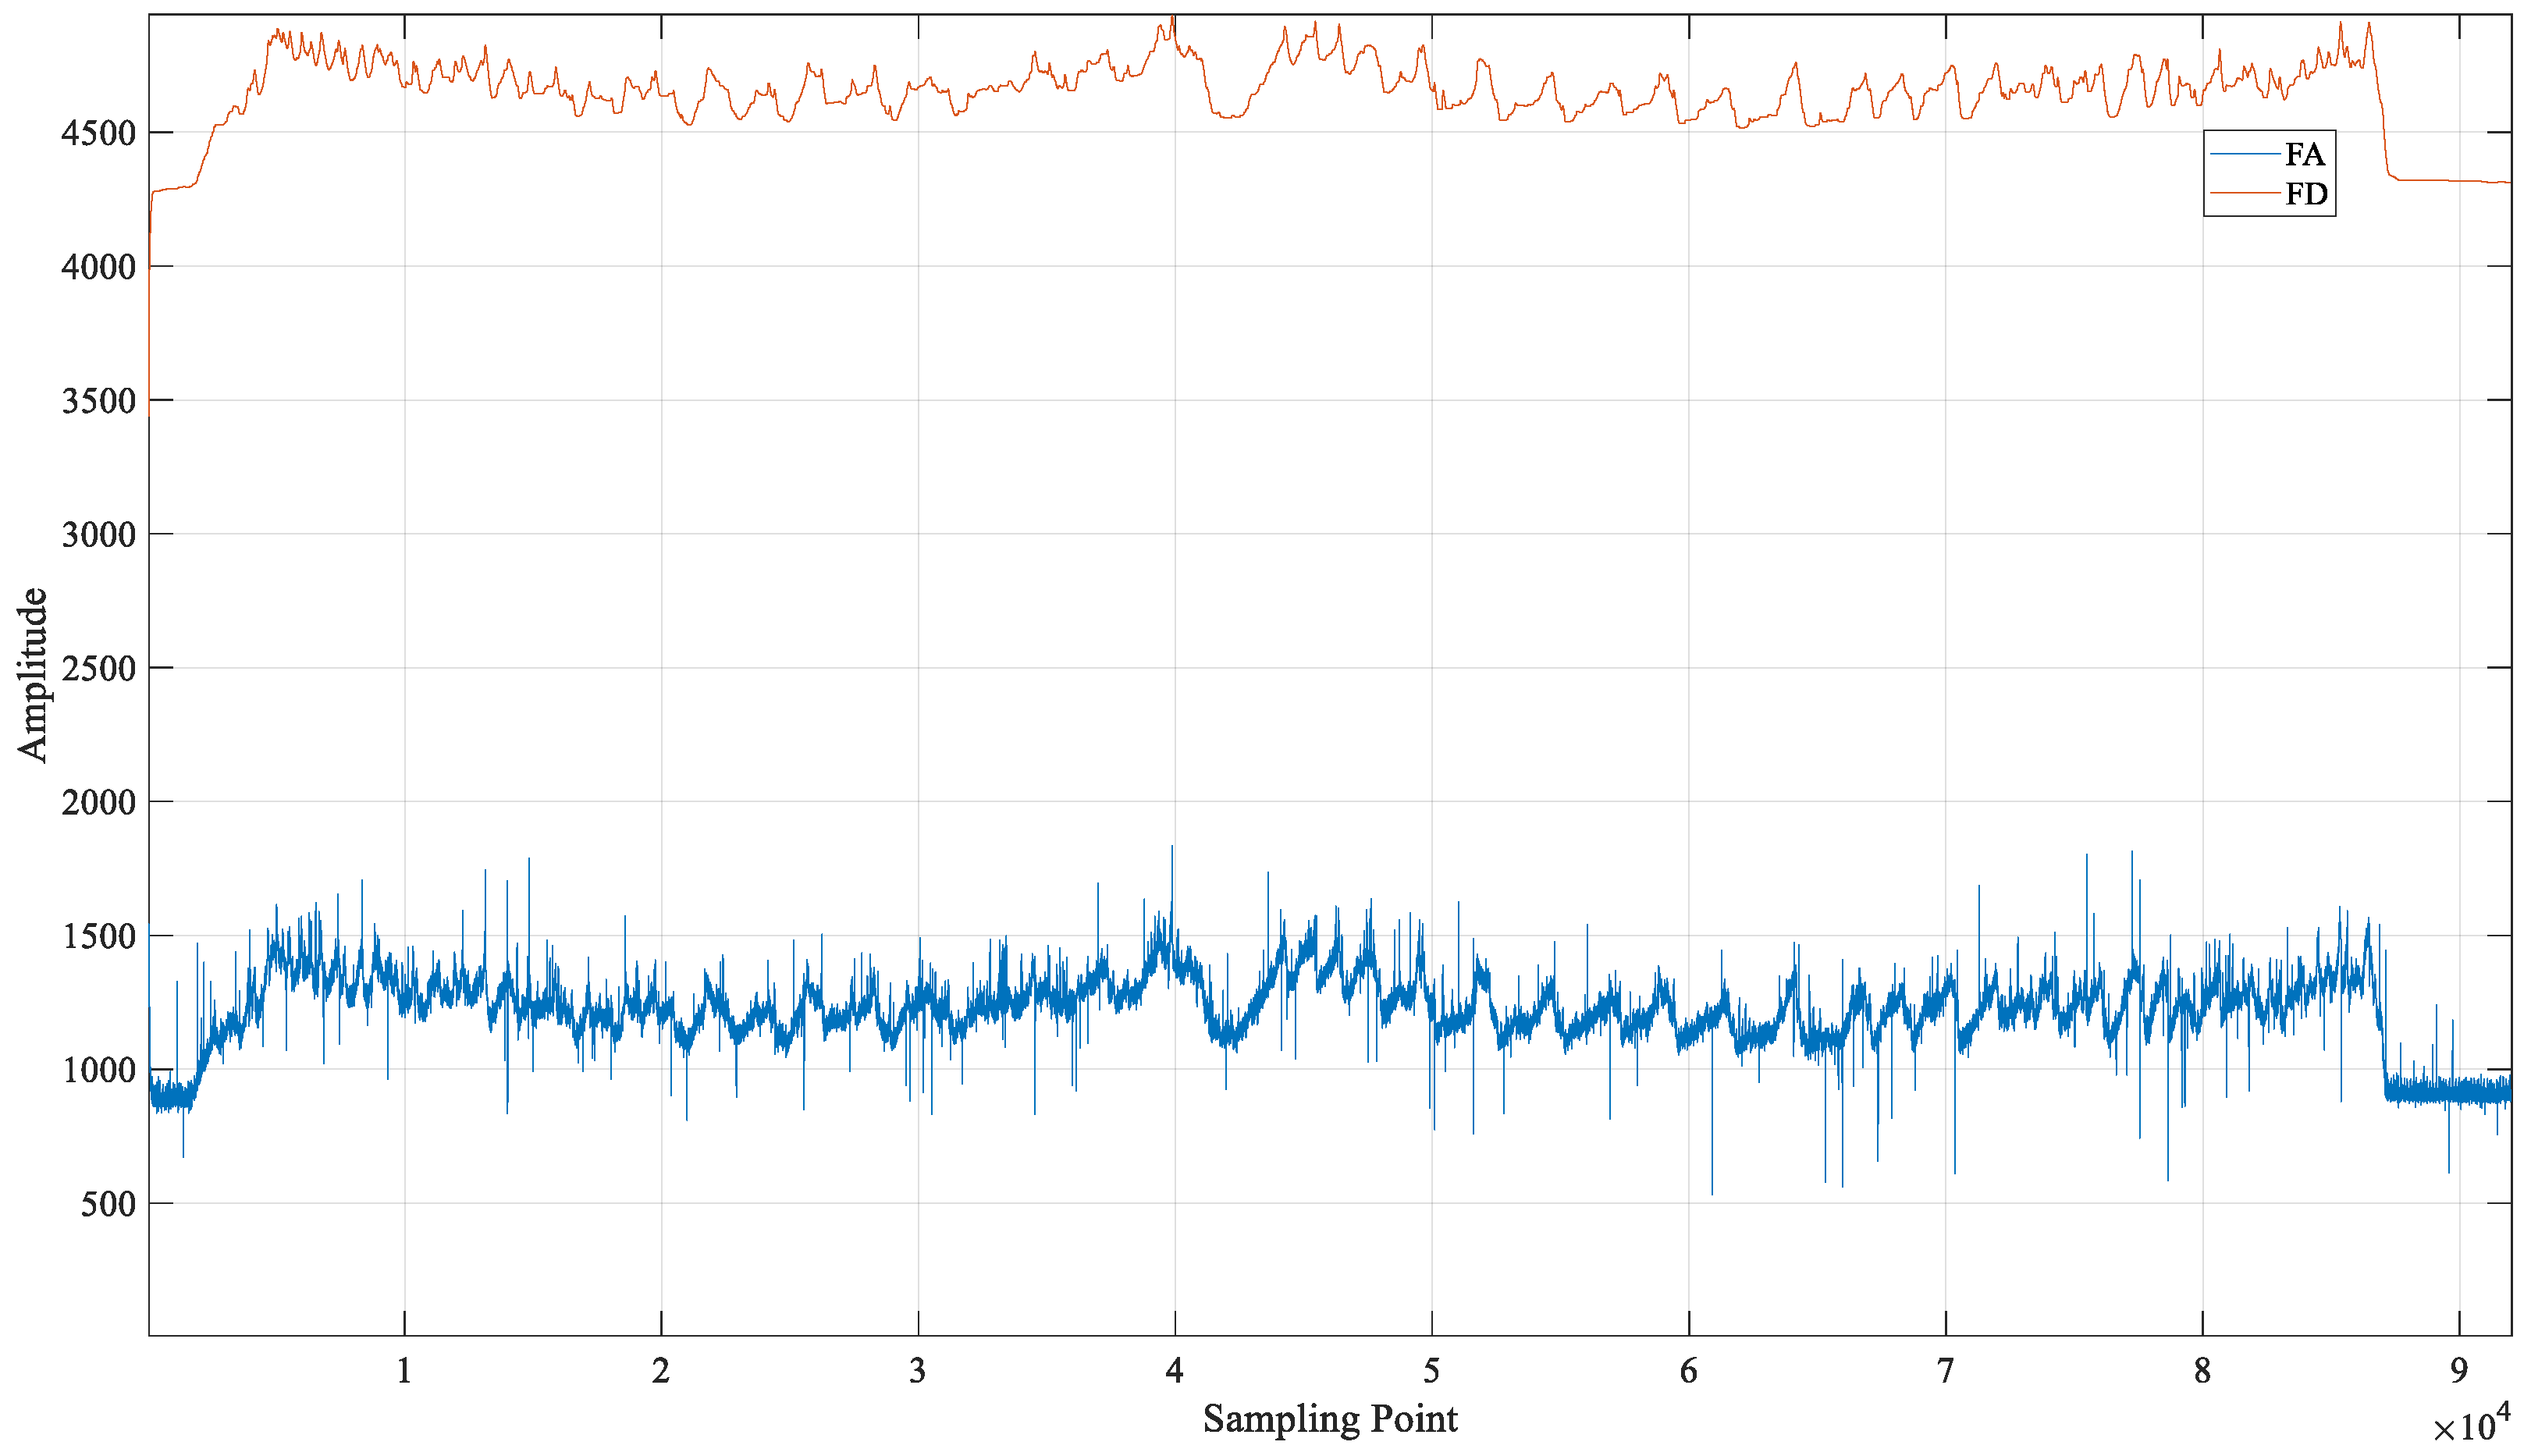
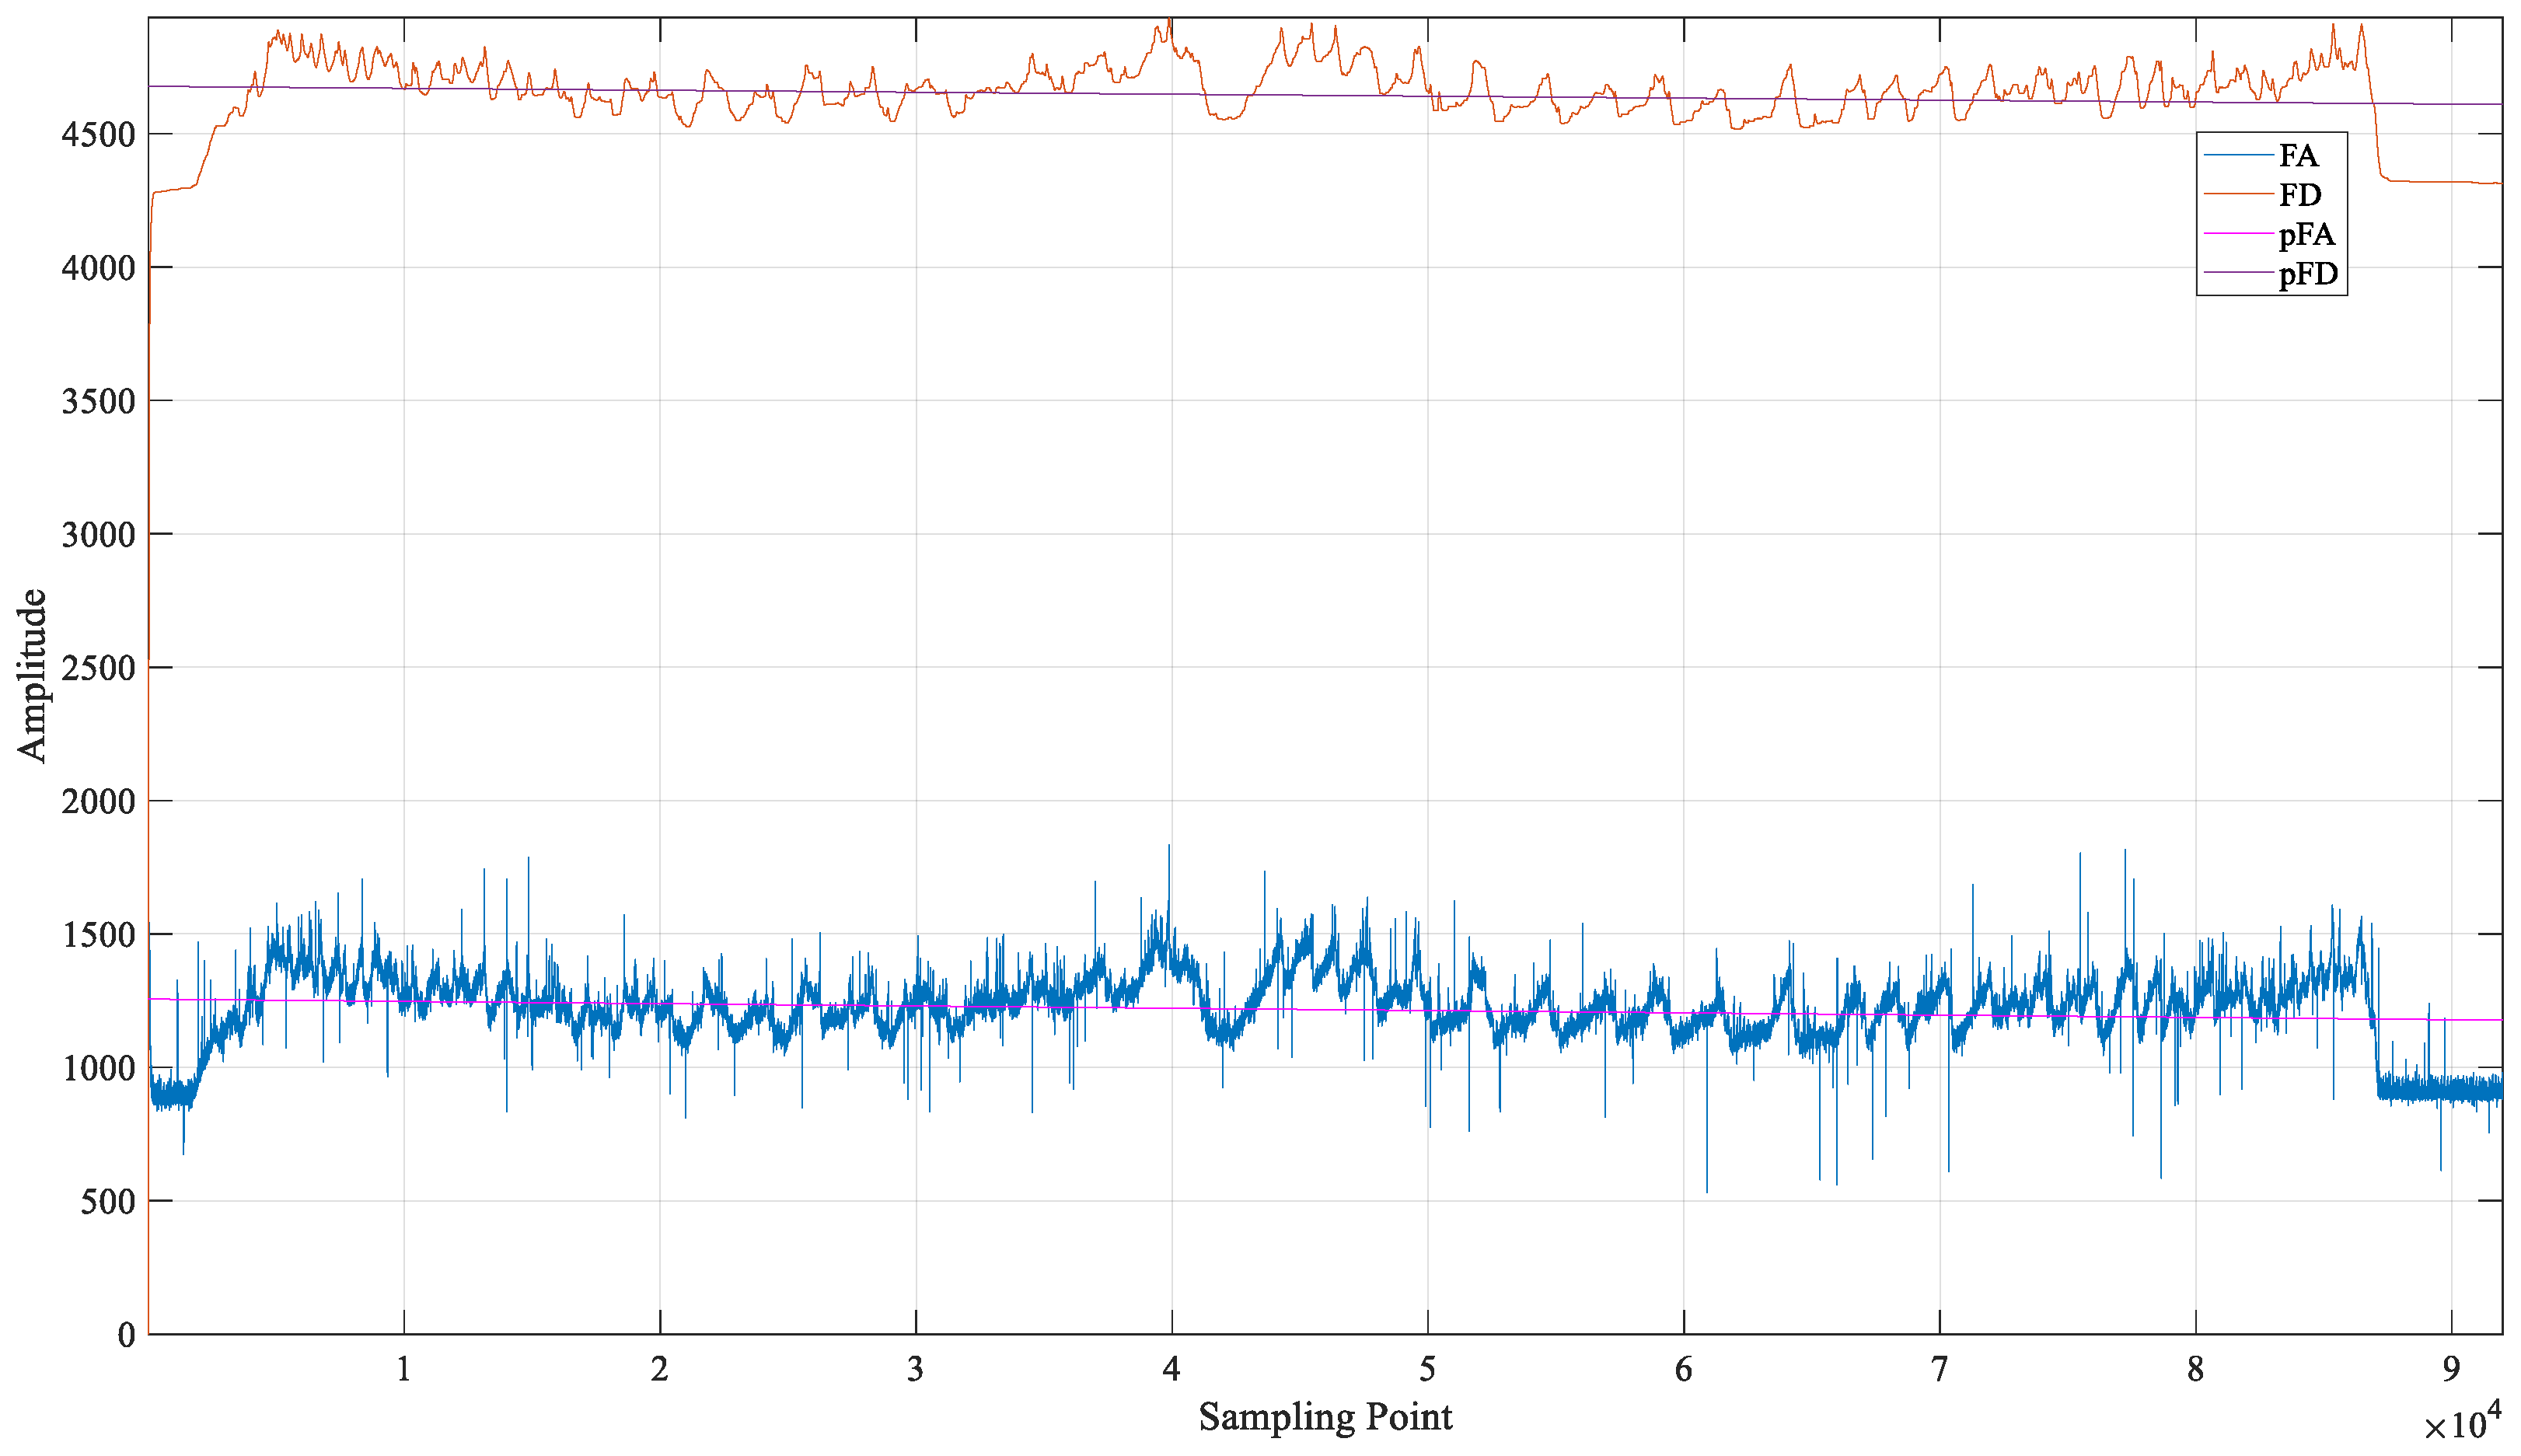
Figure 9.
The waveforms of the original detection results of the digital and analog outputs of the Fir disc (SN. 30-1013-34894).
Figure 9 shows the waveforms of the original detection results of the digital and analog outputs of the Fir disc (SN. 30-1013-34894). FD refers to the detection result of the Fir disc, shown in red. FA refers to the detection result of the Fir disc, shown in blue.
4.2. Result of Preprocessing and Correlation Analysis
It can be seen from the original signal waveforms of Figure 8 and Figure 9 that the digital and analog methods obtain the same number of sampling points, indicating the two detection methods are running simultaneously during the experiment. However, the amplitudes of the detection results obtained by the two methods are not the same because of the different sampling methods, which have different physical meanings. According to the analysis of the formula, the detection results of the digital method and the analog method are both proportional to the tree ring resistance. Therefore, this research attempts to convert the amplitudes of the digital and analog detection results to the same benchmark through preprocessing. If the detection results converted to the same benchmark have the same characteristics, the consistency of the two test results and the correctness of the digital method can be proved. The operation of preprocessing is as follows.
The detection signal is first fitted linearly using the least squares method. The fitted target polynomial is shown in Equation (17):
: 1th-degree coefficient; : constant coefficient.
and can be calculated by Equation (18):
The fitted polynomial of LD () is:
The fitted polynomial of LA () is:
Figure 10 shows the digital and analog original signals and the fitted polynomial waveforms of Larch.
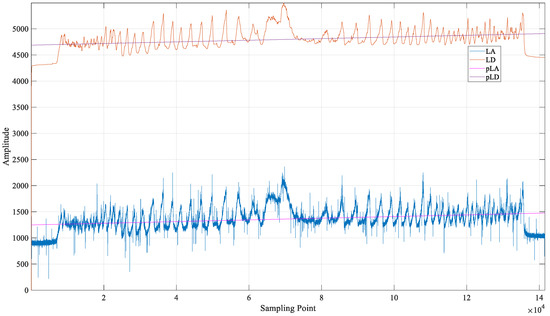
Figure 10.
The digital and analog original signals and the fitted polynomial waveforms of Larch (SN. 29-1043-52471).
The fitted polynomial of FD () is:
The fitted polynomial of FA () is:
Figure 11 shows the digital and analog original signals and the fitted polynomial waveforms of Fir.
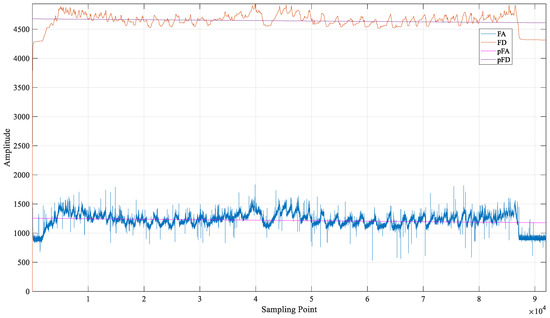
Figure 11.
The digital and analog original signals and the fitted polynomial waveforms of Fir (SN. 30-1013-34894).
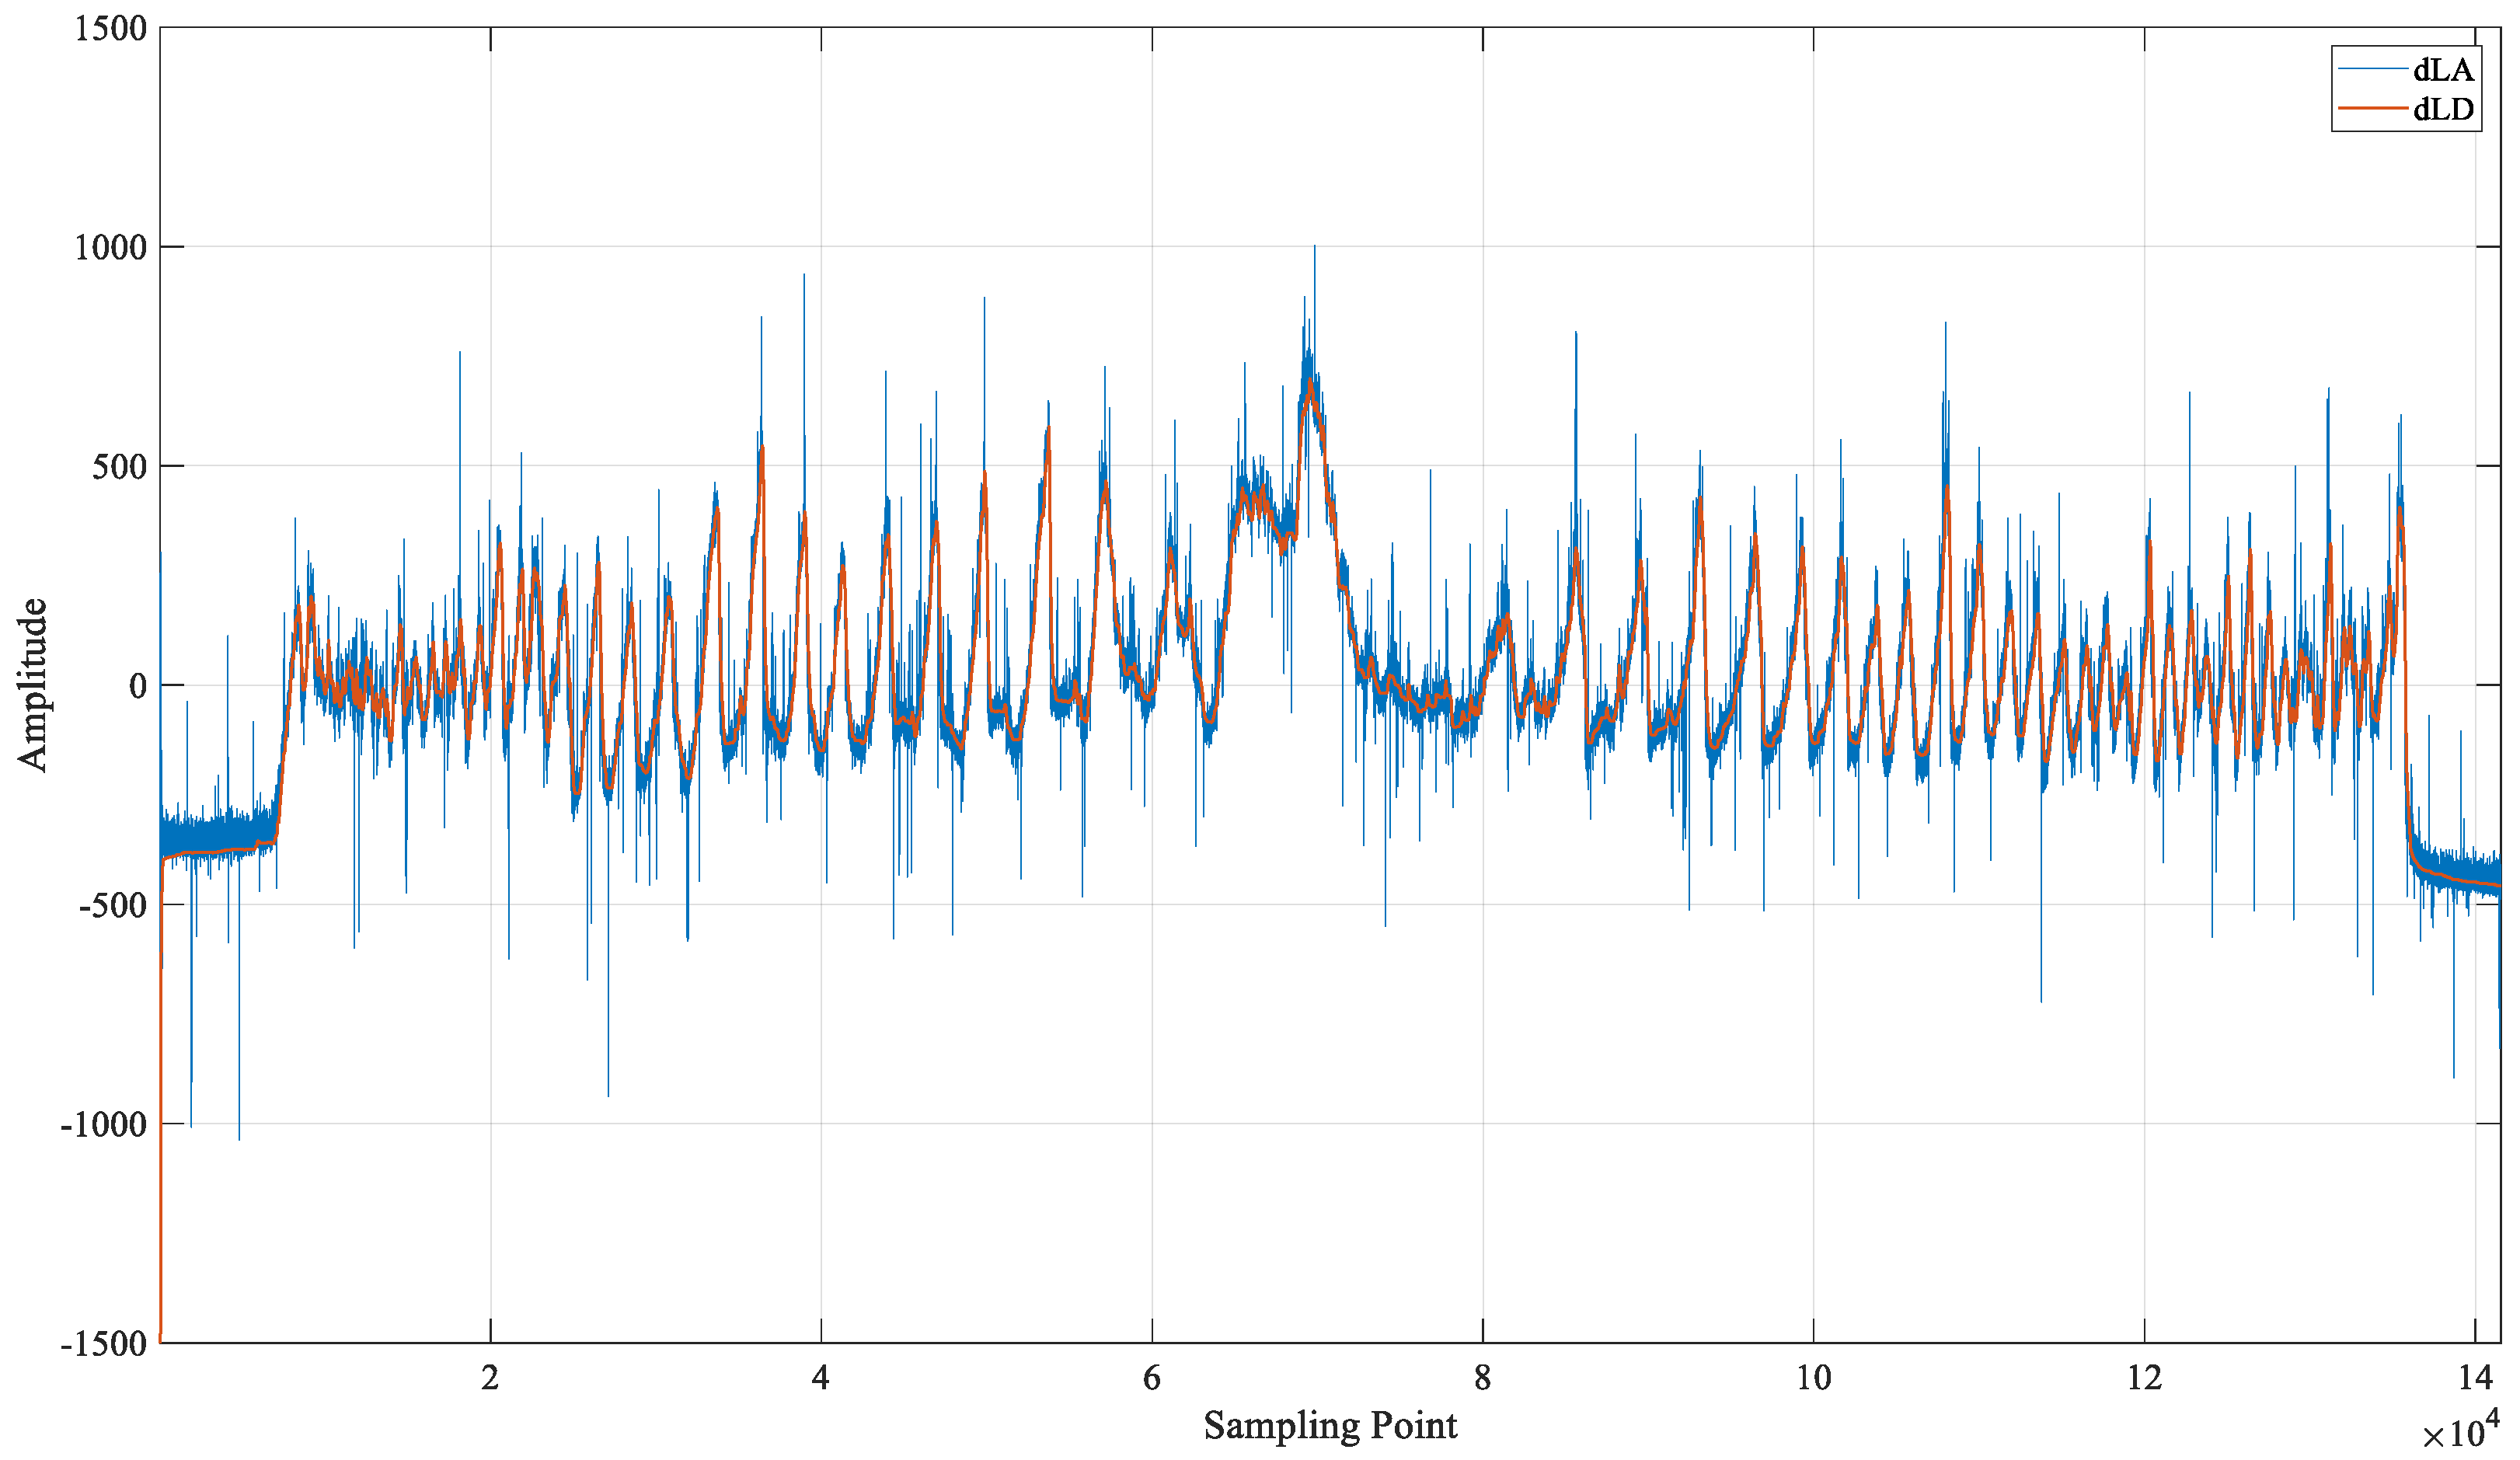
Subtract the fitted polynomial from the original signal to get the detrended detection signals shown in Figure 12 and Figure 13.
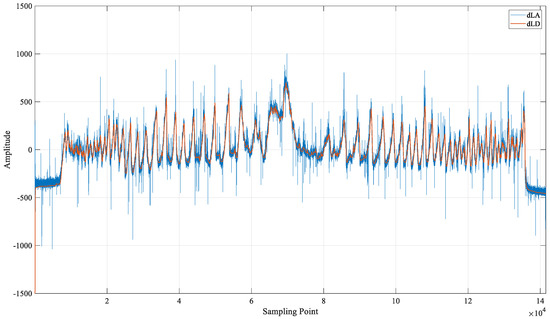
Figure 12.
The detrended Larch digital (dLD) detection result waveform and detrended Larch analog (dLA) detection result waveform (SN. 29-1043-52471).
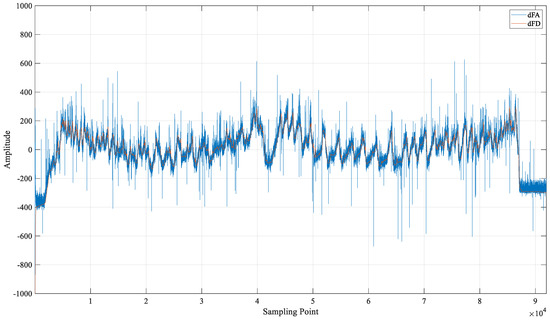
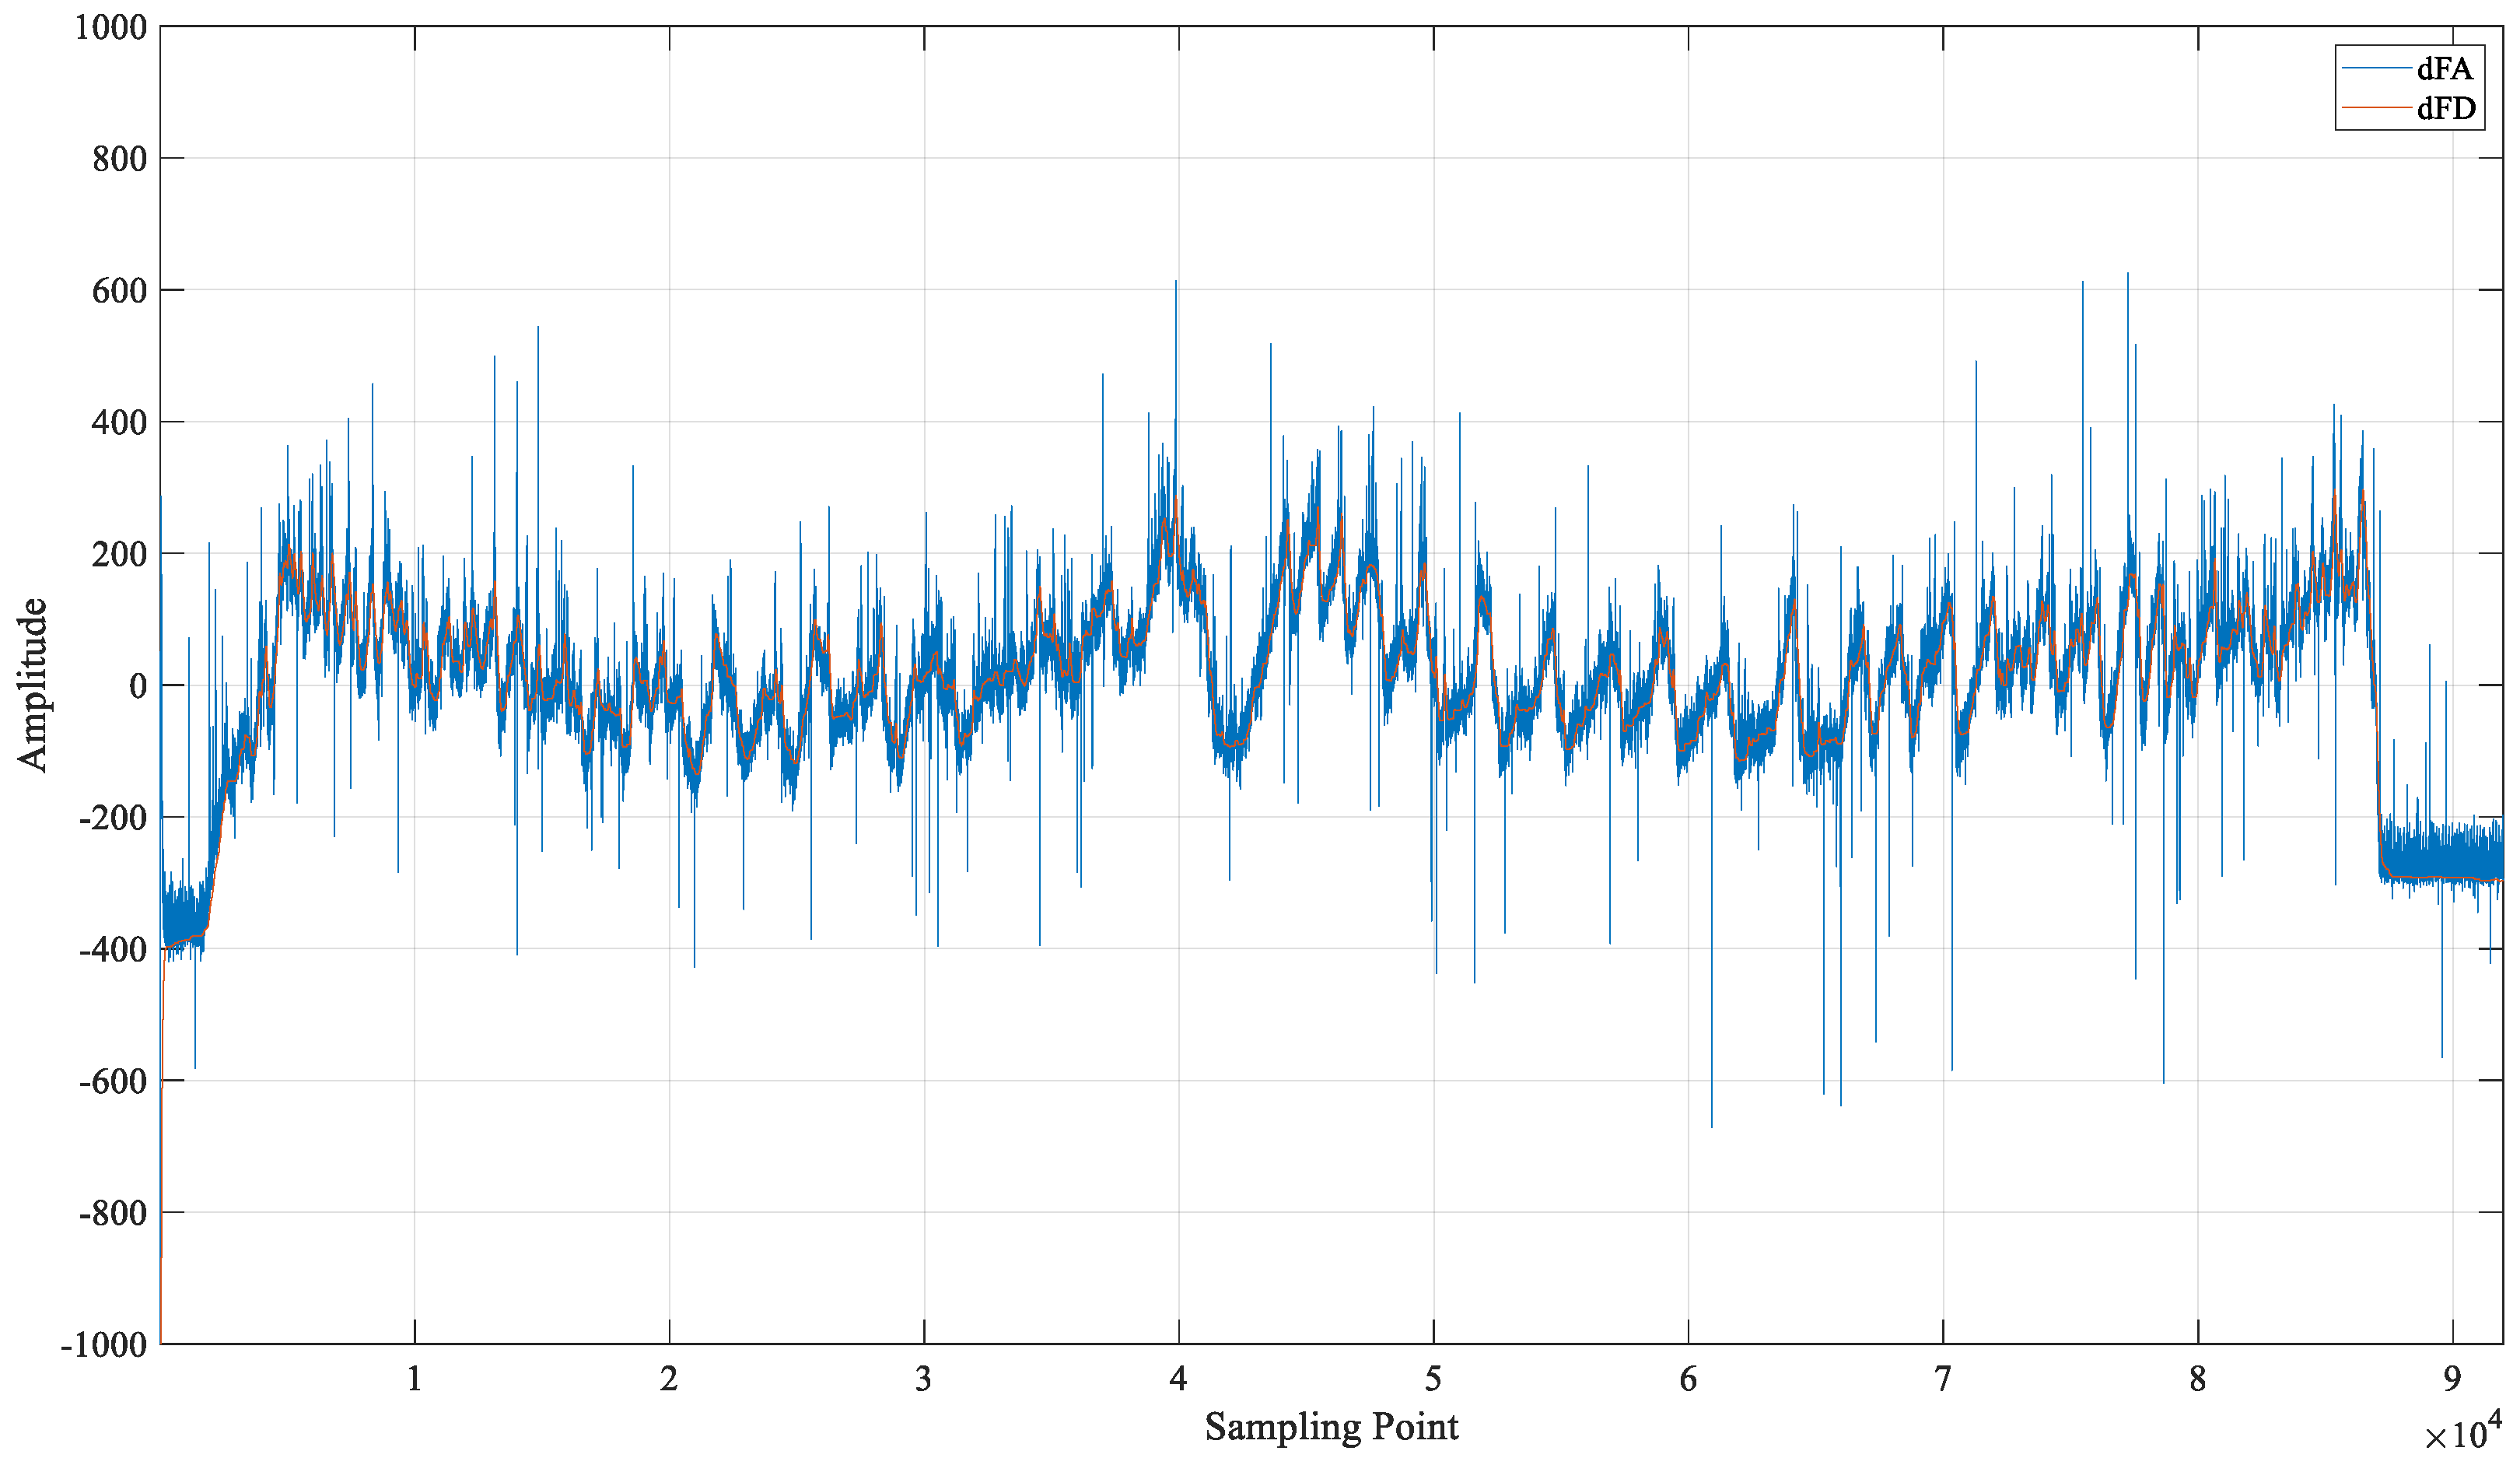
Figure 13.
The detrended Fir digital (dFD) detection result waveform and detrended Fir analog (dFA) detection result waveform (SN. 30-1013-34894).
The amplitude and trend of the detrended digital detection results and the detrended analog detection results are very similar. However, it is still difficult to intuitively determine their consistency due to the large amount of interference contained in the detrended analog detection results.
To determine the consistency of the two detection results, a correlation coefficient was introduced for quantitative analysis [59]. The correlation coefficient is defined in Equation (23)
: covariance; : standard deviation; : digital detection result after detrending; : analog detection result after detrending.
The correlation coefficients of each sample are shown in Table 3.
Table 3.
The correlation coefficients and average correlation coefficients.
The value range of the correlation coefficient is between −1 to 1. Generally, when the correlation coefficient is greater than 0.9, the two signals can be considered to have a strong positive correlation. The correlation coefficients of the two detection results shown in Table 3 are all greater than 0.9, and the average correlation coefficient of Larch is 0.9413, the average correlation coefficient of Fir is 0.9317, and the overall average is 0.9365. Therefore, the detection results of the digital method and the analog method have a strong correlation, and it can be considered that the detection results output by the two methods are consistent. Based on the above correlation analysis, it can be proved that the detection results of the digital method have the same correctness as the analog method.
4.3. Power Spectrum Analysis and SNR
In the time domain, the digital micro-drilling resistance detection signal is obviously clearer and easier to identify than the analog. The spectrum analysis can be performed on the signal so that it can be seen more intuitively that the digital signal contains less noise interference than the analog signal.
Normalize the power of the digital and the analog detection results according to Equation (24):
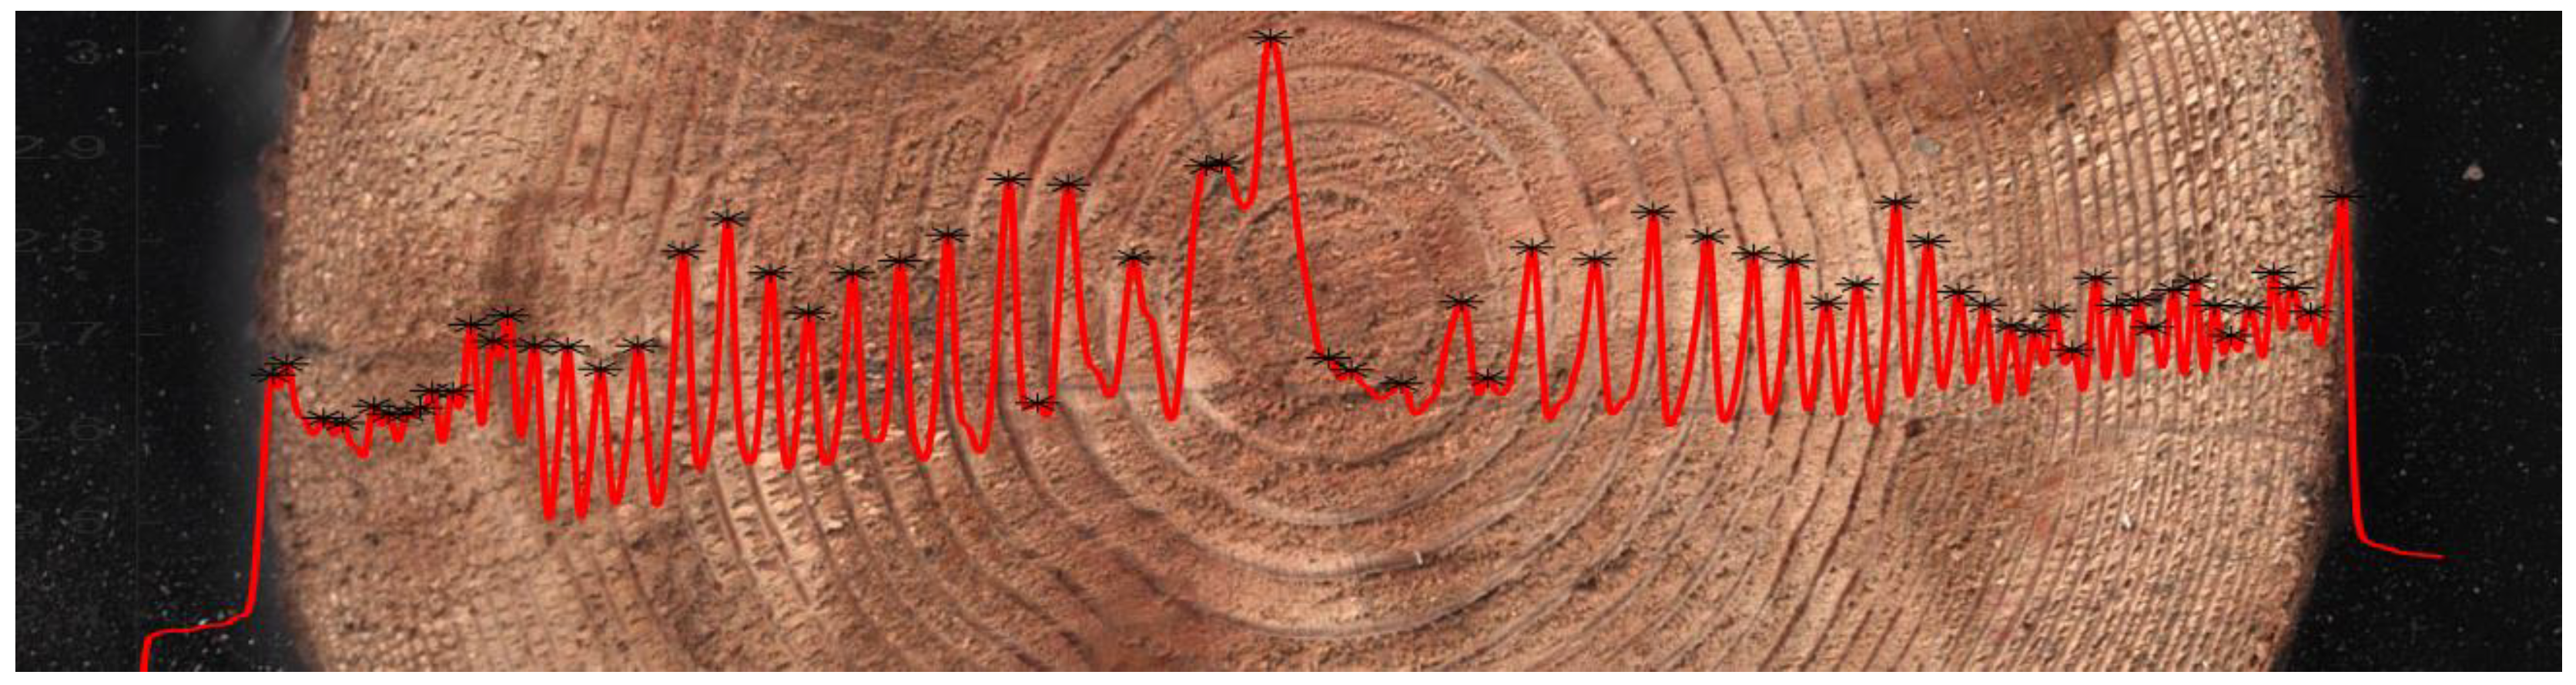
The power-normalized digital results are denoted as , and the power-normalized analog results are denoted as . The signal is obtained by filtering the power-normalized digital detection results using a Gaussian filter. Latewood points in the are marked with an asterisk by the identification algorithm. Taking the results of SN.29-1043-52471 as an example, its latewood marking points are shown in Figure 14.

Figure 14.
The tree ring latewood identification mark diagram based on the digital detection result after Gaussian filtering (SN. 29-1043-52471).
It can be seen from Figure 14 that the signal is clear and easy to identify, and the latewood points of the tree rings identified automatically by the algorithm have high accuracy and can correspond to the actual tree rings. Therefore, in this study, the is approximately regarded as a noise-free tree ring detection signal, called the desired signal.
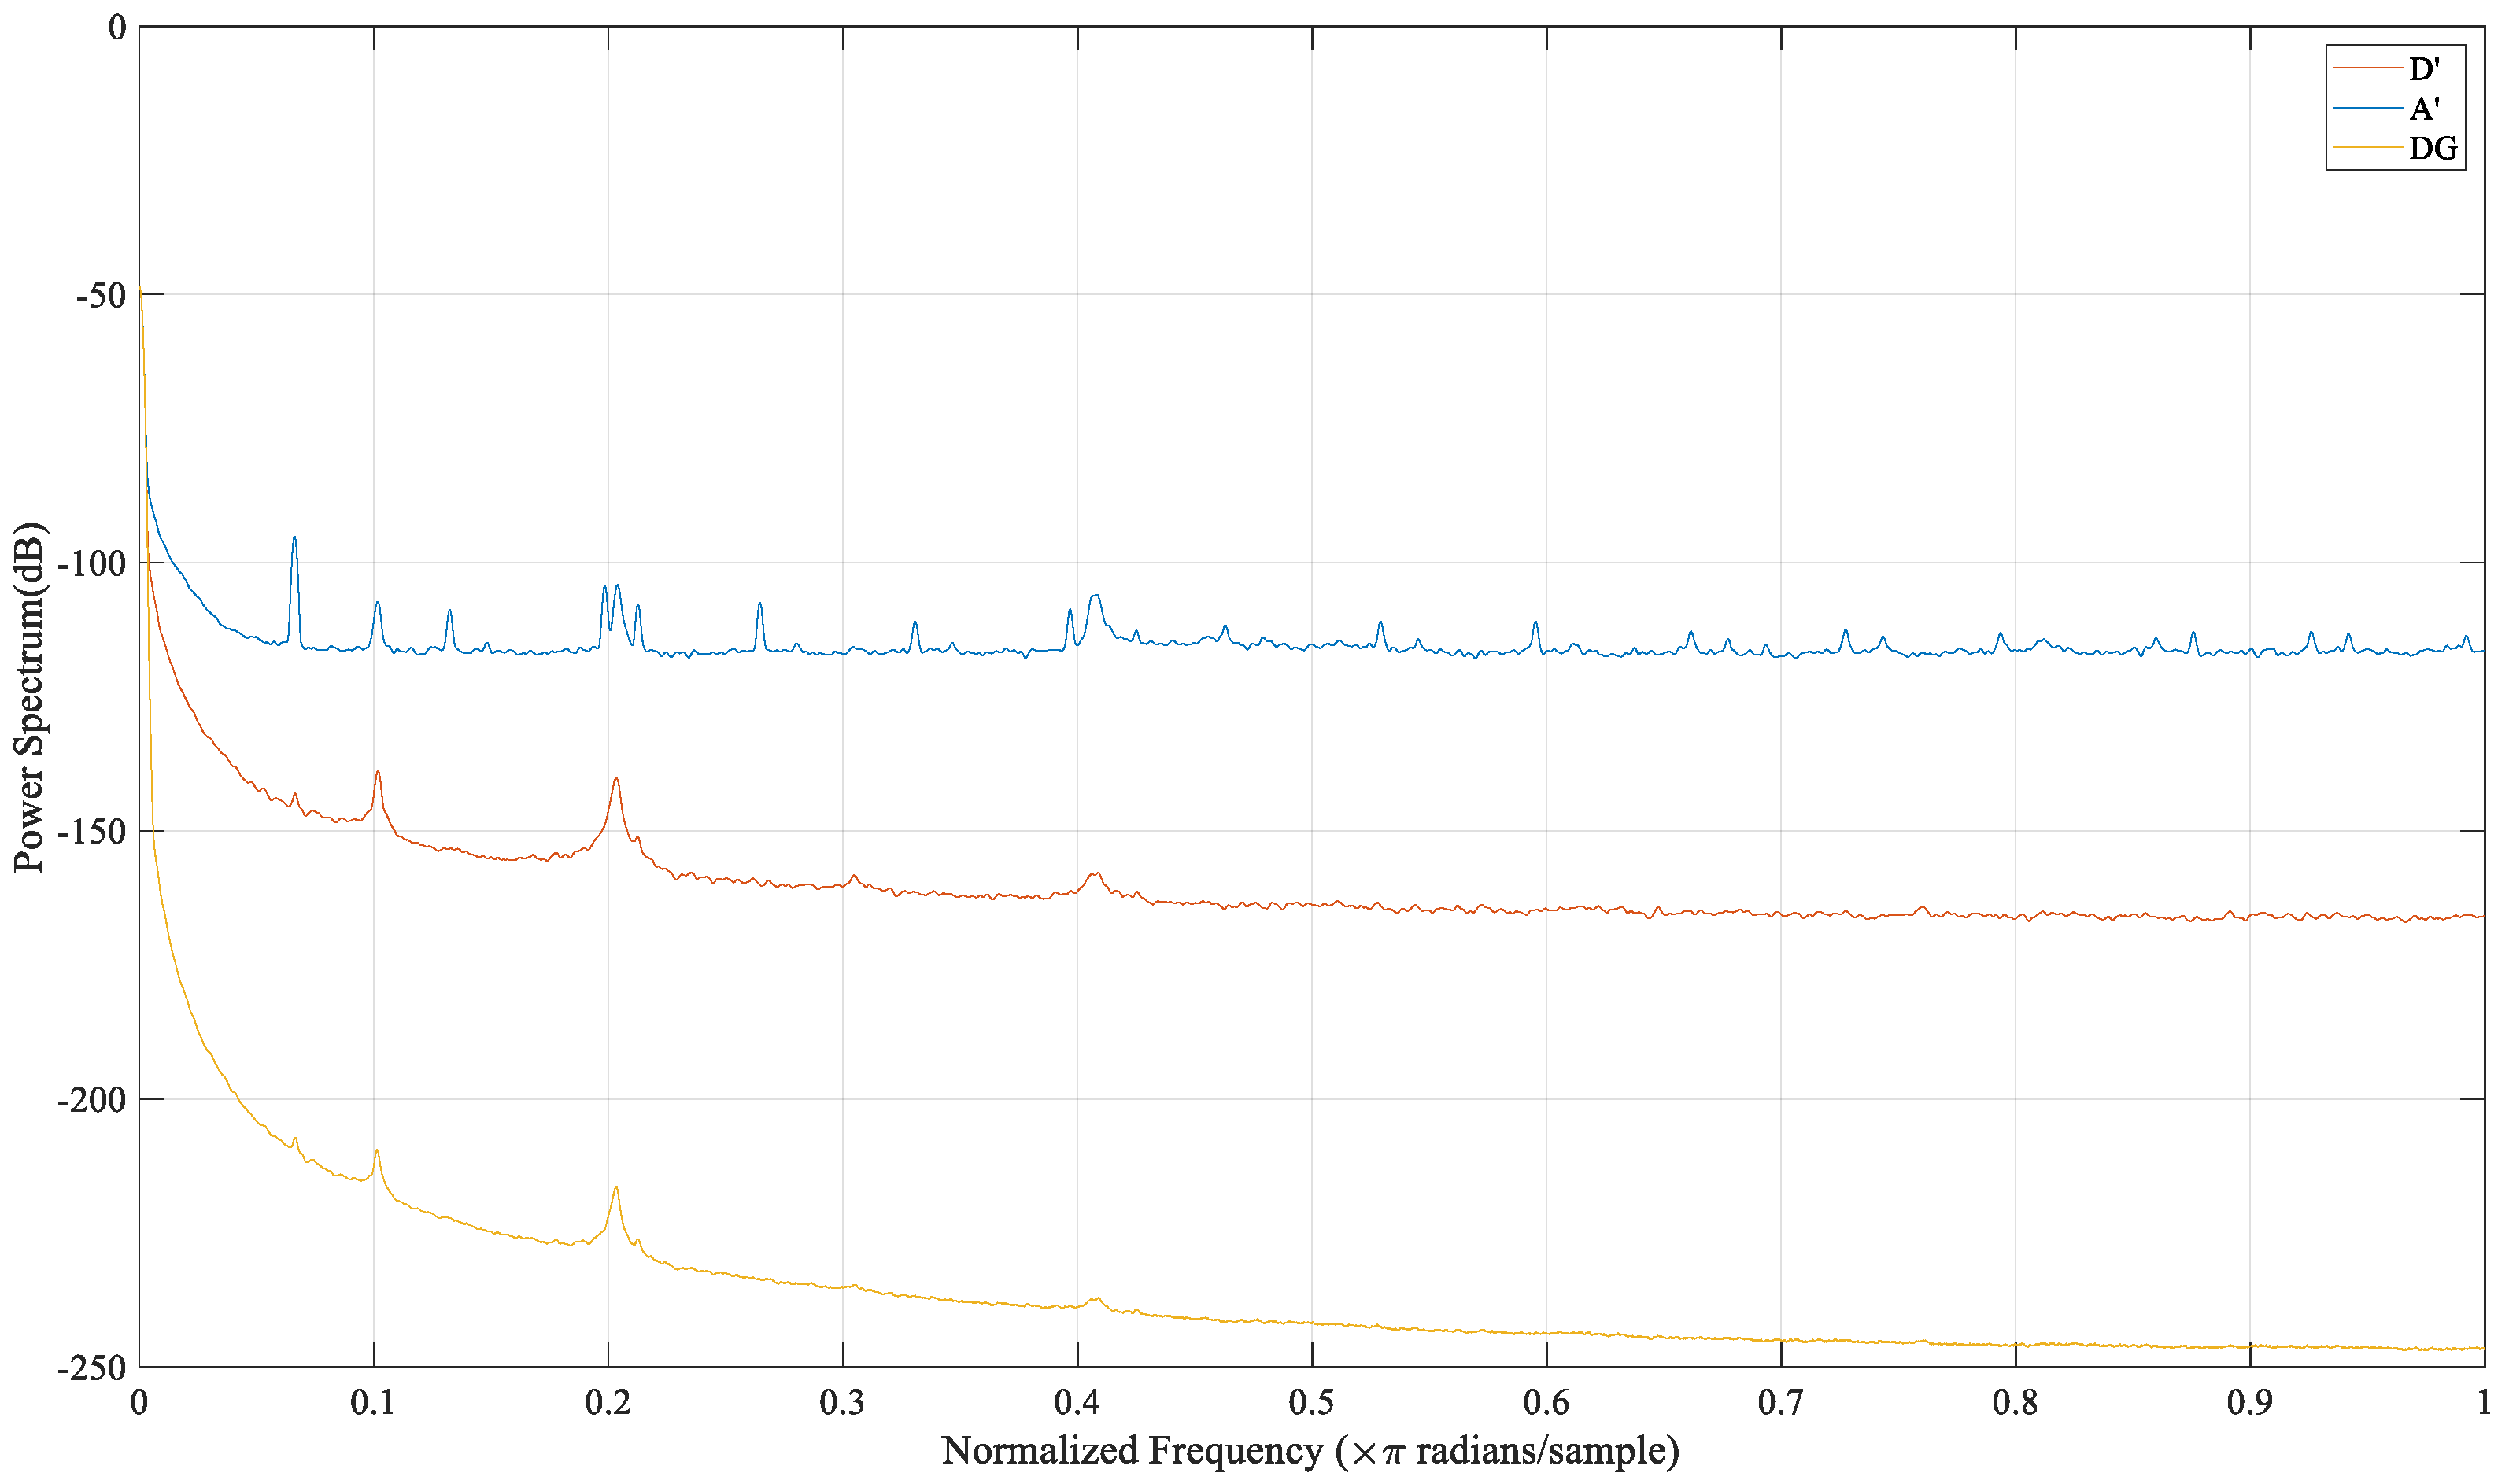
Display the power spectrums of the digital method signal , the analog method signal , and the useful signal . The result of SN. 29-1043-52471 is shown in Figure 15, and the result of SN. 30-1013-34894 is shown in Figure 16.
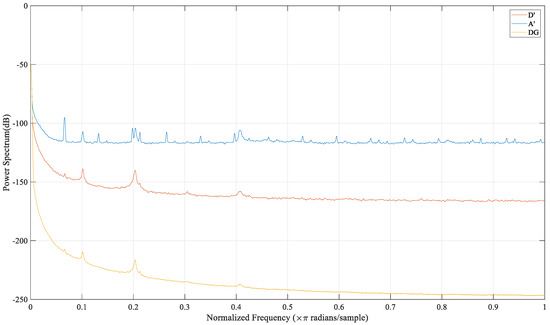
Figure 15.
The power spectrums of Larch SN. 30-1013-34894.
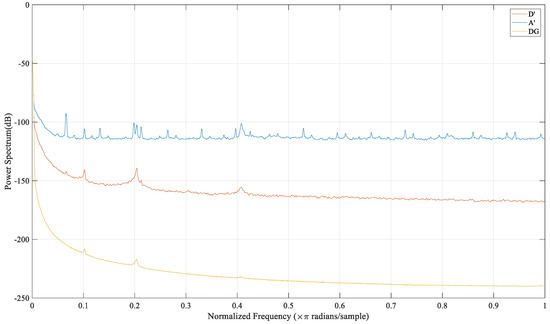
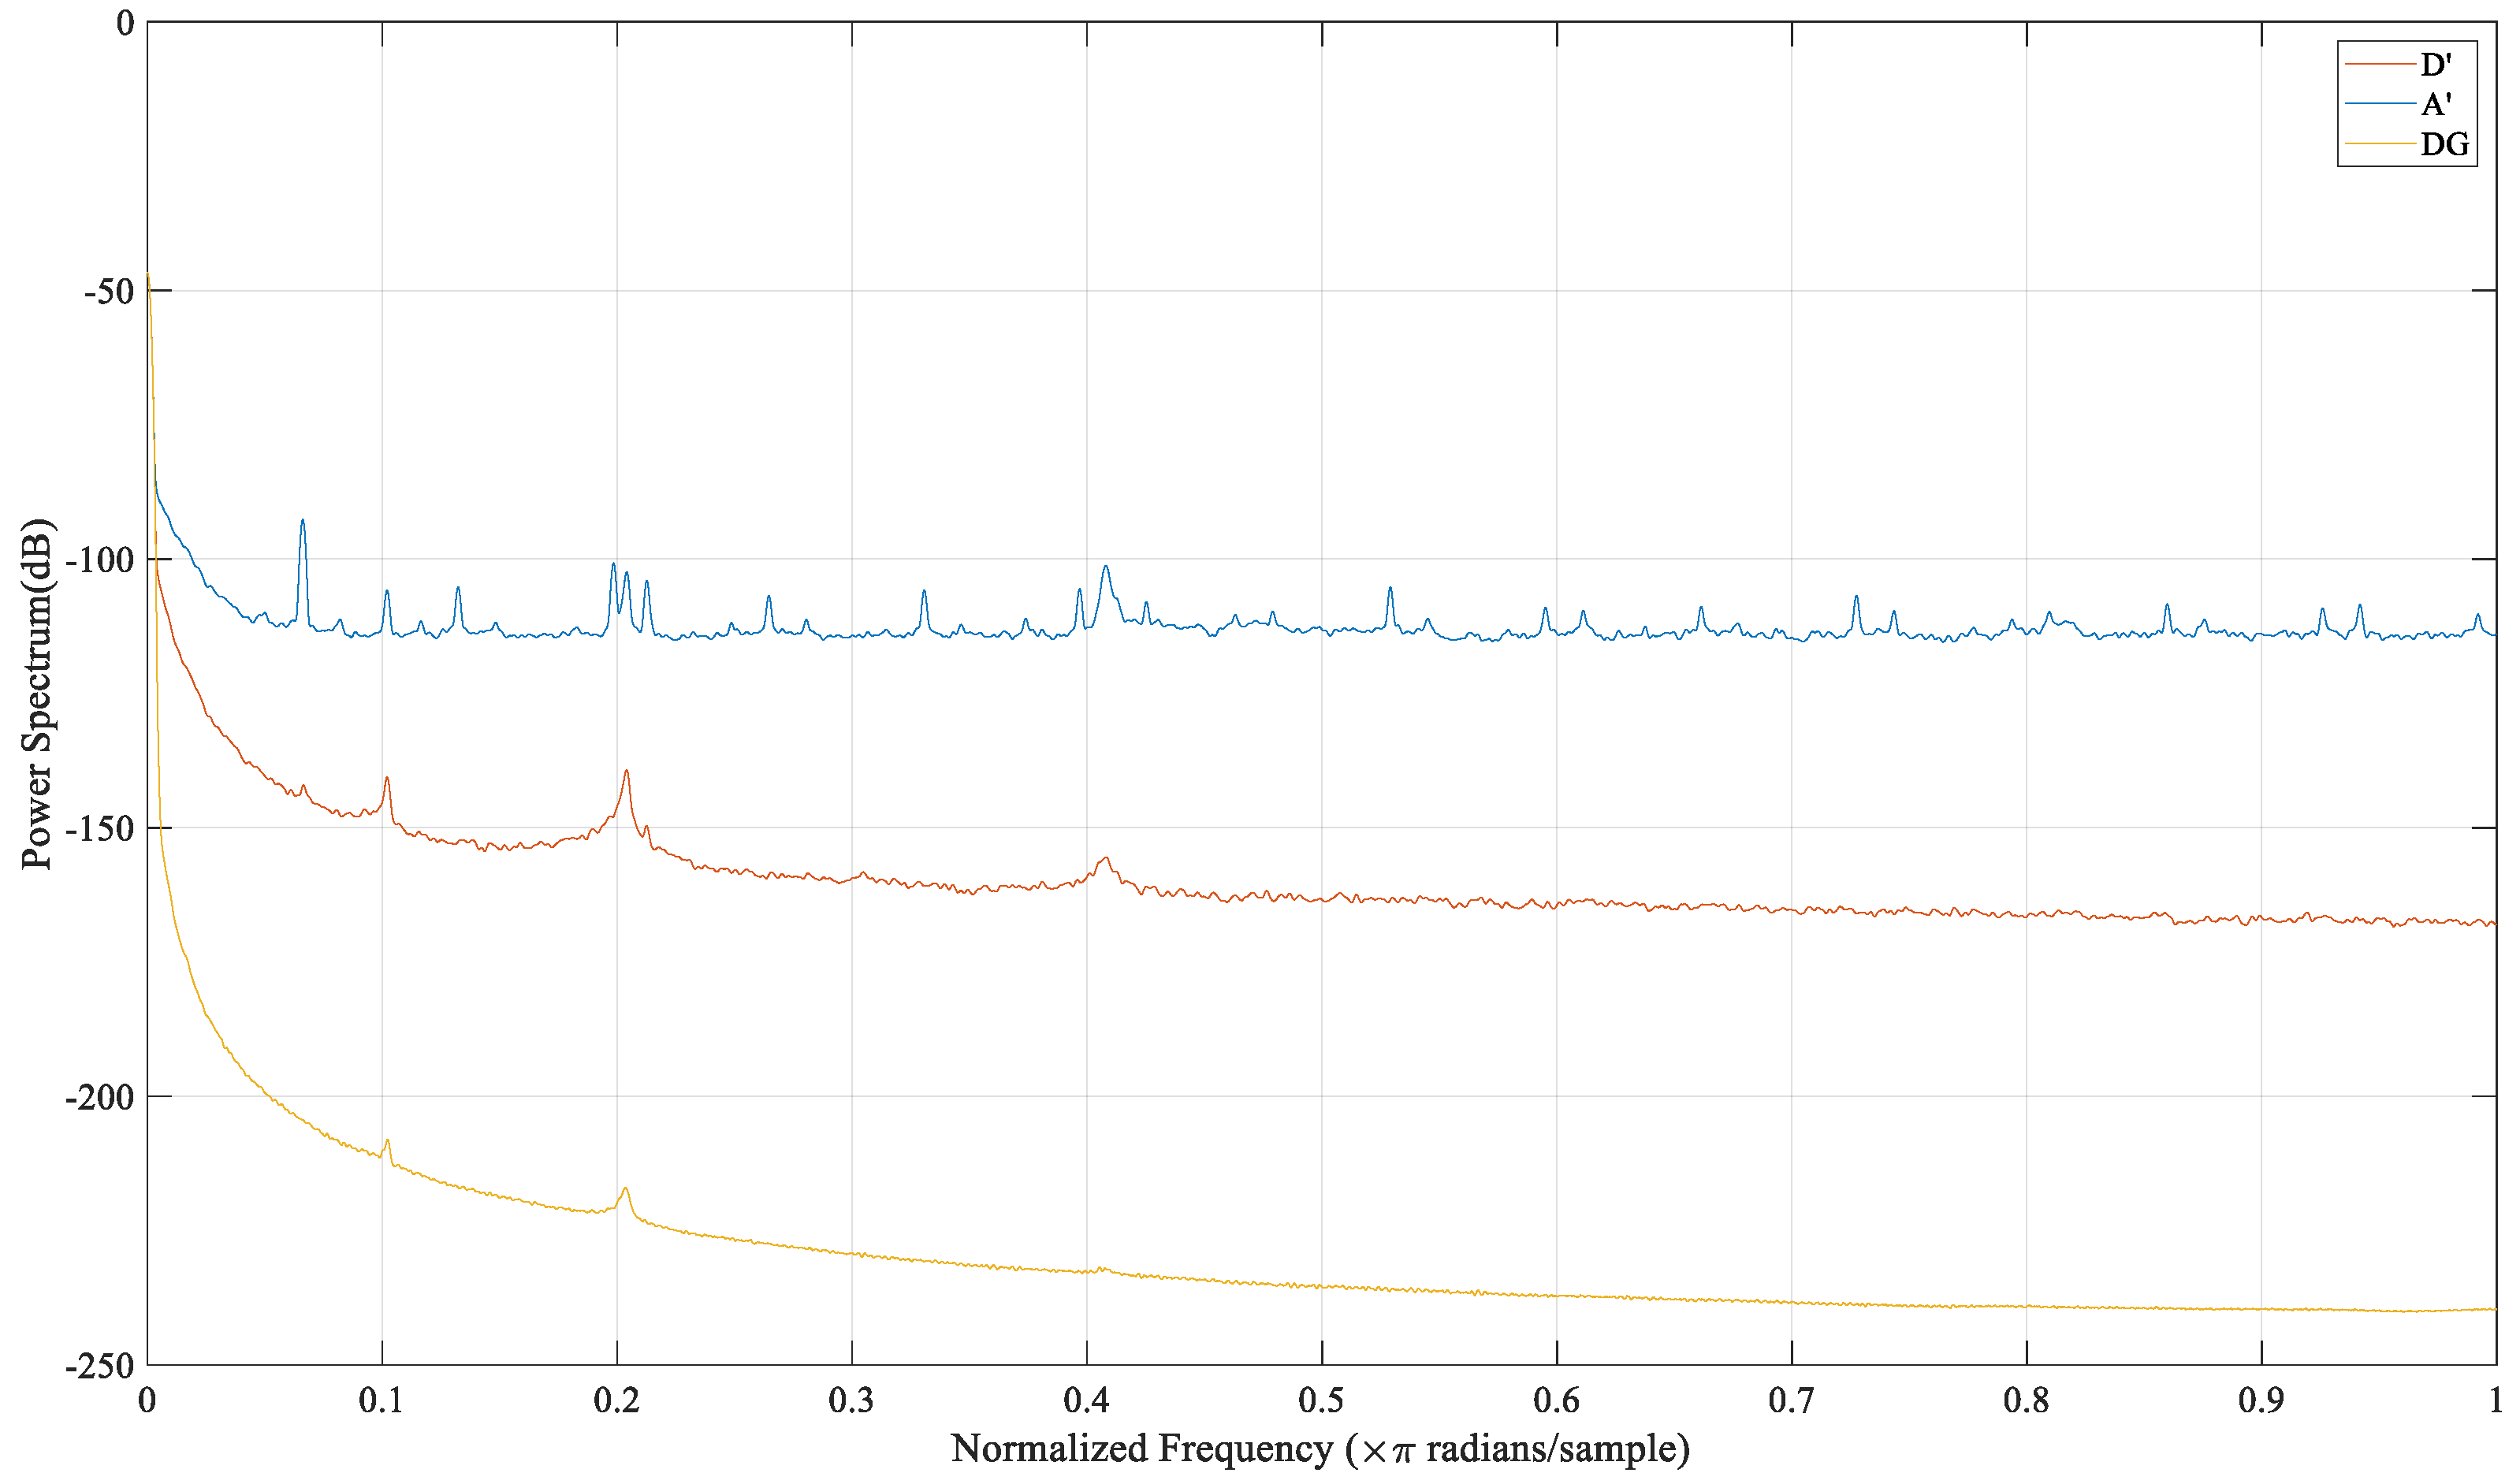
Figure 16.
The power spectrums of Fir SN. 29-1043-52471.
It can be seen in Figure 15 and Figure 16 that the power spectrum waveforms characteristics of Larch and Fir are similar. The three waveforms coincide in the low-frequency band, and their energy is concentrated in the low-frequency band, reflecting the change in tree ring resistance. Then the amplitude of the waveform drops rapidly and separates from and . Since is the desired signal that does not contain noise signals; the separated part represents the noise interference introduced in the detection process. In the separation part, the difference between the signal and is significantly smaller than the difference between the signal and , indicating that the noise interference level of the digital method is significantly lower than that of the analog method. In addition, there are required noise spikes in , and the number of noise spikes in is also significantly reduced, indicating that the digital method completely avoids noise interference in some frequency bands.
To quantify the improvement of the signal quality by the digital method, this research introduces the Signal-to-Noise Ratio (SNR) indicator, which can also be called the Signal-to-Interference and Noise Ratio (SINR) indicator. The SNR refers to the ratio of the desired signal power () to the noise and interference signal power (), usually in dB. The calculation formula of SNR is shown in Equation (25):
refers to when calculating SNR for the digital method, refers to when calculating SNR for the analog method.
The SNR for the digital method and the analog method of each sample are shown in Table 4. All the SNR are in dB. SNR (DM) refers to the SNR for the digital method, and SNR (AM) refers to the SNR for the analog method. SNR Improvement refers to the difference between the SNR of the digital method and the SNR of the analog method.
Table 4.
The SNR for the digital method (DM) and the analog method (AM).
The larger the SNR, the smaller the noise interference mixed in the signal and the higher the signal quality; otherwise, the opposite is true. In the eight sample experiments, the average SNR of the digital method is 39.0145 dB, and the average SNR of the analog method is 19.7555 dB. The SNR of the digital method is 19.2590 dB higher than that of the analog method.
Converting the SNR to the percentage of digital method noise interference energy to analog method noise interference energy is shown in Equation (26):
The for the digital method and the analog method of each sample are shown in Table 5.
Table 5.
The correlation coefficients and average correlation coefficients.
Table 5 shows that the average noise interference energy of the digital method is only 1.27% of that of the analog method. Therefore, the digital method greatly reduces the introduced noise interference and significantly improves signal quality.
5. Discussion
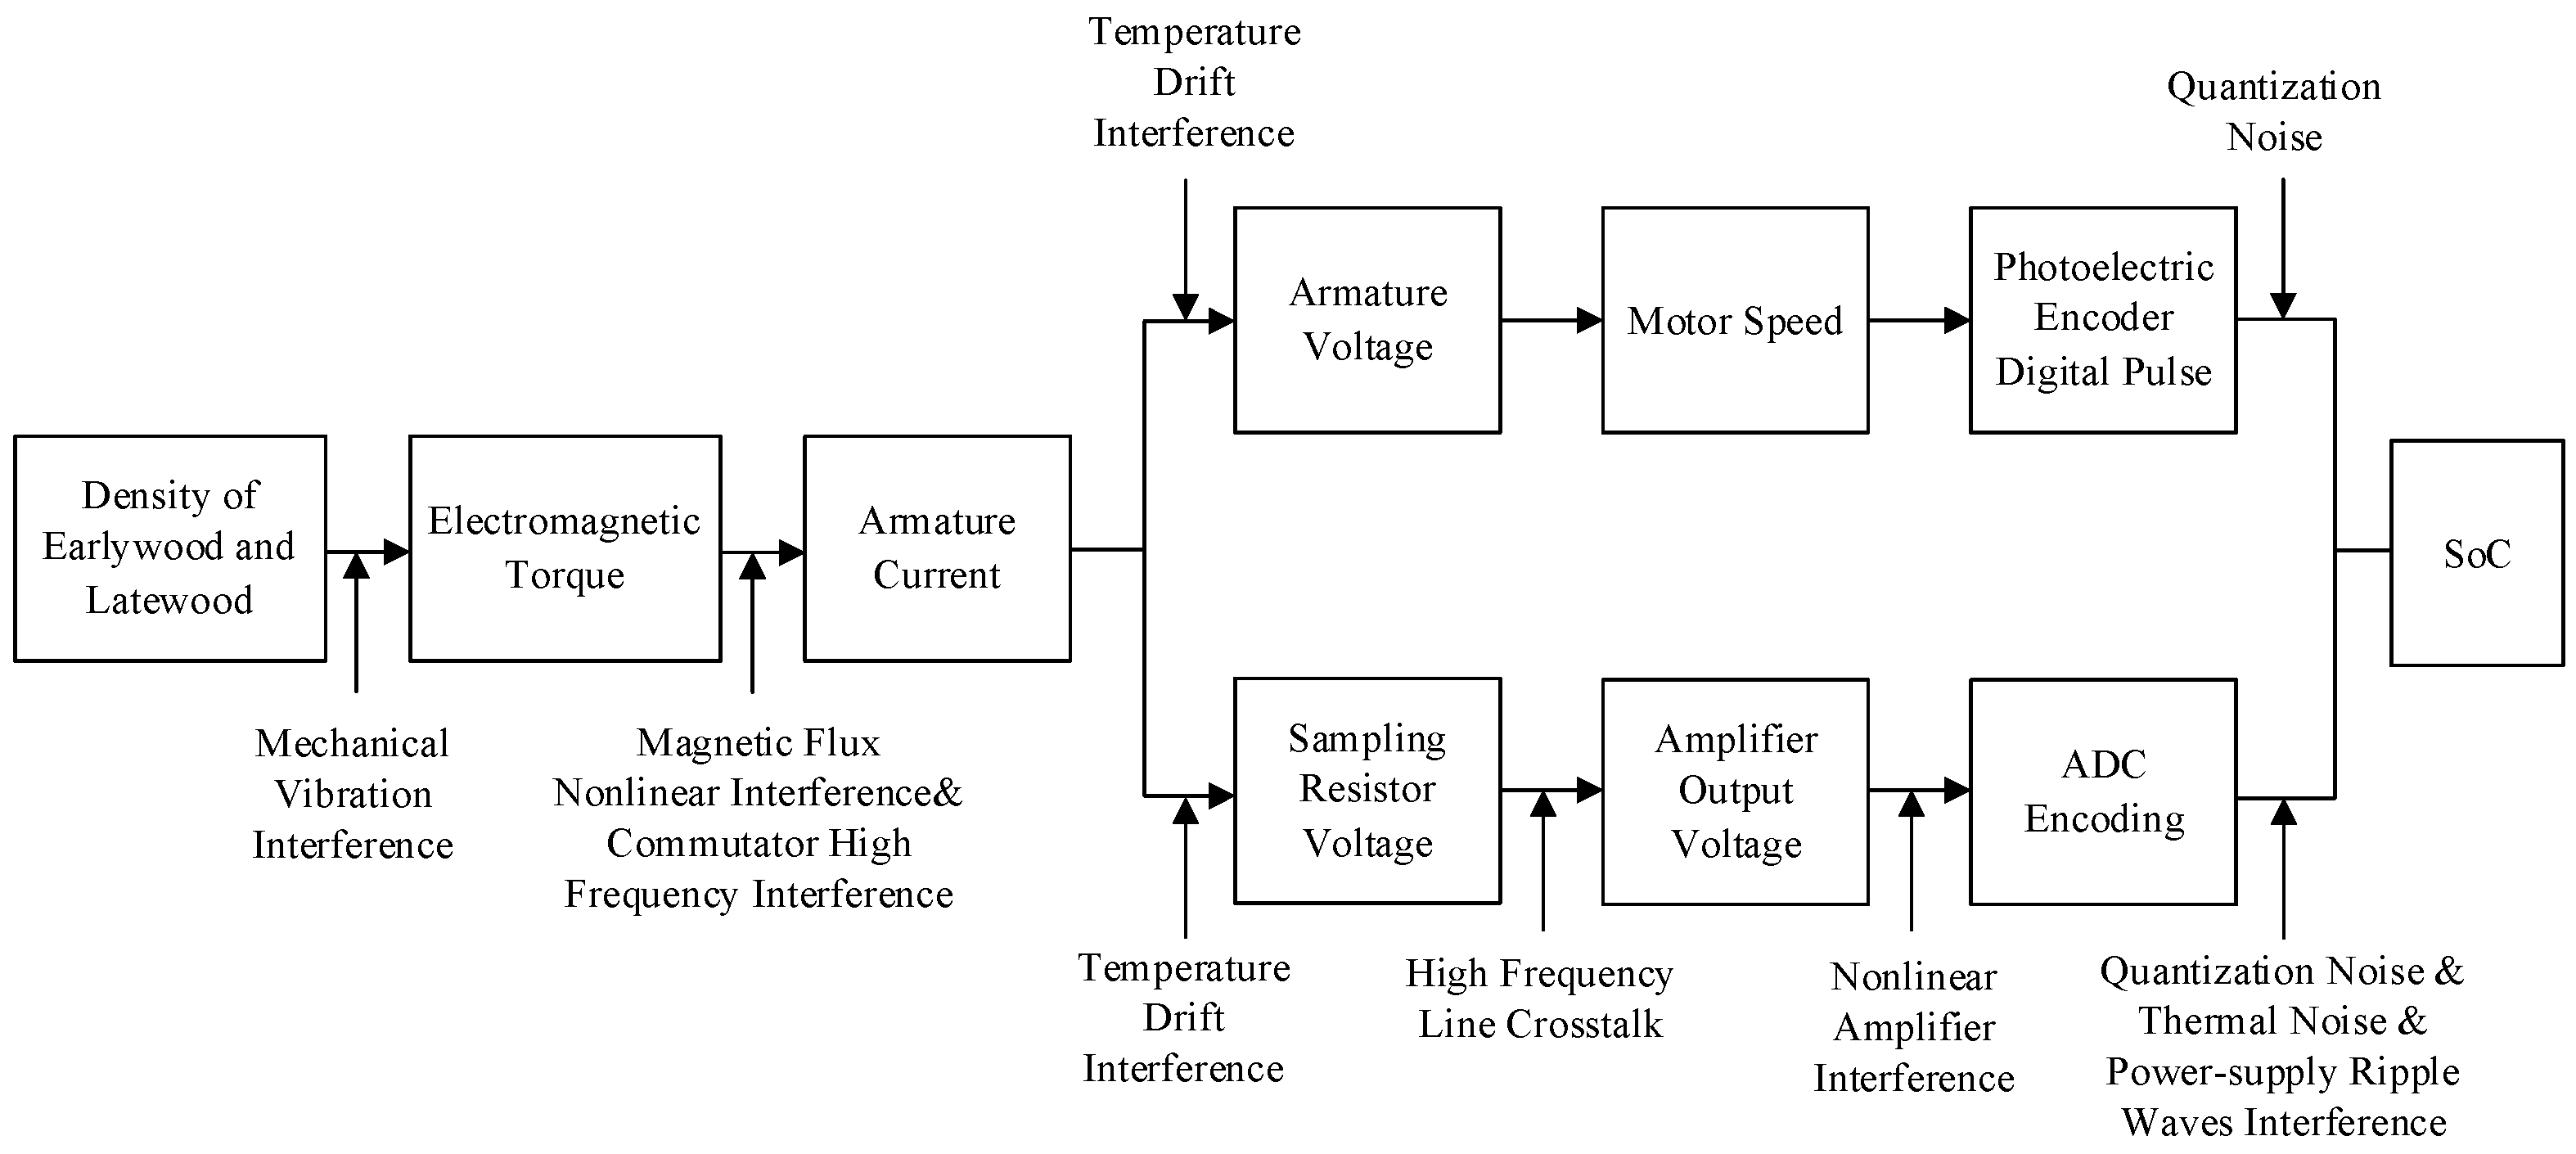
The experimental results can be discussed from two perspectives; time domain and frequency domain. For analysis in the time domain, the first focus is on waveform and amplitude. The waveform of the digital method is clear, which can intuitively identify the tree rings of earlywood and latewood and evaluate the tree age, while the waveform of the analog method fluctuates violently, and the effective tree ring information cannot be identified. This is the signal quality improvement of the digital method, directly reflected from the time domain waveform. There is a significant difference in amplitude between the two signals due to differences in the calculation of the two detection methods. Although their amplitudes are different, they are all used to measure the change of resistance, so if the calculation formula of the digital method is correct, the digital and analog detection signals should have a strong correlation. As the experimental results show, the average correlation coefficient of the two detection methods reaches 0.9365, which means the results obtained by the two have high consistency, and verifies the correctness of the digital method from the perspective of experimental results. Through the flow of the measured signal, the consistency of the detection results can also be proved. The signal flow diagram of the digital method and the analog method is shown in Figure 17.
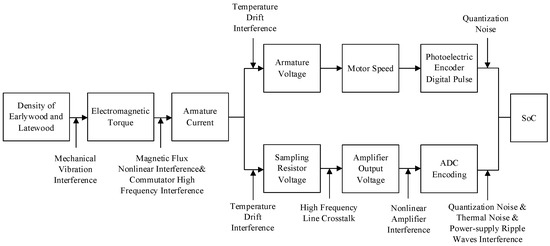
Figure 17.
The signal flow diagram of the digital method and the analog method.
It can be seen from Figure 17 that both methods complete the first three steps of signal flow based on the proportional relationship between the armature current and the change in tree ring density. The flow after the armature current starts to differ between the digital method and the analog method, so both detection results should be related to the armature circuit. The analog method is a widely used and correct method of micro-drilling resistance technology, so the detection results of the digital method are strongly related to the analog method, which can verify the correctness of the digital method.
In the analysis of the frequency domain, this study uses SNR to quantify the improvement of signal quality. Compared with the analog method, the digital method has an excellent performance, the average SNR improves by 19.2590 dB, and the average noise interference energy is only 1.27% of the analog method. Such excellent performance can be obtained because the digital method does not take measures to reduce the influence of noise interference but cuts off the way of noise interference in principle. Figure 17 also shows the approach to noise intervention. Comparing the noise intervention of the two methods, the digital method samples the non-electrical quantity speed, which avoids the line crosstalk caused by high-frequency electronic signals such as PWM signals and serial transmission. An amplifier isn’t needed in the digital method, so there is no nonlinear amplification interference. At the same time, the digital method uses a photoelectric encoder instead of ADC for sampling. The digital pulse signal output by the photoelectric encoder has a strong anti-interference ability and will not be affected by thermal noise and power-supply ripple waves interference.
There are also some limitations and further research directions on the digital micro-drilling resistance method. The first limitation is the micro-drilling resistance method is used to identify tree rings by density difference. Hence, it’s more suitable for the coniferous and ring-porous trees, which have clearly separated tree rings into earlywood and latewood, but not very suitable for the diffuse-porous trees. To compare the performance of the two different micro-drilling resistance methods under the best conditions, the two experimental tree species are coniferous. Experimental on some ring-porous trees or semi-ring-porous trees is a further research direction.
Secondly, the correctness of the digital method was confirmed by the consistency study. To obtain accurate detection more intuitively, the results can also be compared with dendrochronological methods.
The third direction is the changes in reference voltage for digital detection results. In forest operations, batteries are usually used to power equipment, and the output voltage of the batteries will gradually decrease. The output voltage of the battery will be directly connected to the upper and lower bridge arms of the H-bridge motor drive circuit as . The digital method that uses the PWM duty ratio or pulse width time as the output detection result will be affected by the changes in the amplitude of , so can be regarded as a reference voltage. During a single detection process, the power consumption of the battery is very limited, so the change in is very small, and the impact on the average amplitude of the detection results can be ignored. However, for the two detections with a large difference in battery power, the average amplitude of the output results will be greatly affected by . Taking the detection of the same tree disk sample as an example, when the battery power is sufficient, is larger, which makes the average amplitude of the detection results smaller; when the battery power is low, is small, so that the average amplitude of the average detection results increases. For the same detection sample, this will lead to inconsistent results of multiple detection. And for different detection samples, this will lead to misjudgment as the difference is caused by the difference in the average density of the detection samples. Since the experiments carried out in this research all use a constant voltage source for supplying stable power, it is not affected by the above-mentioned voltage reference problem, but this problem should be paid attention to when the digital method is used in the case of battery power supply.
Finally, the small amount of noise still present in the digital method can be a further research direction. Part of the noise is introduced from the first three steps of signal flow due to the digital method starting after the third step. Another reason is the subtle noise interference that may be introduced by the sampling process of digital detection methods. Further research can analyze the above two types of noise interference, and try to reduce or eliminate their influence to obtain a better-quality signal.
6. Conclusions
In this research, a digital micro-drilling resistance method is proposed. The theoretical analysis and comparative experiments show that hardware implementation of the digital micro-drilling resistance method can correctly reflect the tree ring information and significantly improve the signal quality of the micro-drilling resistance technology. This research shows that the digital micro-drilling resistance method has an obvious advantage in signal quality.
Looking forward, the digital micro-drilling resistance method will help improve the identification accuracy of the micro-drilling resistance method, and to develop the application of tree ring micro-destructive detection technology in the high-precision field.
Author Contributions
Conceptualization, X.H. and Y.Z.; methodology, X.H. and D.X.; software, X.H. and D.X.; validation, X.H., D.X. and Q.S.; formal analysis, X.H., D.X. and Q.S.; resources, Y.Z.; data curation, X.H., D.X. and Q.S.; writing—original draft preparation, X.H.; writing—review and editing, X.H. and D.X.; visualization, X.H. and Q.S.; supervision, Y.Z.; project administration, Y.Z.; funding acquisition, Y.Z. All authors have read and agreed to the published version of the manuscript.
Funding
This work is supported by The Fundamental Research Funds for the Central Universities (2021ZY74).
Institutional Review Board Statement
Not applicable.
Informed Consent Statement
Not applicable.
Data Availability Statement
Not applicable.
Conflicts of Interest
The authors declare no conflict of interest. The funders had no role in the design of the study; in the collection, analyses, or interpretation of data; in the writing of the manuscript, or in the decision to publish the results.
References
- Carlón-Allende, T.; Villanueva-Díaz, J.; Mendoza, M.E.; Pérez-Salicrup, D.R. Climatic Signal in Earlywood and Latewood in Conifer Forests in the Monarch Butterfly Biosphere Reserve, Mexico. Tree-Ring Res. 2018, 74, 63–75. [Google Scholar] [CrossRef]
- Zhang, Y.; Li, J.; Zheng, Z.; Zeng, S. A 479-Year Early Summer Temperature Reconstruction Based on Tree-Ring in the Southeastern Tibetan Plateau, China. Atmosphere 2021, 12, 1251. [Google Scholar] [CrossRef]
- Acosta-Hernández, A.C.; Pompa-García, M.; Camarero, J.J. An Updated Review of Dendrochronological Investigations in Mexico, a Megadiverse Country with a High Potential for Tree-Ring Sciences. Forests 2017, 8, 160. [Google Scholar] [CrossRef] [Green Version]
- Moon, N.H.; Moon, G.H.; Chun, J.H.; Shin, M.Y. Dendroclimatological analysis and tree-ring growth prediction of Quercus mongolica. For. Sci. Technol. 2020, 16, 32–40. [Google Scholar] [CrossRef] [Green Version]
- Li, G.; Harrison, S.P.; Prentice, I.C. Quantifying climatic influences on tree-ring width. Biogeosci. Discuss. 2019. preprint. [Google Scholar] [CrossRef] [Green Version]
- Gurskaya, M.A. Effect of Summer Monthly Temperatures on Light Tree Ring Formation in Three Larch Species (Larix) in the Northern Forest–Tundra of Siberia. Russ. J. Ecol. 2019, 50, 343–351. [Google Scholar] [CrossRef]
- Sánchez-Calderón, O.D.; Carlón-Allende, T.; Mendoza, M.E.; Villanueva-Díaz, J. Dendroclimatology in Latin America: A Review of the State of the Art. Atmosphere 2022, 13, 748. [Google Scholar] [CrossRef]
- Zou, W.; Jing, W.; Chen, G.; Lu, Y.; Song, H. A Survey of Big Data Analytics for Smart Forestry. IEEE Access 2019, 7, 46621–46636. [Google Scholar] [CrossRef]
- Torresan, C.; Garzón, M.B.; O’Grady, M.; Robson, T.M.; Picchi, G.; Panzacchi, P.; Tomelleri, E.; Smith, M.; Marshall, J.; Wingate, L.; et al. A new generation of sensors and monitoring tools to support climate-smart forestry practices. Can. J. For. Res. 2021, 51, 1751–1765. [Google Scholar] [CrossRef]
- Gallois, E. Cassiope Tetragona as a Dendroecological Proxy: A Retrospective Analysis of Experimental Warming in the Arctic Tundra; University of British Columbia: Vancouver, BC, Canada, 2019. [Google Scholar]
- García-Hidalgo, M.; García-Pedrero, Á.M.; Caetano-Sánchez, C.; Gómez-España, M.; Lillo-Saavedra, M.; Olano, J.M. ρ-MtreeRing: A Graphical User Interface for X-ray Microdensity Analysis. Forests 2021, 12, 1405. [Google Scholar] [CrossRef]
- García-Hidalgo, M.; García-Pedrero, Á.; Colón, D.; Sangüesa-Barreda, G.; García-Cervigón, A.I.; López-Molina, J.; Hernández-Alonso, H.; Rozas, V.; Olano, J.M.; Víctor, A.-G. CaptuRING: A do-it-yourself tool for wood sample digitization. Methods Ecol. Evol. 2022, 13, 1185–1191. [Google Scholar] [CrossRef]
- Alekseev, A.S.; Sharma, S.K. Long-Term Growth Trends Analysis of Norway Spruce Stands in Relation to Possible Climate Change: Case Study of Leningrad Region, 2020, No3 (375). Available online: https://cyberleninka.ru/article/n/long-term-growth-trends-analysis-of-norway-spruce-stands-in-relation-to-possible-climate-change-case-study-of-leningrad-region (accessed on 16 June 2022).
- Kozakiewicz, P.; Jankowska, A.; Mamiński, M.; Marciszewska, K.; Ciurzycki, W.; Tulik, M. The Wood of Scots Pine (Pinus sylvestris L.) from Post-Agricultural Lands Has Suitable Properties for the Timber Industry. Forests 2020, 11, 1033. [Google Scholar] [CrossRef]
- Oh, J.; Seo, J.-W.; Kim, B.-R. Verifying the Possibility of Investigating Tree Ages Using Resistograph. J. Korean Wood Sci. Technol. 2019, 47, 90–100. [Google Scholar] [CrossRef]
- Karki, J.; Gautam, D.; Thapa, S.; Thapa, A.; Aryal, K.; Sidgel, R. A Century Long Tree-Climate Relations in Manaslu Conservation Area, Central Nepalese Himalaya. N. Am. Acad. Res. 2019, 2, 49–62. [Google Scholar]
- Abiyu, A.; Mokria, M.; Gebrekirstos, A.; Brauning, A. Tree-ring record in Ethiopian church forests reveals successive generation differences in growth rates and disturbance events. For. Ecol. Manag. 2018, 409, 835–844. [Google Scholar] [CrossRef]
- Riechelmann, D.F.C.; Fohlmeister, J.; Kluge, T.; Peter, K.; Richter, D.K.; Deininger, M.; Freidrich, R.; Frank, N.; Scholz, D. Evaluating the potential of tree-ring methodology for cross-dating of three annually laminated stalagmites from Zoolithencave (SE Germany). Quat. Geochronol. 2019, 52, 37–50. [Google Scholar] [CrossRef]
- Kagawa, A.; Fujiwara, T. Smart increment borer: A portable device for automated sampling of tree-ring cores. J. Wood Sci. 2018, 64, 52–58. [Google Scholar] [CrossRef]
- Marin, G.; Abrudan, I.V.; Strimbu, B. Increment Cores of the National Forest Inventory from Romania. Math. Comput. For. Nat. Resour. Sci. 2019, 11, 294–302. [Google Scholar]
- Gärtner, H.; Cherubini, P.; Fonti, P.; von Arx, G.; Schneider, L.; Nievergelt, D.; Verstege, A.; Bast, A.; Schweingruber, F.H.; Buntgen, U. A technical perspective in modern tree-ring research-how to overcome dendroecological and wood anatomical challenges. J. Vis. Exp. 2015, 97, e52337. [Google Scholar] [CrossRef] [Green Version]
- Patrut, A.; Woodborne, S.; Patrut, R.T.; Rakosy, L.; Lowy, D.A.; Hall, G.; von Reden, K.F. The demise of the largest and oldest African baobabs. Nat. Plants 2018, 4, 423–426. [Google Scholar] [CrossRef]
- Soge, A.O.; Popoola, O.I.; Adetoyinbo, A.A. Detection of wood decay and cavities in living trees: A review. Can. J. For. Res. 2021, 51, 937–947. [Google Scholar] [CrossRef]
- Fabiánová, A.; Šilhán, K. The Growth Responses of Picea abies (L.) Karst. to Increment Borer Wounding. Tree-Ring Res. 2021, 77, 74–85. [Google Scholar] [CrossRef]
- Allison, R.B.; Wang, X.; Senalik, C.A. Methods for Nondestructive Testing of Urban Trees. Forests 2020, 11, 1341. [Google Scholar] [CrossRef]
- Houjiang, Z. Inspection of growth quality for urban trees. Sci. Silvae Sin. 2005, 41, 198. [Google Scholar]
- Tomazello, M.; Brazolin, S.; Chagas, M.P.; Oliveira, J.T.S.; Ballarin, A.W.; Benjamin, C.A. Application of X-ray Technique in Nondestructive Evaluation of Eucalypt Wood. Maderas Cienc. Tecnol. 2008, 10, 139–149. [Google Scholar] [CrossRef]
- Jacquin, P.; Longuetaud, F.; Leban, J.M.; Mothe, F. X-ray Microdensitometry of Wood: A Review of Existing Principles and Devices. Dendrochronologia 2017, 42, 42–50. [Google Scholar] [CrossRef]
- Schönfelder, O.; Zeidler, A.; Borůvka, V.; Bílek, L.; Vítámvás, J. Effect of Shelterwood and Clear-Cutting Regeneration Method on Wood Density of Scots Pine. Forests 2020, 11, 868. [Google Scholar] [CrossRef]
- Rinn, F.; Schweingruber, F.H.; Schär, E. Resistograph and X-ray Density Charts of Wood. Comparative Evaluation of Drill Resistance Profiles and X-ray Density Charts of Different Wood Species. Holzforschung 1996, 50, 303–311. [Google Scholar] [CrossRef]
- İÇEL, BİLGİN and GÜLER, GÜRCAN Nondestructive determination of spruce lumber wood density using drilling resistance (Resistograph) method. Turk. J. Agric. For. 2016, 40, 10. [CrossRef]
- Rinn, F. Typical trends in resistance drilling profiles of trees. Arborist News 2014, 47, 42–47. [Google Scholar]
- Sharapov, E.; Brischke, C.; Militz, H.; Smirnova, E. Prediction of modulus of elasticity in static bending and density of wood at different moisture contents and feed rates by drilling resistance measurements. Eur. J. Wood Prod. 2019, 77, 833–842. [Google Scholar] [CrossRef]
- Walker, T.D.; Isik, F.; McKeand, S.E. Genetic Variation in Acoustic Time of Flight and Drill Resistance of Juvenile Wood in a Large Loblolly Pine Breeding Population. For. Sci. 2019, 65, 469–482. [Google Scholar] [CrossRef]
- Tomczak, K.; Tomczak, A.; Jelonek, T. Measuring Radial Variation in Basic Density of Pendulate Oak: Comparing Increment Core Samples with the IML Power Drill. Forests 2022, 13, 589. [Google Scholar] [CrossRef]
- Downes, G.M.; Harrington, J.J.; Drew, D.M.; Lausberg, M.; Muyambo, P.; Watt, D.; Lee, D.J. A Comparison of Radial Wood Property Variation on Pinus radiata between an IML PD-400 ‘Resi’ Instrument and Increment Cores Analysed by SilviScan. Forests 2022, 13, 751. [Google Scholar] [CrossRef]
- Rinn, F. Basics of typical resistance-drilling profiles. West. Arborist 2012, 17, 30–36. [Google Scholar]
- Cao, Y.; Wang, D.; Wang, Z.; Tian, L.; Zheng, C.; Tian, Y.; Liu, Y. Research on Tree Pith Location in Radial Direction Based on Terrestrial Laser Scanning. Forests 2021, 12, 671. [Google Scholar] [CrossRef]
- Hu, X.; Zheng, Y.; Liang, H.; Zhao, Y. Design and Test of a Microdestructive Tree-Ring Measurement System. Sensors 2020, 20, 3253. [Google Scholar] [CrossRef]
- Chen, X. Design of Needle Measurement System for Tree Annual Ring. Master’s Thesis, Beijing Forestry University, Beijing, China, 2019. [Google Scholar] [CrossRef]
- Hong, P.; Jun, L.; Xiangdong, L.; Xuzhan, G.; Jianfeng, Y.; Shouzheng, T. Tree Age Estimation Based on Resistograph Stationary Kalman Filter. Sci. Silvae Sin. 2021, 57, 14–23. [Google Scholar] [CrossRef]
- Jianfeng, Y.; Yandong, Z.; Jun, L.; Yili, Z.; Ruidong, G.; Shouzheng, T. Annual-ring Measurement Method Based on Adaptive Filtering Algorithm. Trans. Chin. Soc. Agric. Mach. 2020, 51, 216–222. [Google Scholar]
- Traversari, S.; Giovannelli, A.; Emiliani, G. Wood Formation under Changing Environment: Omics Approaches to Elucidate the Mechanisms Driving the Early-to-Latewood Transition in Conifers. Forests 2022, 13, 608. [Google Scholar] [CrossRef]
- Berdanier, A.B.; Miniat, C.F.; Clark, J.S. Predictive models for radial sap flux variation in coniferous, diffuse-porous and ring-porous temperate trees. Tree Physiol. 2016, 36, 932–941. [Google Scholar] [CrossRef] [PubMed] [Green Version]
- Fabijańska, A.; Danek, M. DeepDendro—A tree rings detector based on a deep convolutional neural network. Comput. Electron. Agric. 2018, 150, 353–363. [Google Scholar] [CrossRef]
- Rinn, F. Intact-decay transitions in profiles of density-calibratable resistance drilling devices using long thin needles. Arboric. J. 2016, 38, 204–217. [Google Scholar] [CrossRef]
- IML > Products > Wood testing Systems > IML-RESI Systems > IML-RESI MD300. Available online: https://www.iml-service.com/product/iml-resi-md300/ (accessed on 5 June 2022).
- Guller, B.; Guller, A.; Kazaz, G. Is Resistograph an appropriate tool for the annual ring measurement of Pinus brutia. In Proceedings of the 42nd International Conference NDE Safety, Sec, Czech Republic, 30 October–1 November 2012; pp. 89–94. [Google Scholar]
- Oh, J.-A.; Seo, J.-W.; Kim, B.-R. Determinate the Number of Growth Rings Using Resistograph with Tree-Ring Chronology to Investigate Ages of Big Old Trees. J. Korean Wood Sci. Technol. 2019, 47, 700–708. [Google Scholar] [CrossRef]
- Radecki, A.; Rybicki, T. An Accurate State Visualization of Multiplexed and PWM Fed Peripherals in the Virtual Simulators of Embedded Systems. Appl. Sci. 2022, 12, 3137. [Google Scholar] [CrossRef]
- Choi, W.; Kang, F. H-bridge based multilevel inverter using PWM switching function. In Proceedings of the INTELEC 2009—31st International Telecommunications Energy Conference, Incheon, Korea, 18–22 October 2009; pp. 1–5. [Google Scholar] [CrossRef]
- Hernández-Alvarado, R.; García-Valdovinos, L.G.; Salgado-Jiménez, T.; Gómez-Espinosa, A.; Fonseca-Navarro, F. Neural Network-Based Self-Tuning PID Control for Underwater Vehicles. Sensors 2016, 16, 1429. [Google Scholar] [CrossRef] [Green Version]
- Zhu, R.; Wu, H. Dc motor speed control system based on incremental pid algorithm. Instrum. Tech. Sens. 2017, 7, 121–126. [Google Scholar]
- Wang, J.; Li, M.; Jiang, W.; Huang, Y.; Lin, R. A Design of FPGA-Based Neural Network PID Controller for Motion Control System. Sensors 2022, 22, 889. [Google Scholar] [CrossRef]
- Zhang, Q.; Pei, W. DSP Processer-in-the-Loop Tests Based on Automatic Code Generation. Inventions 2022, 7, 12. [Google Scholar] [CrossRef]
- Xu, J.; You, B.; Ma, L. Research and development of DSP based servo motion controller. In Proceedings of the 2008, 7th World Congress on Intelligent Control and Automation, Chongqing, China, 25–27 June 2008; pp. 7720–7725. [Google Scholar] [CrossRef]
- Chen, H.-C. An H-bridge driver using gate bias for DC motor control. In Proceedings of the 2013 IEEE International Symposium on Consumer Electronics (ISCE), Hsinschu, Taiwan, 3–6 June 2013; pp. 265–266. [Google Scholar] [CrossRef]
- Zhou, Z.; Fu, L.; Zhou, C.; Sharma, R.P.; Zhang, H. Simultaneous Compatible System of Models of Height, Crown Length, and Height to Crown Base for Natural Secondary Forests of Northeast China. Forests 2022, 13, 148. [Google Scholar] [CrossRef]
- Fujii, S.; Ishii, Y.; Katsuyama, S.; Akai, K.; Ueda, T.; Inada, M.; Fukushima, A.; Nakajima, K. Research and development of anti-maceration laparoscopic surgical cotton swabs. Minim. Invasive Ther. Allied Technol. 2022, 31, 587–594. [Google Scholar] [CrossRef] [PubMed]


Publisher’s Note: MDPI stays neutral with regard to jurisdictional claims in published maps and institutional affiliations. |
© 2022 by the authors. Licensee MDPI, Basel, Switzerland. This article is an open access article distributed under the terms and conditions of the Creative Commons Attribution (CC BY) license (https://creativecommons.org/licenses/by/4.0/).