Abstract
Forestry eco-hydrology is closely related to root architecture, and soil water infiltration has been always associated with root architecture. In this study, dye infiltration experiments and HYDRUS-1D were used to quantify the effects of different root architectures on the dynamics of soil water infiltration, volumetric water content, and soil water pressure head. The results provide evidence that root channels acted as preferential flow paths for water infiltration and percolation into the soil. Maize fibrous roots, rubber trees fine roots, and Spartina alterniflora smooth roots easily penetrated the plough layer of an agriculture site, the hard soil layer of a forest site, and the alternating sandy and mud layers of an intertidal zone, respectively. The initial and final infiltration rates were significantly different between the rooted and rootless soil profiles. The root-induced infiltration events lowered the propagation time of the wetting front across the rooted soil profile by 33%–113% than the rootless soil (p < 0.05), and the volumetric water content of the saturation zone of the rooted soil profile increased by 12%–19% relative to the rootless soil (p < 0.05). Furthermore, the soil water pressure head increased from negative (i.e., unsaturated) to positive (i.e., saturated) in the saturated soil. This change was more pronounced in the maize fibrous roots soil profile, but less pronounced in the rubber fine roots’ soil profiles or the S. alterniflora smooth roots. The results indicate that the downward movement, volumetric water content, and soil water pressure head were higher in soil profiles having plant roots than the rootless soil, and the degree of roots effects depended on roots architectures, soil hardness, and soil layer configuration. The findings provide evidence that root channels can act as preferential flow paths for water infiltration and percolation into the soil.
1. Introduction
The soil and water conservation ability of forest vegetation has always been a research hotspot, which is mainly reflected in forest vegetation layer, leaf litter layer and soil layer to water [1]. As an important part of soil layers, forestry root architecture can form a considerable spatial network structure in the soil, and speed up the soil water flow process [2].
Soil water flow behavior (preferential flow, matrix flow, and lateral flow) is an important process in global hydrological systems [3,4,5]. It influences the soil water infiltration, soil moisture distribution, runoff generation, soil erosion, pollutant migration, pesticide transport, groundwater recharge, subsurface stormflow, and subsurface return flow [6,7,8,9,10].
Considering the importance of soil water flow behavior, the measurement of soil hydraulic properties is very important to predict the direction and rate of water movement in soils [11]. As an important soil hydraulic property, saturated hydraulic conductivity (Ks) not only affects water flow and the transport of dissolved solutes, but also influences agricultural and environmental processes, including temporary water logging in the root zone, and solute transport rate [12]. In addition, soil moisture regulates plant water availability, as well as surface runoff and infiltration partitioning in root zones [13,14]. Therefore, to reflect water characteristics in meteorology, ecology, agronomy, and climate change studies [15], data acquisition on soil water content currently relies on three approaches: in situ (generally point-scale) measurements, remotely sensed observations, and hydrological modeling [15]. The wetting patterns of unsaturated soil cannot be accurately explained on the basis of soil water content; however, other soil hydraulic variables, such as soil water pressure head, can be measured over space and time to predict the direction and rate of water movement through unsaturated soils and chemical transport in the vadose zone [16].
Different techniques, including the quantification of soil structures, measurement of water distribution or water movement, construction of breakthrough curves, and dye tracing combined with image analysis, have been adopted to quantify soil hydraulic properties, such as preferential flow [17]. Dye tracing is widely used to visualize the paths and spatial pattern of water flow through soil [18,19]. Furthermore, single-porosity, dual-porosity, and dual-permeability models have been developed and used by numerous researchers to simulate the dynamics of preferential flow through soil [20,21,22]. These hydrological models can be run in HYDRUS-1D, which is widely used to simulate soil water movement through the root zone [20,23,24].
The development of water flow paths in the field is related to the complex interactions of multiple processes, activities, and characteristics, which include water repellency, soil bulk density, soil structure, thermal conductivity, moisture conditions, desiccation cracks, biological activity, tillage and management practices, vegetation cover, object (e.g., residual plastic film, straw, and stones) incorporation, and compaction through trampling by livestock, traffic, and machines [9,19,25,26,27]. Among these factors, roots are a key element of plant-related effects on soil hydrology [28,29,30]. For instance, channels left behind by old and decaying roots act as soil macropores that promote preferential flow [31]. Moreover, Jørgensen stated that soil water flow and solute transportat is more pronounced in soil profiles with plant roots than rootless soil [32], and for root channels represent a specific type of macropore [3]. Thus, the influence of plant-root-derived macropores on water flow depends on plant root architectures [32,33,34] (Table 1).

Table 1.
Summary of studies relevant to the present work’s objectives to predict the effects of (1) fibrous roots on soil water infiltration in the homogeneous plough layer of an agricultural site; (2) fine roots on soil water infiltration in the hard soil of a forestry site; and (3) smooth roots on soil water infiltration in the multilayered soils of an intertidal zone. We added the current study for completeness. Studies are ordered chronologically and then alphabetically. The symbol “n. r.” means “not reported”.
Our previous study used dye tracer experiments to visualize water flow path associated in three morphometric roots features [50]. However, the dye tracer technique cannot fully illustrate the dynamic characteristics of preferential flow through soil, particularly water flow through various soil profiles, such as a non-homogeneous soil structure and multiple soils layers. Therefore, this study used dye infiltration experiments and Hydrus-1D to understand the effects of roots morphometric features on the dynamic behaviors of water flow through soil. Accordingly, the three objectives of this study are to predict the effects of: (1) fibrous roots on soil water infiltration through homogeneous plough layer of an agricultural site; (2) fine roots on soil water infiltration through the hard soil of a rubber forest site; and (3) smooth roots on soil water infiltration through the multilayered soils of an intertidal zone.
2. Materials and Methods
2.1. Experimental Site
The fibrous roots of maize (Zea mays L.) were selected from Dingxi County, Gansu Province, China (Table 2). Field observations showed that most of the biomass from maize fibrous roots was confined to the upper 20 cm soil layer. A detailed description of the study site is provided by Jiang [51]. In the present study, the plot was prepared to select three quadrants with roots (hereafter, rooted) and another three quadrants without roots (hereafter, rootless). The quadrants (0.4 m × 0.4 m) were randomly arranged and prepared from 15–20 August 2018.
Table 2.
Geographic locations and basic properties of experimental sites.
Fine roots of rubber trees (Hevea brasiliensis) were selected from Mengla County, Yunnan Province, China (Table 2). Rubber trees were arranged 2 m apart in double rows, which were 3 m apart, and each set of double rows was separated by a gap 18 m in width. The fine roots of rubber trees were primarily distributed in the top 0–30 cm soil layer. For this study, a plot was prepared to select the three rootless quadrants and three rooted quadrants. The quadrants (1.2 m × 1.2 m) were randomly arranged and prepared from 5–10 June 2018.
The smooth roots of Spartina alterniflora were selected from Dongtai, Jiangsu Province, China (Table 2). The intertidal zone in the site is suitable for the growth of S. alterniflora. A previous study showed that the smooth roots of Spartina alterniflora easily penetrated the soil profile [50]. The S. alterniflora clump area was 5–30 m2. Small clumps grow sparsely around the external margins of the clump area. Three rooted quadrants (near the clump area) and three rootless quadrants (far away from the clump area) were randomly arranged in a typical plot, and all the quadrants (1.2 m × 1.2 m) were prepared from 8–13 July 2018.
2.2. Dye Tracer Infiltration
The eighteen quadrats at the three sites were prepared to conduct eighteen dye tracer experiments. A stainless-steel hollow cylinder (single ring infiltrationmeter; diameter, 0.2 m; height, 0.3 m) was placed in each quadrant. The cylinder was slowly driven into the soil using a rubber hammer and the depths of the bottom cylinder edges into the soil were 0.10 m. The side walls and edges of the cylinder were compacted carefully to ensure that they are watertight. Each cylinder was filled with enough water dye solution containing 4.0 g L−1 Brilliant Blue FCF dye tracer to visualize the water flow path and distribution pattern [52]. The water head was kept 5.0 cm during the infiltration experiment. A steady-state flow was assumed when constant infiltration was recorded for three consecutive measurements taken at 5 min intervals, and the last three measurements were used to calculate the steady-state infiltration rate (Is) [53]. The field hydraulic conductivity of the saturated soil (Ks cm s−1) was calculated using the steady state infiltration rate (Is, 10 °C) in accordance with the following equation [54]:
where Is (cm3 s−1) is the quasi-steady state infiltration rate, Rs (cm) is the radius of the inner ring, H (cm) is the steady depth of ponded water in the ring, a is the radius of the inner cylinder in cm, d (cm) is the depth of insertion of the cylinder into the soil, C1 and C2 are dimensionless quasi-empirical constants, and α is the soil macroscopic capillary length. In this research a, d, and α were 10 cm, 5 cm, and 0.12 cm−1, respectively. The constants C1 and C2 were 0.316π and 0.184π, respectively, for d ≥ 3 cm and H ≥ 5 cm [55]. The value of H for each run was calculated from the final filling event as the average between the highest water level and the lowest water level, which was fixed to 5 cm.
Twenty-four hours after the end of infiltration experiment, vertical soil sections of 70 cm (width) × 60 cm (depth) were carefully excavated from the center of the cylinder to produce photograph of dye-stained soil sections with the help of calibrated frames, a digital camera, black umbrella, and so on. Detailed information on the measurement of dye tracer infiltration is provided by Jiang [50].
2.3. Soil Physical Properties
Soil physical properties were measured using bulk soil samples (100 cm3) [56,57]. The initial gravimetric water content and bulk density were determined as per Jiang [50].
The weights of the empty cutting cylinder and the cutting cylinder containing wet soil were recorded as WHCR and WCRWS, respectively. The weight of the cutting cylinder containing dry soil (WCRDS, g) was measured after oven drying at 105 °C for 24 h. The initial gravimetric water content was measured using the 105 °C dried soil samples. Detailed information on the measurement of soil physical properties is provided by Jiang [50]. The soil particle size distribution was determined by laser granulometry (Mastersizer E, Malvern) [58].
2.4. HYDRUS-1D Modeling
HYDRUS-1D was used to simulate soil water infiltration, volumetric water content, and soil water pressure head in a three-dimensional model of the variable soil water saturation [20]. The van Genuchten–Mualem model [59,60] was used to simulate the variation in K(h) with volumetric water content in which:
where Se is effective saturation:
and where θs is the saturated water content (cm3 cm−3); θr is the residual water content (cm3 cm−3); Ks is the saturated hydraulic conductivity (cm min−1); α is the air entry parameter (cm−1); n is the pore size distribution parameter; and l is the pore connectivity parameter. Parameters α, n, and l are empirical coefficients that determine the shape of hydraulic functions. The model required to specify the hydraulic parameters θr, θs, α, n, and l was run, and we estimated these parameters using Rosetta [61]. Data and estimated parameters are presented in Table 3. The simulation was run with time steps in minutes, and the model was used to simulate soil water movement processes in the 0–100 cm soil layers of the experimental plots. The maximum rooting depth of different plants was 25 cm. The upper boundary was selected as the constant pressure head (h = 10 cm). At Minqin and Mengla sites, the lower boundary was set as free drainage conditions because of the deep soil of the study sites, where the water table is considerably deeper than the domain of interest. However, the lower boundary was set as variable pressure head at the Dongtai site because the water table is approximately 1 m deep.
Table 3.
Soil hydraulic parameters for the van Genuchten–Mualem model [60].
2.5. Statistical Analysis
All data were checked for normal distribution and homogeneity of variances via the Kolmogorov–Smirnov test and Levene’s test, respectively. A log transformation or square root transformation was performed when the assumptions were not met. A t-test was applied to assess the effects of roots on dye infiltration parameters and soil physical properties; if it is not marked, it indicates no significance. The contour maps were drawn using Golden Software Surfer 12 (Golden software Inc., Golden, CO, USA).
3. Results
3.1. Soil Water Distribution Patterns and Soil Hydraulic Conductivity
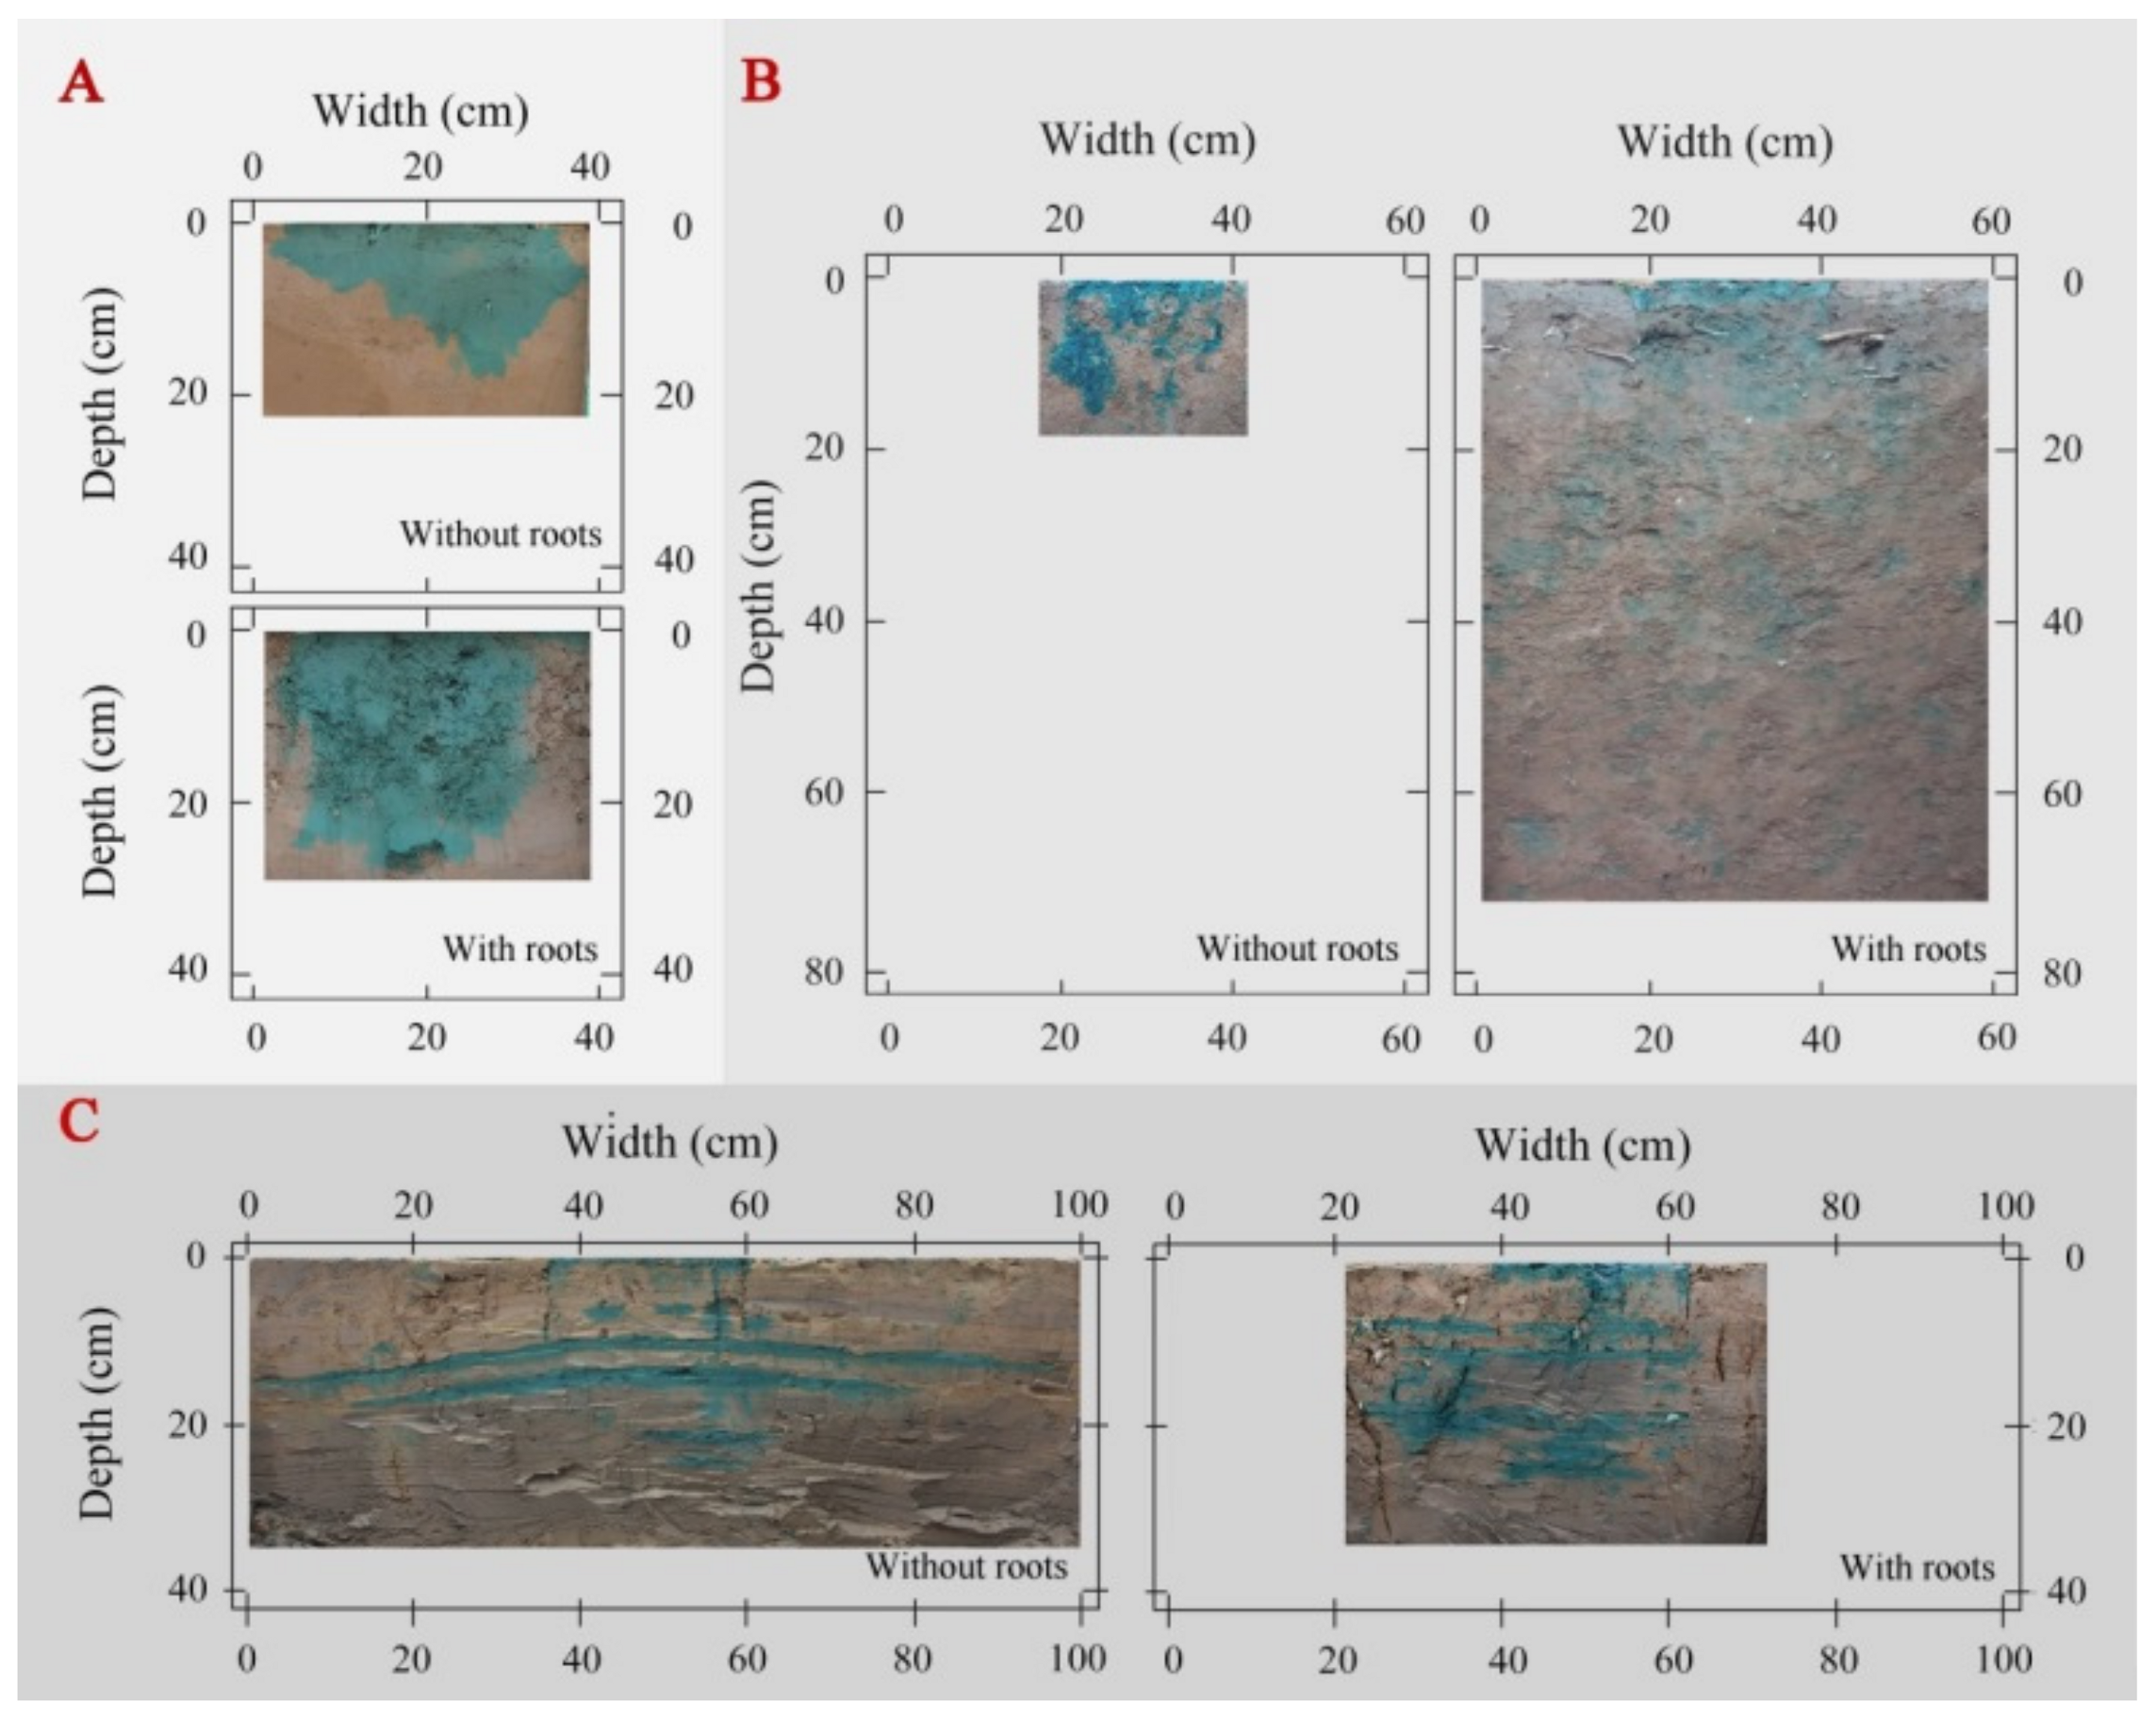
The fibrous roots from maize crops promoted an even water flow across the plough layer of Minqin site (Figure 1A), especially the total dye-stained area increased by 43% in the rooted soil compared to the rootless soil plots, and the Ks increased by 259% (Table 4). However, at the Mengla site, the dye-stained areas were randomly scattered in the soil profile, with infiltration time and water penetration higher at Mengla compared to those at Minqin (Figure 1B). Here, the total stained area and the Ks were 98% and 101% higher in the rooted soil plot than the rootless plot, respectively (Table 4). Finally, the smooth roots of Spartina alterniflora induced water penetration through the muddy layer of the Dongtai site, which had a low permeability. The total stained area and Ks increased by 32% and 157%, respectively, in the rooted soil plot than the rootless plot of the Dongtai site (Table 4).

Figure 1.
Soil water distribution patterns were significantly affected by the fibrous roots of maize (A), the fine roots of rubber (B), and the smooth roots of Spartina alterniflora (C) [50].
Table 4.
Effects of roots on the measured parameters (mean ± SE, n = 3) [50].
3.2. Effects of Maize Fibrous Roots on Soil Water Infiltration
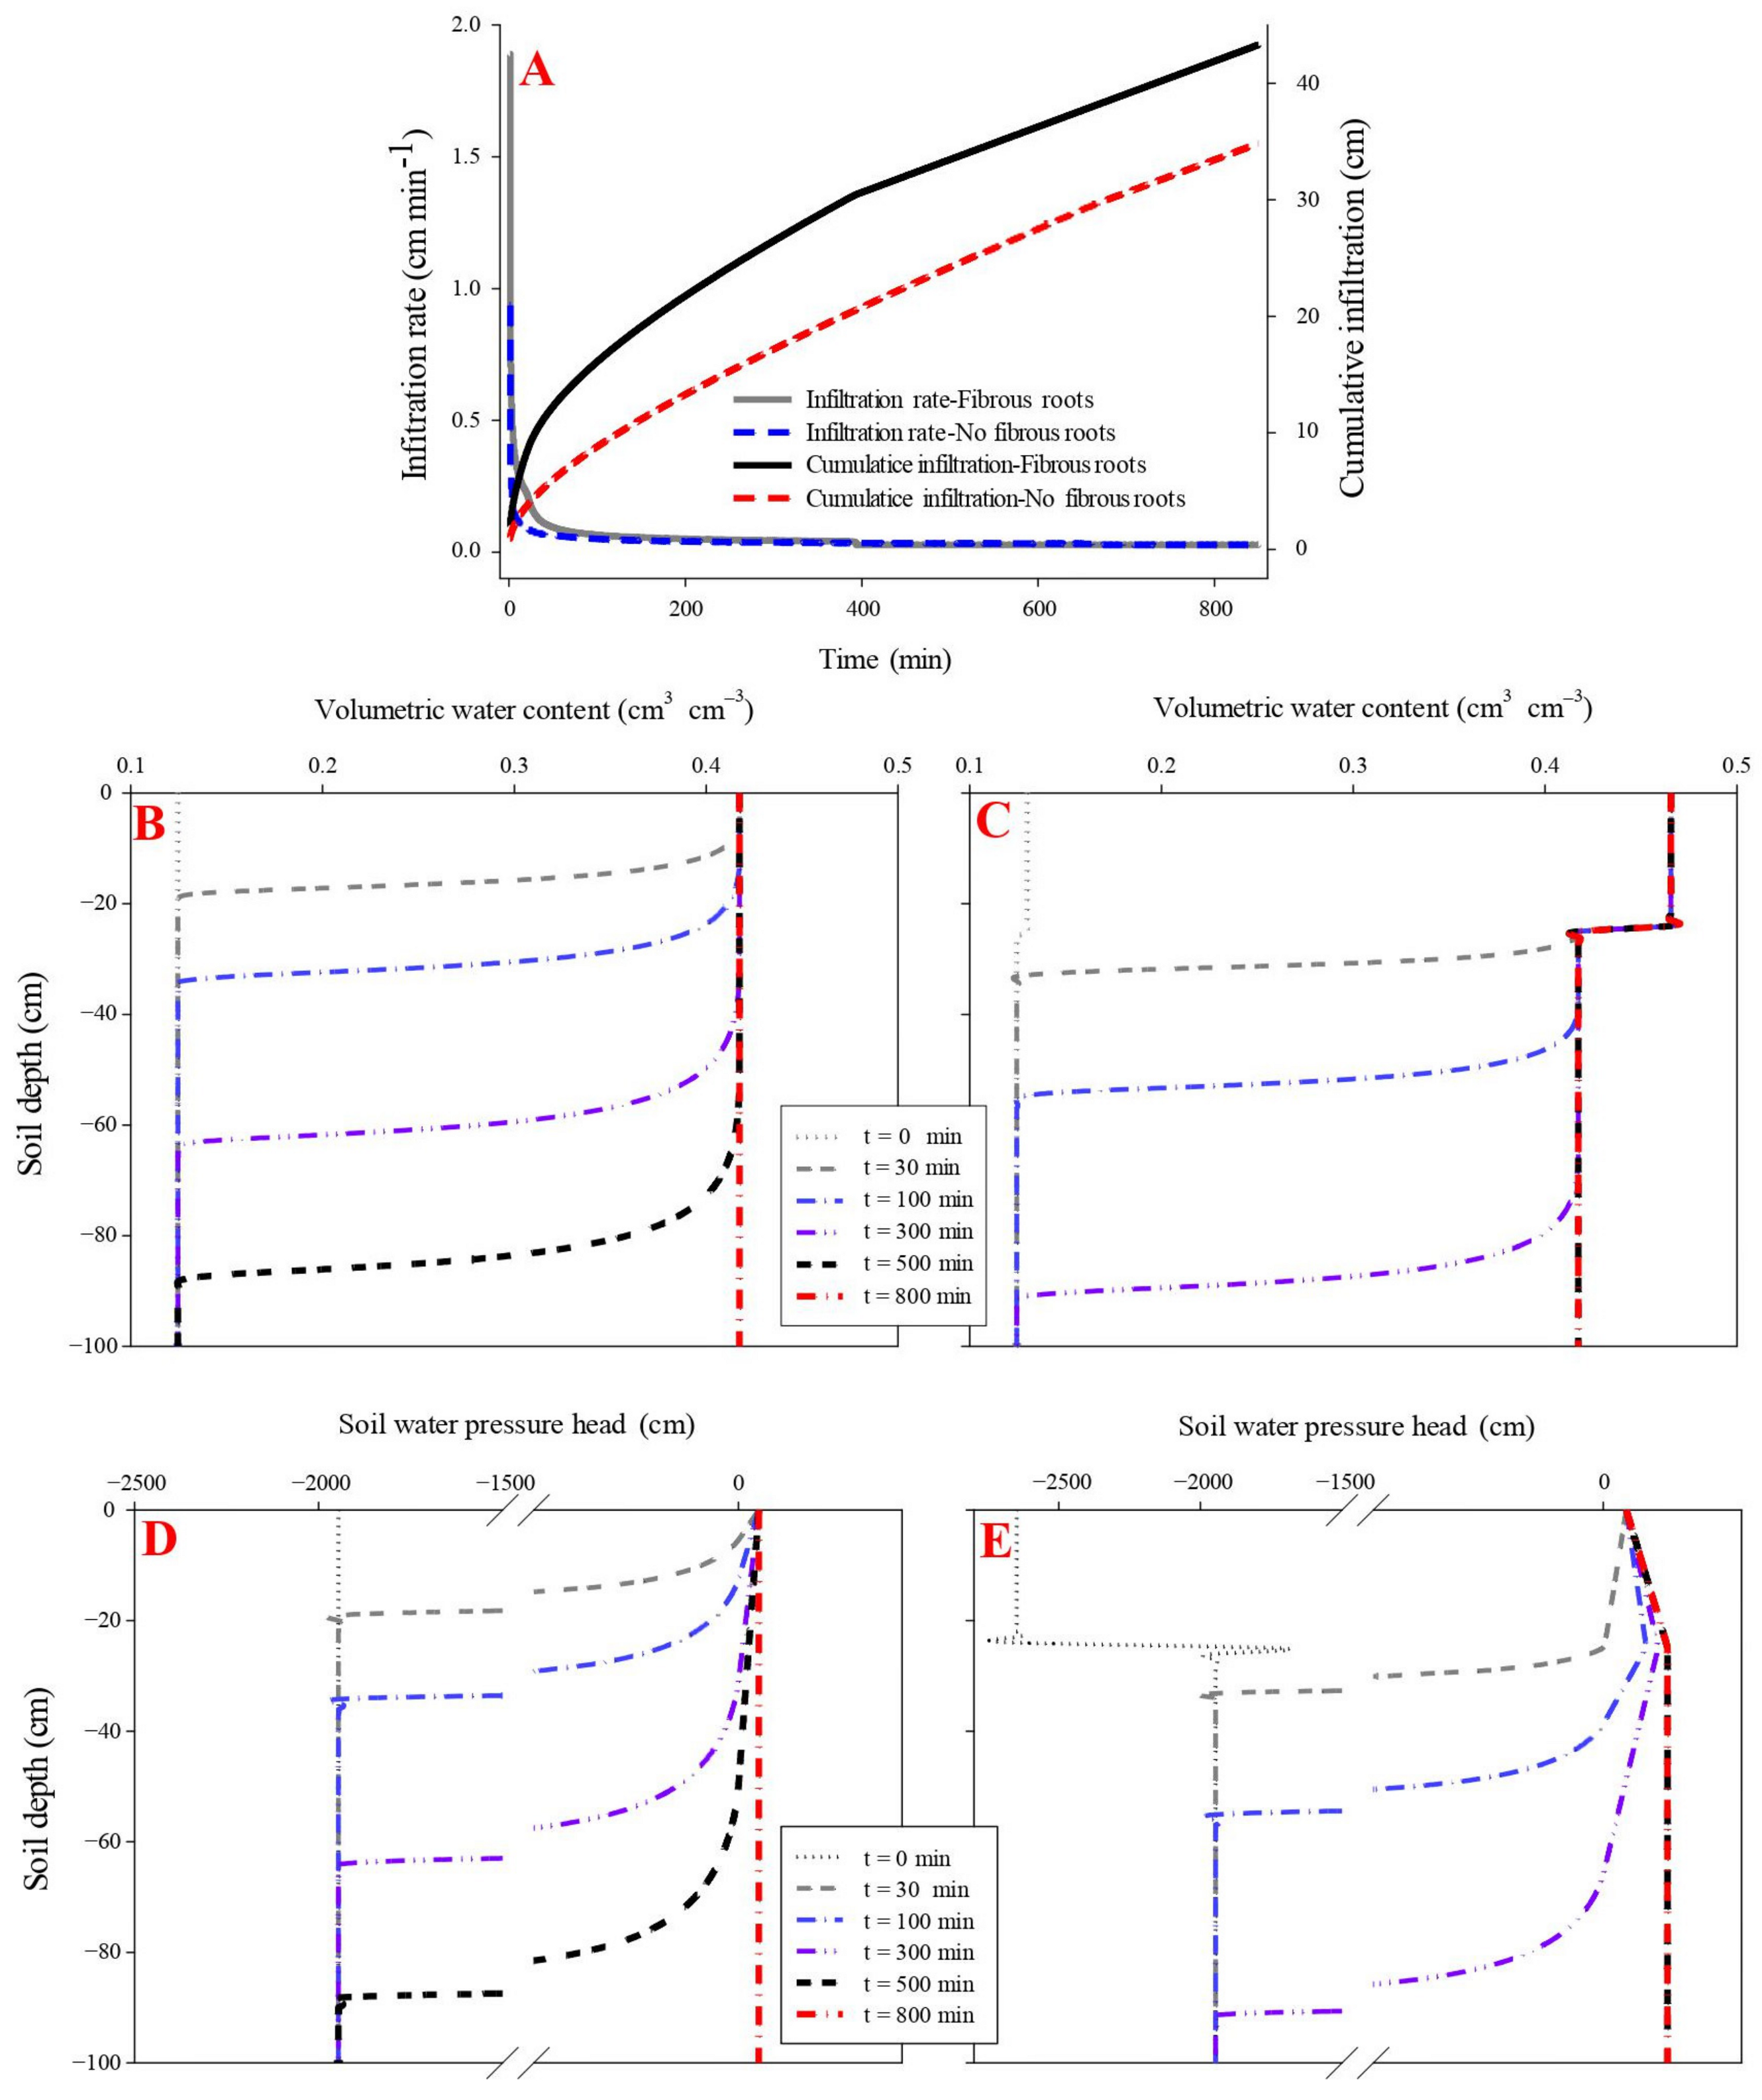
The influence of fibrous roots on soil water infiltration was evaluated using parameters including initial infiltration rate, cumulative infiltration, propagation time of the wetting front, and water pressure head. The initial infiltration rate was higher in the maize fibrous-rooted soil (1.89 cm min−1) than the rootless soil (0.94 cm min−1) (p < 0.05), while the two soils had a similar final infiltration rate of 0.28 cm min−1.
The propagation time of the wetting front across the soil profile was 600 min in the rootless soil and 500 min in the rooted soil, under cumulative infiltrations of 41.9 cm and 33.4 cm, respectively (Figure 2 and Figure 3) (p < 0.05). The soil infiltration saturation time was 700 min in the rootless soil profile, and 600 min in the rooted soil (Figure 2 and Figure 3). As expected, the top soil layer (0–25 cm, SWC = 0.47 cm3 cm−3) saturated after 30 min infiltration in the vertical rooted soil profile, followed by the deeper layers (>25 cm, SWC = 0.42 cm3 cm−3) after 600 min infiltration.

Figure 2.
Effect of fibrous roots of maize on infiltration (A). (B,D) shows the dynamic variation in volumetric water content and soil water pressure head in the soil profile without fibrous maize roots. (C,E) shows the dynamic variation in volumetric water content and soil water pressure head in the soil profile with fibrous maize roots.
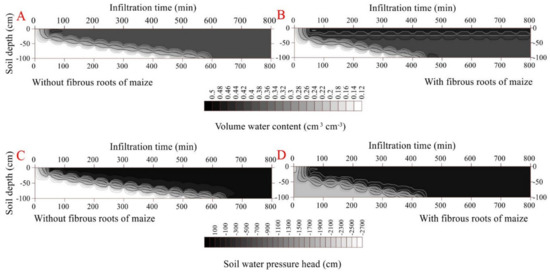
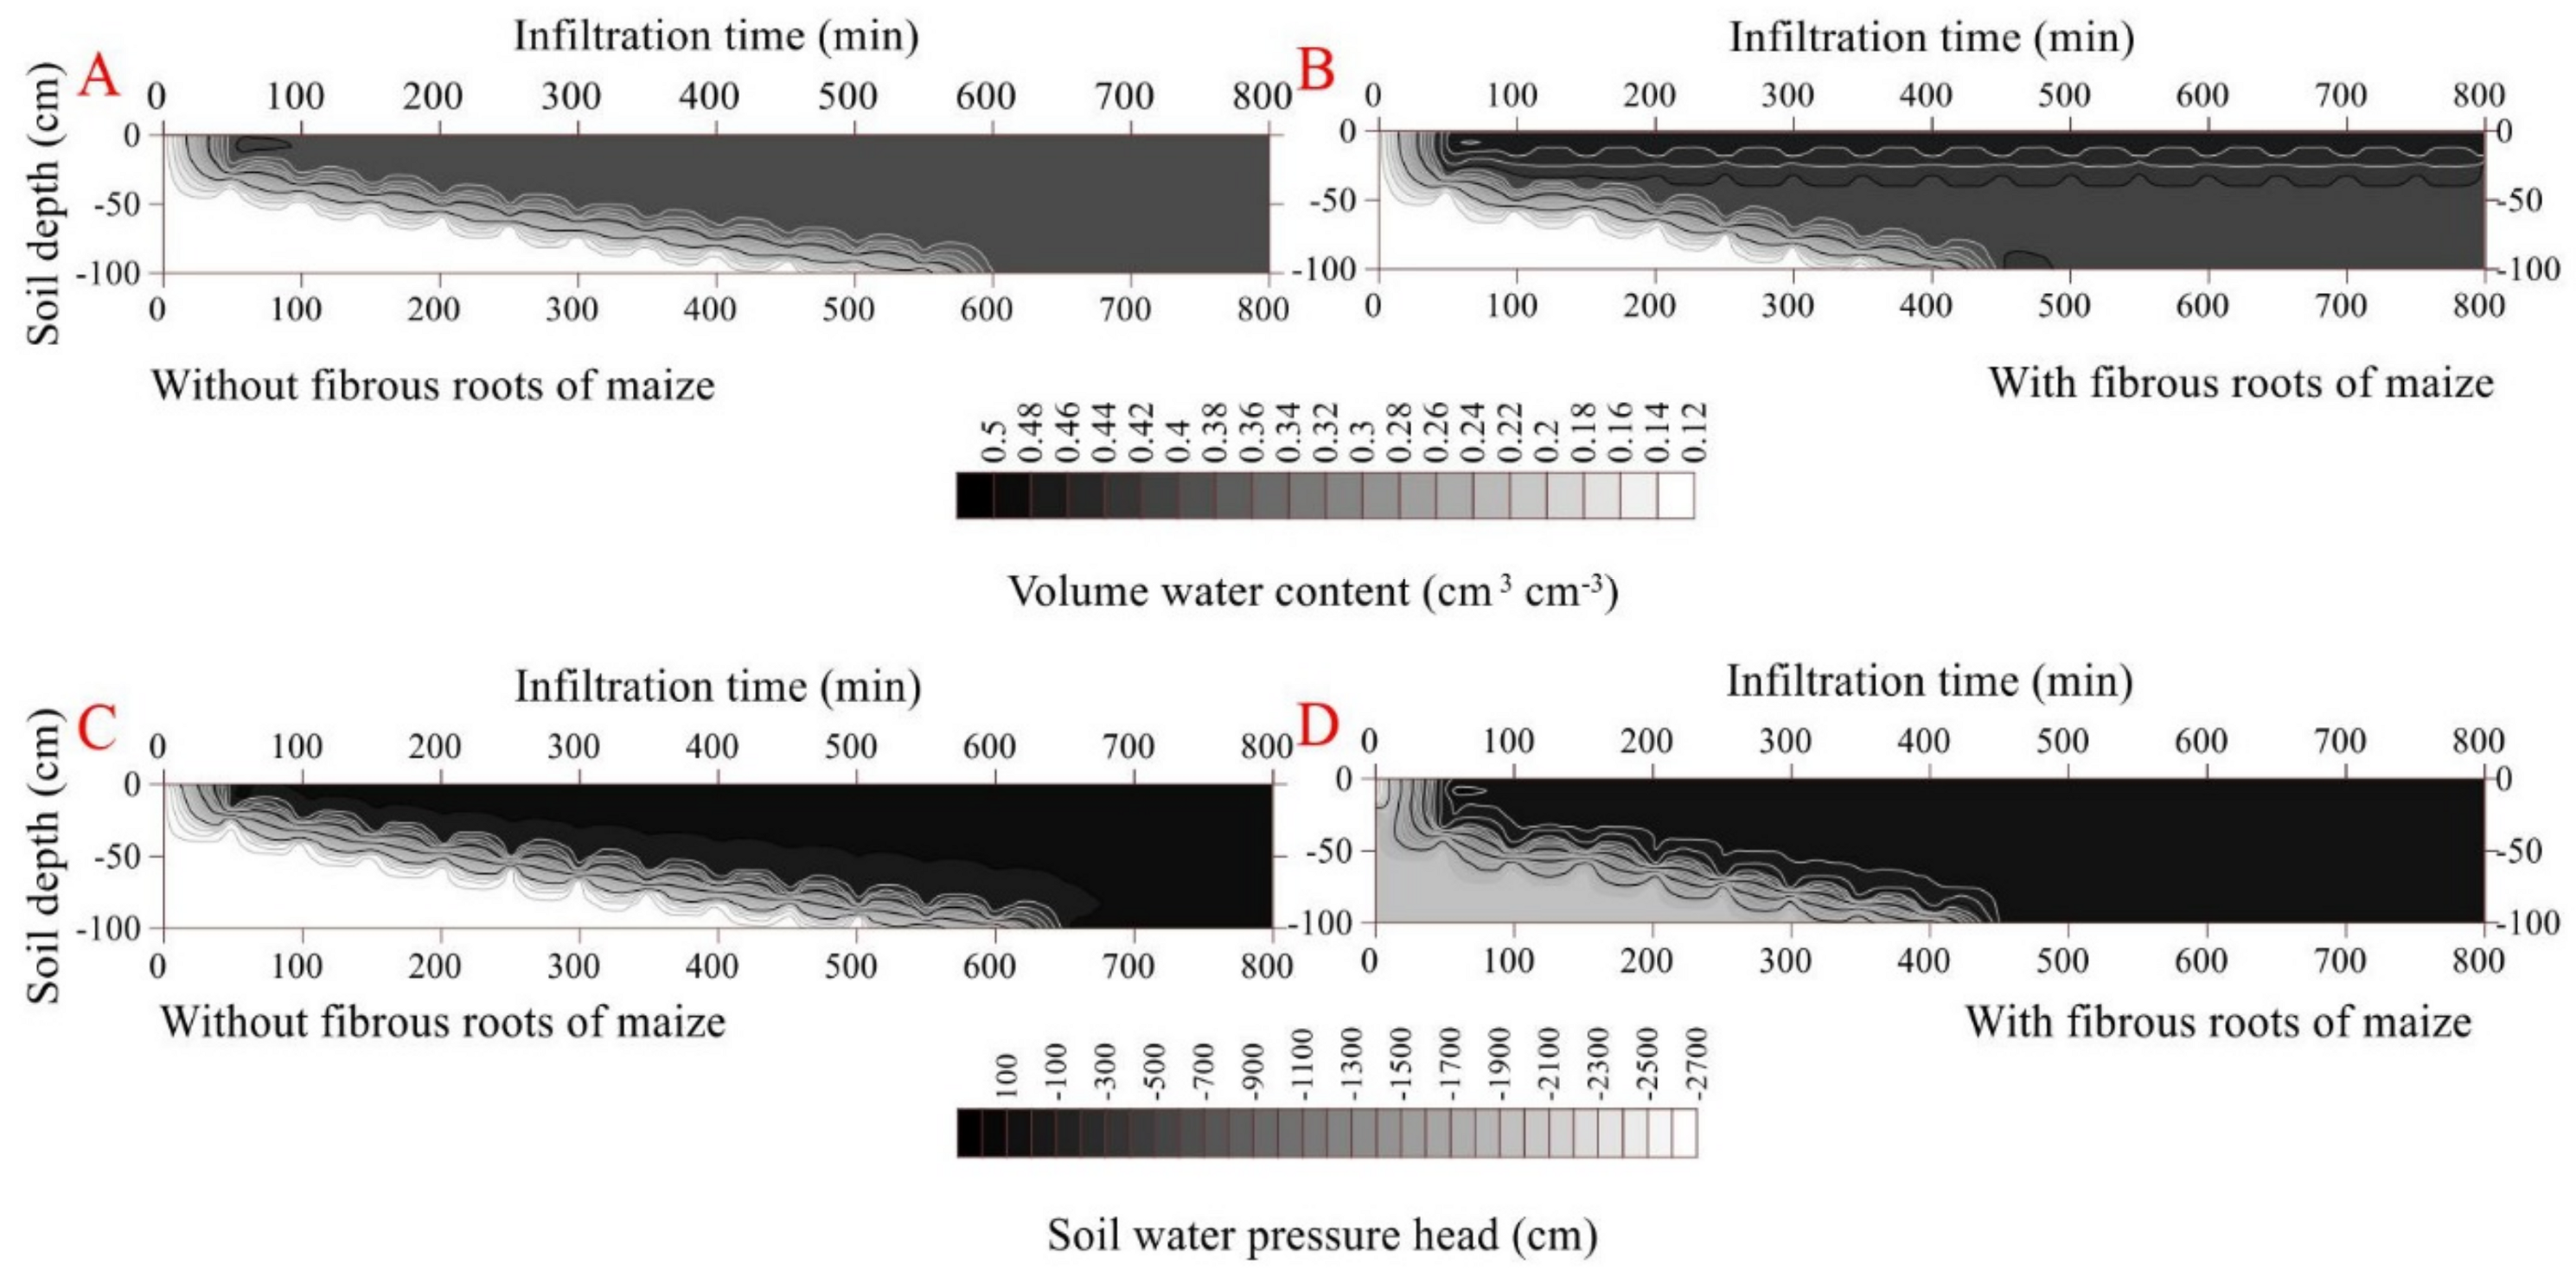
Figure 3.
Dynamic characteristics of volumetric water content and soil water pressure head as a function of infiltration time in the soil profile without fibrous maize roots (A,C). Dynamic characteristics of volumetric water content and soil water pressure head as a function of infiltration time in the soil profile with fibrous maize roots (B,D).
The soil water pressure head rapidly increased with the downward movement of the wetting front. This phenomenon was particularly pronounced in the fibrous-rooted soil profile. At the beginning of the infiltration, the soil water pressure head was lower at the surface soil (0–25 cm) layer of the rooted soil than the rootless soil. The pressure head increased faster during infiltration in the rooted soil compared to the rootless soil (Figure 2 and Figure 3), and then remained constant at 10 cm in the rootless soil after 800 min infiltration. The soil water pressure head was different between the top soil (0–25 cm) and the deep soil (25–100 cm) layers of the rooted soil, with soil water pressure head of 10 cm and 28 cm at the top soil and the deep soil layer, respectively (Figure 2 and Figure 3).
3.3. Effects of Rubber Fine Roots on Soil Water Infiltration
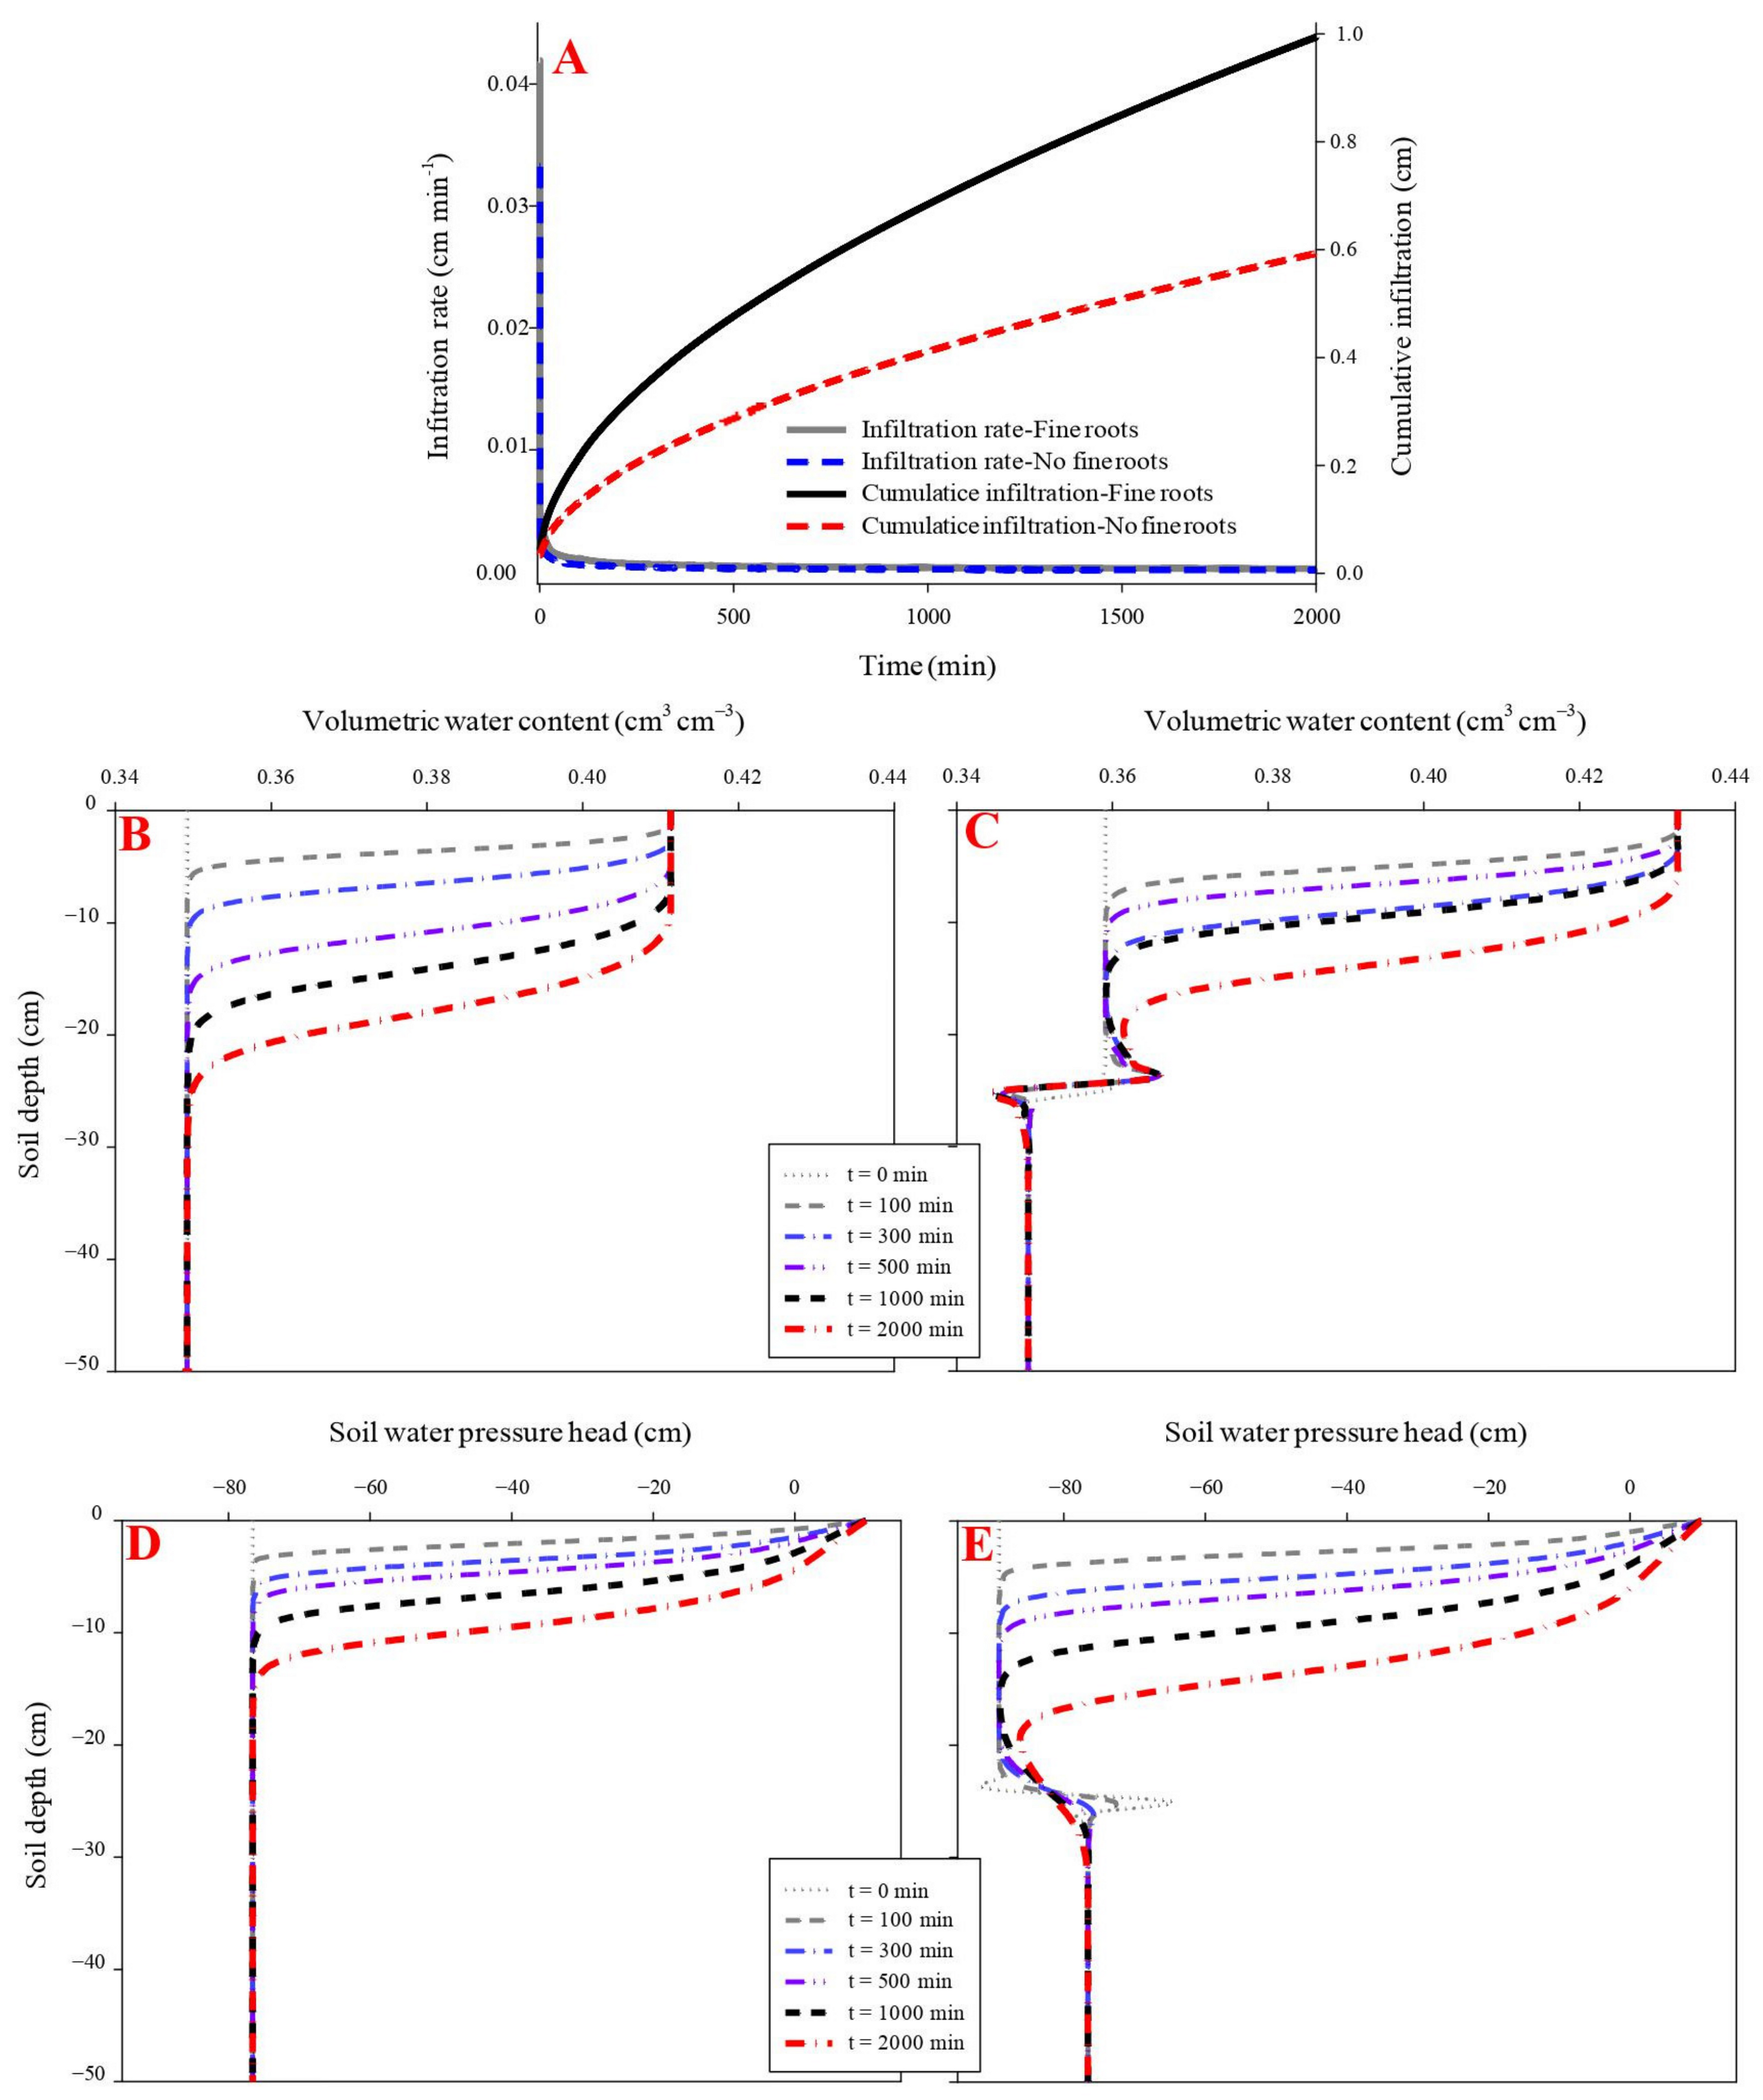
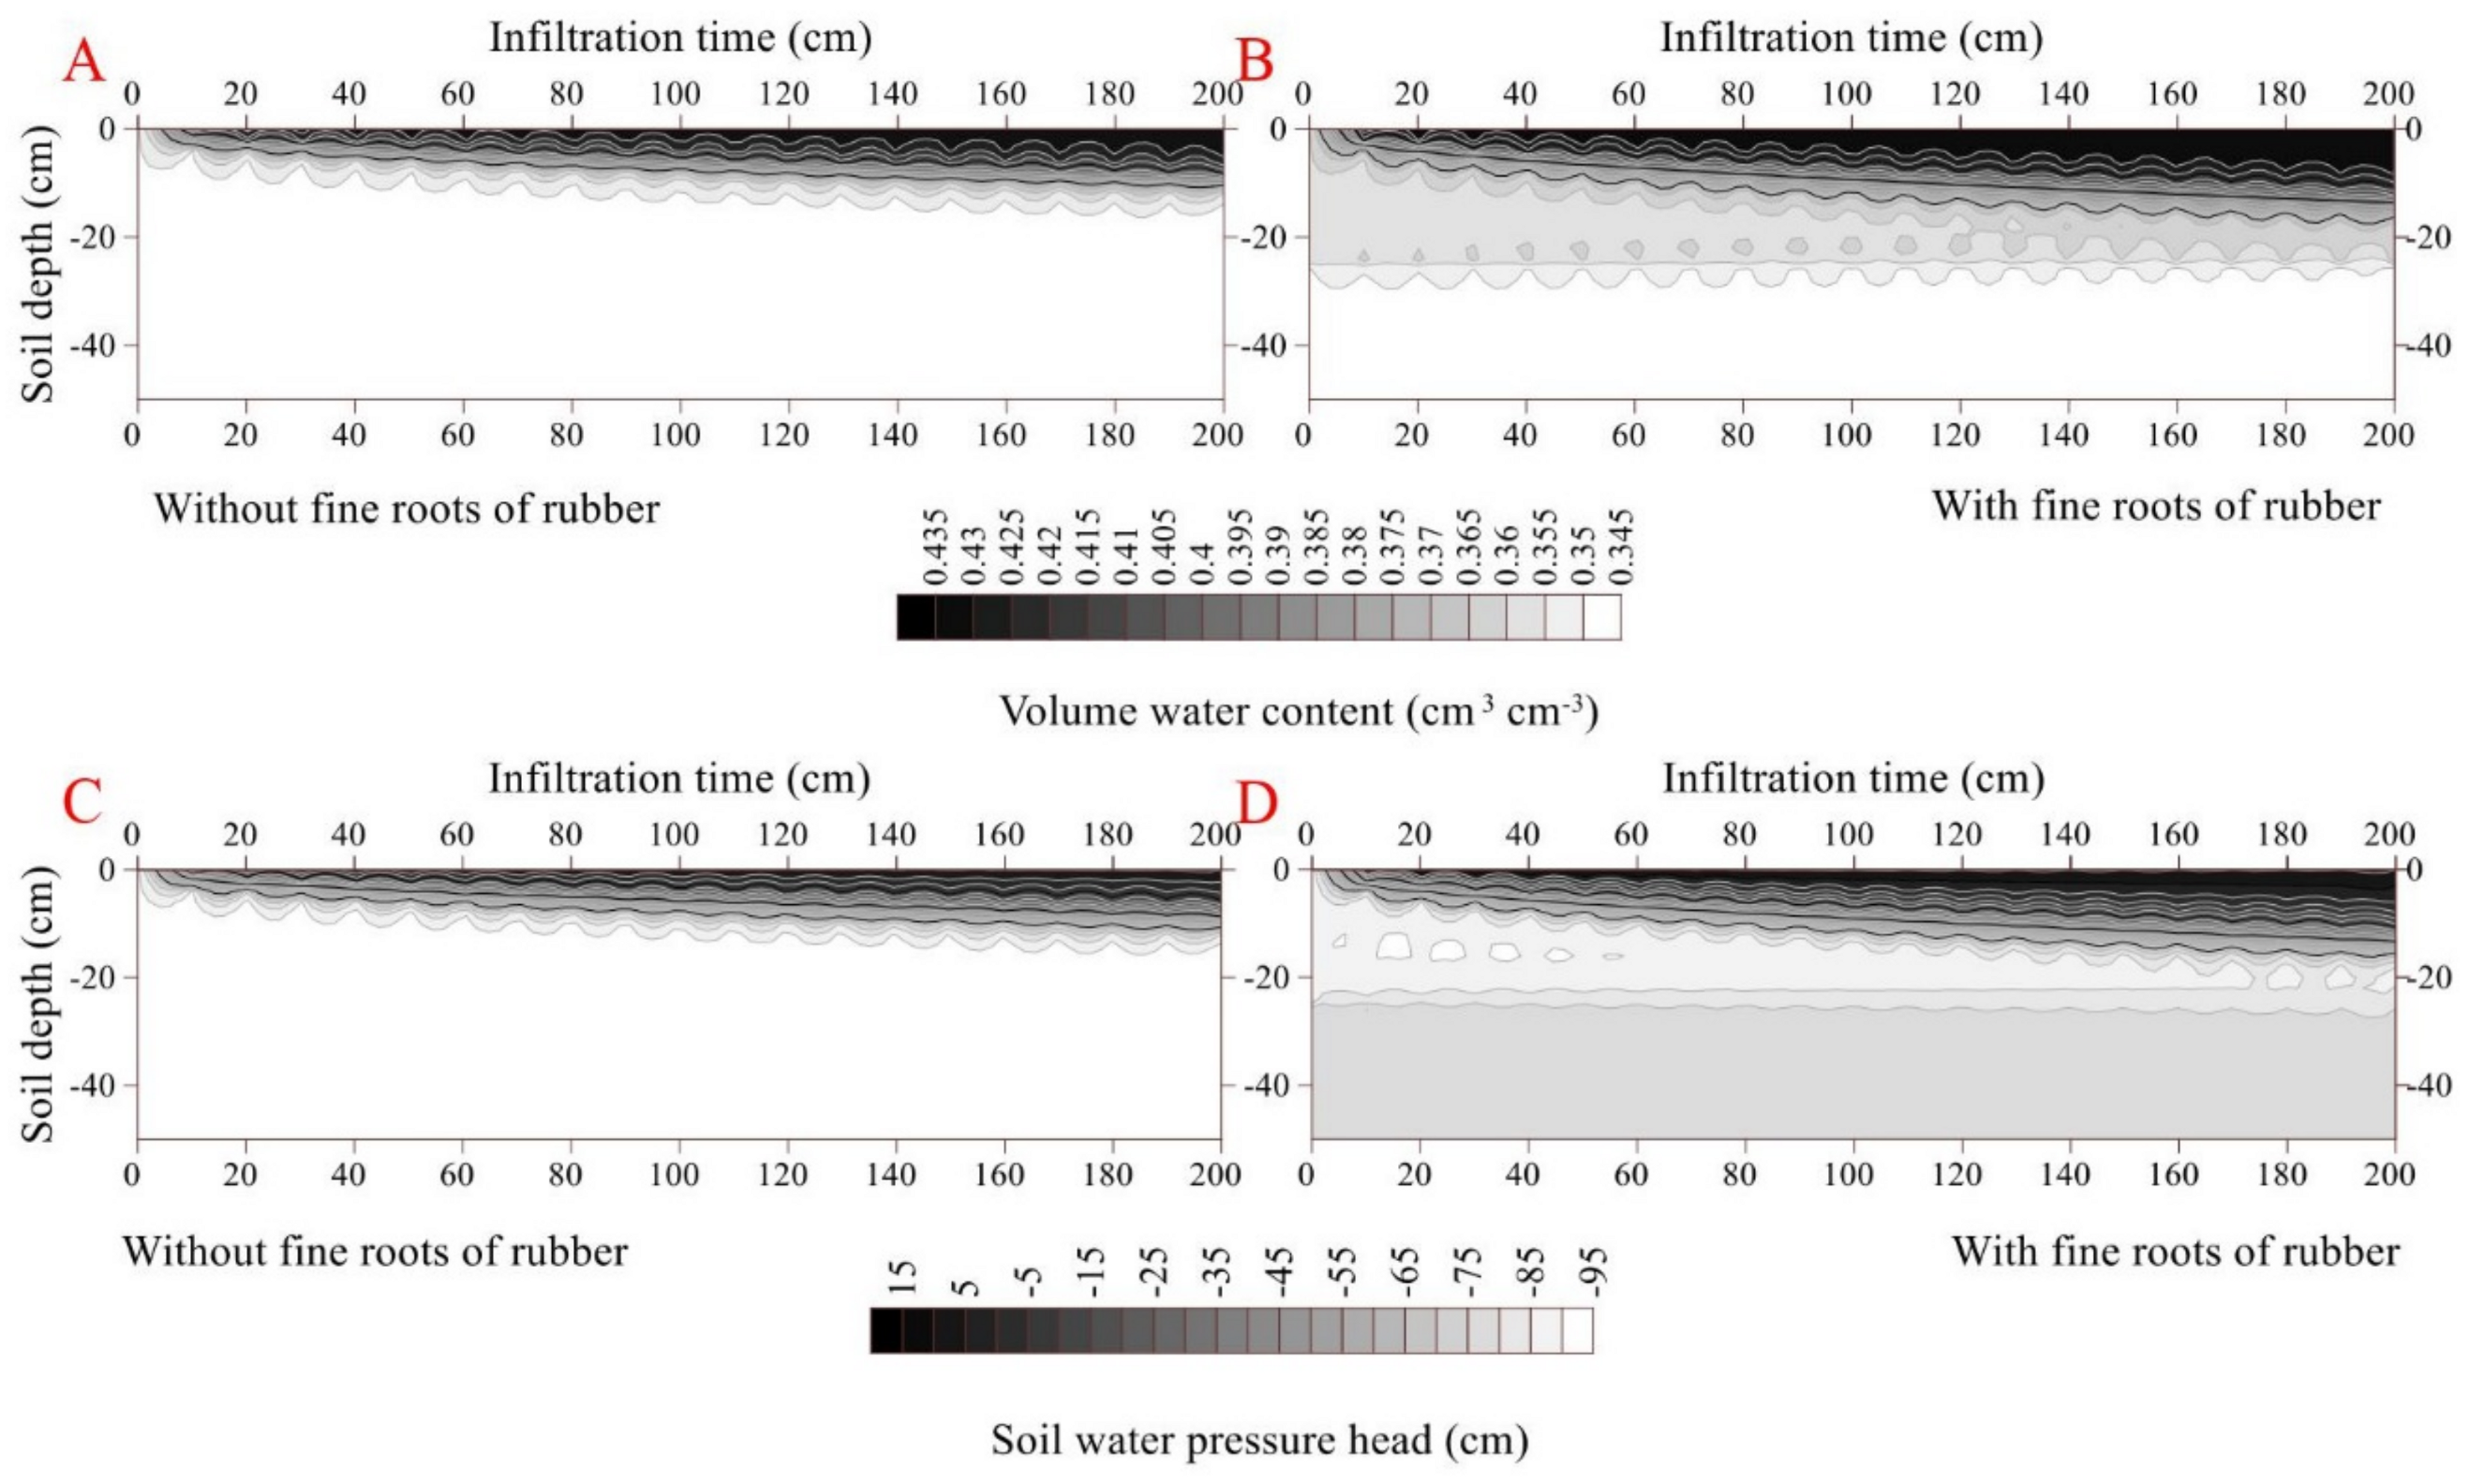
The initial and final infiltration rates were higher in the rubber fine-rooted soil (0.04 cm min−1 and 0.0003 cm min−1, respectively) than the rootless soil (0.03 cm min−1 and 0.0002 cm min−1, respectively) (p < 0.05). Similarly, the cumulative infiltration was higher in the fine-rooted soil (0.99 cm) than the rootless soil (0.59 cm) (Figure 4). In the fine-rooted soil, a saturation zone (0.43 cm3 cm−3) occurred in the top layer (0–2 cm) at the infiltration time of 100 min, and the downward movement of the saturation zone was very slow, since only the 0–8 cm soil layer was saturated at the infiltration time of 2000 min. Moreover, the downward movement of the wetting front remained uniform and slow in the vertical profile of the rootless soil (Figure 4 and Figure 5), and only the top soil layer (0–5 cm) was saturated (0.41 cm3 cm−3) at the infiltration time of 2000 min. The soil water pressure head changed from negative to positive over the infiltration time of 0 min to 2000 min in the saturation zones of the fine-rooted and rootless soil profiles (Figure 4 and Figure 5).
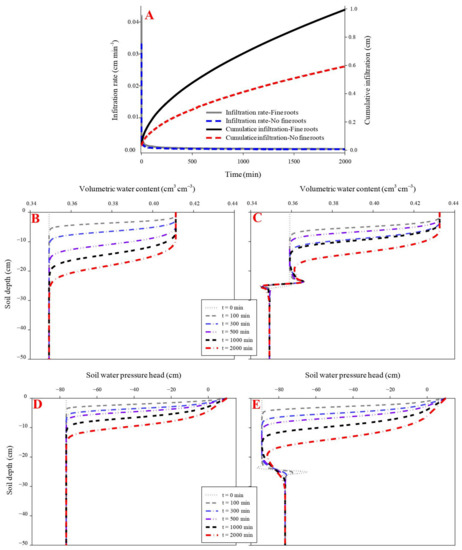
Figure 4.
Effect of fine roots of rubber trees on infiltration (A). (B,D) shows the dynamic variation in volumetric water content and soil water pressure head in the soil profile without fibrous maize roots. (C,E) shows the dynamic variation in volumetric water content and soil water pressure head in the soil profile with fine rubber roots.
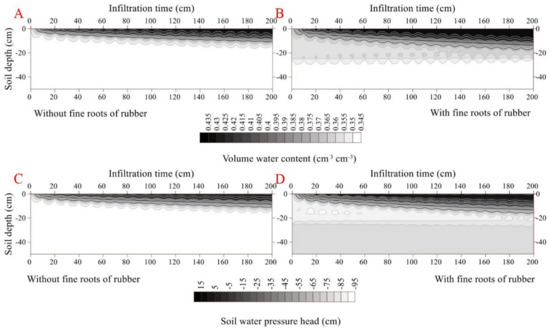
Figure 5.
Dynamic characteristics of volumetric water content and soil water pressure head as a function of infiltration time in the soil profile without fine rubber roots (A,C). Dynamic characteristics of volumetric water content and soil water pressure head as a function of infiltration time in the soil profile with fine rubber roots (B,D).
3.4. Effects of S. alterniflora Smooth Roots on Soil Water Infiltration
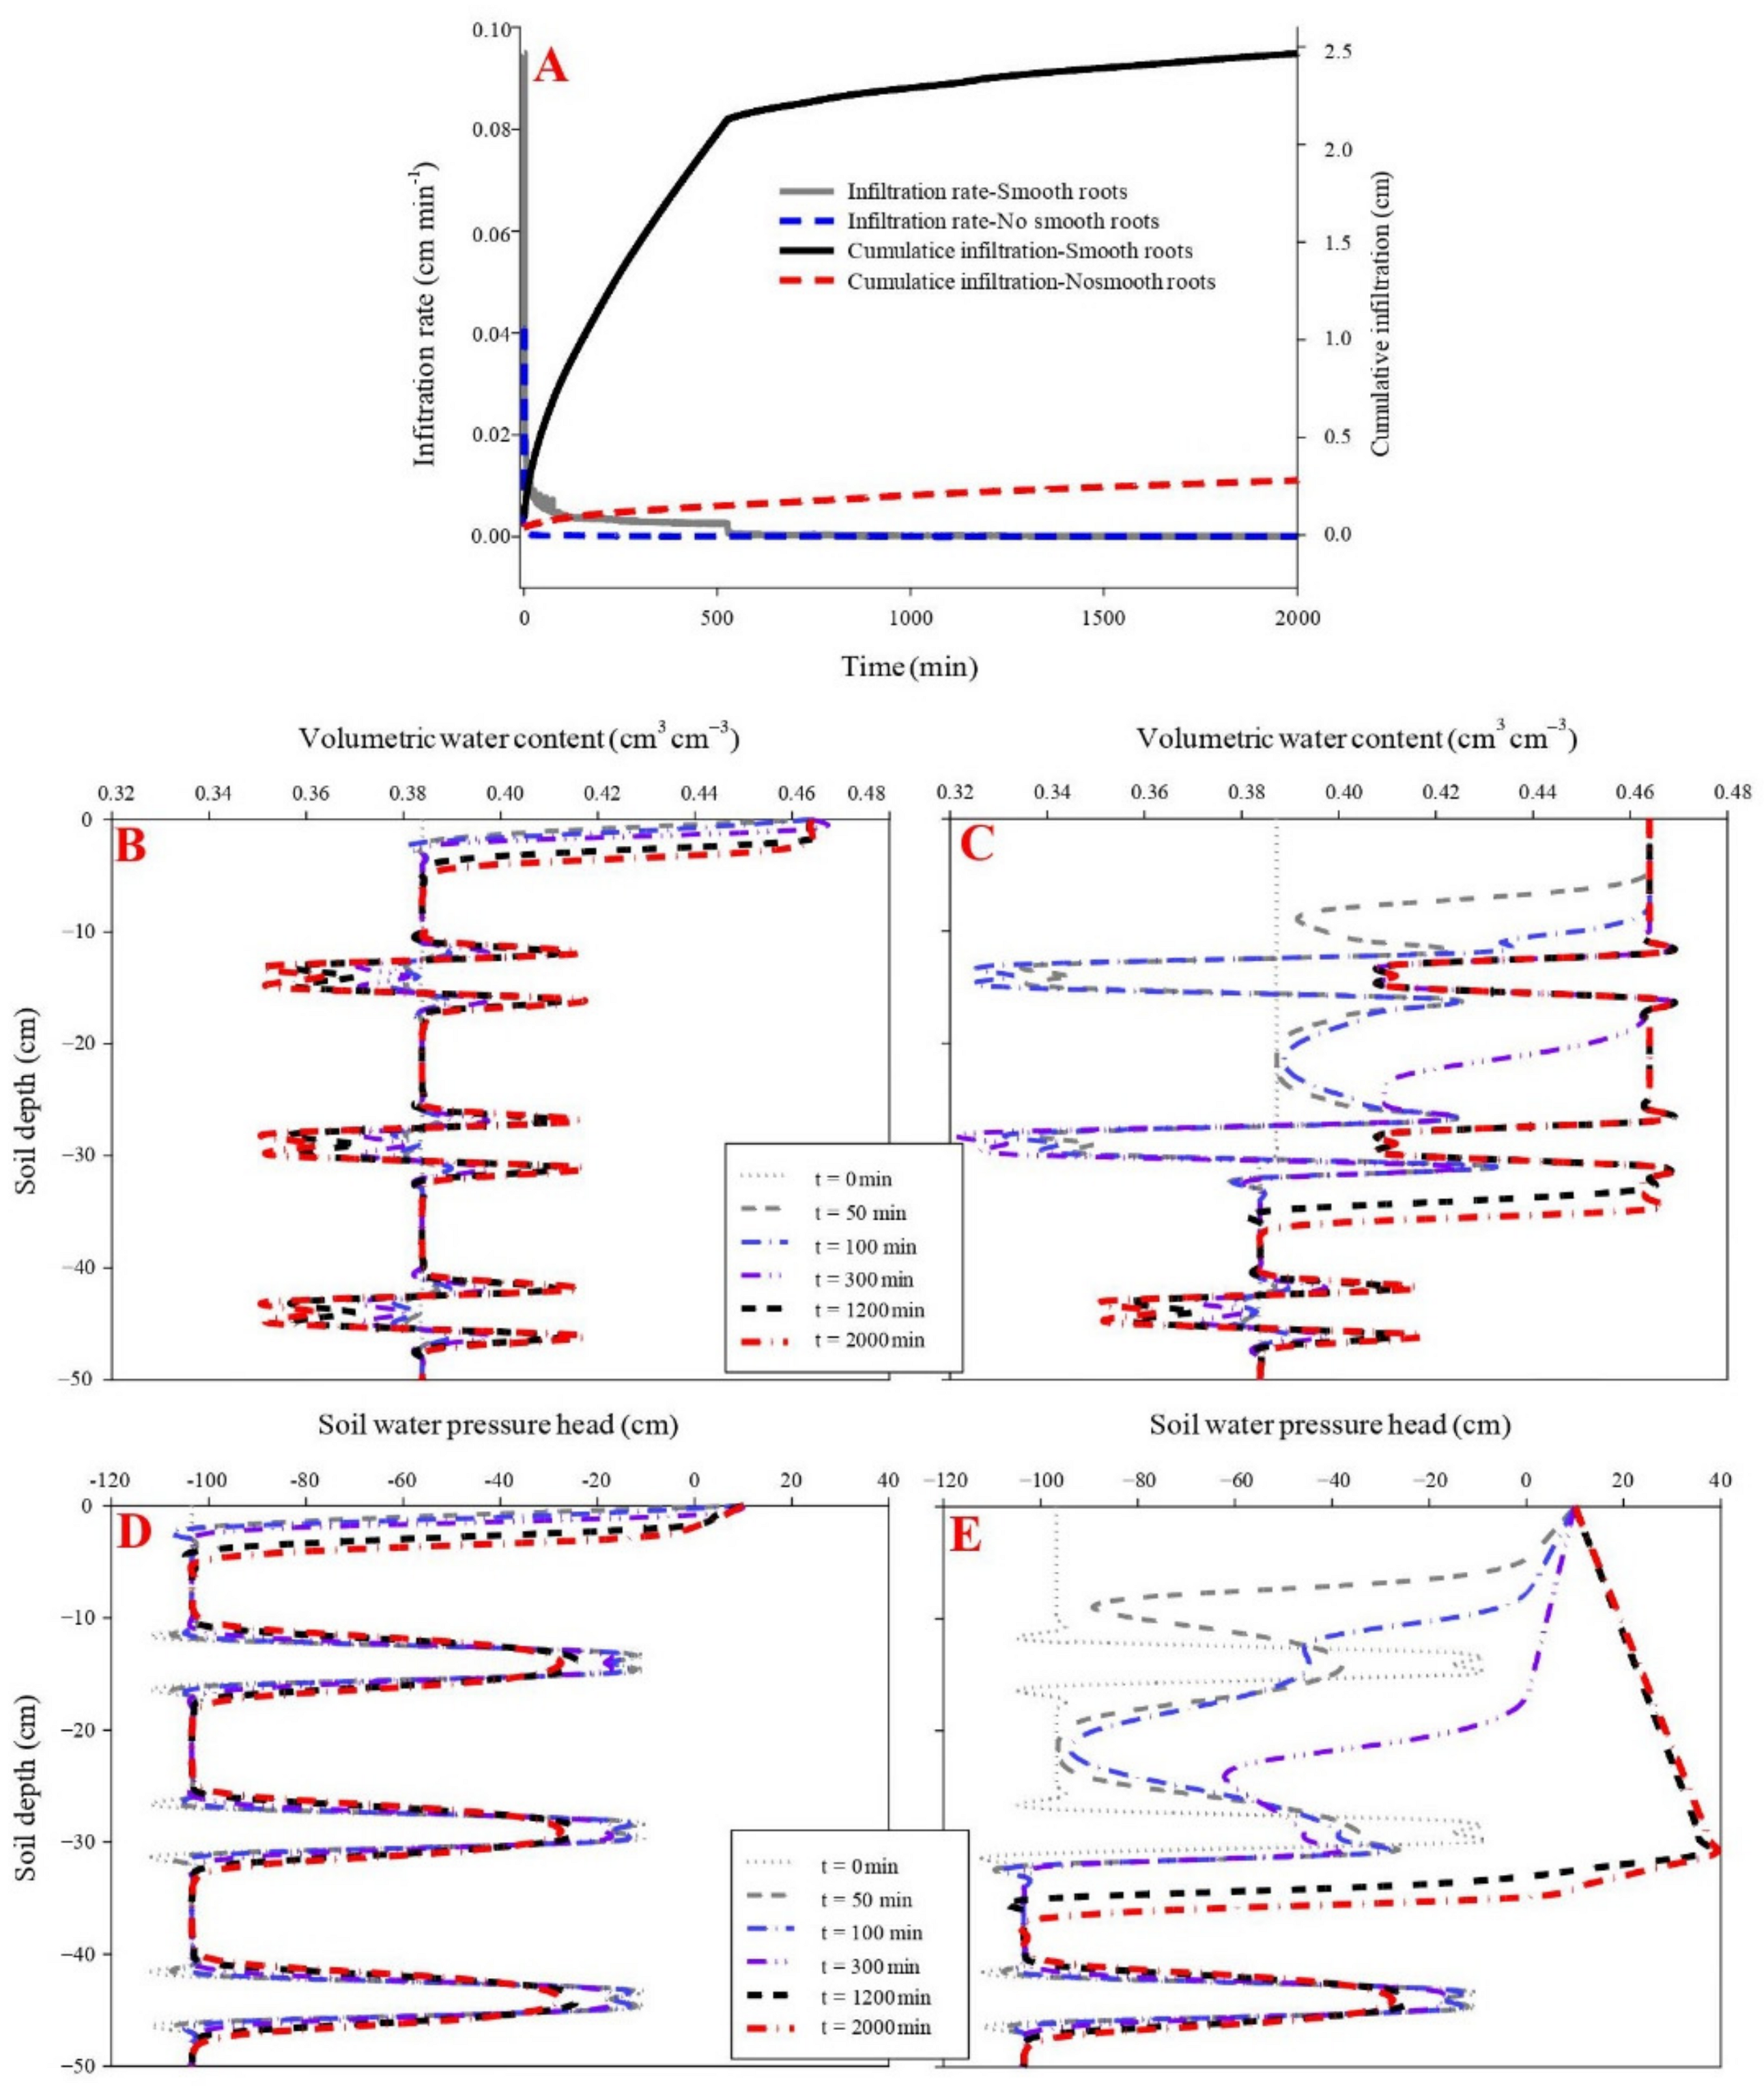
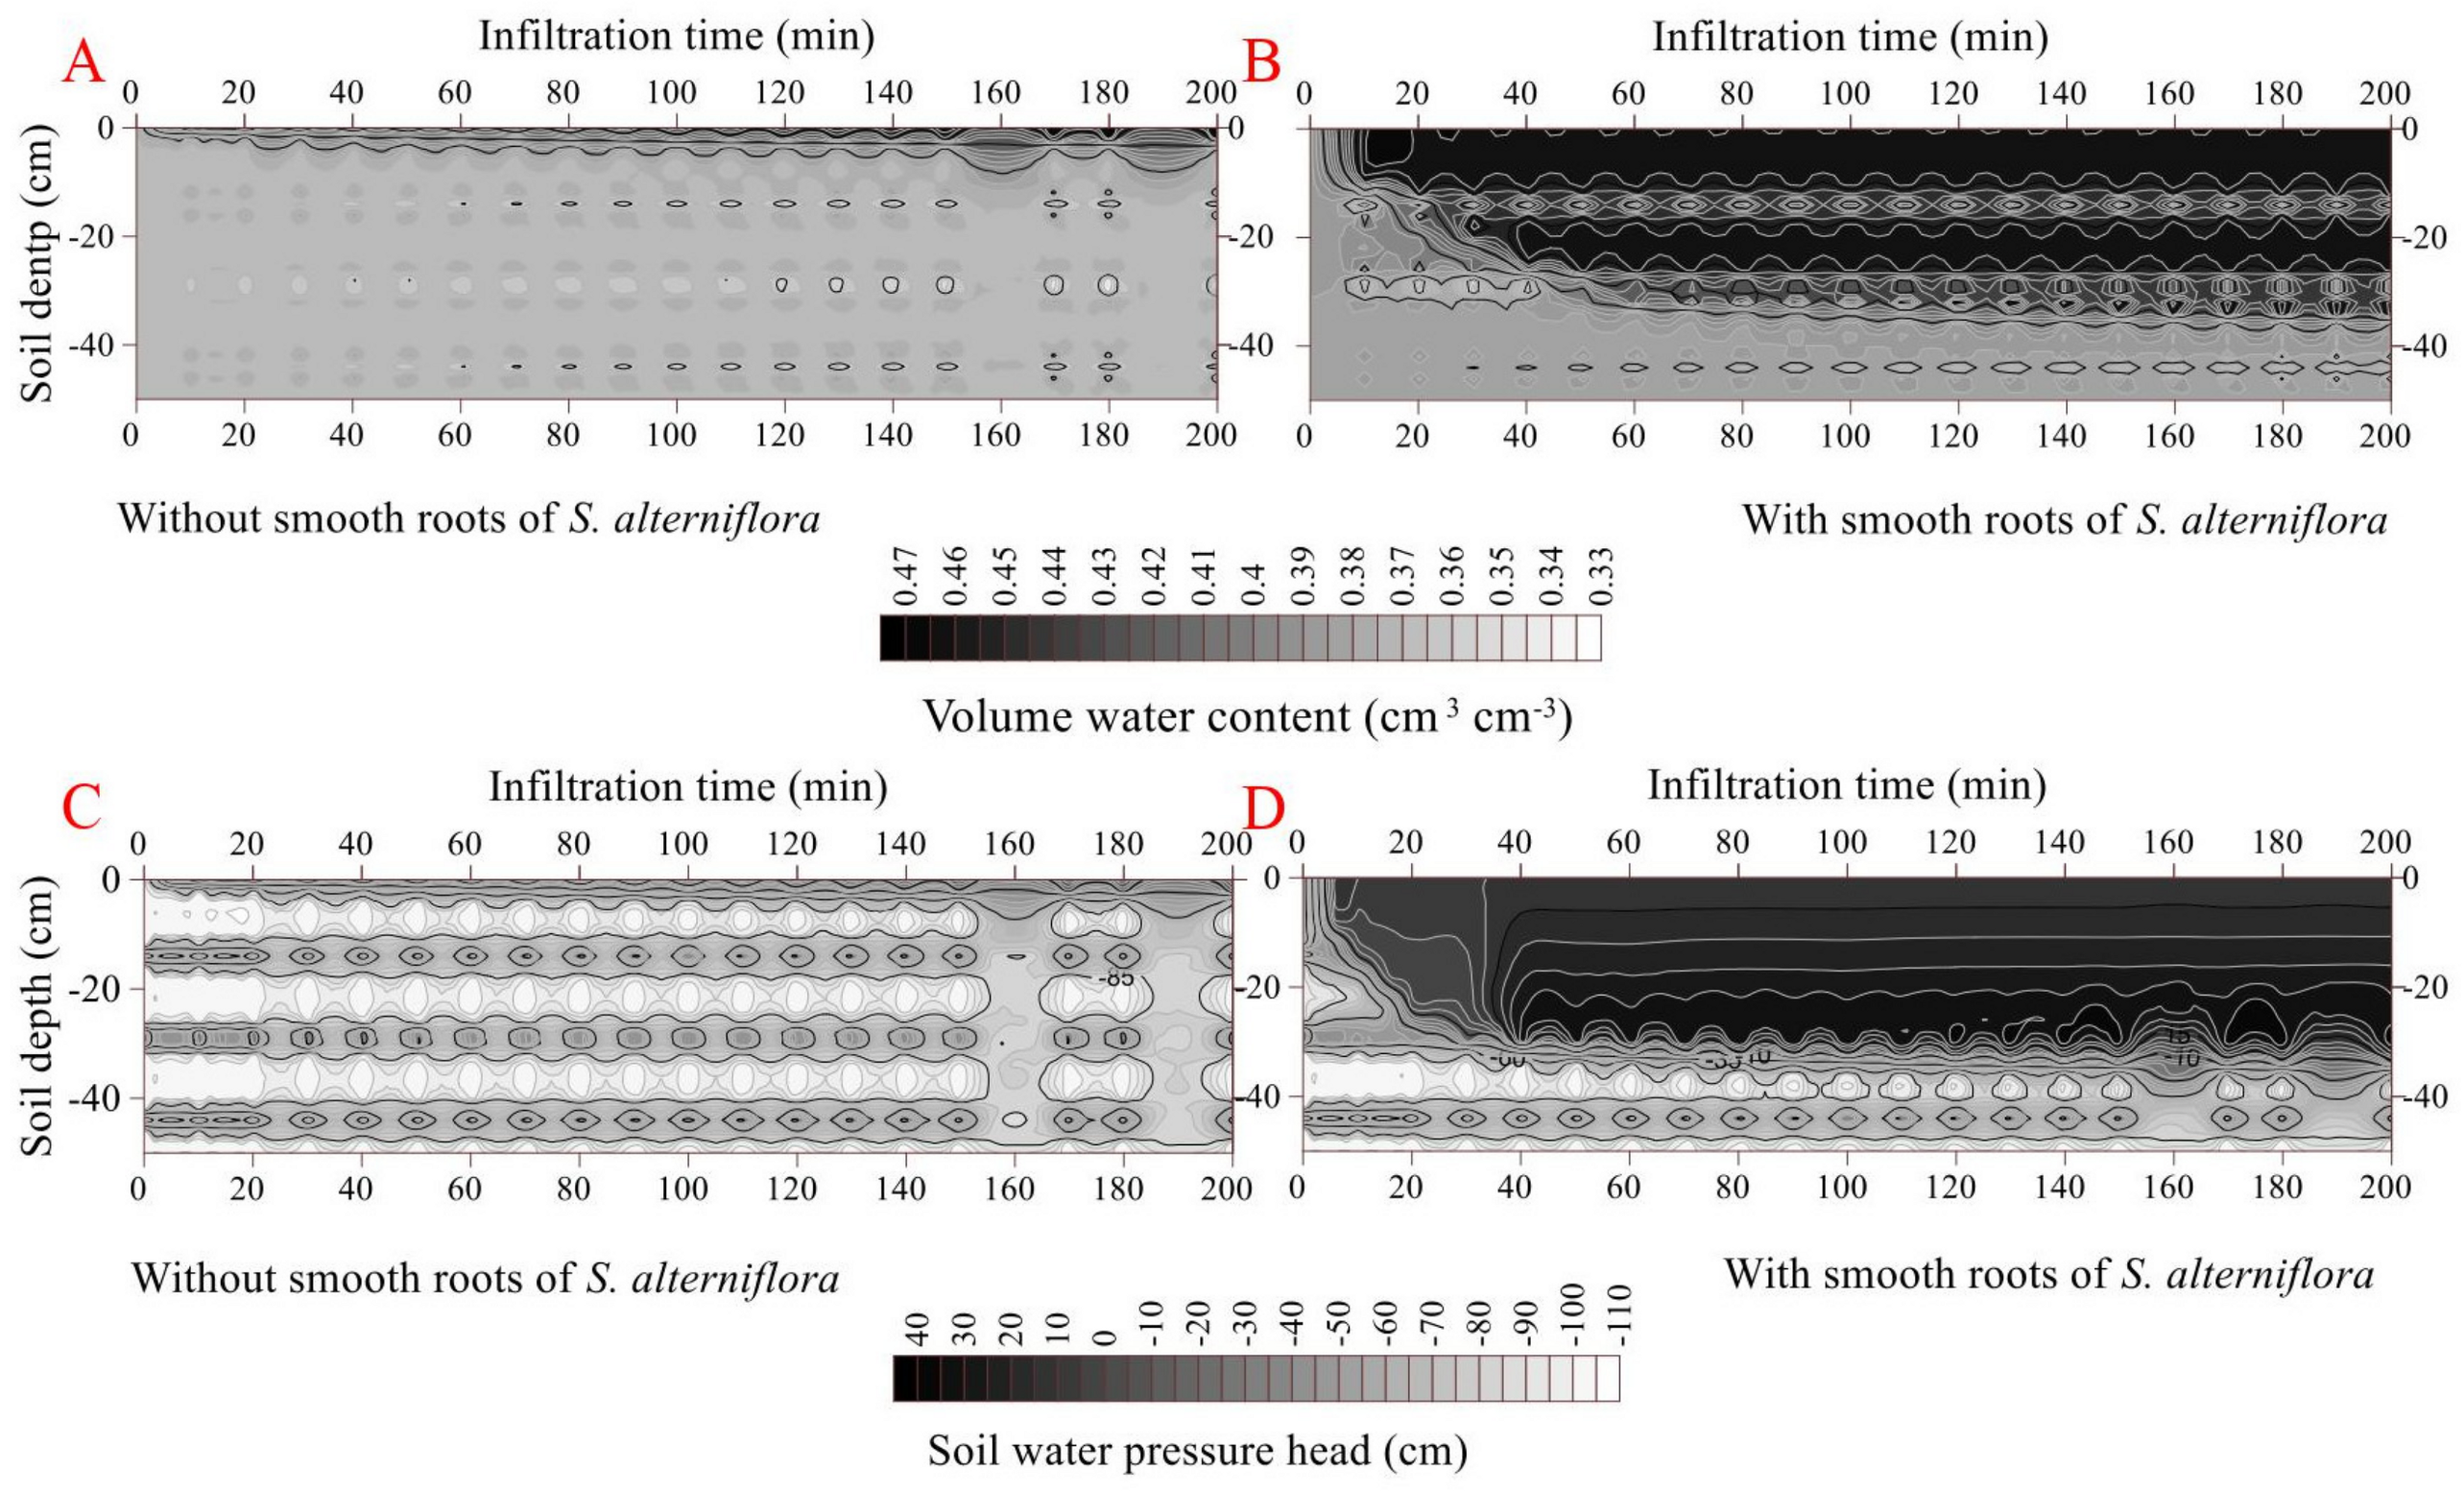
The cumulative infiltration was higher in the smooth-rooted soil (2.47 cm) than rootless soil (0.28 cm). The initial and final infiltration rates were higher in the smooth-rooted soil of S. alterniflora (0.95 cm min−1 and 0.0001 cm min−1, respectively) than the rootless soil (0.04 cm min−1 and 0.00006 cm min−1, respectively) (p < 0.05). The infiltration rate sharply decreased in the smooth-rooted soil at the infiltration time of 520 min (Figure 6). The propagation time of the wetting front across the soil profiles (0–50 cm) was less than 50 min, but was less than 35 min in the smooth-rooted zone (0–25 cm). The amplitude of the wetting zone alternatively increased and decreased and increased, and only the 0–2 cm and 0–4 cm soil layers were saturated at the infiltration time of 2000 min in the rootless and smooth-rooted soil profiles, respectively. The soil moisture was 0.46 and 0.42 cm3 cm−3 in the saturated zones of sandy and muddy layers, respectively. The soil water pressure head slightly changed during the infiltration time of 0 min to 2000 min in the saturated rootless soil, but increased rapidly in the 0–25 cm soil layer of the smooth-rooted soil. However, the soil water pressure head remained unchanged at the soil depths of 40 cm to 100 in both the smooth-rooted and rootless soil profiles (Figure 6 and Figure 7). Because the clay layer and sand layer appear alternately, the saturated water holding ratio of the two layers is different, so the water content and water potential change alternately.
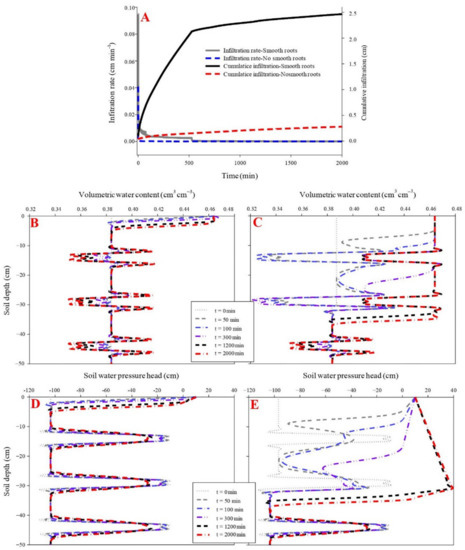
Figure 6.
Effect of smooth roots of S. alterniflora on infiltration (A). (B,D) shows the dynamic variation in volumetric water content and soil water pressure head in the soil profile without fibrous maize roots. (C,E) shows the dynamic variation in volumetric water content and soil water pressure head in the soil profile with smooth roots of S. alterniflora. Since the clay layer and sand layer appear alternately, the saturated water holding ratio of the two layers is different, and the water content and water potential change alternately.
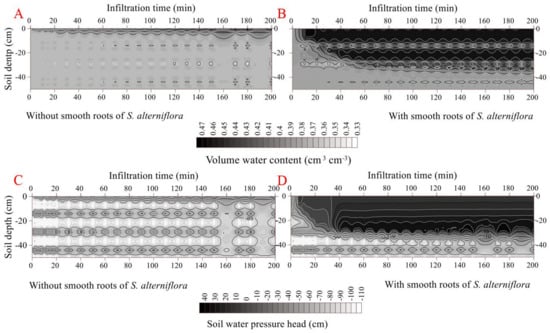
Figure 7.
Dynamic characteristics of volumetric water content and soil water pressure head as a function of infiltration time in the soil profile without smooth roots of S. alterniflora (A,C) Dynamic characteristics of volumetric water content and soil water pressure head as a function of infiltration time in the soil profile with smooth roots of S. alterniflora (B,D).
The map of volumetric water content and soil pressure head in the two vertical soil profiles was generated through ordinary kriging with Surfer program (Version 10.0, Golden Software Inc., Golden, CO, USA) (This process was also conducted for Figure 4 and Figure 6). The x-coordinate unit decreased by 10 times relative to the actual infiltration time.
4. Discussion
4.1. Effects of Fibrous Roots on Soil Water Infiltration
The present study found that the presence of fibrous maize roots accelerated water infiltration and promoted water distribution and storage in the plough layer. A high infiltration rate occurred over the infiltration time of 0 to 50 min in the rooted soil profile, indicating a fast water infiltration under the influence of fibrous maize roots. In fact, fibrous roots can deeply penetrate through biopores or cracks in farmland soil [62,63], and the fibrous root systems significantly influence soil infiltration capacity [64,65]. A previous study supports that the presence of fibrous roots increases the soil porosity and water-holding capacity under low soil bulk density in soil profiles (Table 3 and Table 4) [28].
Additionally, the even movements of the wetting front and saturation zone were highly affected by the fibrous maize roots (Figure 1, Figure 2 and Figure 3). As a result, the propagation time of the wetting front decreased by 33% in the maize fibrous-rooted soil relative to the rootless soil (p < 0.05). Previous research highlighted that the downward water flux is higher under macropores formed by root systems in desert and grasslands soils [39,66,67]. In this paper, a single soil layer was saturated in the rootless vertical soil, whereas the rooted soil exhibited two soil layers saturation zone. The first layer corresponded with the rooted zone and the second layer with the rootless zone, and the volumetric water content of the saturation zone was 12% higher in the rooted zone compared to the rootless zone (p < 0.05). This result suggests a high impact of root activity on soil porosity based on bulk density, which was also 12% higher in the rooted soil than the rootless soil (p < 0.05) (Table 3). In addition, the soil water pressure head was 180% higher in the fibrous-rooted soil than the rootless soil at the infiltration time of 800 min, and both profiles however exhibited similar saturated soil water content. Finally, the soil water pressure head changed from negative (unsaturation) to positive values (saturation) in the rooted and rootless soils, implying that the water distribution in the soil matrix was more affected by gravity-induced water movement.
4.2. Effects of Rubber Fine Roots on Soil Water Infiltration
The stained areas were randomly scattered in the rubber tree fine-root soil profile (Figure 1). Instead of gravity, the rubber trees’ fine-root system likely acted as capillary tubes and the capillary force drove the slow water infiltration behavior in this profile, considering the long infiltration time, deep penetration (Figure 4 and Figure 5), and high soil bulk density (Table 3). In addition, the rhizosphere through the assemblage of roots, microorganisms, and soil around the roots, with the exception of bulk soil [68], may provide another path for water flow in the rubber tree fine-root soil profile. This other path likely induces the development of specific water distribution patterns matching the fine root layer and improves the water use of rubber trees. The rubber tree exhibited low initial infiltration rates, indicating that water did not infiltrate the profile and instead remained on the soil surface and/or ran off. This phenomenon can be attributed to a high soil bulk density and low Ks in the rubber tree soil profile (Table 3 and Table 4). In addition, the lower water infiltration rate and cumulative infiltration associated with high volumetric water content in the rubber tree soil profile implied that the downward movement of water infiltration in this hard soil occurred gradually even in the rubber tree fine-root soil.
Soil water flow is usually higher in soil profiles with plant roots than rootless soils [2,46,49]. In fact, our findings showed that the rootless rubber soil profile did not exhibit a wetting front until the infiltration time of 100 min (Figure 4 and Figure 5). The downward movement of soil water by gravity could be delayed or even stopped by the hard soil of the rubber tree forests. Then, the effects of fine roots on the volumetric water content and soil water pressure head became more evident at the infiltration time of 2000 min, and the wetting fronts was different between the fine-root and rootless soil profiles. This result indicates that the fine roots developed flow paths that enhanced the Ks (Table 4); especially, the effects of fine roots on the downward movement of soil water are correlated with the infiltration time and soil hardness. Thus, based on the influence of roots on soil hydraulic properties, these effects of fine roots can be attributed to (1) the living roots, as well as decaying or decayed roots that provide preferential flow paths [47,69], and (2) the rhizosphere, which can be an important pathway for water flow, especially in hard soil.
Previous research reported that perennials and woody plants substantially change flow behavior, whereas annual crops negligibly influence flow behavior. For instance, the root diameters of annual plants are the main root traits necessary to effectively prime the soil pore space [30]. Rudolf noted that living and decaying alfalfa roots generate stable macropores [38], whereas living and decaying wheat roots did not. Yunusa and Newton reported that different plant species exert different effects on soil hydraulic properties [70].
In addition, root-generated preferential flow paths and the rhizosphere could affect not only the soil water flow, but also the soil volumetric water content and soil water pressure head. The saturated soil water content increased by 5% in the rubber tree rooted soil profile than the rootless soil profile, indicating that root activity and the rhizosphere resulted in a lower bulk density (i.e., high porosity). Moreover, the water pressure was lower in the rubber tree rooted soil profile than the rootless soil profile at the beginning of the infiltration. Once water reached the soil layers through slow infiltration, the water interaction between the preferential flow paths and the surrounding soil matrix serves as a key mechanism for water distributing to the root zone [71].
4.3. Effects of S. alterniflora Smooth Roots on Soil Water Infiltration
Similar to the findings of Hamed [72], the high proportion of the stained areas is confined to the upper 10 cm layer of the rootless soil profile acquired from the intertidal zone (Figure 1). Moreover, the mud layer with a low hydraulic conductivity (rootless soil) inhibited the downward water movement (Table 3), causing ponding and surface runoff. However, these phenomena did not occur in sites with an S. alterniflora smooth root mud layer. The initial and final infiltration rates were significantly higher in the S. alterniflora smooth root soil than the rootless soil (p < 0.05) (Figure 6 and Figure 7), indicating that runoff always occurred in the rootless soil profile and can be mitigated by the S. alterniflora smooth root system. However, the encounter between the wetting front and mud layers may limit the degree of runoff mitigation. The water content in the vertical profile of the rootless muddy layers slightly increased during the infiltration, and this variation in water content corresponded with the alternating sand and clay layers (Figure 6 and Figure 7). The water contents increased sharply in the S. alterniflora smooth-rooted soil, and the 0–25 cm root zone was saturated at the infiltration time of 1000 min. The velocity of the downward movement of the wetting front was 113% higher in the S. alterniflora smooth-rooted soil than the rootless soil (p < 0.05). Thus, the water movement induced by the smooth roots could penetrate across soil profiles, as indicated the measured Ks (Table 3). Various conditions, including climate, soil, and vegetation characteristics, can affect the deep percolation caused by roots (by root water uptake) or facilitate it (by root-induced macropores). The deep percolation is particularly affected by the frequency and duration of macropores saturation and their saturation degree [44,73]. The soil in the intertidal zone was often saturated or nearly saturated by rainfall and tide. Thus, although the mud layers act as impeding layers, the presence of smooth roots was important for water percolation. Notably, the volumetric water content was similar in the sandy loam layers of the rooted and rootless soil profiles, while it decreased by 3% (p > 0.05) in the mud layer of the S. alterniflora rooted soil relative to the mud layer of the other soil profiles. In fact, the water pressure head changed from negative (−103 cm, i.e., unsaturation) to positive values (39 cm, i.e., saturation) in the S. alterniflora rooted soil. Moreover, the living and dead roots could either promote or dissipate the soil water pressure head depending on root configuration, orientation, and interconnections. The soil of the intertidal zone exhibited alternating sandy and mud layers (Figure 1). Although the maximum volumetric water content occurred under steady infiltration state, the soil water pressure head constantly increased in the S. alterniflora smooth-rooted soil, whereas it matched the alternate configuration of sandy loam layers and mud layers in the rootless soil.
5. Conclusions
Dye infiltration experiments and HYDRUS-1D provided evidence that roots act as preferential flow paths for water infiltration and percolation into the soil. The dye tracer technique suggested that preferential flow, capillary flow, preferential flow together with capillary flow occurred at the plough layer (Minqin site), the hard soil layer (Mengla site), and the alternating sandy and mud layers of an intertidal zone (Dongtai site), respectively, and these water flow types were more pronounced in the presence of roots. In addition, the initial and final infiltration rates were significantly different between the rooted and rootless soil profiles, and the initial infiltration rate decreased gradually with the increasing infiltration time. The propagation time of the wetting front across the soil profile decreased by 33–113% (p < 0.05) as a result of root-affected infiltration events. The maximum volumetric water content occurred once the steady infiltration state was reached in the rooted soil, and the soil water pressure head constantly increased under this condition. Finally, the soil water pressure head increased from negative (unsaturated) to positive (saturated), but this change was more pronounced in the maize fibrous root soil than the rubber tree fine roots or the S. alterniflora smooth-rooted soils. In short, our findings indicate that the water distribution in the plough layer and sandy soil layers were mainly affected by gravity-induced water movement, whereas the water distribution in the hard and mud soil layers were mainly affected by capillary flow. The water downward movement, volumetric water content, and soil water pressure head were higher in the rooted soils than the rootless soils.
Author Contributions
Conceptualization, H.W. and X.-J.J.; data curation, H.W.; funding acquisition, X.Z., C.C., W.L. and X.-J.J.; investigation, S.Z. and X.-J.J.; methodology, H.W.; writing—original draft, H.W. and X.-J.J.; writing—review and editing, X.Z., C.C., W.L. and X.-J.J. All authors have read and agreed to the published version of the manuscript.
Funding
This research was funded by the project of National Natural Science Foundation of China (41701029, 32001221), the project of Natural Science Foundation of Yunnan Province (grant NO.2018FB076, 2019FI011, 202101AS070010, 202101AT070056, 202201AT070216), Youth Innovation Promotion Association CAS (2018430) and the Chinese Academy of Sciences (CAS) “Light of West China” program.
Institutional Review Board Statement
Not applicable.
Informed Consent Statement
Not applicable.
Data Availability Statement
Not applicable.
Acknowledgments
We thank Liu MN and the Institutional Center for Shared Technologies and Facilities of Xishuangbanna Tropical Botanical Garden, CAS for their help in the field and laboratory experiments.
Conflicts of Interest
The authors declare that they have no known competing financial interests or personal relationships that could have appeared to influence the work reported in this paper.
References
- Wei, H.B.; Li, R.; Yang, Q. Research advances of vegetation effect on soil and water conservation in China. Acta Phytoecol. Sin. 2002, 26, 489–496. [Google Scholar]
- Jørgensen, P.R.; Hoffmann, M.; Kistrup, J.P.; Bryde, C.; Bossi, R.; Villholth, K.G. Preferential flow and pesticide transport in a clay-rich till: Field, laboratory, and modeling analysis. Water Resour. Res. 2002, 38, 28–31. [Google Scholar] [CrossRef]
- Beven, K.; Germann, P. Macropores and water flow in soils. Water Resour. Res. 1982, 18, 1311–1325. [Google Scholar] [CrossRef] [Green Version]
- Doerr, S.H.; Shakesby, R.A.; Walsh, R. Soil water repellency: Its causes, characteristics and hydro-geomorphological significance. Earth-Sci. Rev. 2000, 51, 33–65. [Google Scholar] [CrossRef]
- Uchida, T.; Meerveld, I.T.-V.; McDonnell, J.J. The role of lateral pipe flow in hillslope runoff response: An intercomparison of non-linear hillslope response. J. Hydrol. 2005, 311, 117–133. [Google Scholar] [CrossRef]
- Lipiec, J.; Kuś, J.; Słowińska-Jurkiewicz, A.; Nosalewicz, A. Soil porosity and water infiltration as influenced by tillage methods. Soil Tillage Res. 2006, 89, 210–220. [Google Scholar] [CrossRef]
- van Schaik, N.L.M.B.; Schnabel, S.; Jetten, V.G. The influence of preferential flow on hillslope hydrology in a semi-arid watershed (in the Spanish Dehesas). Hydrol. Process. 2008, 22, 3844–3855. [Google Scholar] [CrossRef]
- Nieber, J.L.; Sidle, R.C. How do disconnected macropores in sloping soils facilitate preferential flow? Hydrol. Process. 2010, 24, 1582–1594. [Google Scholar] [CrossRef]
- Jiang, X.J.; Liu, W.; Wu, J.; Wang, P.; Liu, C.; Yuan, Z. Land Degradation Controlled and Mitigated by Rubber-based Agroforestry Systems through Optimizing Soil Physical Conditions and Water Supply Mechanisms: A Case Study in Xishuangbanna, China. Land Degrad. Dev. 2017, 28, 2277–2289. [Google Scholar] [CrossRef]
- Villamizar, M.; Brown, C. A modelling framework to simulate river flow and pesticide loss via preferential flow at the catchment scale. CATENA 2017, 149, 120–130. [Google Scholar] [CrossRef] [Green Version]
- Young, M.H.; Karagunduz, A.; Šimůnek, J.; Pennell, K.D. A modified upward infiltration method for characterizing soil hydraulic properties. Soil Sci. Soc. Am. J. 2002, 66, 57–64. [Google Scholar] [CrossRef]
- Zeleke, T.B.; Si, B.C. Scaling Relationships between Saturated Hydraulic Conductivity and Soil Physical Properties. Soil Sci. Soc. Am. J. 2005, 69, 1691–1702. [Google Scholar] [CrossRef]
- Schenk, H.J.; Jackson, R.B. Rooting depths, lateral root spreads and below-ground/above-ground allometries of plants in water-limited ecosystems. J. Ecol. 2002, 90, 480–494. [Google Scholar] [CrossRef] [Green Version]
- Castillo, V.M.; Gómez-Plaza, A.; Martínez-Mena, M. The role of antecedent soil water content in the runoff response of semiarid catchments: A simulation approach. J. Hydrol. 2003, 284, 114–130. [Google Scholar] [CrossRef]
- Chen, M.; Willgoose, G.R.; Saco, P.M. Spatial prediction of temporal soil moisture dynamics using HYDRUS-1D. Hydrol. Process. 2014, 28, 171–185. [Google Scholar] [CrossRef]
- Sisson, J.B.; Gee, G.W.; Hubbell, J.M.; Bratton, W.L.; Ritter, J.C.; Ward, A.L.; Caldwell, T.G. Advances in Tensiometry for Long-term Monitoring of Soil Water Pressures. Vadose Zone J. 2002, 1, 310–315. [Google Scholar] [CrossRef]
- Allaire, S.E.; Roulier, S.; Cessna, A.J. Quantifying preferential flow in soils: A review of different techniques. J. Hydrol. 2009, 378, 179–204. [Google Scholar] [CrossRef]
- Cey, E.E.; Rudolph, D.L. Field study of macropore flow processes using tension infiltration of a dye tracer in partially saturated soils. Hydrol. Process. 2009, 23, 1768–1779. [Google Scholar] [CrossRef]
- Laine-Kaulio, H.; Backnäs, S.; Koivusalo, H.; Laurén, A. Dye tracer visualization of flow patterns and pathways in glacial sandy till at a boreal forest hillslope. Geoderma 2015, 259, 23–34. [Google Scholar] [CrossRef]
- Imůnek, J.; Šejna, M.; van Genuchten, M.T. The HYDRUS-1D Software Package for Simulating One-Dimensional Movement of Water, Heat, and Multiple Solutes in Variably Saturated Media; Version 2.0. 202. 1998; University of California-Riverside Research Reports: Riverside, CA, USA, 2005. [Google Scholar]
- Larsson, M.H.; Jarvis, N.J. Evaluation of a dual-porosity model to predict field-scale solute transport in a macroporous soil. J. Hydrol. 1999, 215, 153–171. [Google Scholar] [CrossRef]
- Roulier, S.; Jarvis, N. Analysis of Inverse Procedures for Estimating Parameters Controlling Macropore Flow and Solute Transport in the Dual-Permeability Model MACRO. Vadose Zone J. 2003, 2, 349–357. [Google Scholar] [CrossRef]
- Sommer, R.; Fölster, H.; Vielhauer, K.; Carvalho, E.J.M.; Vlek, P.L.G. Deep Soil Water Dynamics and Depletion by Secondary Vegetation in the Eastern Amazon. Soil Sci. Soc. Am. J. 2003, 67, 1672–1686. [Google Scholar] [CrossRef]
- Lai, J.; Ren, L. Estimation of effective hydraulic parameters in heterogeneous soils at field scale. Geoderma 2016, 264, 28–41. [Google Scholar] [CrossRef]
- Castellano, M.; Valone, T. Livestock, soil compaction and water infiltration rate: Evaluating a potential desertification recovery mechanism. J. Arid Environ. 2007, 71, 97–108. [Google Scholar] [CrossRef]
- Kodešová, R.; Němeček, K.; Kodeš, V.; Žigová, A. Using Dye Tracer for Visualization of Preferential Flow at Macro- and Microscales. Vadose Zone J. 2012, 11, 12–22. [Google Scholar] [CrossRef]
- Jiang, X.J.; Liu, S.; Zhang, H. Effects of different management practices on vertical soil water flow patterns in the Loess Plateau. Soil Tillage Res. 2017, 166, 33–42. [Google Scholar] [CrossRef]
- Gregory, P. Roots, rhizosphere and soil: The route to a better understanding of soil science? Eur. J. Soil Sci. 2006, 57, 2–12. [Google Scholar] [CrossRef]
- Bengough, A. Water Dynamics of the Root Zone: Rhizosphere Biophysics and Its Control on Soil Hydrology. Vadose Zone J. 2012, 11, vzj2011-0111. [Google Scholar] [CrossRef] [Green Version]
- Bodner, G.; Leitner, D.; Kaul, H.-P. Coarse and fine root plants affect pore size distributions differently. Plant Soil 2014, 380, 133–151. [Google Scholar] [CrossRef] [Green Version]
- Gibbs, R.J.; Reid, J.B. A conceptual model of changes in soil structure under different cropping systems. In Advances in Soil Science; Springer: New York, NY, USA, 1988; pp. 123–149. [Google Scholar] [CrossRef]
- Meek, B.D.; Rechel, E.R.; Carter, L.M.; DeTar, W.R.; Urie, A.L. Infiltration Rate of a Sandy Loam Soil: Effects of Traffic, Tillage, and Plant Roots. Soil Sci. Soc. Am. J. 1992, 56, 908–913. [Google Scholar] [CrossRef]
- Weiler, M.; Naef, F. An experimental tracer study of the role of macropores in infiltration in grassland soils. Hydrol. Process. 2003, 17, 477–493. [Google Scholar] [CrossRef]
- van Schaik, N.L.M.B. Spatial variability of infiltration patterns related to site characteristics in a semi-arid watershed. CATENA 2009, 78, 36–47. [Google Scholar] [CrossRef]
- Barley, K.P. Effects of Root Growth and Decay on The Permeability of A Synthetic Sandy Loam. Soil Sci. 1954, 78, 205–210. [Google Scholar] [CrossRef]
- Meek, B.D.; Rechel, E.A.; Carter, L.M.; DeTar, W.R. Changes in Infiltration Under Alfalfa as Influenced by Time and Wheel Traffic. Soil Sci. Soc. Am. J. 1989, 53, 238–241. [Google Scholar] [CrossRef]
- Kung, K.-J. Preferential flow in a sandy vadose zone: 1. Field observation & 2. mechanism and implications. Geoderma 1990, 46, 51–71. [Google Scholar] [CrossRef]
- Rudolf, A.; Mitchell, W.T. Picture Theory: Essays on Verbal & Visual Representation; University of Chicago Press: Chicago, IL, USA, 1995. [Google Scholar] [CrossRef]
- Martinez-Meza, E.; Whitford, W.G. Stemflow, throughfall and channelization of stemflow by roots in three Chihuahuan desert shrubs. J. Arid Environ. 1996, 32, 271–287. [Google Scholar] [CrossRef]
- Noguchi, S.; Tsuboyama, Y.; Sidle, R.C.; Hosoda, I. Morphological Characteristics of Macropores and the Distribution of Preferential Flow Pathways in a Forested Slope Segment. Soil Sci. Soc. Am. J. 1999, 63, 1413–1423. [Google Scholar] [CrossRef]
- Rasse, D.P.; Smucker, A.J.M.; Santos, D. Alfalfa Root and Shoot Mulching Effects on Soil Hydraulic Properties and Aggregation. Soil Sci. Soc. Am. J. 2000, 64, 725–731. [Google Scholar] [CrossRef]
- Lange, B.; Lüescher, P.; Germann, P.F. Significance of tree roots for preferential infiltration in stagnic soils. Hydrol. Earth Syst. Sci. 2009, 13, 1809–1821. [Google Scholar] [CrossRef] [Green Version]
- Bogner, C.; Gaul, D.; Kolb, A.; Schmiedinger, I.; Huwe, B. Investigating flow mechanisms in a forest soil by mixed-effects modelling. Eur. J. Soil Sci. 2010, 61, 1079–1090. [Google Scholar] [CrossRef]
- Guan, H.; Simunek, J.; Newman, B.D.; Wilson, J.L. Modelling investigation of water partitioning at a semiarid ponderosa pine hillslope. Hydrol. Process. 2010, 24, 1095–1105. [Google Scholar] [CrossRef]
- Archer, N.A.L.; Quinton, J.N.; Hess, T.M. Patch vegetation and water redistribution above and below ground in south-east Spain. Ecohydrology 2012, 5, 108–120. [Google Scholar] [CrossRef]
- Bargués Tobella, A.; Reese, H.; Almaw, A.; Bayala, J.; Malmer, A.; Laudon, H.; Ilstedt, U. The effect of trees on preferential flow and soil infiltrability in an agroforestry parkland in semiarid Burkina Faso. Water Resour. Res. 2014, 50, 3342–3354. [Google Scholar] [CrossRef] [Green Version]
- Zhang, Y.; Niu, J.; Yu, X.; Zhu, W.; Du, X. Effects of fine root length density and root biomass on soil preferential flow in forest ecosystems. For. Syst. 2015, 24, 12. [Google Scholar] [CrossRef] [Green Version]
- Shao, W.; Ni, J.; Leung, A.; Su, Y.; Ng, C.W.W. Analysis of plant root–induced preferential flow and pore-water pressure variation by a dual-permeability model. Can. Geotech. J. 2017, 54, 1537–1552. [Google Scholar] [CrossRef] [Green Version]
- Zhang, Y.; Niu, J.; Zhang, M.; Xiao, Z.; Zhu, W. Interaction Between Plant Roots and Soil Water Flow in Response to Preferential Flow Paths in Northern China. Land Degrad. Dev. 2017, 28, 648–663. [Google Scholar] [CrossRef]
- Jiang, X.J.; Liu, W.; Chen, C.; Liu, J.; Yuan, Z.-Q.; Jin, B.C.; Yu, X.Y. Effects of three morphometric features of roots on soil water flow behavior in three sites in China. Geoderma 2018, 320, 161–171. [Google Scholar] [CrossRef]
- Jiang, X.J.; Li, X.G. Assessing the effects of plastic film fully mulched ridge–furrow on rainwater distribution in soil using dye tracer and simulated rainfall. Soil Tillage Res. 2015, 152, 67–73. [Google Scholar] [CrossRef]
- Flury, M.; Flühler, H. Tracer Characteristics of Brilliant Blue FCF. Soil Sci. Soc. Am. J. 1995, 59, 22–27. [Google Scholar] [CrossRef]
- Bodhinayake, W.; Si, B.C.; Noborio, K. Determination of Hydraulic Properties in Sloping Landscapes from Tension and Double-Ring Infiltrometers. Vadose Zone J. 2004, 3, 964–970. [Google Scholar] [CrossRef]
- Reynolds, W.D.; Elrick, D.E. Ponded Infiltration from a Single Ring: I. Analysis of Steady Flow. Soil Sci. Soc. Am. J. 1990, 54, 1233–1241. [Google Scholar] [CrossRef]
- Reynolds, W.D.; Lewis, J.K. A drive point application of the Guelph Permeameter method for coarse-textured soils. Geoderma 2012, 187, 59–66. [Google Scholar] [CrossRef]
- Danielson, R.E.; Sutherland, P.L. Porosity. Methods of Soil Analysis. Part 1-Physical and Mineralogical Methods, 2nd ed.; ASA-SSSA: Madison, WI, USA, 1986; pp. 443–461. [Google Scholar]
- Jiao, F.; Wen, Z.-M.; An, S.-S. Changes in soil properties across a chronosequence of vegetation restoration on the Loess Plateau of China. CATENA 2011, 86, 110–116. [Google Scholar] [CrossRef]
- Rossi, J.-P.; Lavelle, P.; Albrecht, A. Relationships between spatial pattern of the endogeic earthworm Polypheretima elongata and soil heterogeneity. Soil Biol. Biochem. 1997, 29, 485–488. [Google Scholar] [CrossRef]
- Mualem, Y. A new model for predicting the hydraulic conductivity of unsaturated porous media. Water Resour. Res. 1976, 12, 513–522. [Google Scholar] [CrossRef] [Green Version]
- van Genuchten, M.T. A Closed-form Equation for Predicting the Hydraulic Conductivity of Unsaturated Soils. Soil Sci. Soc. Am. J. 1980, 44, 892–898. [Google Scholar] [CrossRef] [Green Version]
- Schaap, M.G.; Leij, F.J.; van Genuchten, M.T. rosetta: A computer program for estimating soil hydraulic parameters with hierarchical pedotransfer functions. J. Hydrol. 2001, 251, 163–176. [Google Scholar] [CrossRef]
- McKenzie, B.M.; Bengough, A.G.; Hallett, P.D.; Thomas, W.T.B.; Forster, B.; McNicol, J.W. Deep rooting and drought screening of cereal crops: A novel field-based method and its application. Field Crops Res. 2009, 112, 165–171. [Google Scholar] [CrossRef]
- Uteau, D.; Pagenkemper, S.K.; Peth, S.; Horn, R. Root and time dependent soil structure formation and its influence on gas transport in the subsoil. Soil Tillage Res. 2013, 132, 69–76. [Google Scholar] [CrossRef]
- Maiti, S.K. Ecorestoration of the Coalmine Degraded Lands; Springer, Science & Business Media: New York, NY, USA, 2013. [Google Scholar]
- Wu, Y.; Du, T.; Li, F.; Li, S.; Ding, R.; Tong, L. Quantification of maize water uptake from different layers and root zones under alternate furrow irrigation using stable oxygen isotope. Agric. Water Manag. 2016, 168, 35–44. [Google Scholar] [CrossRef]
- Lyford, F.P.; Qashu, H.K. Infiltration Rates as Affected by Desert Vegetation. Water Resour. Res. 1969, 5, 1373–1376. [Google Scholar] [CrossRef]
- Pressland, A.J. Soil Moisture Redistribution as Affected by Throughfall and Stemflow in an Arid Zone Shrub Community. Aust. J. Bot. 1976, 24, 641–649. [Google Scholar] [CrossRef]
- Tarafdar, J.C.; Jungk, A. Phosphatase activity in the rhizosphere and its relation to the depletion of soil organic phosphorus. Biol. Fertil. Soils 1987, 3, 199–204. [Google Scholar] [CrossRef]
- Noguchi, S.; Tsuboyama, Y.; Sidle, R.C.; Hosoda, I. Spatially distributed morphological characteristics of macropores in forest soils of Hitachi Ohta Experimental Watershed, Japan. J. For. Res. 1997, 2, 207–215. [Google Scholar] [CrossRef]
- Yunusa, I.A.M.; Newton, P.J. Plants for amelioration of subsoil constraints and hydrological control: The primer-plant concept. Plant Soil 2003, 257, 261–281. [Google Scholar] [CrossRef]
- Beven, K.J.; Clarke, R.T. On the Variation of Infiltration into a Homogeneous Soil Matrix Containing a Population of Macropores. Water Resour. Res. 1986, 22, 383–388. [Google Scholar] [CrossRef]
- Hamed, K.H. Trend detection in hydrologic data: The Mann–Kendall trend test under the scaling hypothesis. J. Hydrol. 2008, 349, 350–363. [Google Scholar] [CrossRef]
- Dong, W.; Yu, Z.; Weber, D. Simulations on soil water variation in arid regions. J. Hydrol. 2003, 275, 162–181. [Google Scholar] [CrossRef]
Publisher’s Note: MDPI stays neutral with regard to jurisdictional claims in published maps and institutional affiliations. |
© 2022 by the authors. Licensee MDPI, Basel, Switzerland. This article is an open access article distributed under the terms and conditions of the Creative Commons Attribution (CC BY) license (https://creativecommons.org/licenses/by/4.0/).