Article

A Marker-Controlled Watershed Algorithm for the Intelligent Picking of Long Jujubes in Trees

Tobacco Research Institute, Chinese Academy of Agricultural Sciences, Qingdao 266000, China
*
Authors to whom correspondence should be addressed.
These authors contributed equally to this work.
Forests 2022, 13(7), 1063; https://doi.org/10.3390/f13071063
Submission received: 12 May 2022 / Revised: 28 June 2022 / Accepted: 29 June 2022 / Published: 6 July 2022
(This article belongs to the Section Forest Ecology and Management)

Abstract

:
Vision is the most important way for an unmanned picking or plant protection robot to navigate an external environment. To achieve intelligent picking or plant protection, it is essential to obtain target location information. A new marker-controlled watershed (MCW-D) algorithm is proposed for object segmentation. By analyzing the shortcomings of the watershed algorithm and the characteristics of objects, the proposed MCW-D method mainly solves three problems. First, it reduces the influence of shadow and other factors on image color information. Based on histogram specification, secondary mapping is used to reduce the effects of lighting. Second, marker images are selected. All points with markers need to be located in the target object. The hue feature of long jujubes and trees is used as the marker image. Third, a mask image is acquired, which requires a clear boundary between the target and the background. An adaptive angle rotation based on an energy-driven approach is designed to find large differences between the target and the background. In a natural environment, the proposed MCW-D method respectively achieves segmentation accuracies of 94.7% and 93.2% on a jujube dataset and a tree dataset, which exceed the accuracies of widely used machine learning methods. These results promote the development of the forest and fruit economies.

1. Introduction

In the development of the forest and fruit economies, intelligent picking robots could effectively improve picking efficiency, reduce picking costs, and decrease labor intensity. Intelligent picking robots need to accurately extract targets from the background. Image segmentation technology has a significant influence on the subsequent processing [1], e.g., for location determination, plant protection, automatic picking, and nondestructive testing. Domestic and foreign scholars have put forward a series of effectual methods for improved segmentation. Based on the small difference in gray value among the same objects and the large difference in gray value among different objects, the OTSU method uses the statistical data of gray values to calculate the maximum differences between different targets and segment different targets [2,3]. According to the principle of entropy increase, maximum entropy seeks an optimal threshold to maximize the sum of the entropy of the background and the foreground [4]. Other segmentation methods also calculate the optimal segmentation threshold based on underlying features such as texture, hue, and shape [5,6,7,8,9,10,11,12,13,14,15,16,17]. These algorithms rely heavily on the color information of the image; therefore, before segmentation, the images are usually pre-processed to mitigate the illumination effect [18,19,20,21,22,23,24]. The watershed algorithm uses a gradient map to obtain the boundary information of a target. Because some boundary gradients are not obvious, the traditional watershed algorithm often suffers from over-segmentation [25].
For jujube segmentation, according to the characteristics of a jujube, segmentation methods based on the hue model [26] and maximum entropy [4] have achieved a segmentation accuracy of more than 88%. However, the green part of a jujube cannot be separated effectively. For the segmentation of living trees, the improved watershed algorithm [25] can overcome the phenomenon of over-segmentation to some extent, but there are problems such as inaccurate boundary information.
The picking environment of long jujubes involves natural light, so environmental factors such as lighting and shadow have an important effect on their color information. The first task is to decrease the effect of environmental factors by improved histogram specifications. Moreover, both shortcomings of the traditional watershed algorithm and the image features of mature long jujubes are comprehensively considered. An improved watershed algorithm, which adaptively rotates the angle of hues by an energy-driven approach and neglects the complexity of the background, focuses on solving the boundary problem between long jujubes and the background objects. The overall framework is shown in Figure 1.
Our main contributions are as follows:
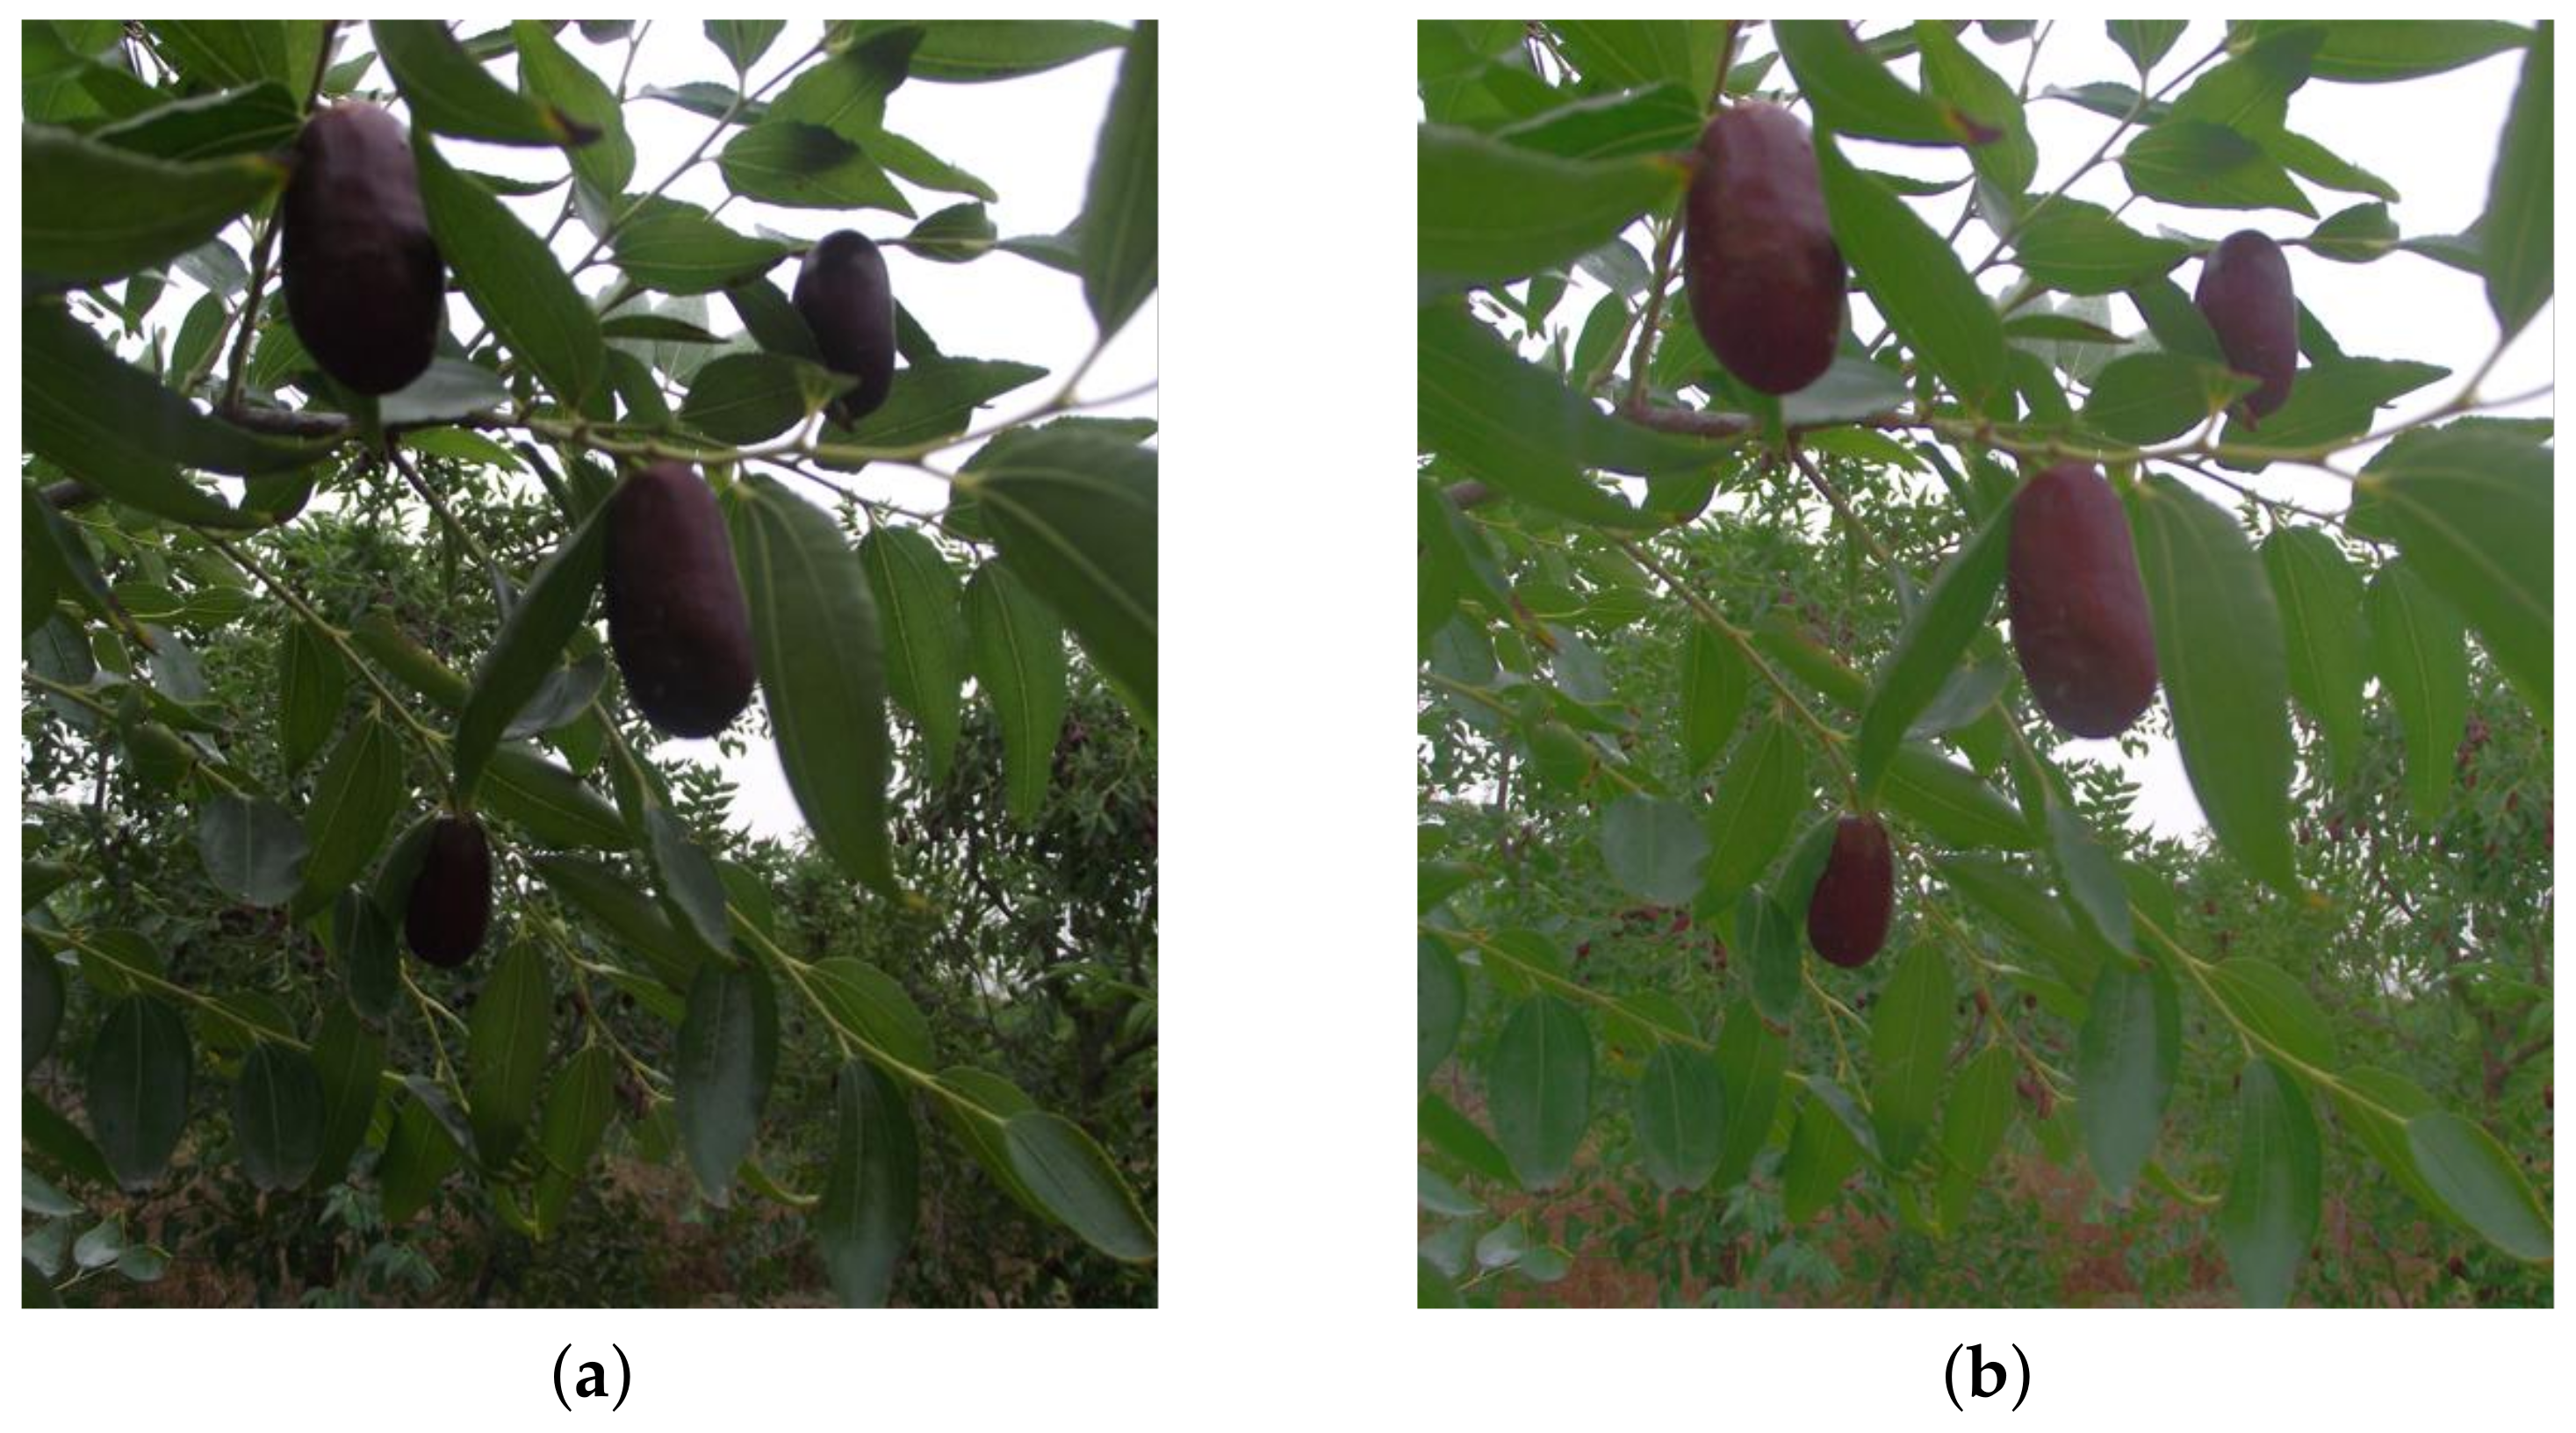
  • An algorithm that overcomes the influence of illumination is proposed. In a natural environment, secondary mapping is used to reduce the influence of illumination on the image.
  • A marker-controlled watershed algorithm is proposed, which emphasizes the selection of marker images and mask images to solve the phenomenon of over-segmentation. An energy-driven approach is introduced to select the appropriate mask image, obtain stable and effective gradient information, and overcome the impact of environmental change.
  • An algorithm is provided for the target segmentation of intelligent picking. This provides visual theoretical support for intelligent picking robots and promotes the development of forest and fruit economies.

2. Materials and Methods

2.1. Experimental Materials

Hardware used for image acquisition includes a Levono P700 mobile phone with eight megapixels and an HP Pavilion g series PC, Inter(R) Core(TM) i3-2310M CPU @ 2.10 GHz 2.10 GHz, RAM 2.00, Windows 7 ultimate ×32. Original images are shown in Figure 2.

2.2. Image Pre-Processing

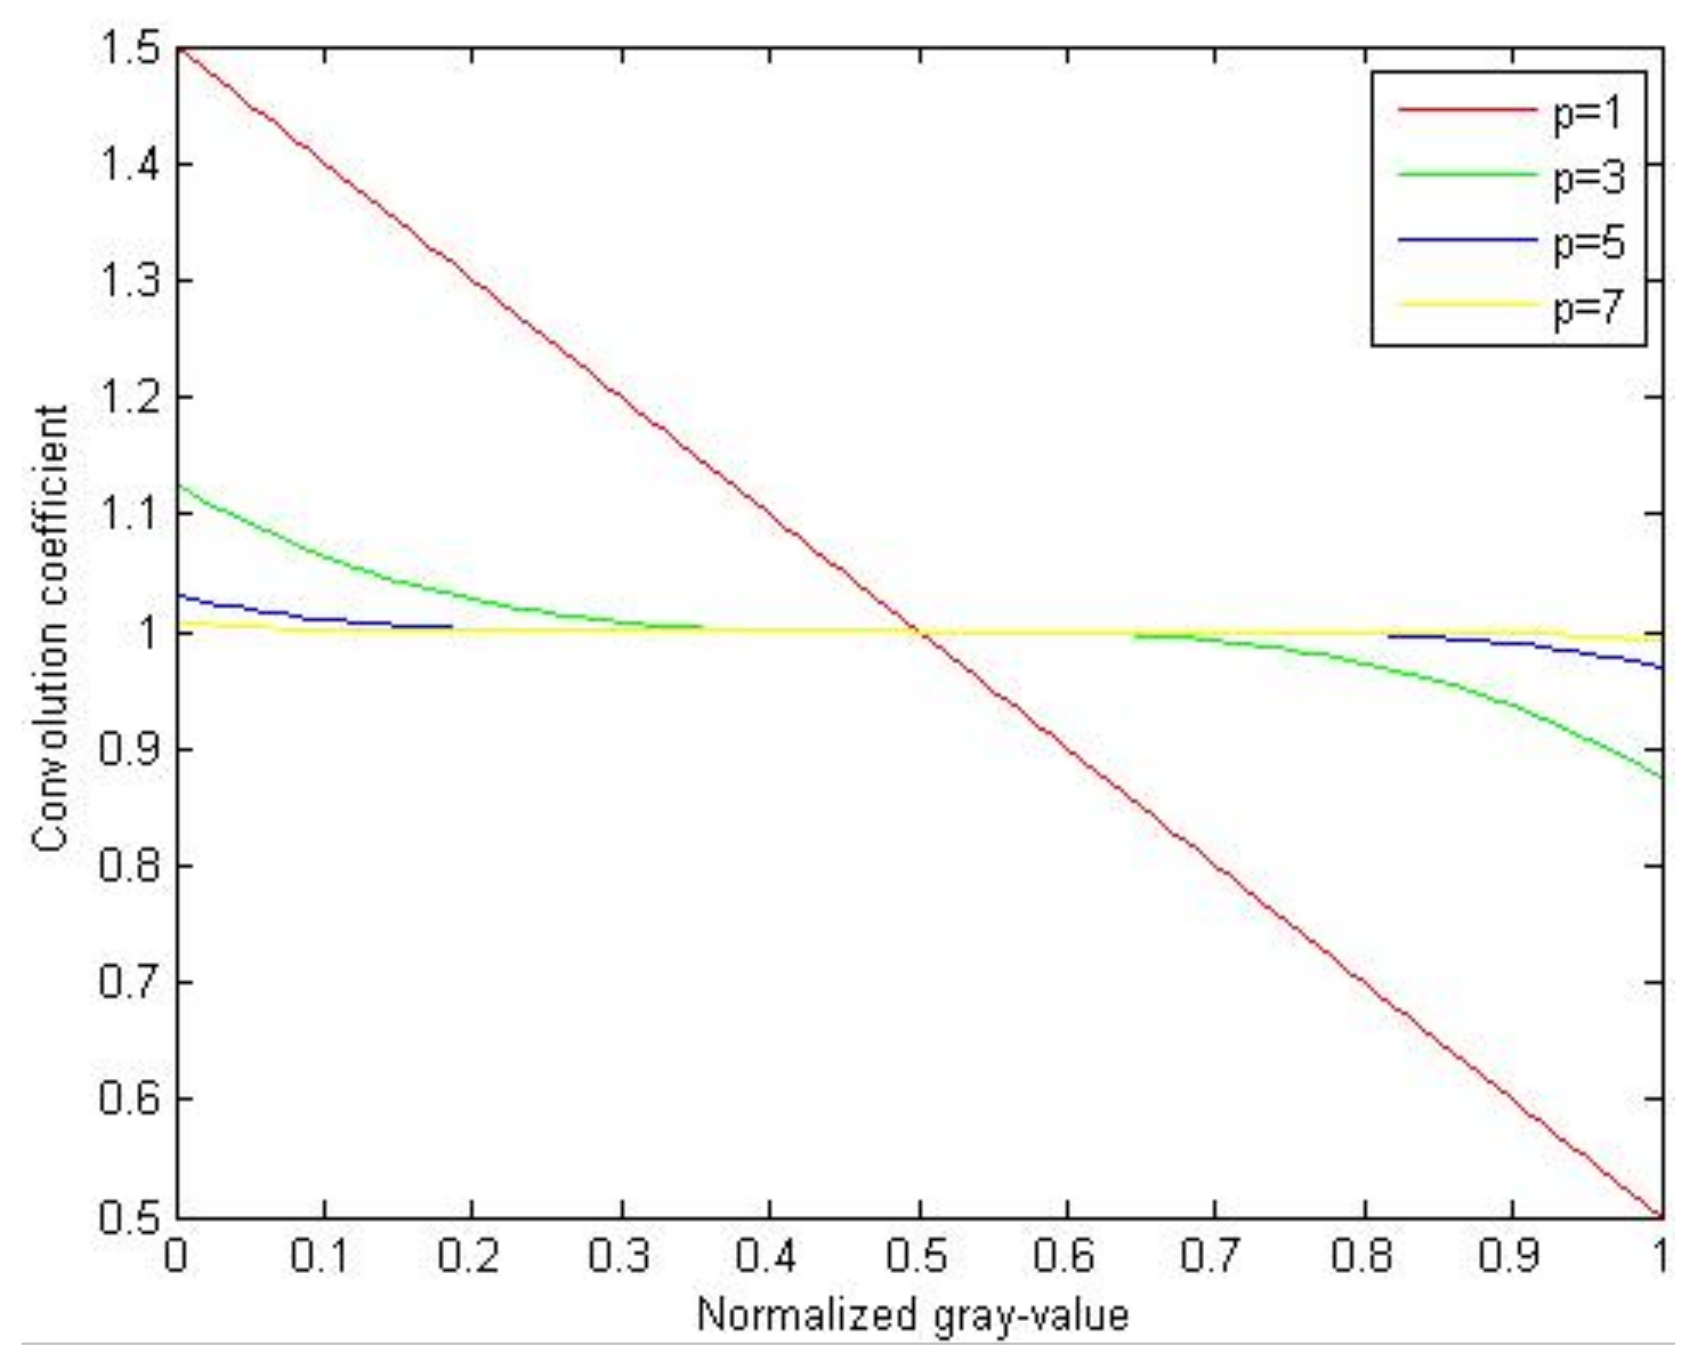
2.2.1. Convolution Coefficient Function

Affected by environmental factors, it is important to maintain the invariability of color information for the image of long jujubes. When the image is segmented with color information, it is only necessary to maintain the color invariability of the target object rather than the entire image. Since the image of the Lingwu long jujube is not affected by lighting and shadow, there is brightness without polarization distribution (an area that changes in value due to environmental factors). Therefore, for those areas in the background, whether the polarization distribution exists or not will not affect the final segmentation.
For images that are not affected by environmental factors, the distribution of the brightness value mainly has two characteristics. Firstly, pixel values have a wide distribution range. Secondly, pixel values mainly range in the middle area of the entire distribution range. Therefore, partial brightness values with polarization distribution need to be mapped on the normal area. Based on the analysis of the influence of lighting and shadow, the brightness value is lower or higher as the influence increases. In order to adhere to the mapping principle, the function type of the initial convolution coefficient is a power function. For a normalized image with a polarization distribution, the brightness value distribution can present three different situations:
  • the brightness value is lower than 0.5, which requires a mapping coefficient greater than 1;
  • the brightness value is greater than 0.5, which requires a mapping coefficient greater than 1;
  • the brightness value is close to 0.5, which requires a mapping coefficient close to 1. In this situation, the lighting has no influence on the brightness value.
The expression of the power function is as follows:
y = 1 ( x 0.5 ) p ,   p = 1 , 3 , 5 ,
x is the normalized brightness value. y is the convolution coefficient at the corresponding x, and it shows how much x changes. p, whose value is an odd number, is the index. Equation (2) shows that the value of its derived function is less than 1. Therefore, it is a decreasing function. When p = 1 and x = 0 , the maximum convolution coefficient is 1.5. This is not sufficient to map polarized regions, where the pixel values are distributed near 0 or 1, to normal regions, where the pixel values can be displayed normally. Here, secondary mapping is used to solve this problem:
Y = y q ,   q > 1

2.2.2. Determination of Parameters

(1) The p Parameter
The convolution coefficient function determined by p should comply with the mapping principle. The area with A polarization distribution will be mapped to the middle area and the convolution coefficient from the polarization area to the normal area tends towards 1 gradually. The convolution coefficient function with different parameters is shown in Figure 3.
It can be seen in Figure 3 that the trend of the convolution coefficient function is very different with the change of p. When p = 1 , the coefficient function is a line where the coefficient changes proportionally with the brightness value. The regions with low and high brightness values have lager convolution coefficients, but the middle region undergoes severe changes instead of tending towards 1. When p = 3 , the region, in the range from 0.3 to 0.7, has a consistent convolution coefficient of about 1. The convolution coefficient has a larger change in other regions. When p 5 , the convolution coefficient changes more evenly in the entire region. Based on parametric analysis and mapping requirements, the value of p is 3.
(2) The q parameter
Assuming that the image is named V and its size is M × N , ( i , j ) represents the position of row i and column j. V ( i , j ) represents the pixel value in the position ( i , j ) . The mean of the brightness in the image is
K = i = 1 M j = 1 N V ( i , j ) M × N
The influence degree of light and shadow is judged by the size of K. If K is small, then the image is severely affected by shadow. Part of the high brightness is neglected in the process of handling. If K is large, then the image is greatly affected by reflection (light). The part of the low brightness value is neglected at this time. When K is close to 0.5, the image affected by light and shadow is smaller, and environmental factors can be neglected approximately.
For the entire image, with the mean value of the brightness representing the brightness value, the convolution coefficient function becomes
Y = ( 1 ( K 0.5 ) 3 ) q
When K is small, then most of the brightness values are outside the normal region and are smaller than the mean of the normal region. That is to say, the overall mapping results should be improved. To compensate for neglecting the influence of regions with a high brightness value, the adjustment center (the position where the convolution coefficient is 1) should be adjusted. The same operation should occur when K is large, but the movement direction of the adjustment center is different.
M e a n 1 represents the mean of the brightness values in the region where the brightness value is less than 0.5. M e a n 2 represents the mean of the brightness values in the region where the brightness value is more than 0.5. When K < 0.5 , the adjustment center K 1 is
K 1 = | 0.5 M e a n 1 | 2 + 0.5
When K > 0.5 , the adjustment center K 2 is
K 2 = 0.5 | 0.5 M e a n 2 | 2
An improved mean of brightness by histogram specification is found by
K K = K × Y = K × ( 1 ( K K i ) 3 ) q ,   i = 1 , 2
The mean of the entire image is close to 0.5 when the image is not affected by any environmental factor. Here, K K is 0.5. q can be obtained from Equation (8) for different images:
q = log 1 ( K K i ) 3 0.5 K

2.2.3. Mapping Result

Images collected under natural conditions are often affected by light, as shown in Figure 4a. Affected by illumination, the jujube loses a high amount of original color information. Equation (2) is used to process the images affected by the light to mitigate the influence of the light, as shown in Figure 4b.
It can be seen in Figure 4 that the darker parts of the jujube/leaves become bright after transformation, while the color information of areas less affected by light remains basically unchanged. In general, quadratic mapping can alleviate the influence of illumination and make the color information of the same target tend to be consistent.

2.3. Experimental Method

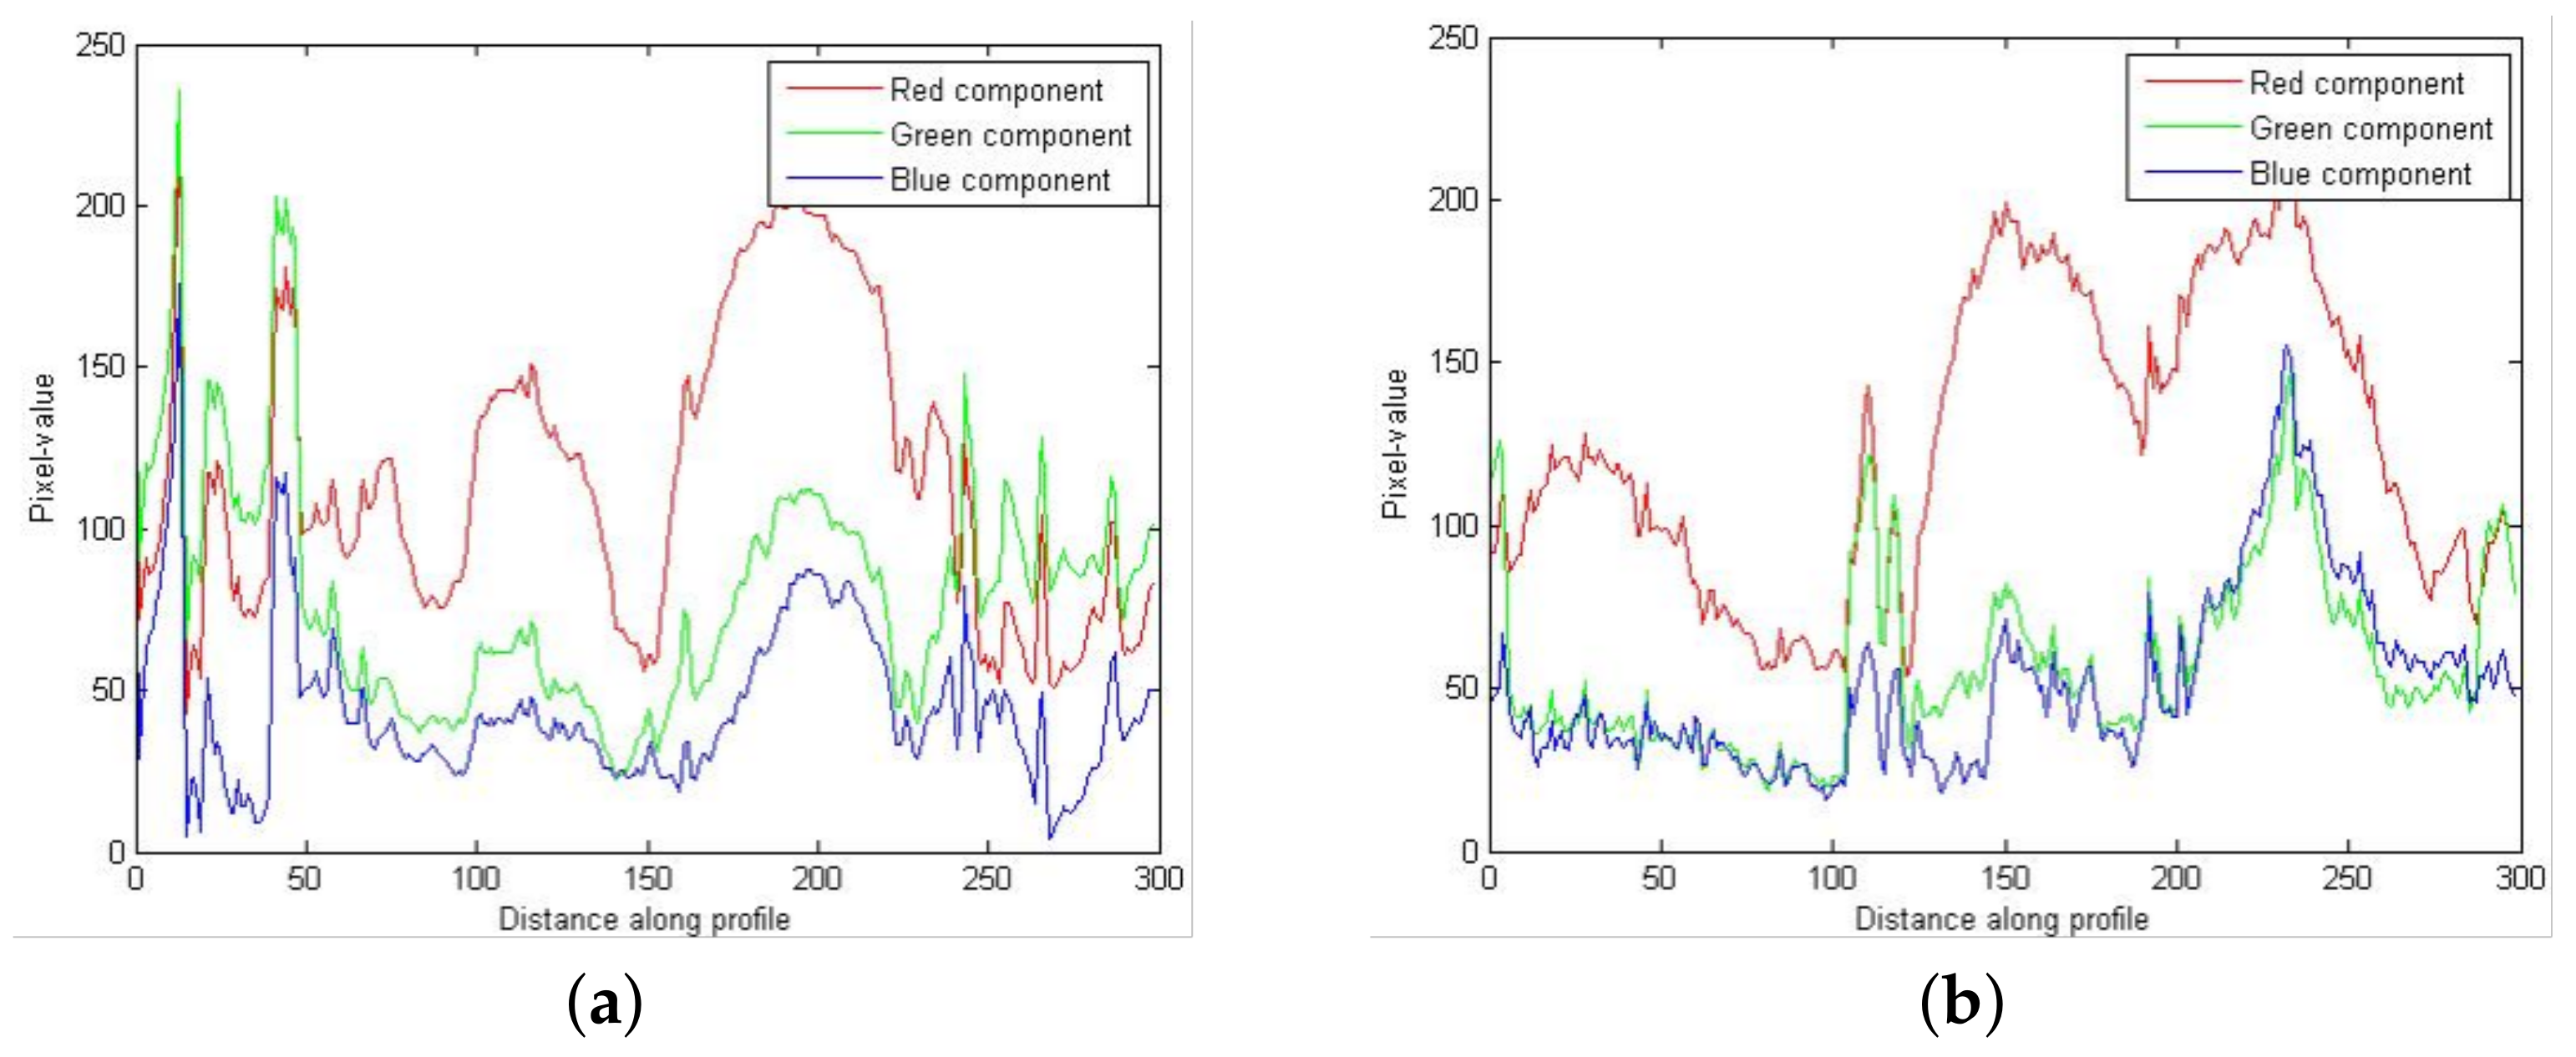
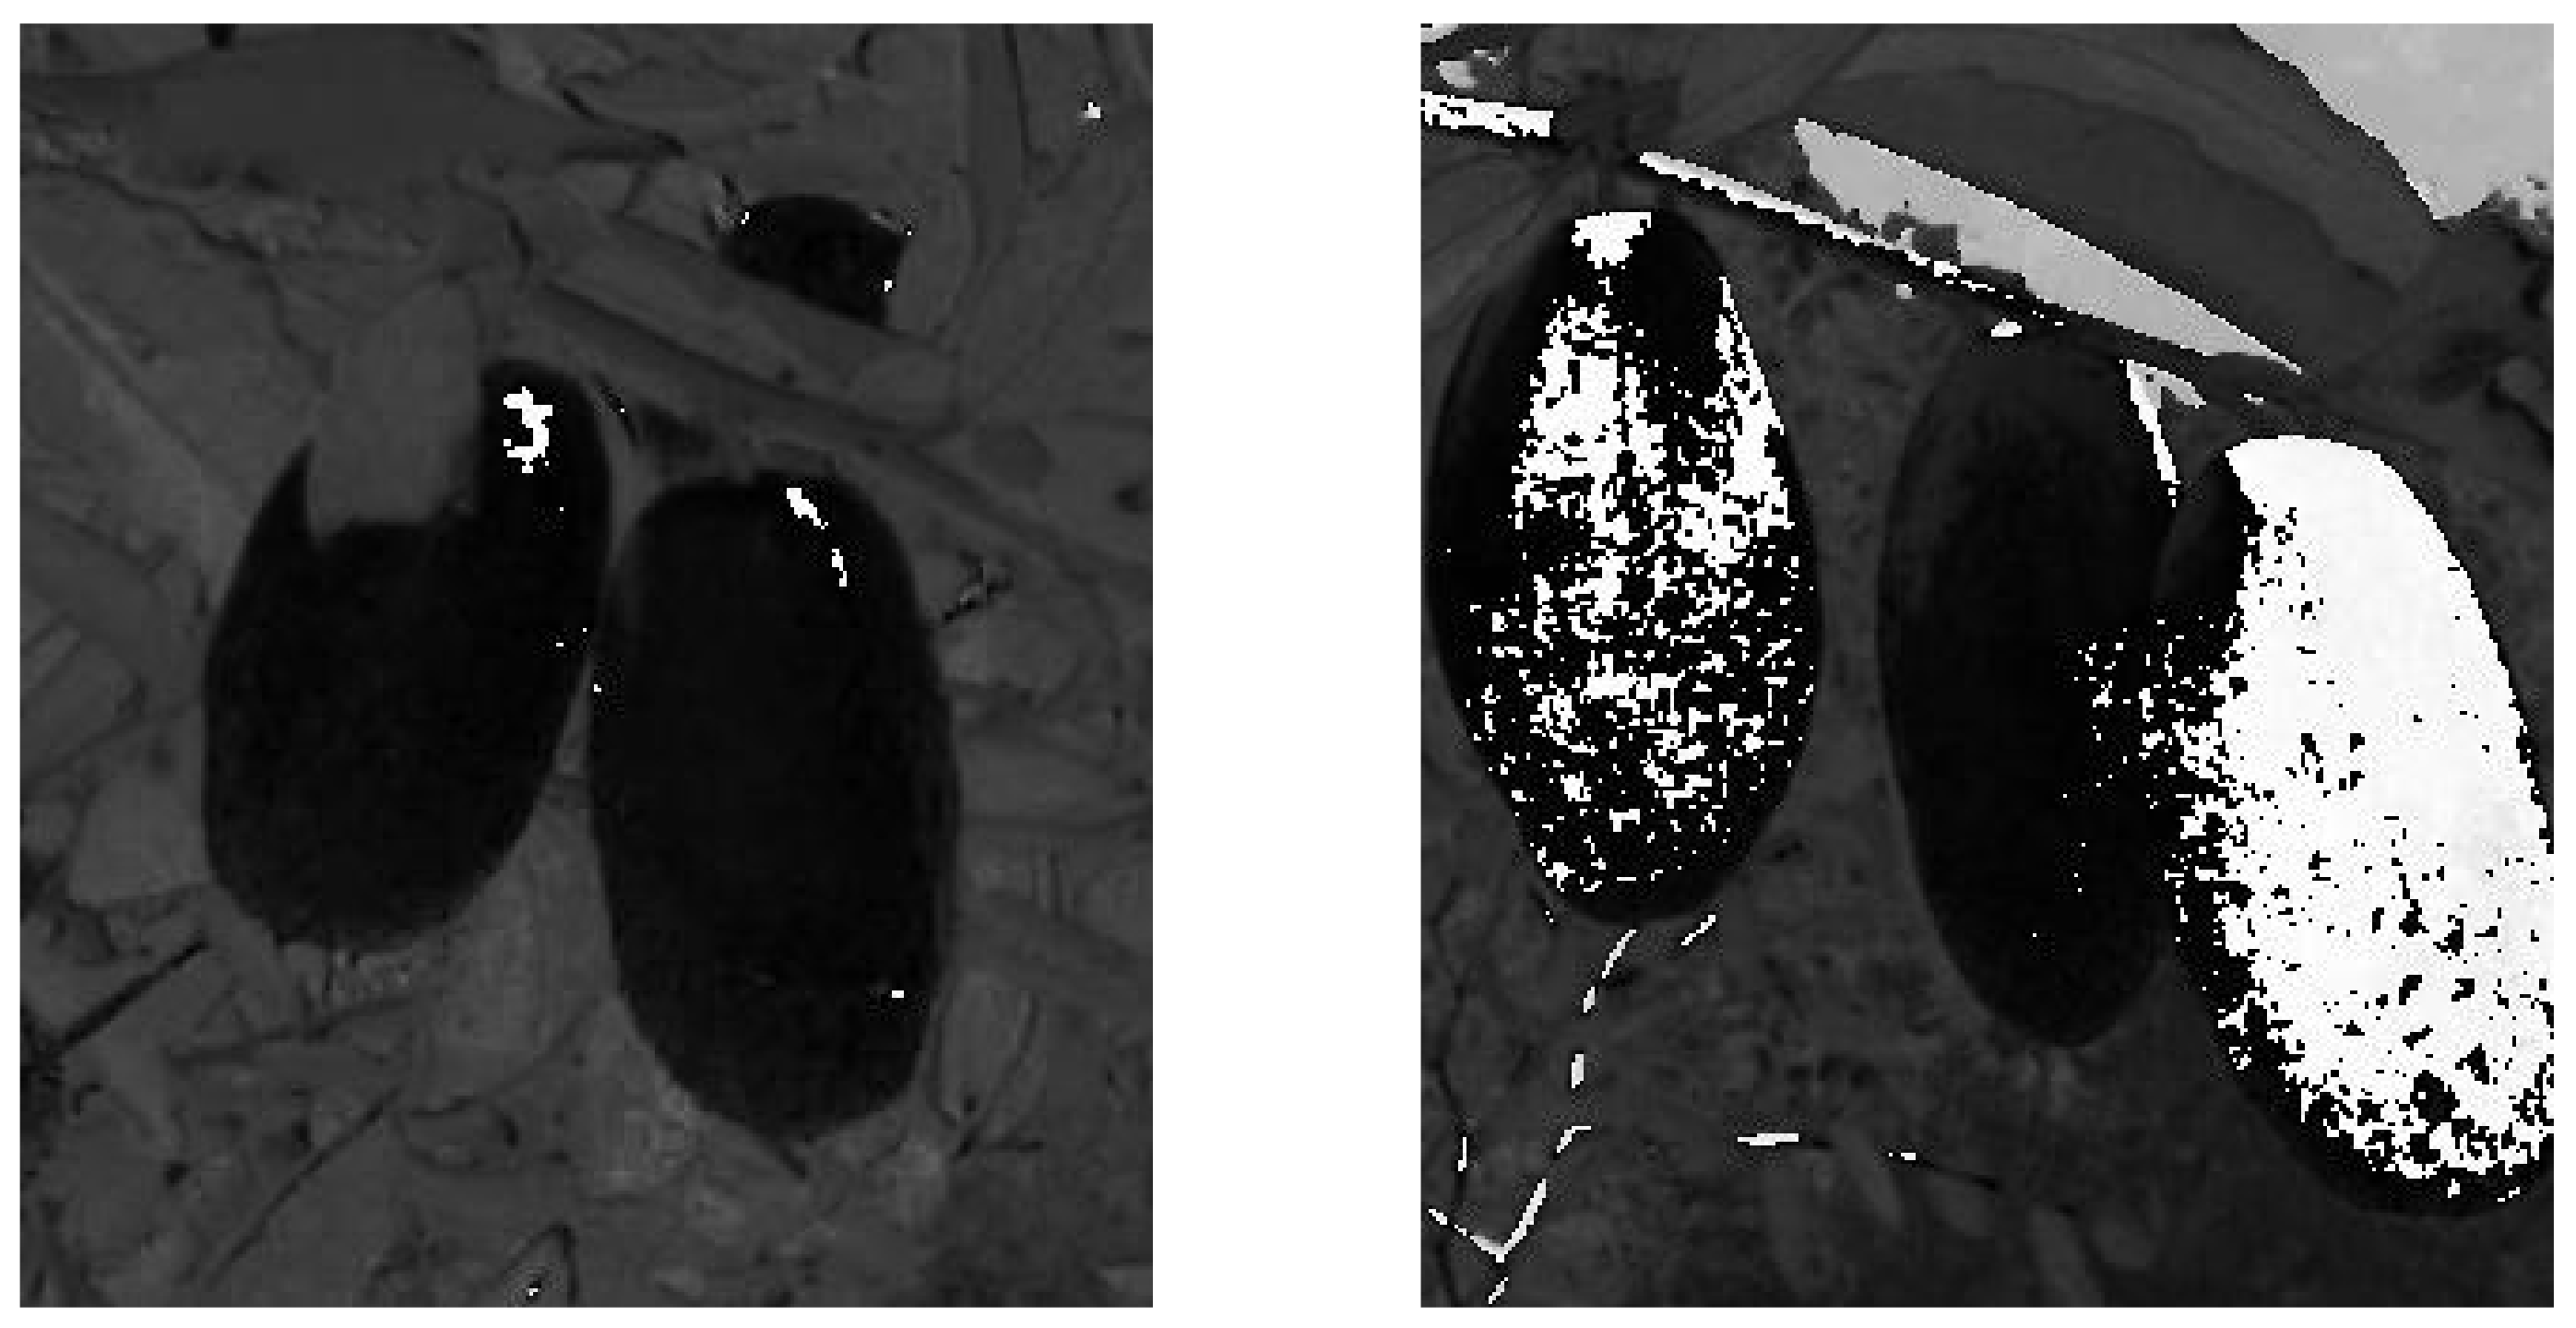
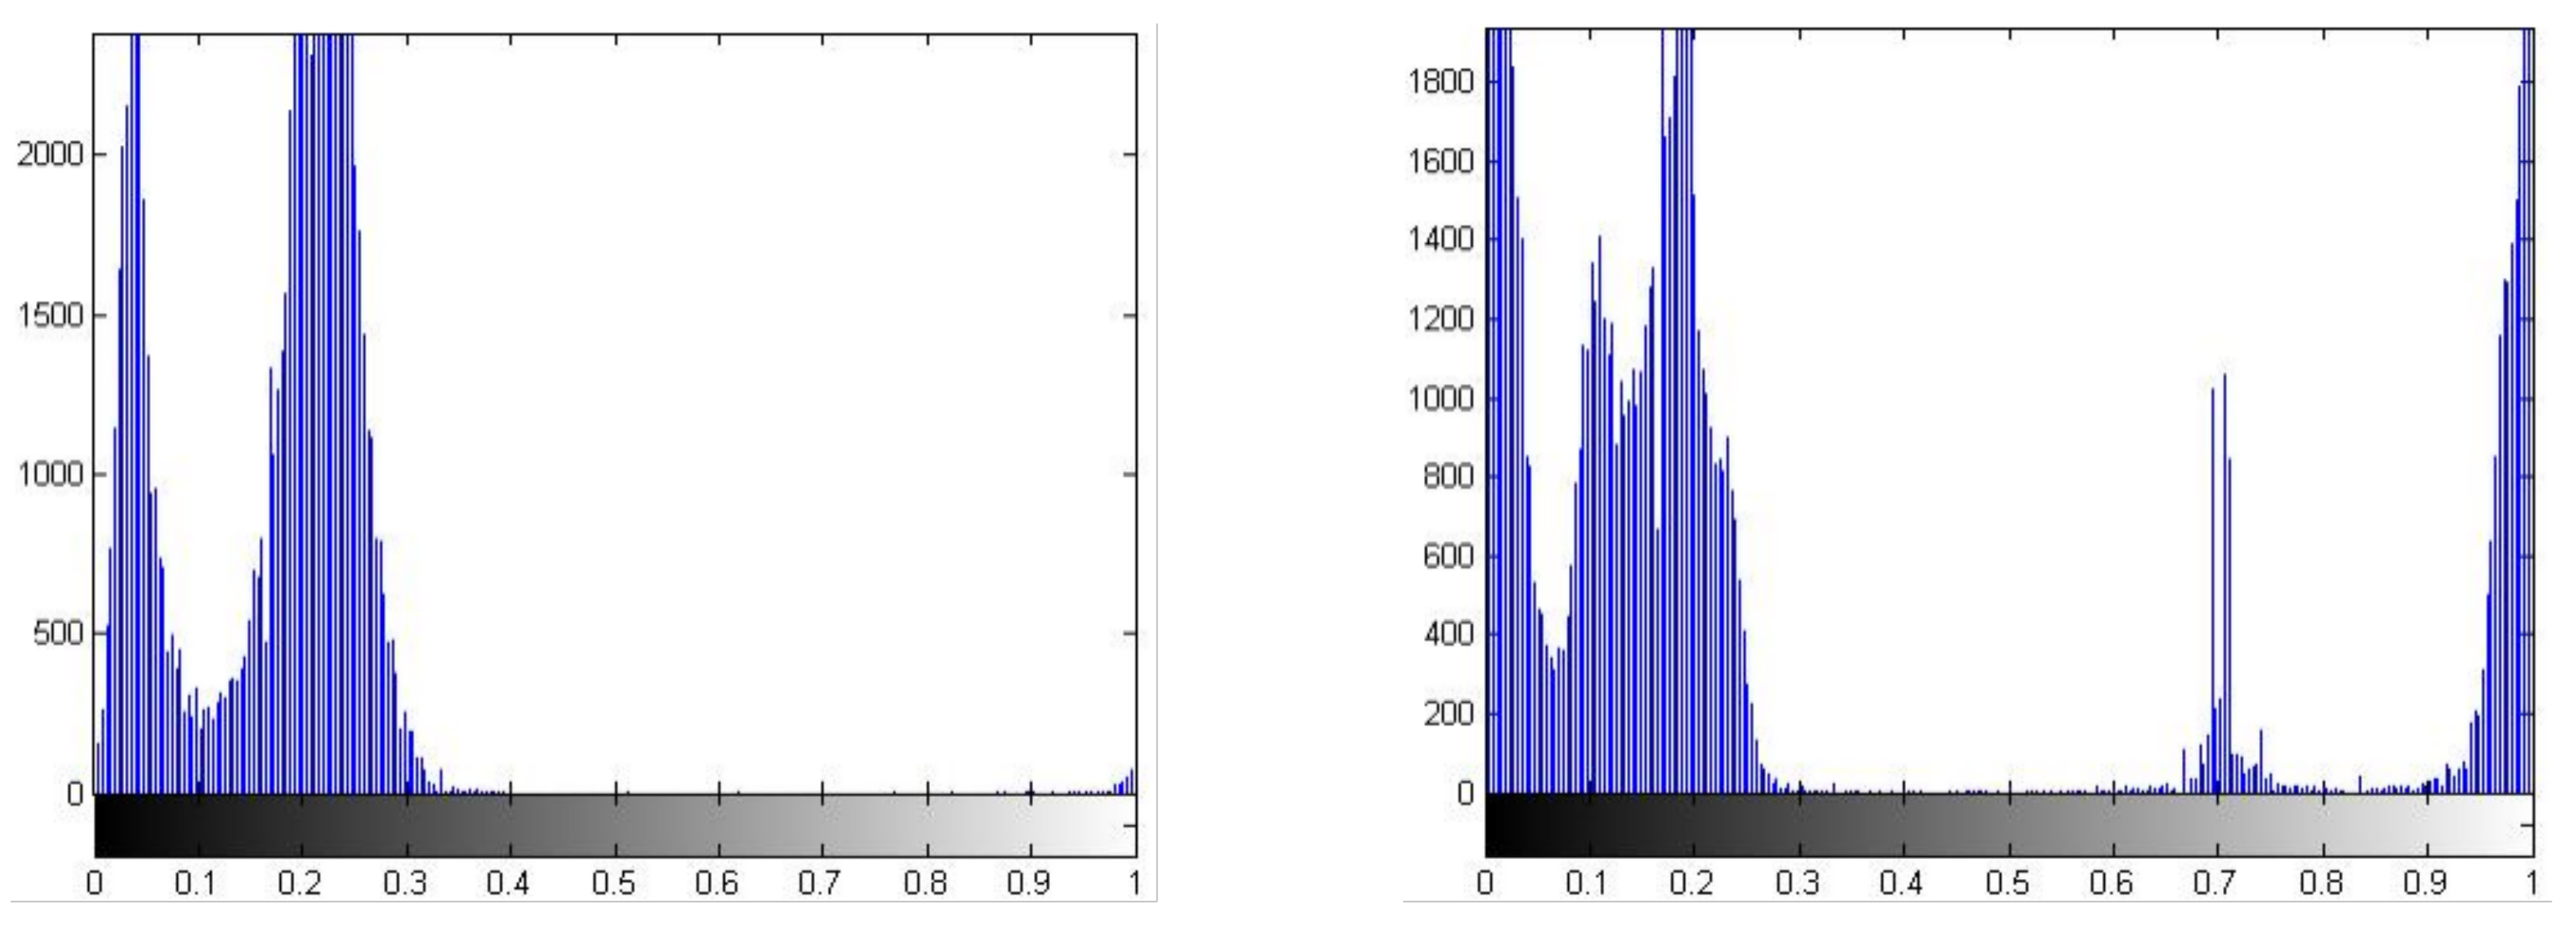
2.3.1. Characteristic Analysis

According to the research on long jujubes in the literature, the picking stage for long jujubes occurs when the red area accounts for 50% or more of the total area. Based on the color distribution characteristics for mature long jujubes, in the 2-D image obtained by picking machinery, the red area accounts for more than 85%.
Mature long jujubes are different from the surrounding environment in color information. In this paper, the statistical analysis for several images of long jujubes indicates that the gray value of the R component is generally higher than that of the G and B components in the corresponding position. Figure 5 displays the cross-sectional pixel values along the middle position for images of long jujubes.
It can be seen in Figure 5 that the R, G, and B components of long jujubes have obvious distribution characteristics.
f ( i , j ) = 1 , R ( i , j ) G ( i , j ) t 0 , R ( i , j ) G ( i , j ) < t
f ( i , j ) represents a pixel value that has been handled in the corresponding position. R ( i , j ) and G ( i , j ) represent, respectively, the pixel value of the red component and the pixel value of the green component. t represents the threshold.
The data statistics of the long jujubes indicate that the pixel value of the red component is higher than that of the green and blue components by about 20. Here, t is 20. As shown in Figure 6, the segmentation results of long jujubes are segmented by Equation (9).
Based on the influence of multiple factors, such as the complicated shooting environment, the color information of the image will change greatly when the capturing angle is rotated by a certain angle, as shown in Figure 7.
It can be seen in Figure 6 and Figure 7 that the images segmented by the above statistical laws have problems, such as the incomplete segmentation of long jujubes, the segmentation of redundant objects, and severe adhesion between redundant objects and target objects.
Although performance is poor, some useful factors can be obtained by the statistical analysis of a large number of images.
(1) In the part of the image showing the long jujube, the red component is dominant.
(2) In the part of the image showing the long jujube, the gray value of the R component is generally higher than that of the G component by 20 dB or more at the corresponding position.
(3) The distribution characteristics of the color components in most background objects are different from those in the target object (the long jujubes). However, there is also a partial region in the background objects that are similar to that of long jujubes, which have a great influence on the result of segmentation.

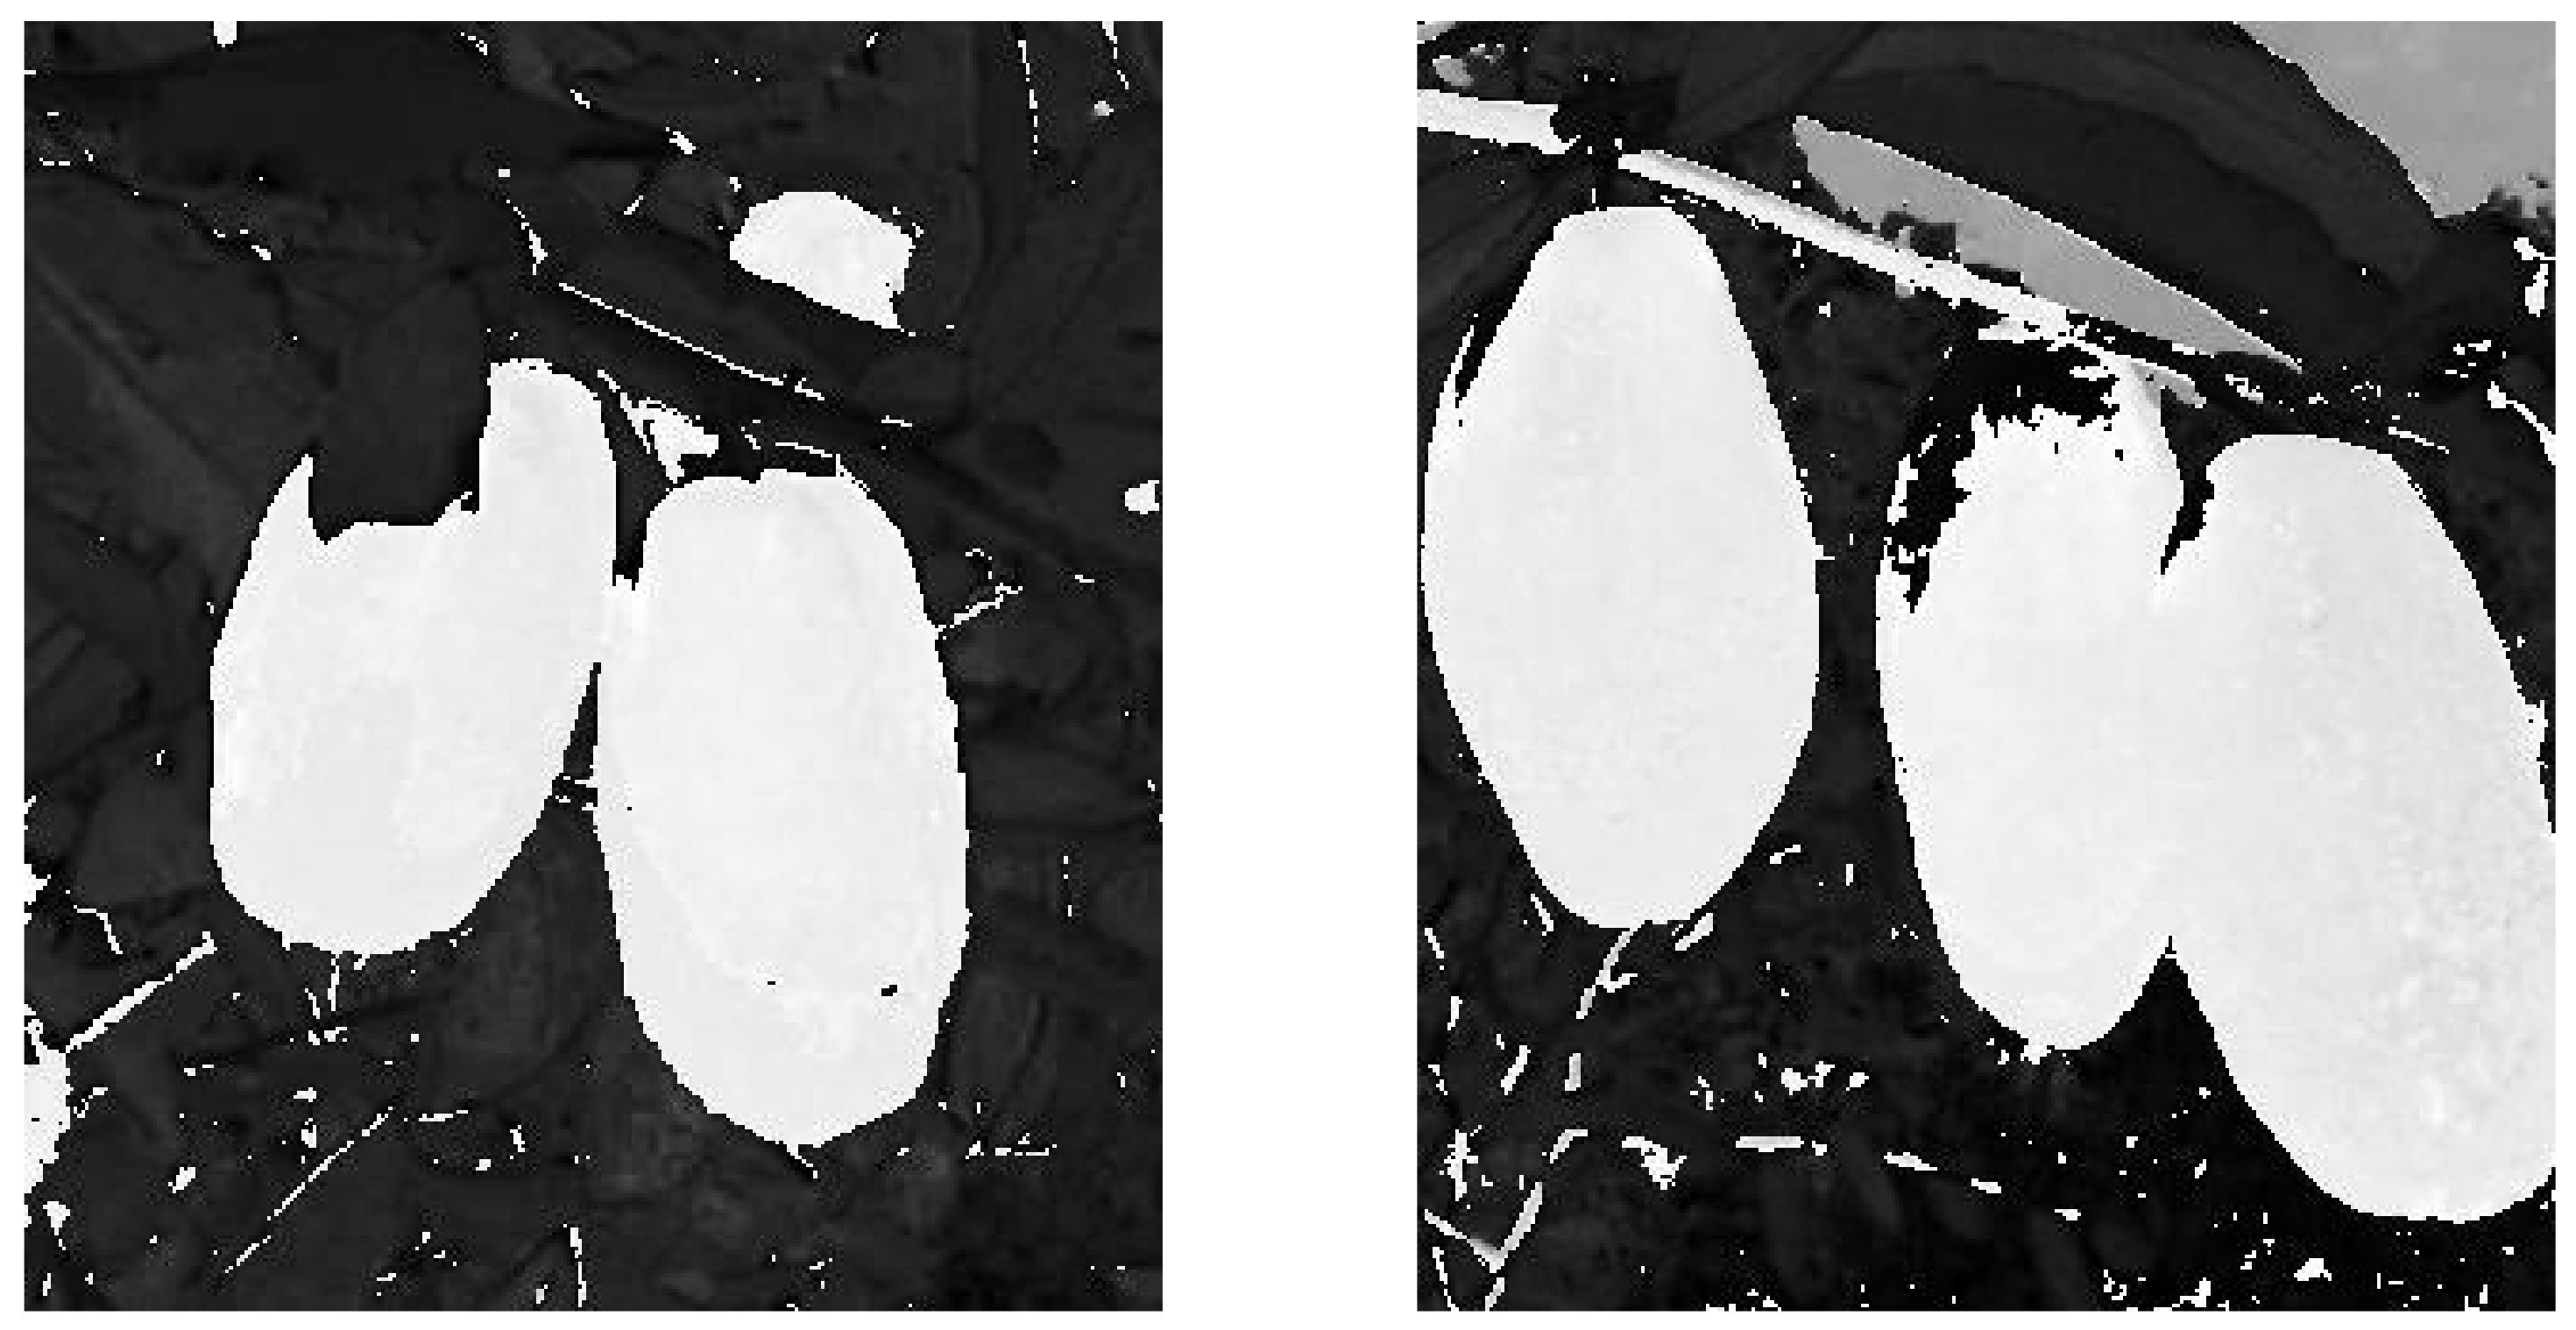
2.3.2. The Marker Image

Finding a marker image is the operation of finding the valley bottom of a topographic map. In this paper, in order to ensure the accuracy of segmentation, all valley bottoms of the topographic map are located inside the region of the long jujubes. Based on the fact that the red component of the long jujubes is dominant, the red regions are used to find the valley bottom. The statistical results of 10 images that are similar to Figure 2 are shown in Table 1.
Table 1 shows the distribution range of pixel values between 0 and 0.6 for the R-G image. The minimum pixel value is 0 for the target objects and background objects. The reason why the target objects have a 0 pixel value is mainly that the part of the long jujubes has cyan information and dark-red spots. These areas are not large enough to affect the final result. The statistical analysis for the target objects in the 10 R-G images shows that the region with a pixel value greater than 0.05 accounts for more than 94.48%, and the average value reaches 97.376%. In the background object, the pixel value is greater than 0, and that of some regions are as high as 0.3343. In the R-G image, the distribution range of the target object is generally wider than that of the background object. In Image No. 6, the same distribution range between the target object and the background object is as high as 74.745%. In general, the maximum distribution range of the background object is less than 0.3343 and that of the target object is more than 0.4118. Both appear in the same overlay area, but the target object has its own unique distribution range, which makes it possible for the valley bottom of the marker image to be located inside the region of the long jujubes. In this paper, 0.34 is the segmented threshold needed to obtain the marker image. The marker image is shown in Figure 8.

2.3.3. The Mask Image

(1) Extraction and Analysis of Hue
The characteristic analysis of the images of the long jujubes shows that there is difference between the long jujube section and the background section in color information. Therefore, it is a viable solution to use color information to construct a dam. Figure 9 shows the hue extraction result.
The hue is described by the angle, which is distributed in 360° circumferential patterns. However, the hue is linearly described and cannot be described in a circular manner. Therefore, a break-point exists in the circumferential distribution of the hue. That is, the hue representation changes from the original circular distribution to the linear distribution (the appearance of the start point and the end point). At the start point, the region close to 0°+ appears black. At the end point, the region close to 360°− (or 0°−) is white. As a result, the area that is close to red is divided into two parts, which results in a considerable difference in the representation of similar hues that are close to the break-point. As shown in Figure 10, the long jujube section is divided into two parts, where one appears black and the other appears white.
An effective way to solve this problem is to rotate the hue. Figure 7 is a two-dimensional histogram of the long jujubes. The long jujube section is divided into two parts: the region close to 0 and the region close to 1. Here, the image is divided into three objects: a 0+ object (the long jujube region with a black appearance), a 1− object (the long jujube region with a white appearance), and the background object. The mean of the pixel value between the 0+ object and the background object is less than that between the background object and the 1− object. That is to say, the difference between the background object and the 1− object is larger, which makes the boundary more clearly beneficial to the accuracy of segmentation. Therefore, the object will be rotated from the 0+ region to the 1− region. The rotary angle plays an important role in the process of obtaining a mask image. As shown in Figure 11, the different rotary angles have different effects.
In Figure 11, there is a great lack of long jujubes when the rotary is too small, and a large background object is rotated to the 1− region when the rotary angle is too large. Different images of long jujubes have different rotary angles, so it is important to find the optimal rotary angle.
(2) Adaptive Angle Rotating Based on an Energy-Driven Approach
The distribution range of the hue where red information is dominant has two prats: 0°–60° and 300°–360°. The maximum rotary angle of the rotation of the long jujube section from 0°–60° to 300°–360° part is 60°. The normalized range of the rotary angle is 0–0.17. Analysis of the statistical characteristics of the R-G image shows that both the partial target and the background objects have the same pixel values, which limits the ability to directly use R-G images for image segmentation and other operations. According to the statistics of the R-G images as well as Figure 8 and Figure 9, the following facts can be obtained.
(a) In the R-G image, the color information of partial long jujubes is unique, and the pixel values of this section are the highest of the entire R-G image.
(b) Some long jujube regions that need to be rotated coincide with the area of a high pixel value that is unique to the R-G image. As the rotation continues, the high pixel value area gradually rotates to the 1− area until the rotation of the high pixel value area is completed.
(c) As the hue rotates, a small part of the background area will also be rotated to the 1− area. However, if the hue continues to rotate, a large number of background regions will be rotated to the 1− region when all long jujube regions are rotated to the 1− region.
Therefore, with the rotation of the hue, the unique high pixel value region of the R-G image will also be transformed. With the addition of high pixel values, the mean of the pixels in the rotated region will increase until the end of the rotation. In the process of angle rotating, the average value of the pixels in the long jujube region will appear to be extreme. Because all high pixel value areas have been rotated to the 1− area, the average value of the pixels will gradually decrease when the rotation continues, which provides a termination condition for the angle that is rotating.
The average value of pixels in the long jujube section is used as the energy. The rotation will stop when the energy reaches the maximum. The angle is rotated by a fixed value, which is 0.01. k is the time of rotation. D ( k ) is the region after rotating k times. V ( i , j ) is the pixel value in the R-G image. N u m ( k ) is the area of D ( k ) . The sum of the pixel value in D ( k ) is expressed as Equation (10).
T o l ( k ) = ( i , j ) D ( k ) V ( i , j )
The energy is
E n ( k ) = T o l ( k ) N u m ( k )
The rotation will stop when the energy reaches the maximum. Therefore, the termination condition is
E n ( k ) > ( E n ( k + 1 ) + E n ( k + 2 ) + E n ( k + 3 ) ) 3
The results of using Equation (12) as the termination condition are shown in Figure 12.
Figure 12 shows that the expression basically tends to be consistent for long jujube regions after angle rotation. Accompanied by this process, only a small part of the background region is rotated to the target region, and this has little effect on the result. However, in the edge portion, there are still areas that are not rotated to the 1− area.
(3) Error Compensation of Angle Rotation
In general, in addition to the shelter of branches and leaves, the shelter of the Lingwu long jujube is also an important factor that causes shadows. The pre-processing of the image can only reduce the influence of environmental factors to a certain extent. In addition, during the rotation, in addition to the rotation of long jujubes, some background regions are also rotated into the target region, so the termination condition is satisfied even if the rotation is not finished. To eliminate this error, error compensation is necessary.
In this paper, the ratio of the difference (the difference between the divided area after being rotated and the original divided area) is the compensation coefficient. The compensated image is shown in Figure 13.
(4) Morphological Processing
The mask image needs to make the boundary between the long jujube regions and the background regions clear. Here, the Prewitt operator is considered to extract edge detection, and the detected image is used as a mask image, as shown in Figure 14.

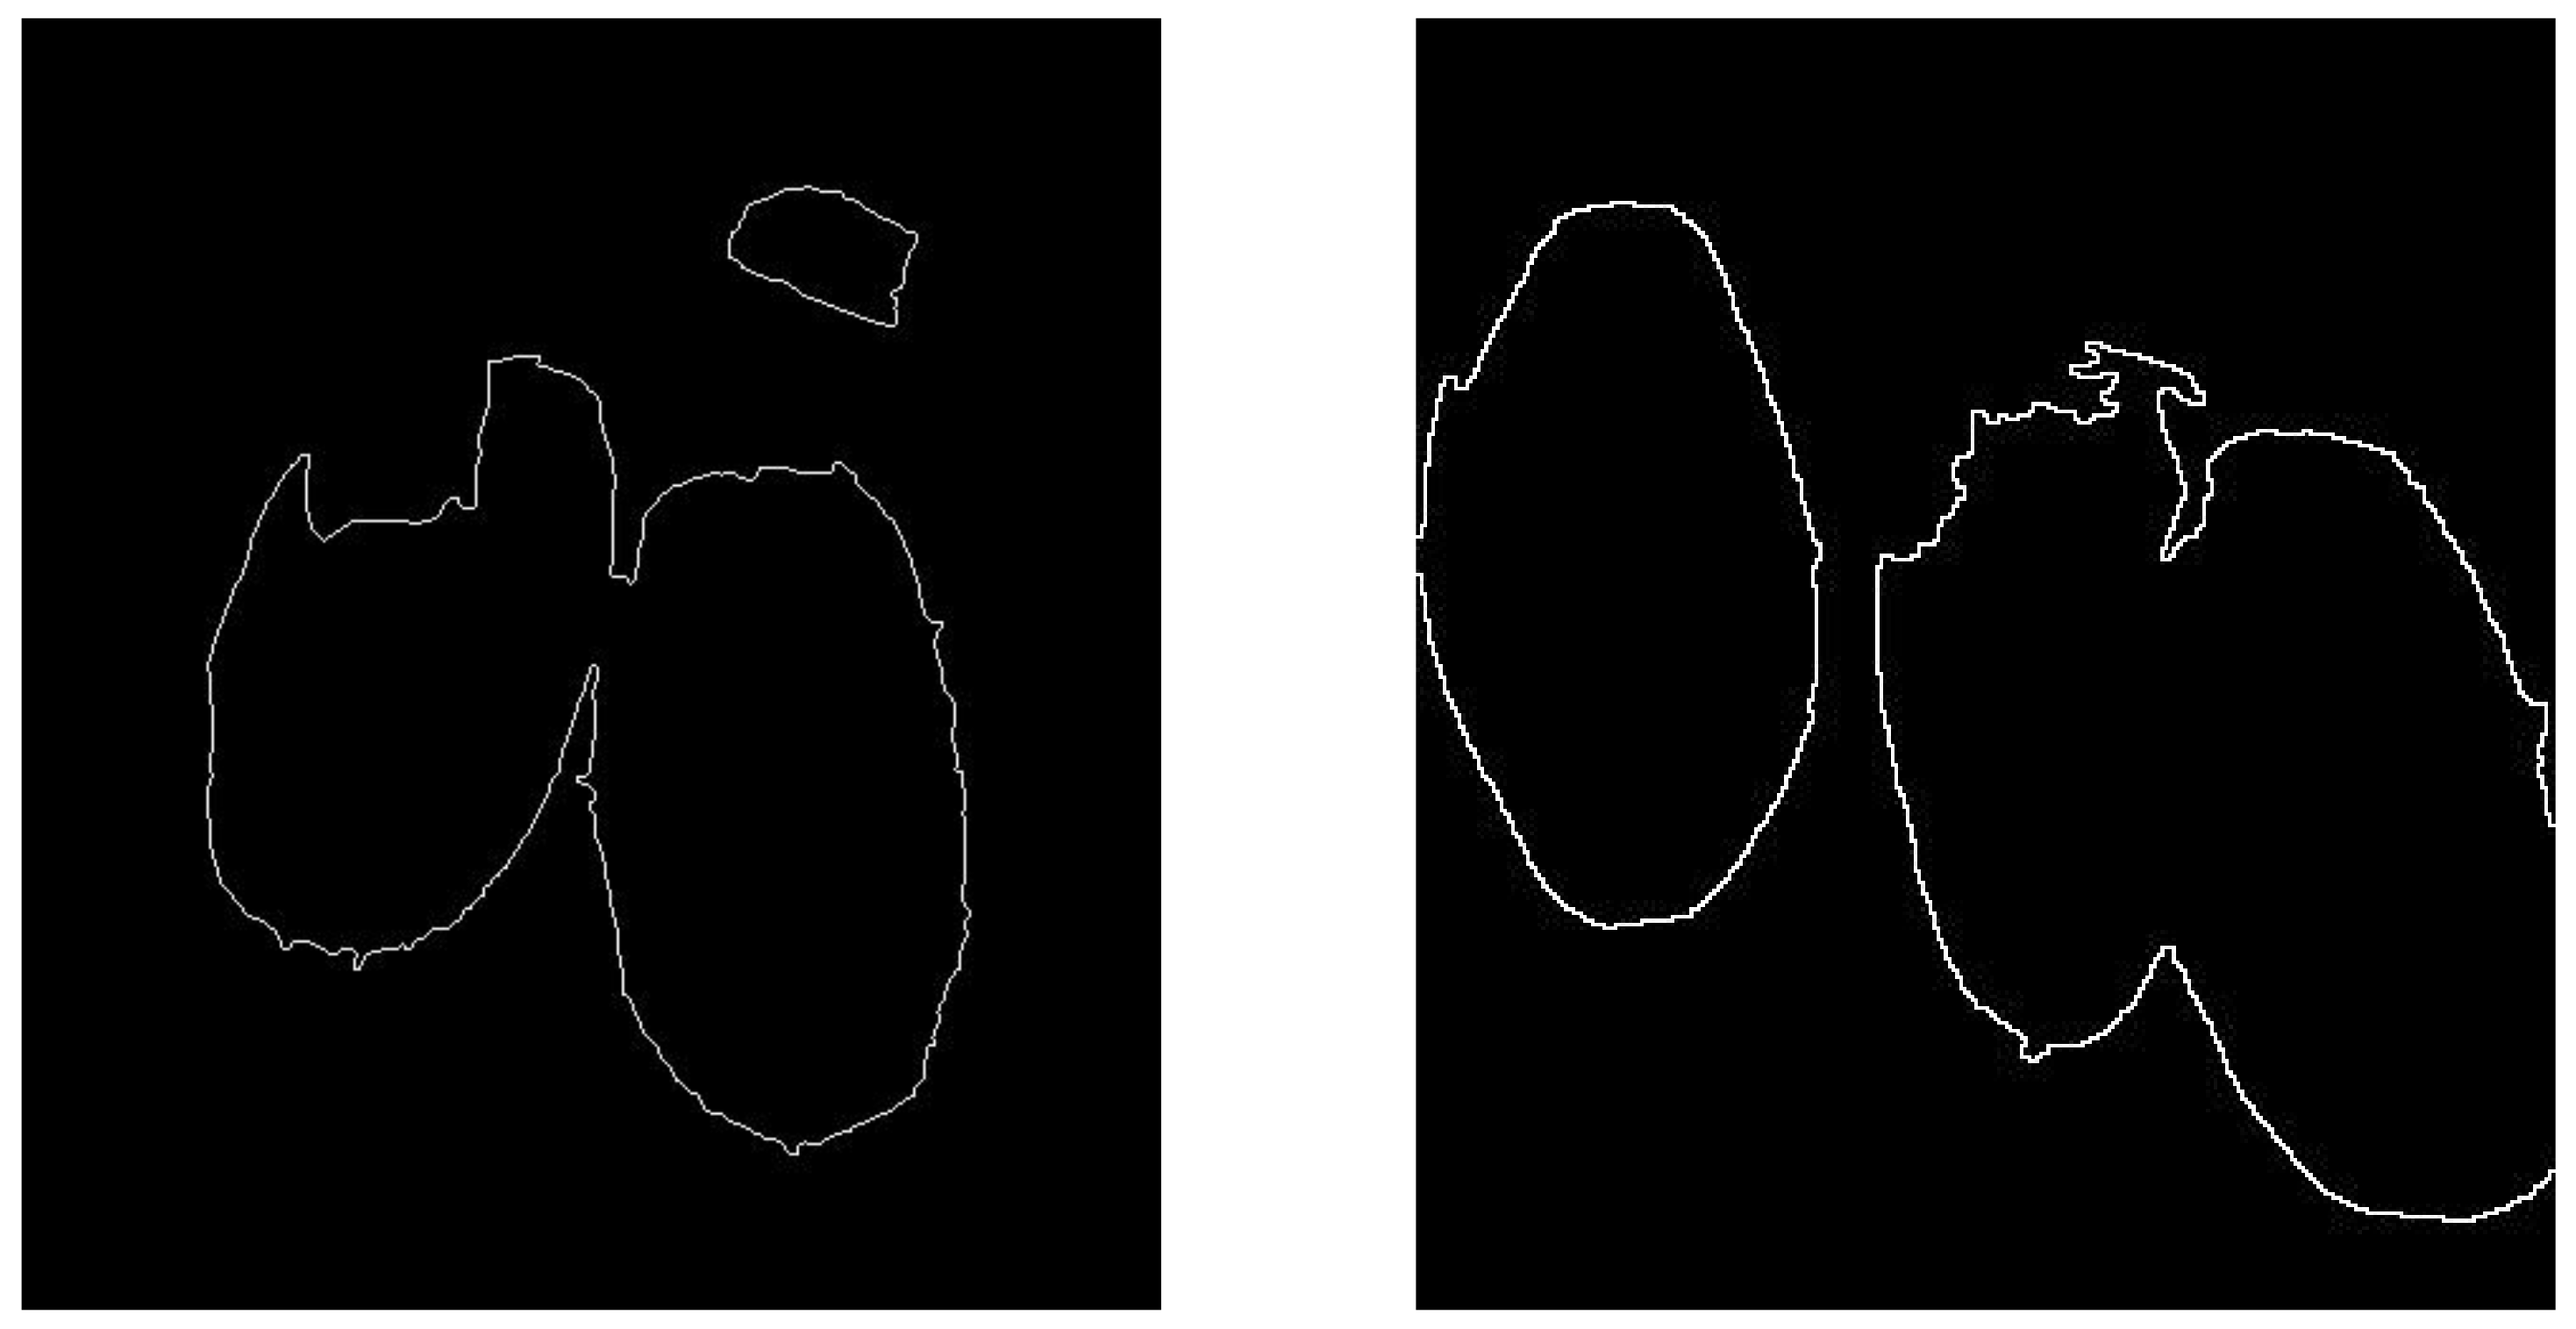
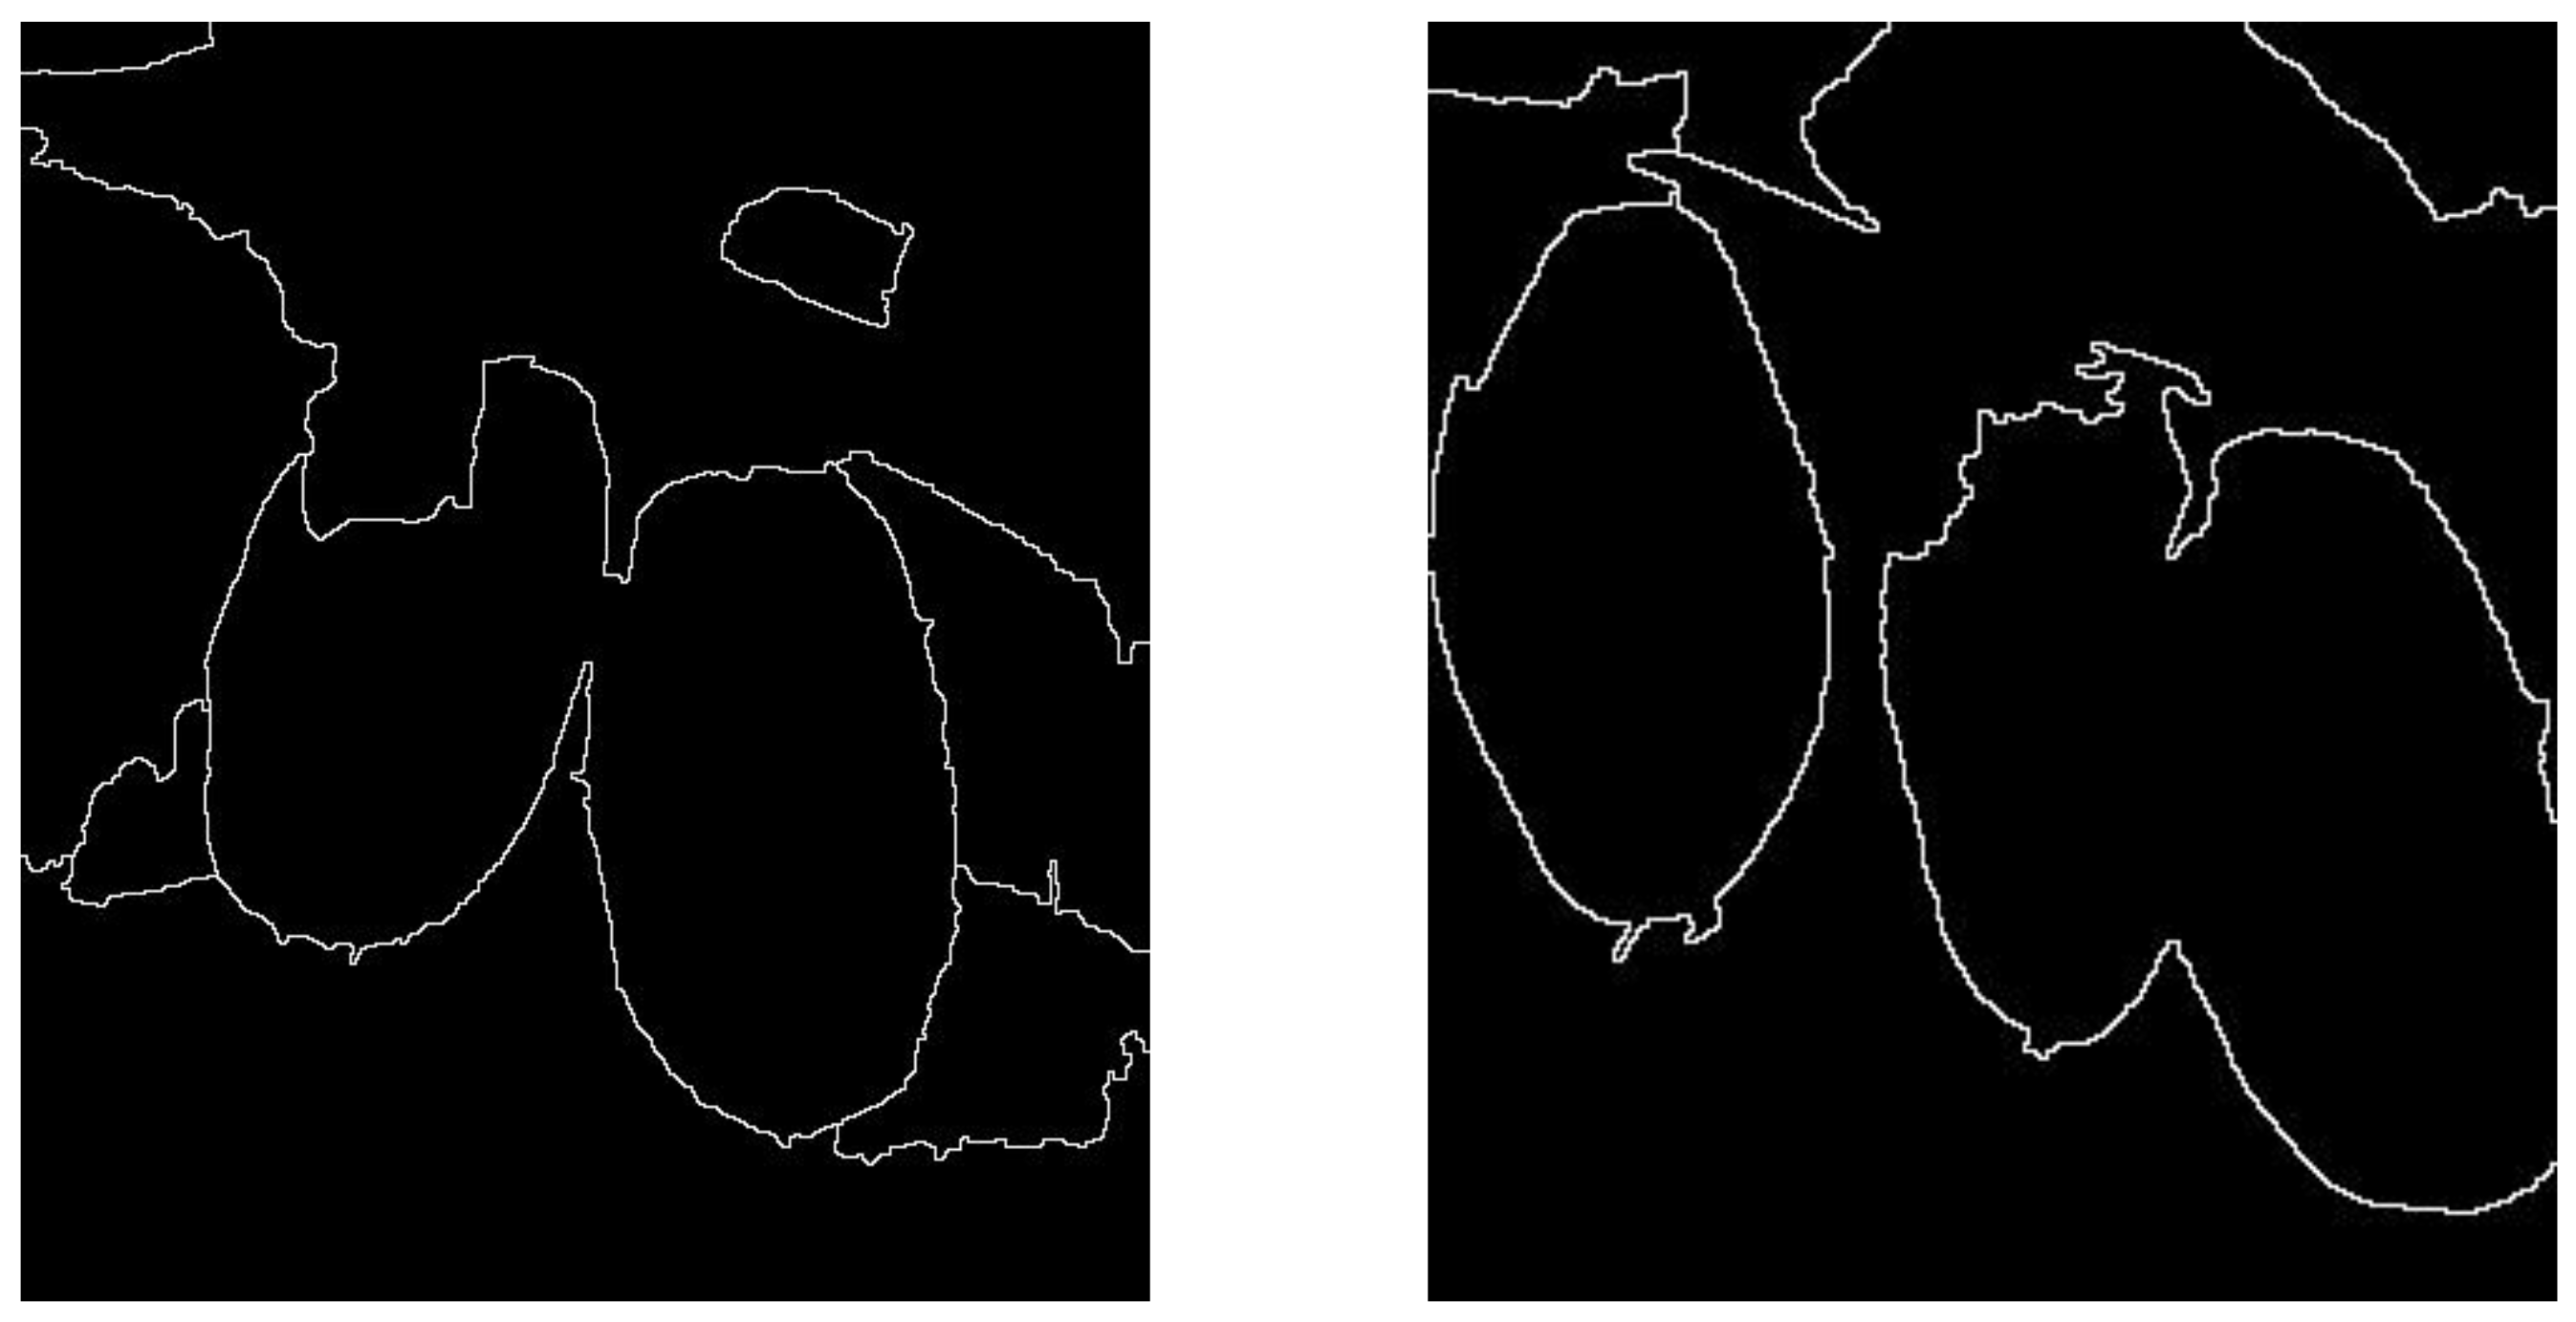
2.3.4. Segmentation by the Marker-Controller Watershed Algorithm

Since the marker points are located inside the target object, there needs to be a clear boundary between the target region and the background region in the image. The complexity of the background has no effect on the final segmentation. The image after being handled by the marker-controller watershed algorithm and an image of the extracted edge are shown in Figure 14 and Figure 15.

3. Results

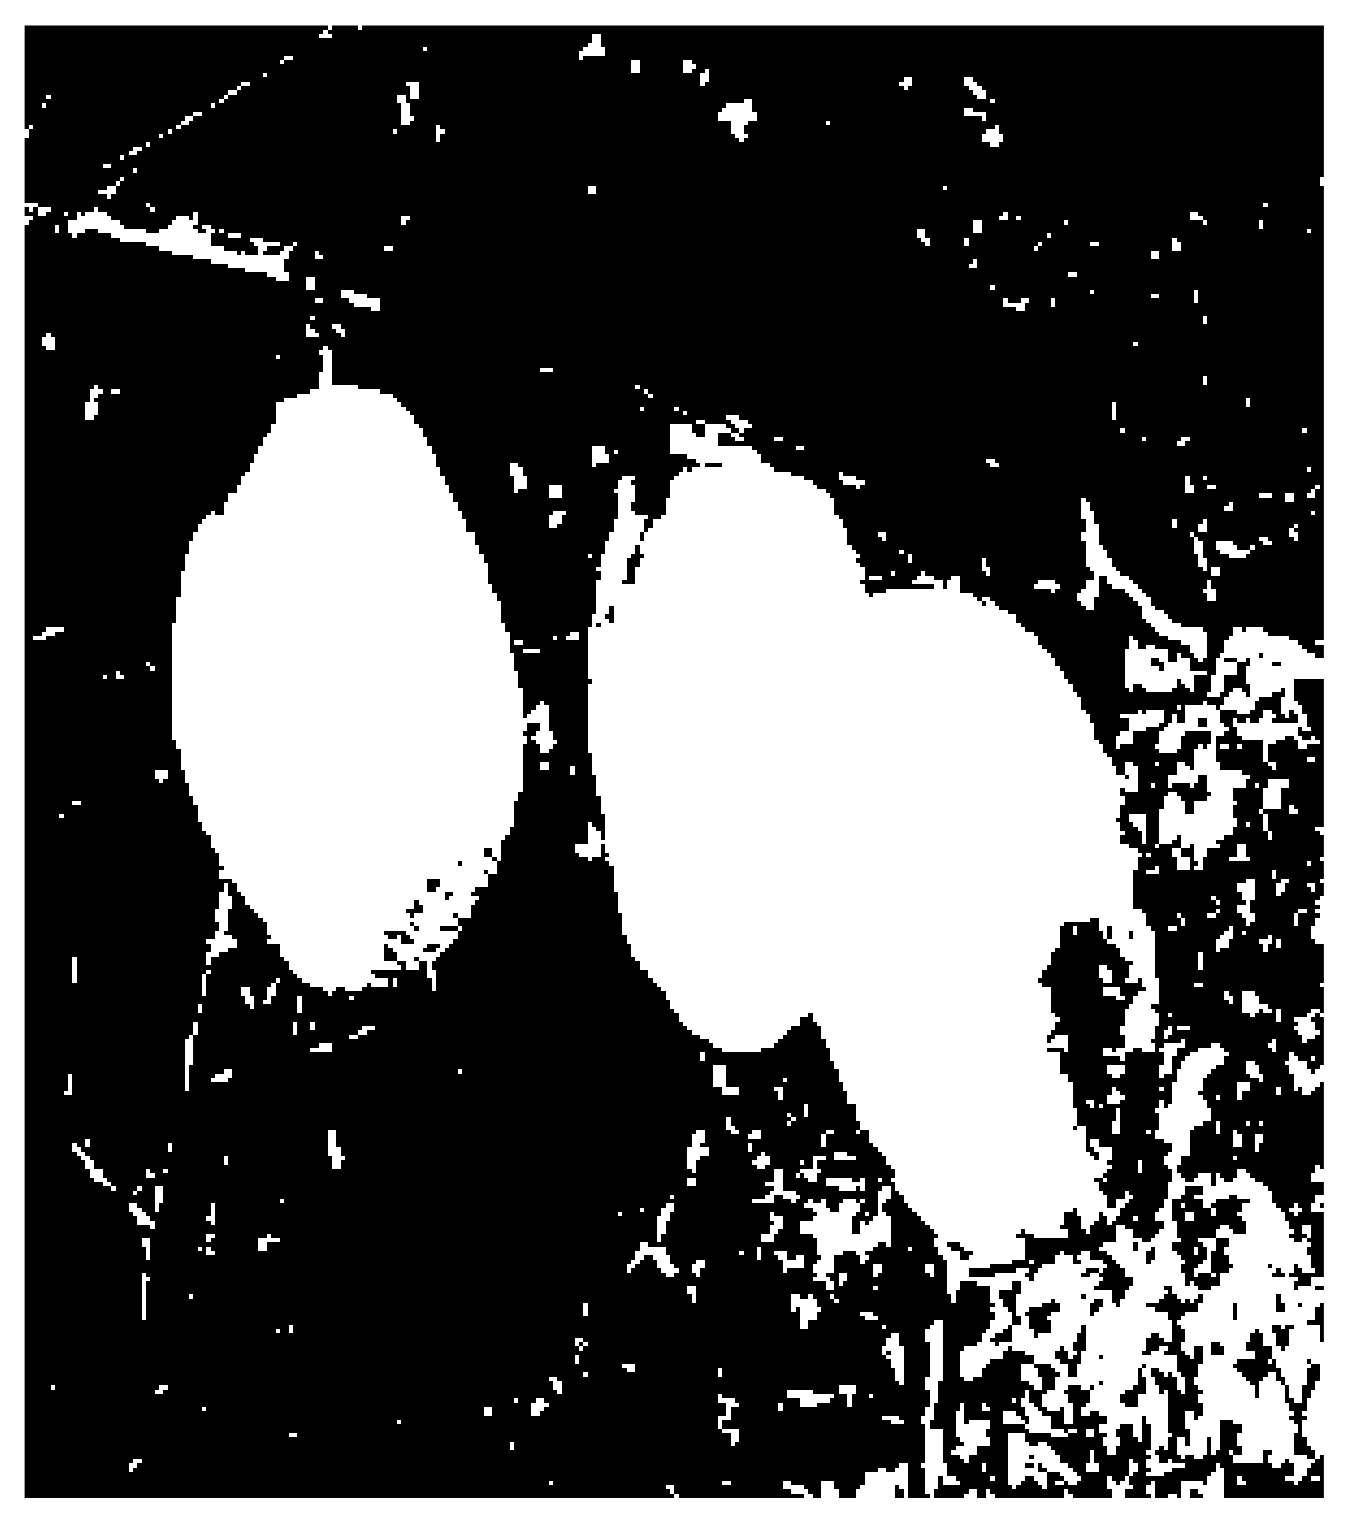
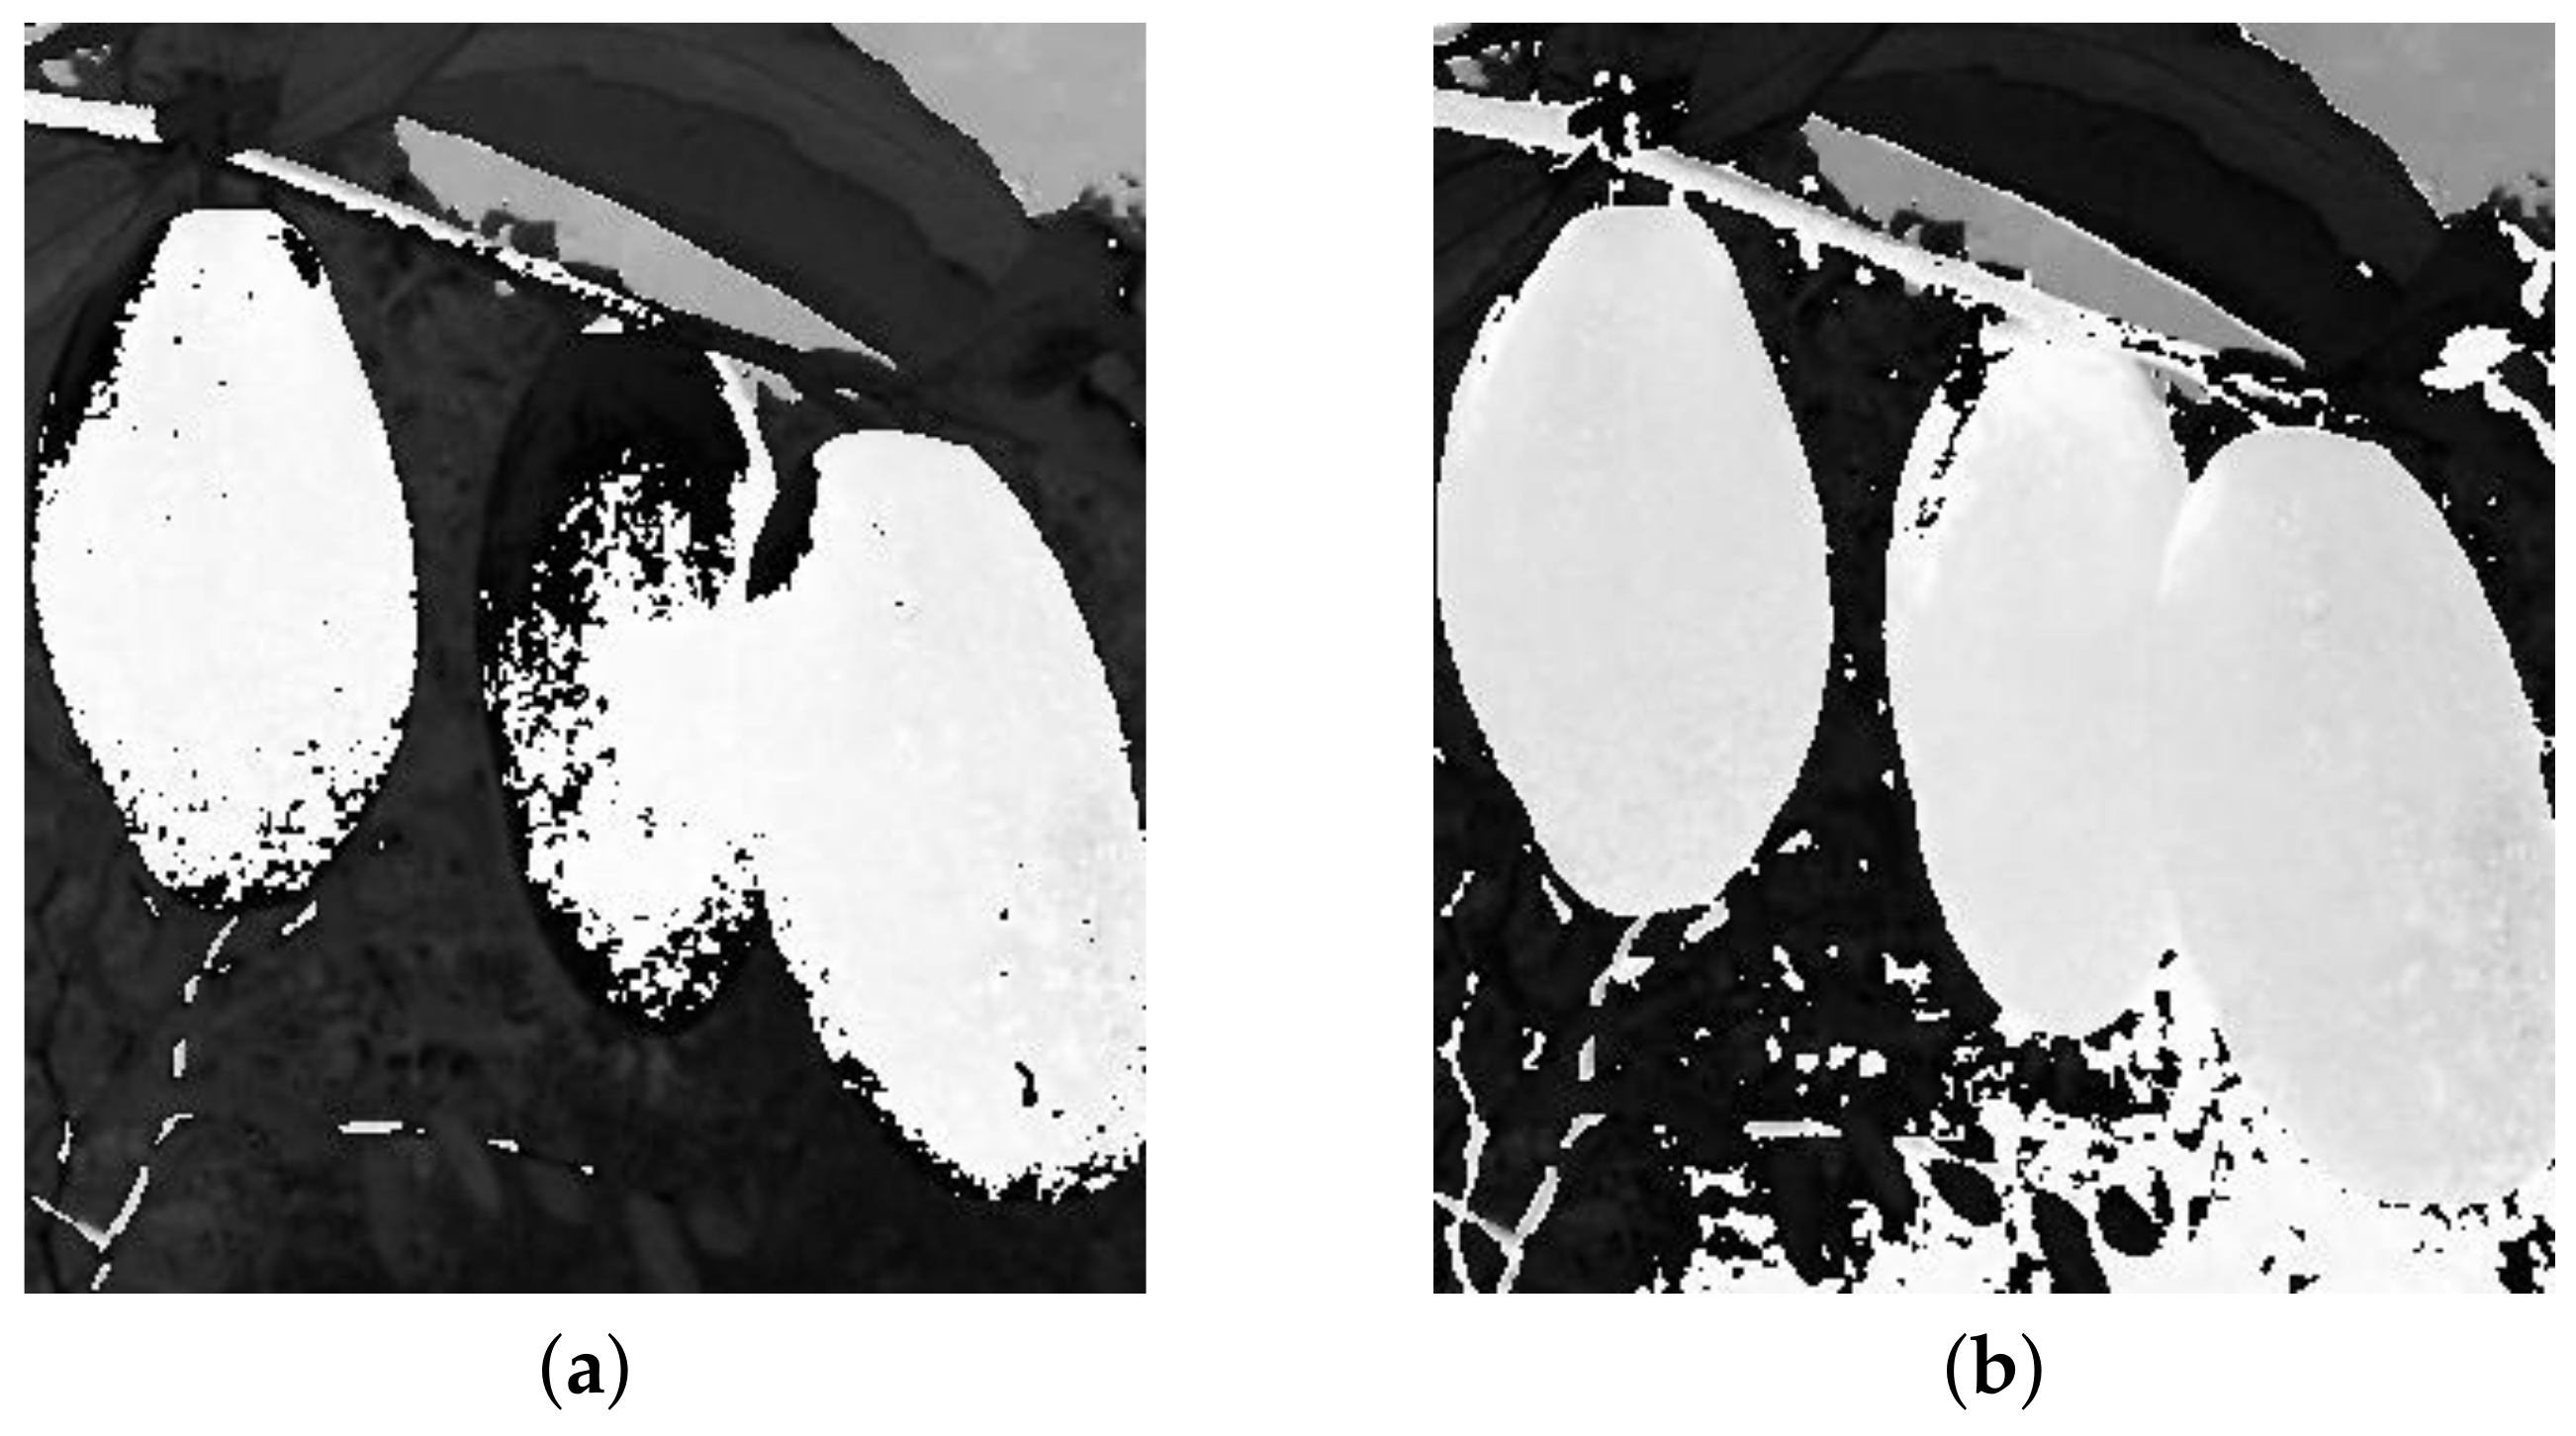
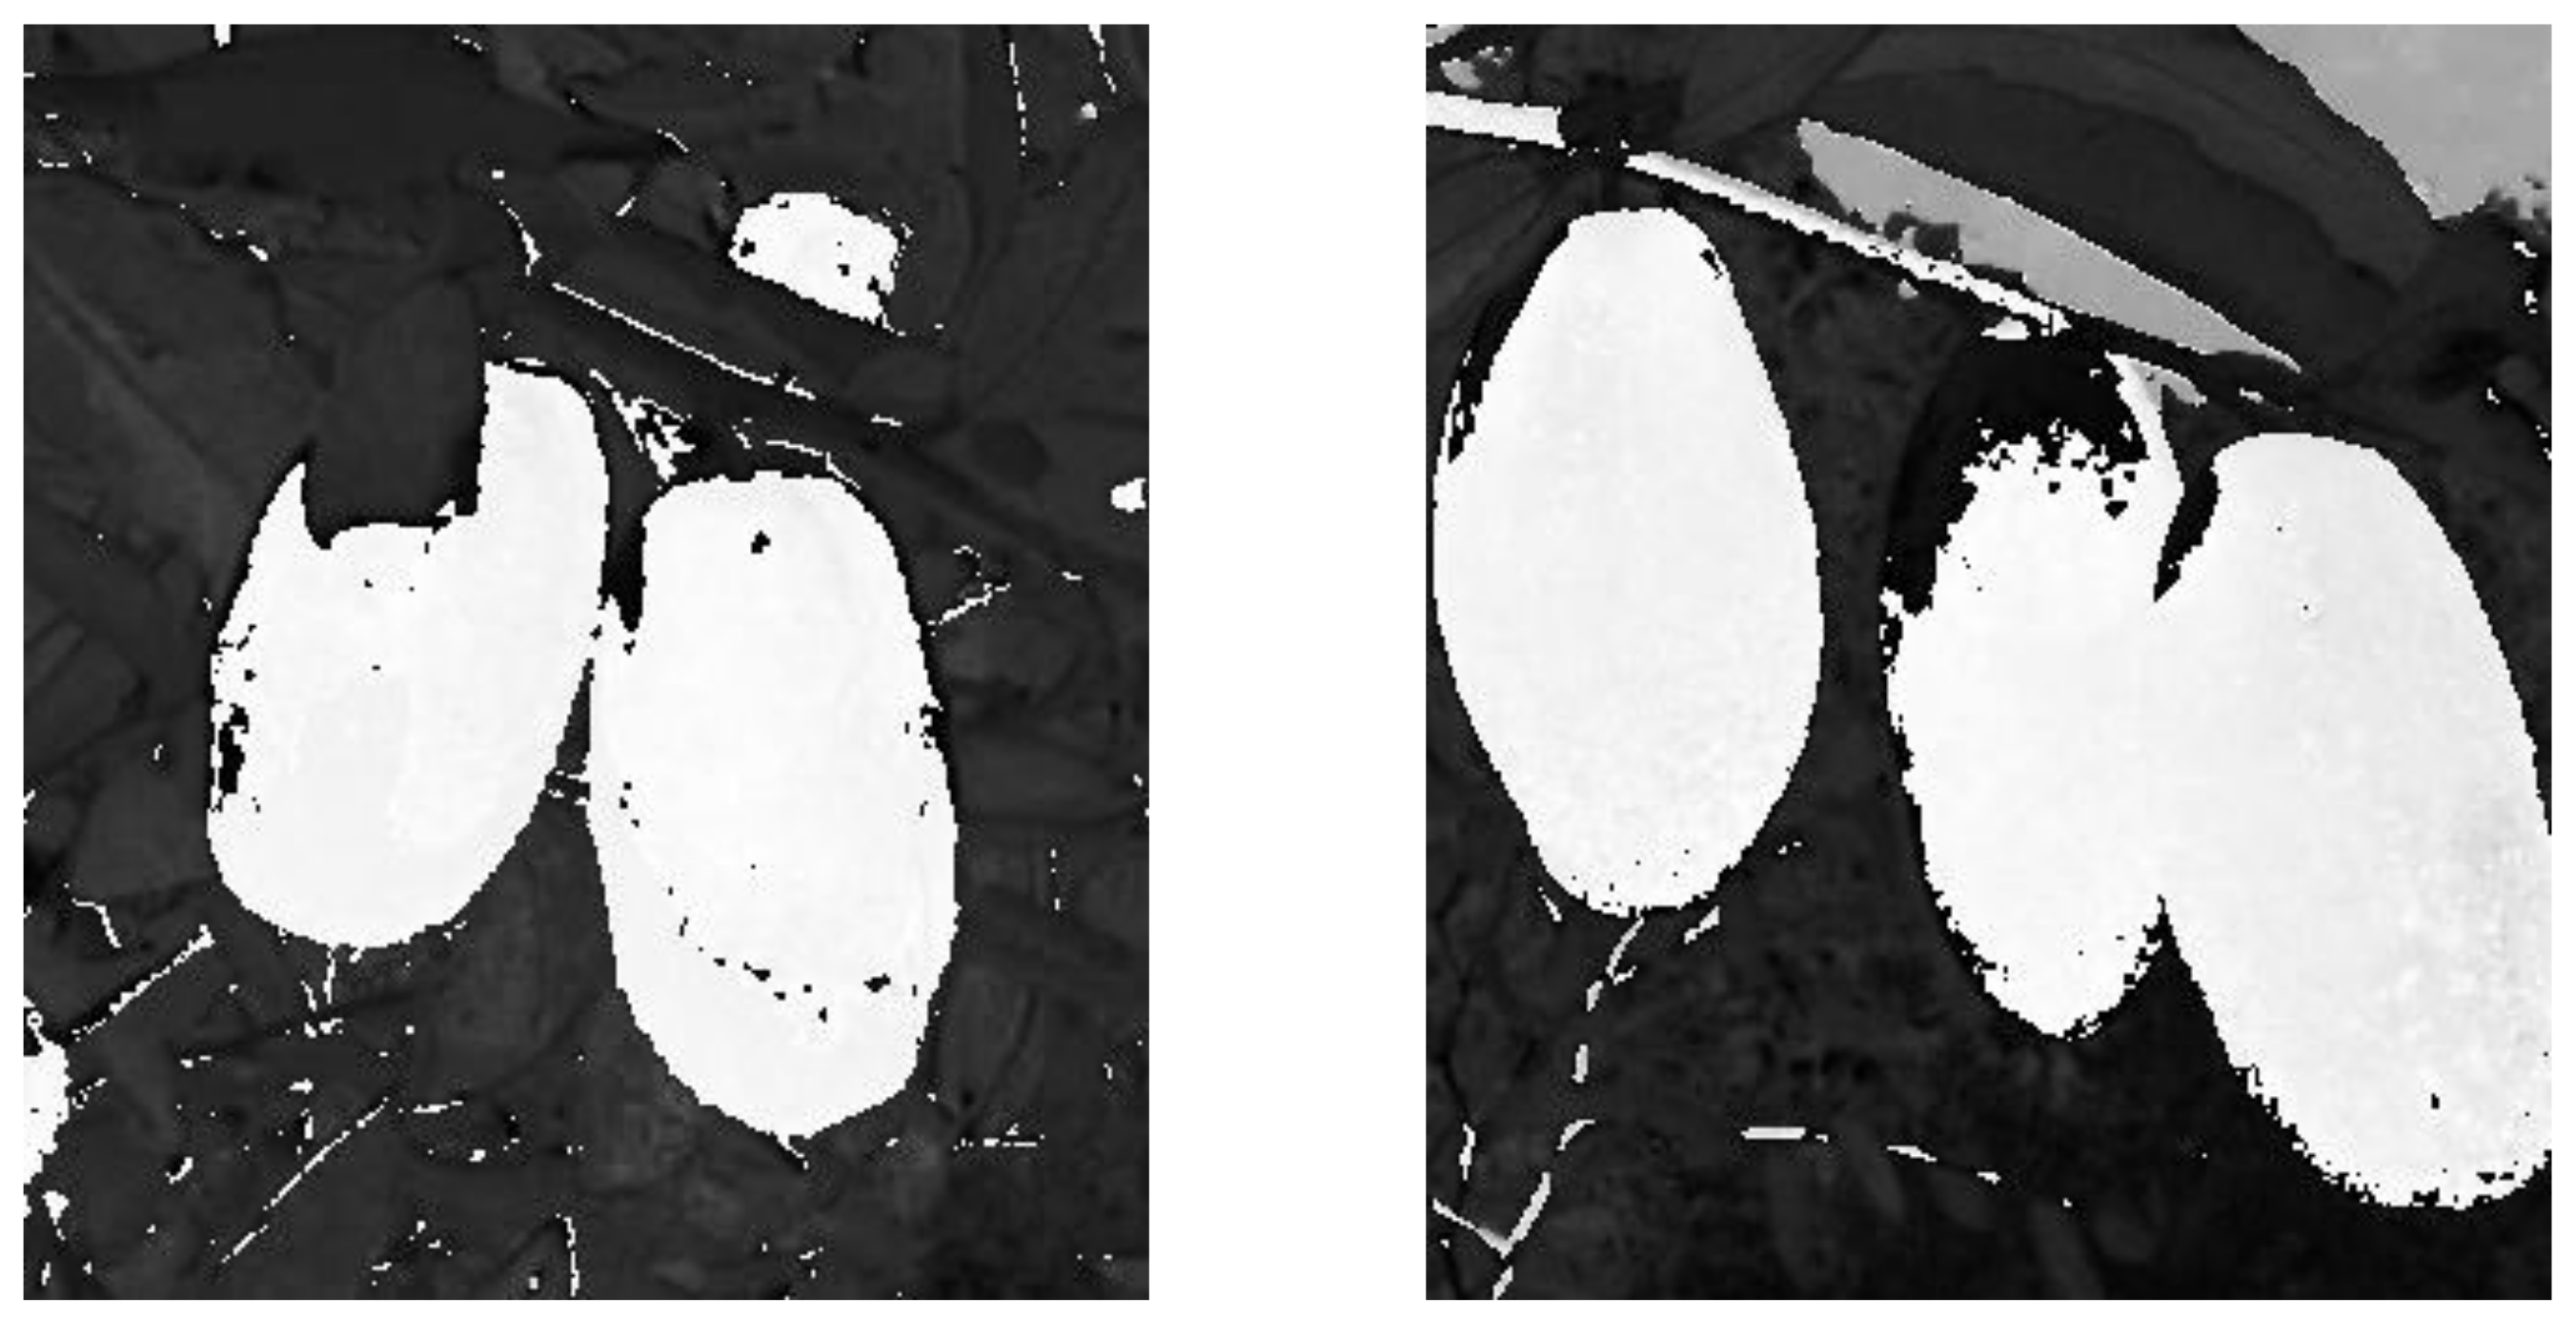
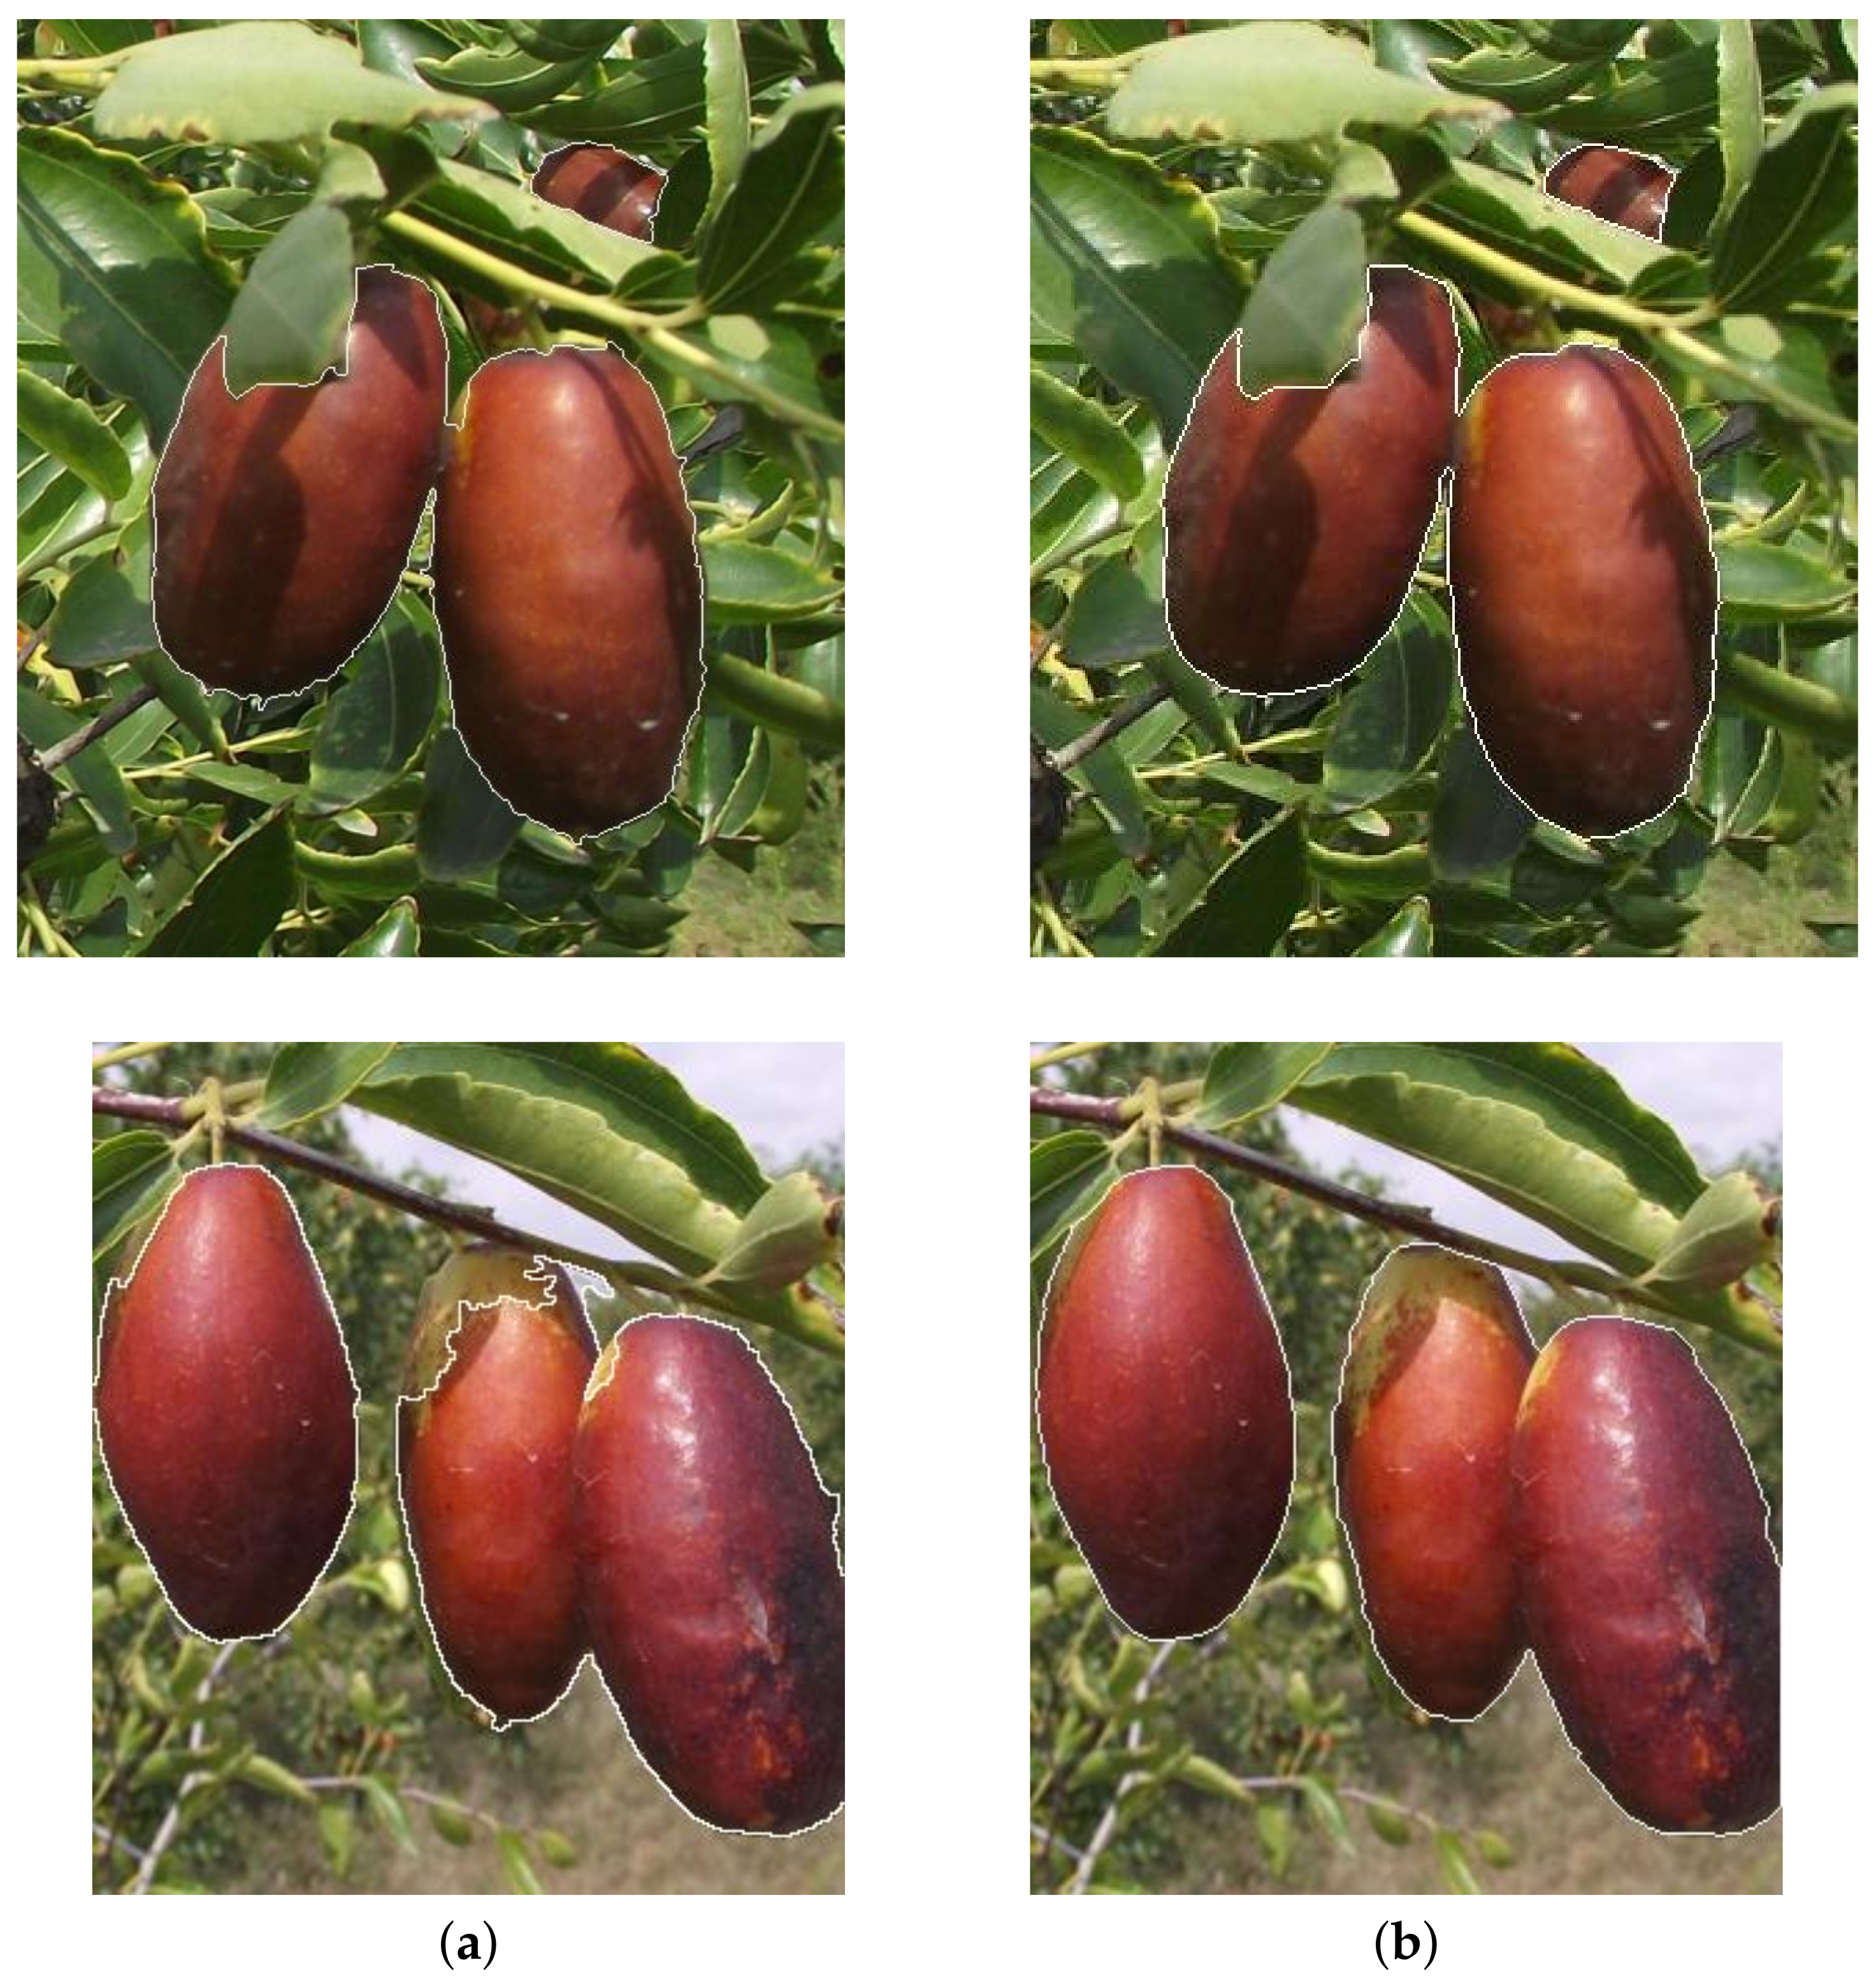
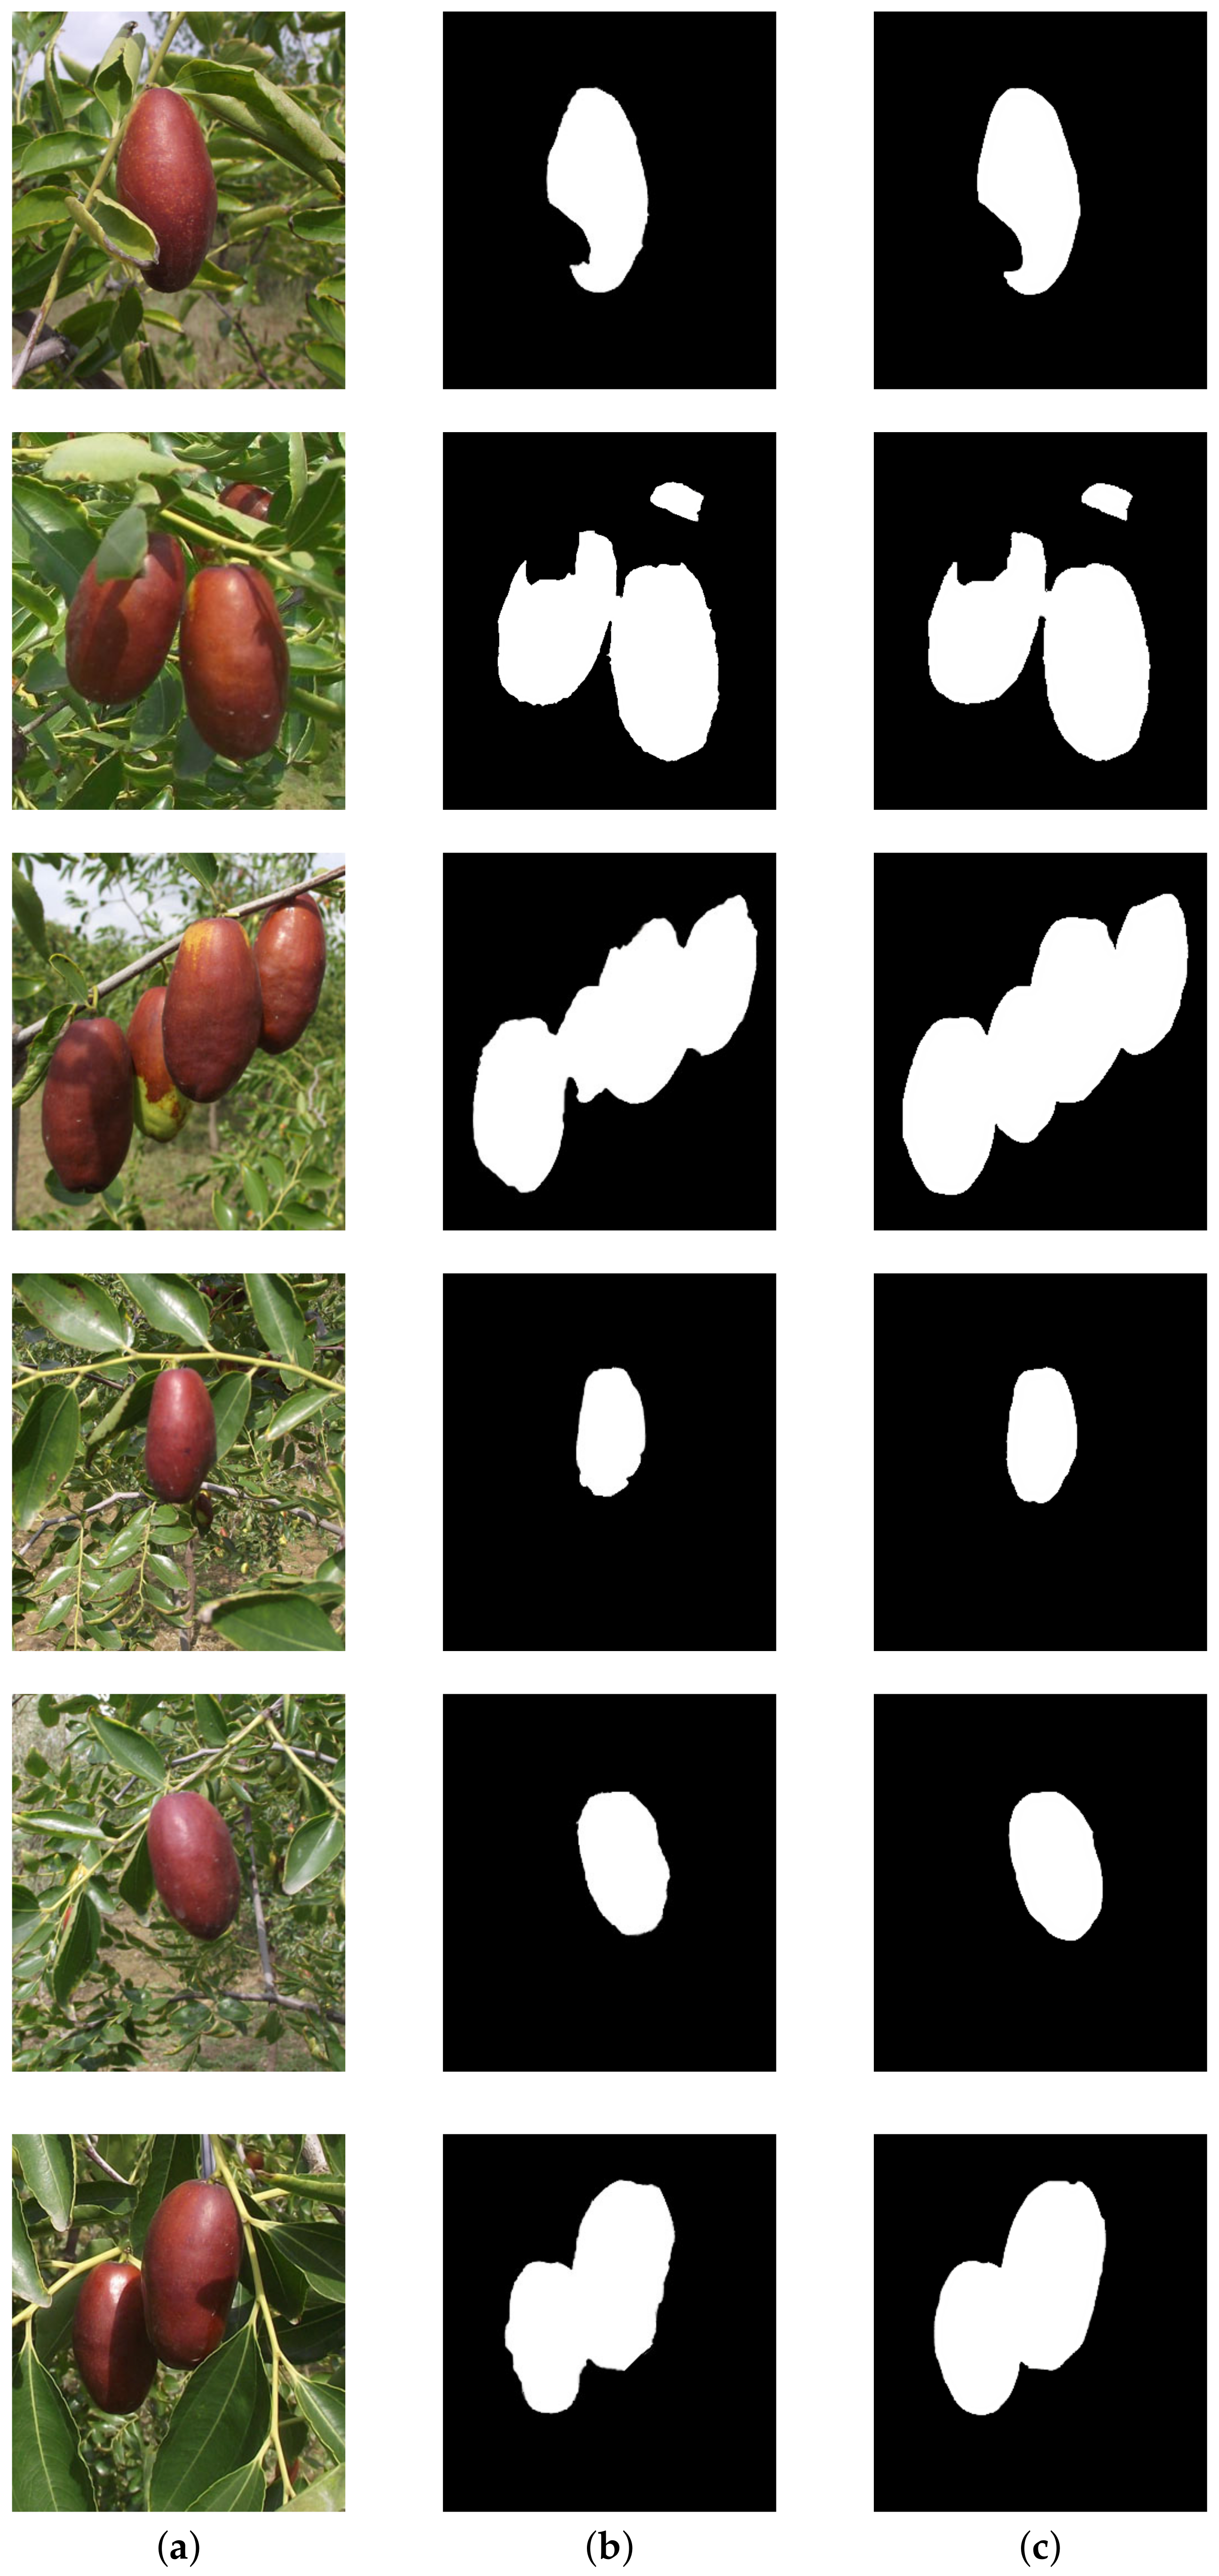
3.1. Segmentation Results of the Long Jujubes

The traditional watershed algorithm has the disadvantage of over-segmentation. This paper overcomes this disadvantage by finding a suitable marker image and mask image. Based on the hue image after angle rotation, the results of segmentation by the method put forward in the literature are shown in Figure 16.
Although it overcomes the disadvantage of over-segmentation, the segmentation is incorrect. In particular, the background is divided into multiple regions, so further post-processing including region merging is required. Moreover, this algorithm is sensitive to the complexity of the background. The size of the structural element is difficult to determine, which affects directly the final segmentation result.
This paper neglects the complexity of the background and successfully separates long jujube regions from the background regions. The segmentation effectiveness is illustrated by comparison with artificial segmentation, as shown in Figure 17.
Except for the cyan long jujube region, regions segmented by the proposed algorithm are basically consistent with that of the artificial segmentation. In 30 images similar to Figure 2, the region with artificial segmentation was used as the standard. Photoshop software was used to extract the boundary of the long jujubes and calculate the number of pixels. The number of missing segments is the total number of pixels of long jujubes that are not divided into target regions by the proposed algorithm. The number of erroneous segments is the total number of pixels of background object that is divided into target objects by the proposed algorithm. The rate of missing segmentation is the ratio of the number of correct segments to the number of artificial segments. The rate of error segmentation is the ratio of the number of erroneous segments to the number of artificial segments. The statistical results are shown in Table 2.
Table 2 shows that the average rate of missing segmentation is 6.030%. There are different results for different images that are similar to each other. The highest rate of missing segmentation is 23.489%, while the smallest rate of missing segmentation is only 1.791%. In No. 3, No. 8, No. 9, and No. 10, the long jujube areas are similar, but the accuracy of segmentation is very different. The rate of missing segmentation is 23.489% in No. 8, while the rates of missing segmentation are less than 10% in the others. For the No. 8, No. 17 and No. 24, the rates of missing segmentation are more than 15%. Especially the No. 8 and No. 17, the rates of missing segmentation are more than 20%. There are mainly two reasons why the rate of missing segmentation is high. Firstly, the cyan long jujube regions are not recognized. Secondly, the pre-processing has little effect on long jujube regions that are severely affected by shadow (whose values are close to 0). For the rate of error segmentation, the average value is 0.752%. Except in No. 3, No. 23, and No. 25, the rate of error segmentation is less than 1%. The main reason for higher rates of error segmentation is the fact that the dark-red branches are divided into target regions.
In order to verify the effectiveness of the proposed algorithm, it was compared with OTSU, maximum entropy, the watershed algorithm, improved maximum entropy, and the algorithm-based hue model. The results are shown in Table 3 and Figure 18.
With 300 mature long jujube images, the proposed marker-controlled watershed algorithm achieves a 94.70% segmentation accuracy. OTSU and maximum entropy can only obtain about an 82% segmentation accuracy. The influence of illumination makes the color information representation of the long jujubes very different, resulting in a large number of incorrect segmentations. Secondly, affected by the background, there will be a high degree of noise in the segmentation process, resulting in incorrect segmentation. The improved maximum entropy and the hue model algorithm use color differences and hue information for segmentation, which can overcome the influence of the color inequality in the long jujubes to a certain extent. The accuracy of the watershed algorithm is 80.54%. Because the boundary gradient is not obvious, the background area is also incorrectly divided. In addition, too many minimum regions cause severe over-segmentation, resulting in the incorrect segmentation of the same long jujubes into different parts. The marker-controlled watershed algorithm based on an energy-driven approach strengthens the representation of gradient information and uses the energy-driven approach to find the best marking area to reduce over-segmentation. Compared with the watershed algorithm, the proposed marker-controlled watershed algorithm improves the accuracy by 14.1%. Compared with OTSU and maximum entropy, the proposed algorithm improves accuracy by more than 12%. Compared with the maximum entropy of the improved algorithm, the proposed algorithm also has very high accuracy.

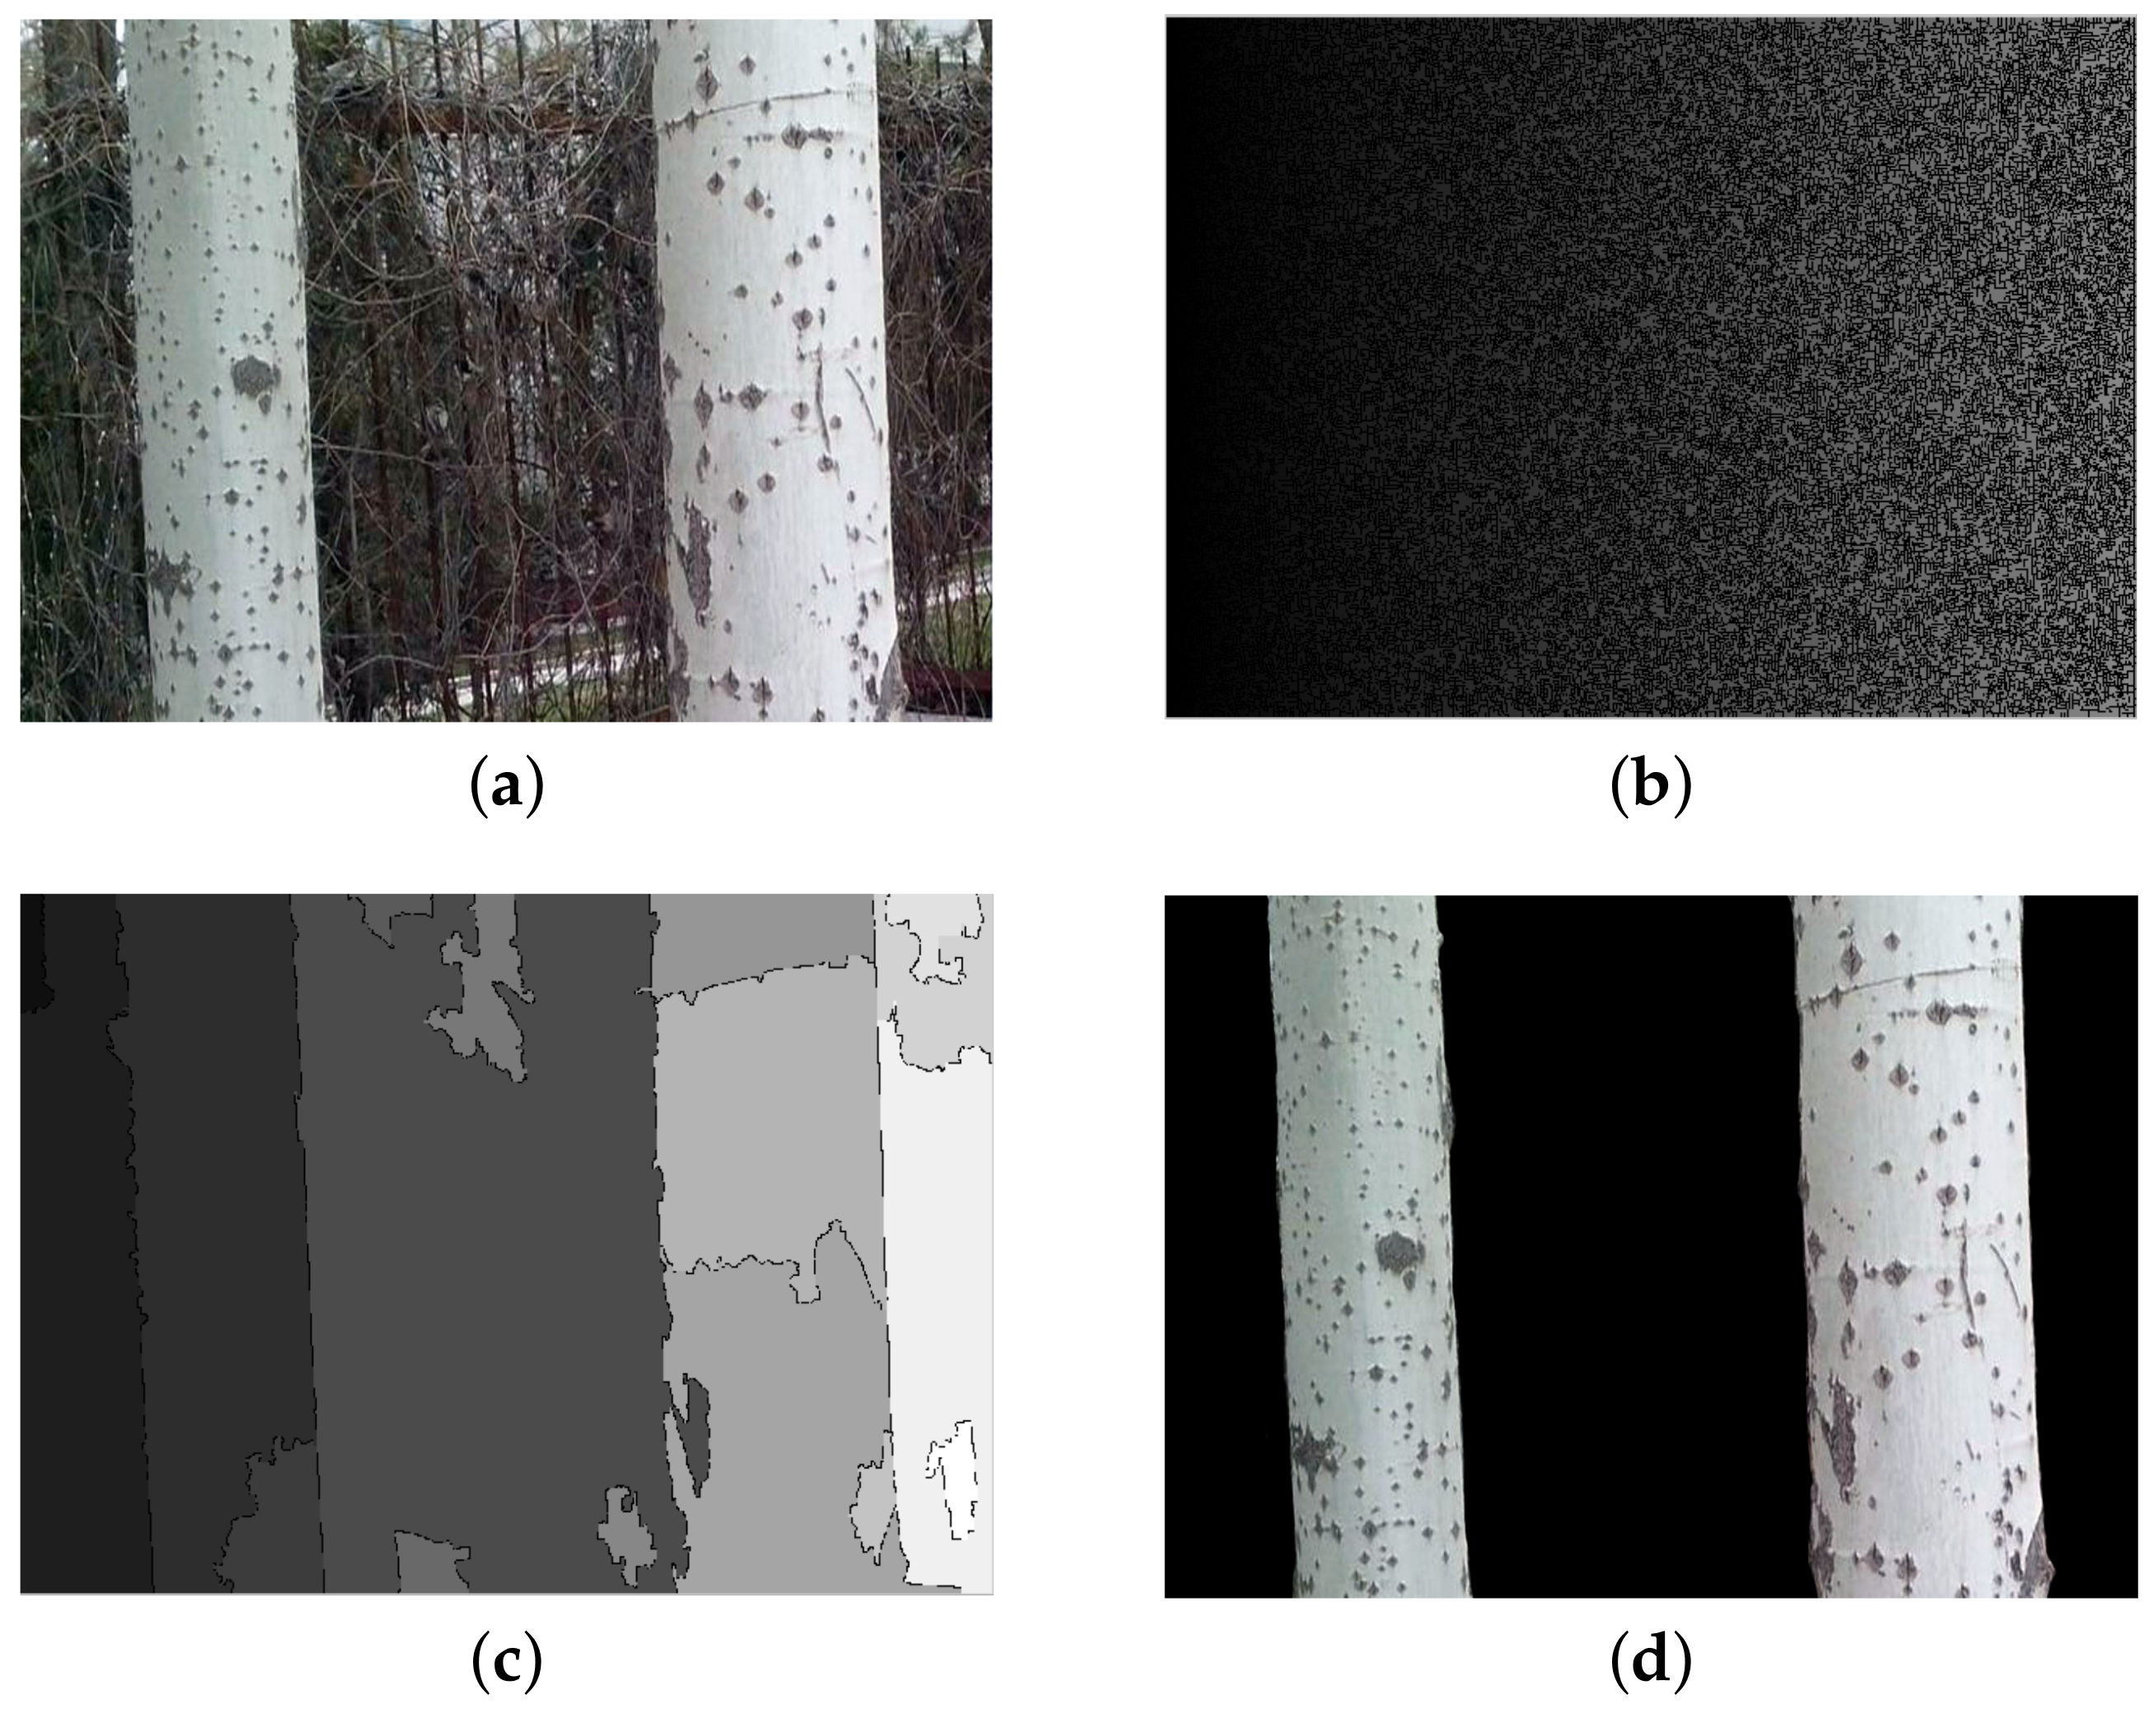
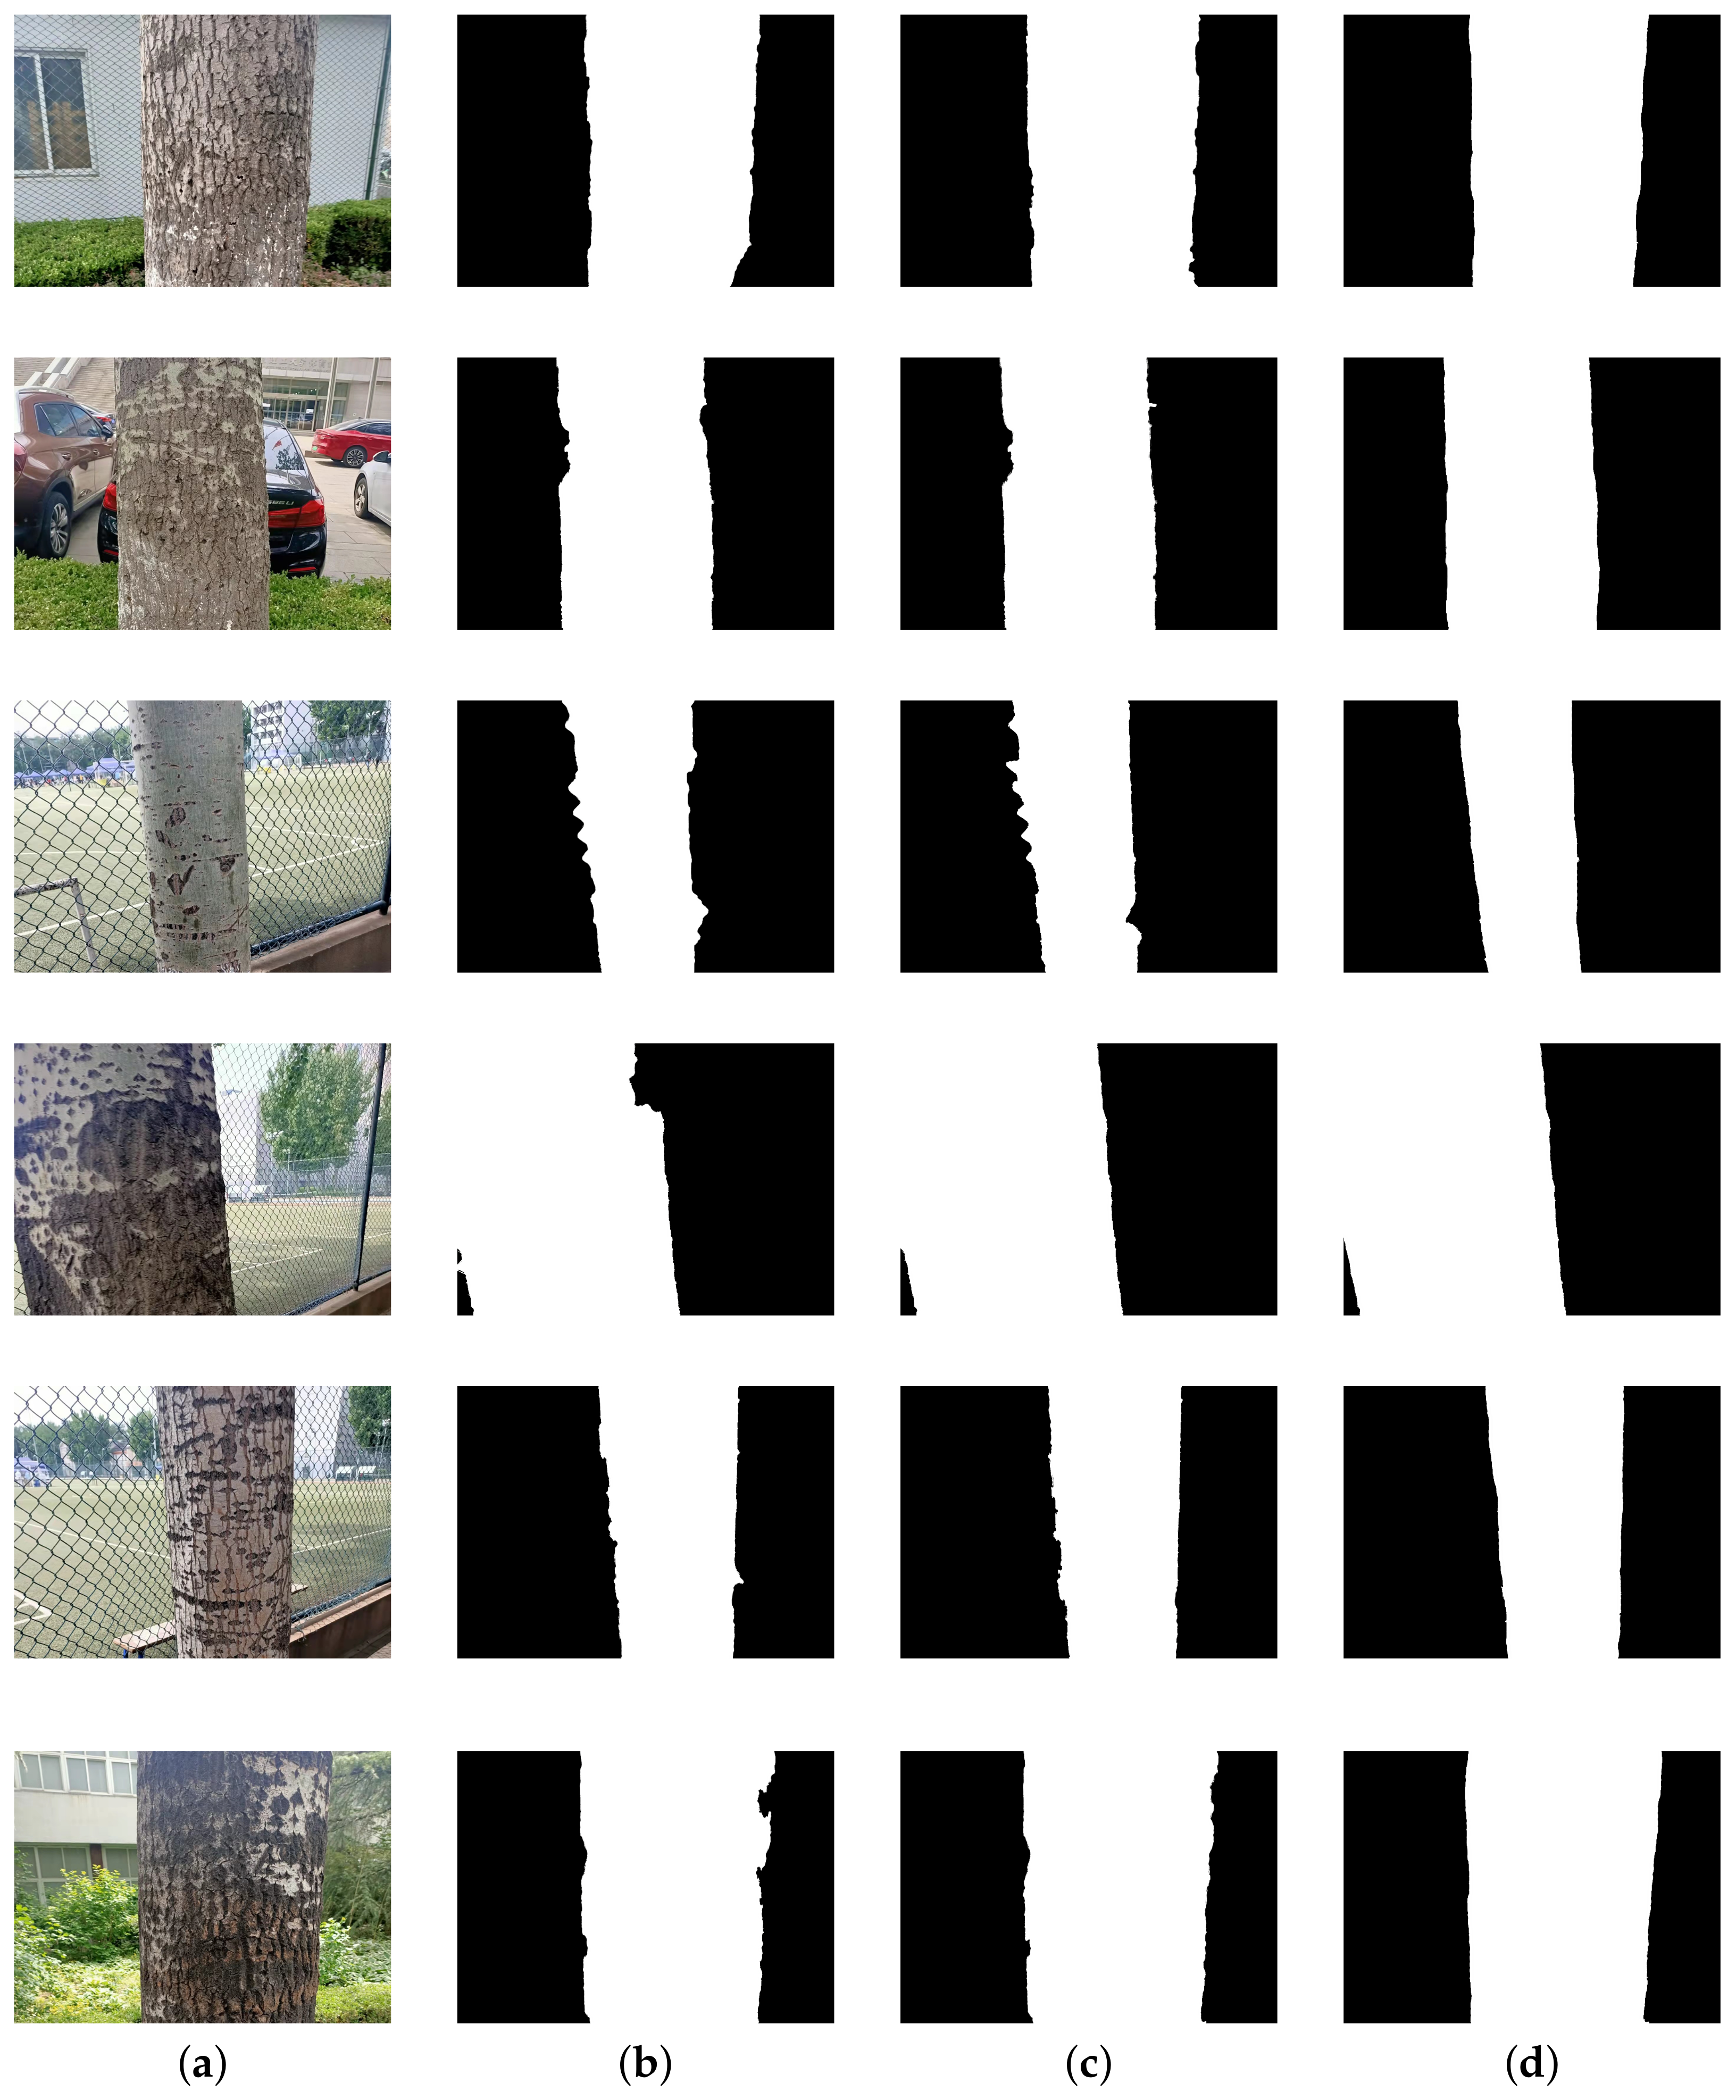
3.2. Segmentation Results of Trees

The traditional watershed algorithm causes severe over-segmentation. As shown in Figure 19b, the traditional watershed algorithm cannot effectively segment the tree area. The improved watershed algorithm can overcome over-segmentation to a certain extent, but it still divides the trees into several different regions, as shown in Figure 19c. On the basis of the tree image reconstructed by morphology, the proposed marker-controlled watershed algorithm extracts the tree hue information and then extracts the marker image using the color difference between the trees and the background. For the extracted hue information, the energy-driven adaptive hue adjustment is used to obtain the gradient image with a clear boundary, so that the boundary between the tree and the background is more obvious. The tree area extraction result after marker-controlled watershed algorithm processing is shown in Figure 19d.
The reconstructed tree image is processed using OTSU and maximum entropy, the improved watershed algorithm, and the proposed marker-controlled watershed algorithm. The results are shown in Table 4 and Figure 20. The segmentation accuracy could be computed by
Accuracy = N c o r N t o t
where N c o r is the number of correct segments, and N t o t is the number of artificial segments.
OTSU uses the maximum variance difference between the tree and the background to determine the segmentation threshold, so as to segment the tree from the background. However, in a natural environment, due to the influence of light, there are great differences in colors between different parts of trees. In addition, the background is complex, resulting in an unclear boundary between the trees and the background. These factors lead to a poor segmentation effect, and the correct segmentation rate is only 74.19%. The maximum entropy has a similar effect as OTSU, and its correct segmentation rate is 75.21%. Due to the complex environmental information of the tree image, the color information is very different inside the tree area. Therefore, the traditional watershed algorithm cannot effectively extract the tree area. As an improved watershed algorithm, morphological reconstruction is used to eliminate some abnormal points and smooth the color information of the image, so that the color information inside the trees tends to be stable, and over-segmentation is alleviated to a certain extent. However, due to its multiple minimum regions and the fact that the boundary information is not strengthened, there is still slight over-segmentation in some tree images. The improved watershed algorithm achieves an 88.42% accuracy. On the basis of morphological reconstruction, the marked region is determined by hue information and erosion operations. Hue adaptive rotation based on an energy-driven approach is used to extract gradient information with a clear boundary. On the basis of the enhanced marker image and mask image, the marker-controlled watershed algorithm was used to extract the tree region. Experiments showed that the proposed marker-controlled watershed algorithm can achieve a 93.2% segmentation accuracy, which is 4.7% higher than the improved watershed algorithm.

4. Discussion and Conclusions

In this paper, the histogram specification overcomes the influence of lighting, shadow, and others on the color information of the image to a certain extent. In light of the shortcomings of the traditional watershed algorithm, this paper puts forward the MCW-D algorithm for object segmentation. By analyzing the characteristics of long jujubes and trees, the optimal regions are used as the marker image, and the hue information is scanned using the Prewitt operator to obtain a mask image. In the process of extracting the mask image, an energy-driven hue adaptive method is used to obtain a gradient image with a clear boundary, so that there is a strict boundary between the target and the background. These operations can well overcome the disadvantages of the watershed algorithm. In 300 long jujube images, the average correct segmentation rate is as high as 94.7%. In 100 tree images, the average correct segmentation rate is as high as 93.2%. Compared with widely used methods such as the watershed algorithm and maximum entropy, the proposed MCW-D algorithm can improve accuracy by more than 2%. The MCW-D algorithm relies heavily on mathematical modeling and cannot adjust parameters to adapt to changes in an environment; in general, however, the proposed MCW-D algorithm can accurately extract jujube and tree regions and complete the visual tasks of unmanned robots. It thus provides visual support for intelligent picking or plant protection robots.

Author Contributions

Methodology, Y.D.; validation, Y.D., L.M., S.W. and F.S.; investigation, Y.D.; writing—original draft preparation, Y.D. and L.M.; writing—review and editing, Y.D., L.M., S.W. and F.S. All authors have read and agreed to the published version of the manuscript.

Funding

This research was funded by the Chinese Academy of Agricultural Sciences Science and Technology Innovation Project (ASTIP-TRIC03), the Key Project of China National Tobacco Corporation (110202102007), China National Tobacco Corporation Shandong Provincial Company Key Technology Project (2020370000340053), and the Science Foundation for Young Scholars of Tobacco Research Institute of Chinese Academy of Agricultureal Sciences (2021B05).

Institutional Review Board Statement

Not applicable.

Informed Consent Statement

Not applicable.

Data Availability Statement

Not applicable.

Conflicts of Interest

The authors declare that there is no conflict of interest.

References

  1. Wang, L.; Liu, Q.Y. The methods summary of optimal segmentation scale selection in high-resolution remote sensing images multi-scale segmentation. Geomat. Spat. Inf. Technol. 2015, 38, 166–169. [Google Scholar]
  2. Sezgin, M.; Sankur, B. Survey over image thresholding techniques and quantitative performance evaluation. J. Electron. Imaging 2004, 13, 146–165. [Google Scholar]
  3. Liao, P.S.; Chen, T.S.; Chuang, P.C. A Fast Algorithm for Multilevel Thresholding. J. Inf. Sci. Eng. 2001, 17, 713–727. [Google Scholar]
  4. Wang, Y.T.; Dai, Y.P.; Xue, J.R.; Liu, B.H.; Ma, C.H.; Gao, Y.Y. Research of segmentation method on color image of Lingwu long jujubes based on the maximum entropy. Eurasip J. Image Video Process. 2017, 34, 34. [Google Scholar] [CrossRef]
  5. Bao, S.; Chuang, C.S. Feature Sensitive Label Fusion With Random Walker for Atlas-Based Image Segmentation. IEEE Trans. Image Process. 2017, 26, 2797–2810. [Google Scholar] [CrossRef]
  6. Zhao, Q.H.; Wang, Y.; Li, Y. Voronoi tessellation-based regionalised segmentation for colour texture image. IET Comput. Vis. 2016, 10, 613–622. [Google Scholar] [CrossRef]
  7. Chen, Y.J.; Li, J.; Zhang, H. Non-local-based spatially constrained hierarchical fuzzy C-means method for brain magnetic resonance imaging segmentation. IET Image Process. 2016, 10, 865–876. [Google Scholar] [CrossRef]
  8. Pereyra, M.; McLaughlin, S. Fast Unsupervised Bayesian Image Segmentation With Adaptive Spatial Regularisation. IEEE Trans. Image Process. 2017, 26, 2577–2587. [Google Scholar] [CrossRef] [Green Version]
  9. Caldairou, B.; Rousseau, F.; Passat, N. A non-local fuzzy segmentation method: Application to brain MRI. Pattern Recognit. 2011, 44, 1916–1927. [Google Scholar] [CrossRef] [Green Version]
  10. Peng, H.X.; Zou, X.J.; Chen, L.J. Fast Recognition of Multiple Color Target of Litchi Image in Field Environment Based on Double Otsu Algorithm. Trans. Chin. Soc. Agric. Eng. 2014, 45, 61–68. [Google Scholar]
  11. Chen, Z.B.; Qiu, T.S.; Ruan, S.U. FCM and Level Set Based Segmentation Method for Brain MR Images. Acta Electron. Sin. 2008, 36, 1733–1736. [Google Scholar]
  12. Du, Z.W.; Wu, T.; Peng, X. A Novel Recognition Approach for Mobile Image Fusing Inertial Sensors. Acta Electron. Sin. 2015, 41, 1394–1404. [Google Scholar]
  13. Kang, X.D.; Wang, H.; Guo, J.; Yu, W.Y. Unsupervised deep learning method for color image recognition. J. Comput. Appl. 2015, 35, 2636–2639. [Google Scholar]
  14. Zhao, X.M.; Li, Y.; Zhao, Q.H. Self-adaptive FLICM algorithm for gray image segmentation with unknown number of clusters. Control Decis. 2017, 32, 262–268. [Google Scholar]
  15. Shen, X.J.; Zhang, H.; Chen, H.P. Fast recursive multi-thresholding algorithm. J. Jilin Univ. (Eng. Technol. Ed.) 2016, 46, 528–534. [Google Scholar]
  16. Wang, Y.T.; Li, W.B.; Pang, S.; Kan, J.M. Segmentation method of lingwu long jujubes based on L*a*b color space. Telkomnika-Indones. J. Electr. Eng. 2013, 11, 5344–5351. [Google Scholar] [CrossRef]
  17. Wang, Y.T.; Kan, J.M.; Li, W.B. Image segmentation and maturity recognition algorithm based on color features of Lingwu long jujube. Adv. J. Food Sci. Technol. 2013, 5, 1625–1631. [Google Scholar] [CrossRef]
  18. Guo, J.B.; Zhou, J.L.; Han, H.Z. Shadow suppression method for background subtraction. J. Liaoning Tech. Univ. 2005, 24, 104–106. [Google Scholar]
  19. Hu, Y.; Zhao, X. Shadow Detection and Removal in Single Outdoor Nature Scenes. J. Nanjing Univ. Sci. Technol. (Nat. Sci.) 2011, 35, 1–5. [Google Scholar]
  20. Min, H.Q.; Lv, J.M.; Luo, R.H. Adaptive Shadow Detection Based on GMM and MRF. J. South China Univ. Technol. (Nat. Sci. Ed.) 2011, 39, 115–120. [Google Scholar]
  21. Song, H.B.; Zhang, W.Y.; Zhang, X.X.; Zou, R.Z. Shadow removal method of apples based on fuzzy set theory. Trans. Chin. Soc. Agric. Eng. 2014, 31, 135–141. [Google Scholar]
  22. Xu, L.M.; Lv, J.D. Bayberry image segmentation based on homomorphic filtering and K-means clustering algorithm. Trans. Chin. Soc. Agric. Eng. 2015, 31, 202–208. [Google Scholar]
  23. Xiong, J.T.; Zou, X.J.; Wang, H.J. Recognition of ripe litchi in different illumination condition based on Retinex image enhancement. Trans. Chin. Soc. Agric. Eng. 2013, 29, 170–178. [Google Scholar]
  24. Qian, J.P.; Yang, X.T.; Wu, X.M. Mature apple recognition based on hybrid color space in natural scene. Trans. Chin. Soc. Agric. Eng. 2012, 28, 137–142. [Google Scholar]
  25. Dai, Y.P.; Wang, Y.T.; Xue, J.R.; Gao, Y.Y.; Liu, B.H.; Ma, C.H. Research on the Method of Segmentation On Color Image of Standing Trees. Comput. Appl. Softw. 2017, 34, 224–227. [Google Scholar]
  26. Dai, Y.P.; Wang, Y.T.; Xue, J.R.; Gao, Y.Y.; Liu, B.H.; Ma, C.H. Research of Segmentation Method on Image of Lingwu Long Jujubes Based on a New Extraction Model of Hue. IEEE Sens. J. 2017, 17, 6029–6036. [Google Scholar] [CrossRef]
Figure 1. Overall framework.
Forests 13 01063 g001
Figure 2. Original images. (a) Mature long jujube. (b) Tree.
Forests 13 01063 g002
Figure 3. Convolution coefficient function.
Forests 13 01063 g003
Figure 4. The result for images with severe amounts of shadow. (a) Original image. (b) Image handled by histogram specification.
Forests 13 01063 g004
Figure 5. Cross-sectional pixel values. (a,b) represent different cross-sectional pixel values of two long jujubes.
Forests 13 01063 g005
Figure 6. Segmented result based on differences in color information.
Forests 13 01063 g006
Figure 7. Segmented result rotated by a certain angle.
Forests 13 01063 g007
Figure 8. Marker result.
Forests 13 01063 g008
Figure 9. Extracted hue information.
Forests 13 01063 g009
Figure 10. Two-dimensional histogram.
Forests 13 01063 g010
Figure 11. The images with different rotary angles. (a) Small rotary angle. (b) Large rotary angle.
Forests 13 01063 g011
Figure 12. Rotary image of hue.
Forests 13 01063 g012
Figure 13. Image with error compensation.
Forests 13 01063 g013
Figure 14. Mask image.
Forests 13 01063 g014
Figure 15. The extracted edge.
Forests 13 01063 g015
Figure 16. The incorrect result of segmentation.
Forests 13 01063 g016
Figure 17. Comparison between artificial segmentation and the proposed algorithm. (a) Segmentation of the proposed algorithm. (b) Artificial segmentation.
Forests 13 01063 g017
Figure 18. Segmentation results of long jujubes. (a) Original image. (b) Proposed marker-controlled watershed algorithm. (c) Artificial segmentation.
Forests 13 01063 g018
Figure 19. The results of the watershed algorithm. (a) Original image. (b) Traditional watershed algorithm. (c) Improved watershed algorithm. (d) Proposed marker-controlled watershed algorithm.
Forests 13 01063 g019
Figure 20. Segmentation results of long jujubes. (a) Original image. (b) Maximum entropy. (c) Proposed marker-controlled watershed algorithm. (d) Artificial segmentation.
Forests 13 01063 g020
Table 1. Statistical results.
No.Statistical RegionMinimumMaximum
1target>0.05(98.65%)0.4235
background00.2039
2target>0.05(97.45%)0.5176
background00.3255
3target>0.05(98.78%)0.4235
background00.2039
4target>0.05(96.79%)0.4824
background00.3214
5target>0.05(98.28%)0.4667
background00.3029
6target>0.05(97.10%)0.4118
background00.3078
7target>0.05(94.38%)0.4510
background00.2510
8target>0.05(96.34%)0.4980
background00.3343
9target>0.05(97.48%)0.4431
background00.3098
10target>0.05(98.52%)0.5333
background00.3020
Table 2. The result of the segmentation of 30 images of long jujubes.
No.The Number ofThe Number ofThe Number ofThe Rate ofThe Rate of
Artificial SegmentsMissing SegmentsErroneous SegmentsMissing SegmentationError Segmentation
111,680352343.014%0.291%
228,1448721543.098%0.547%
325,170132813625.276%5.407%
434,5582871878.308%0.252%
56338273294.307%0.458%
68536310463.632%0.539%
720,40914221156.968%0.563%
823,11354291423.489%0.061%
925,36813991545.515%0.607%
1044,769241905.403%0%
1125,066881543.515%0.215%
1217,599826164.693%0.091%
1315,2831012316.622%0.203%
1417,93762103.462%0%
1514,903267631.791%0.423%
16688120202.936%0%
1711,90424193120.321%0.260%
189798215172.194%0.174%
1922,903591512.580%0.223%
2024,0411783797.416%0.329%
2114,828518253.493%0.169%
2224,187837893.461%0.368%
2313,20729610512.241%7.958%
2412,61121036216.676%0.492%
259121104312611.435%1.381%
2627,8627847693.040%0.248%
2710,86558895.412%0.083%
2822,4485911452.632%0.646%
2916,013629683.928%0.425%
3015,735638224.0520.140%
Table 3. Segmentation accuracy of long jujubes.
ModelSegmentation Accuracy
OTSU81.91%
Maximum entropy82.14%
Watershed algorithm [25]80.54%
Improved maximum entropy [4]89.60%
Algorithm based hue model [26]92.69%
Marker-controlled watershed algorithm (ours)94.70%
Table 4. Segmentation accuracy of tree.
ModelSegmentation Accuracy
OTSU74.19%
Maximum entropy75.21%
Improved watershed algorithm [25]88.42%
marker-controlled watershed algorithm (ours)93.20%
Publisher’s Note: MDPI stays neutral with regard to jurisdictional claims in published maps and institutional affiliations.

