
Landslide Susceptibility Research Combining Qualitative Analysis and Quantitative Evaluation: A Case Study of Yunyang County in Chongqing, China


Abstract
:1. Introduction
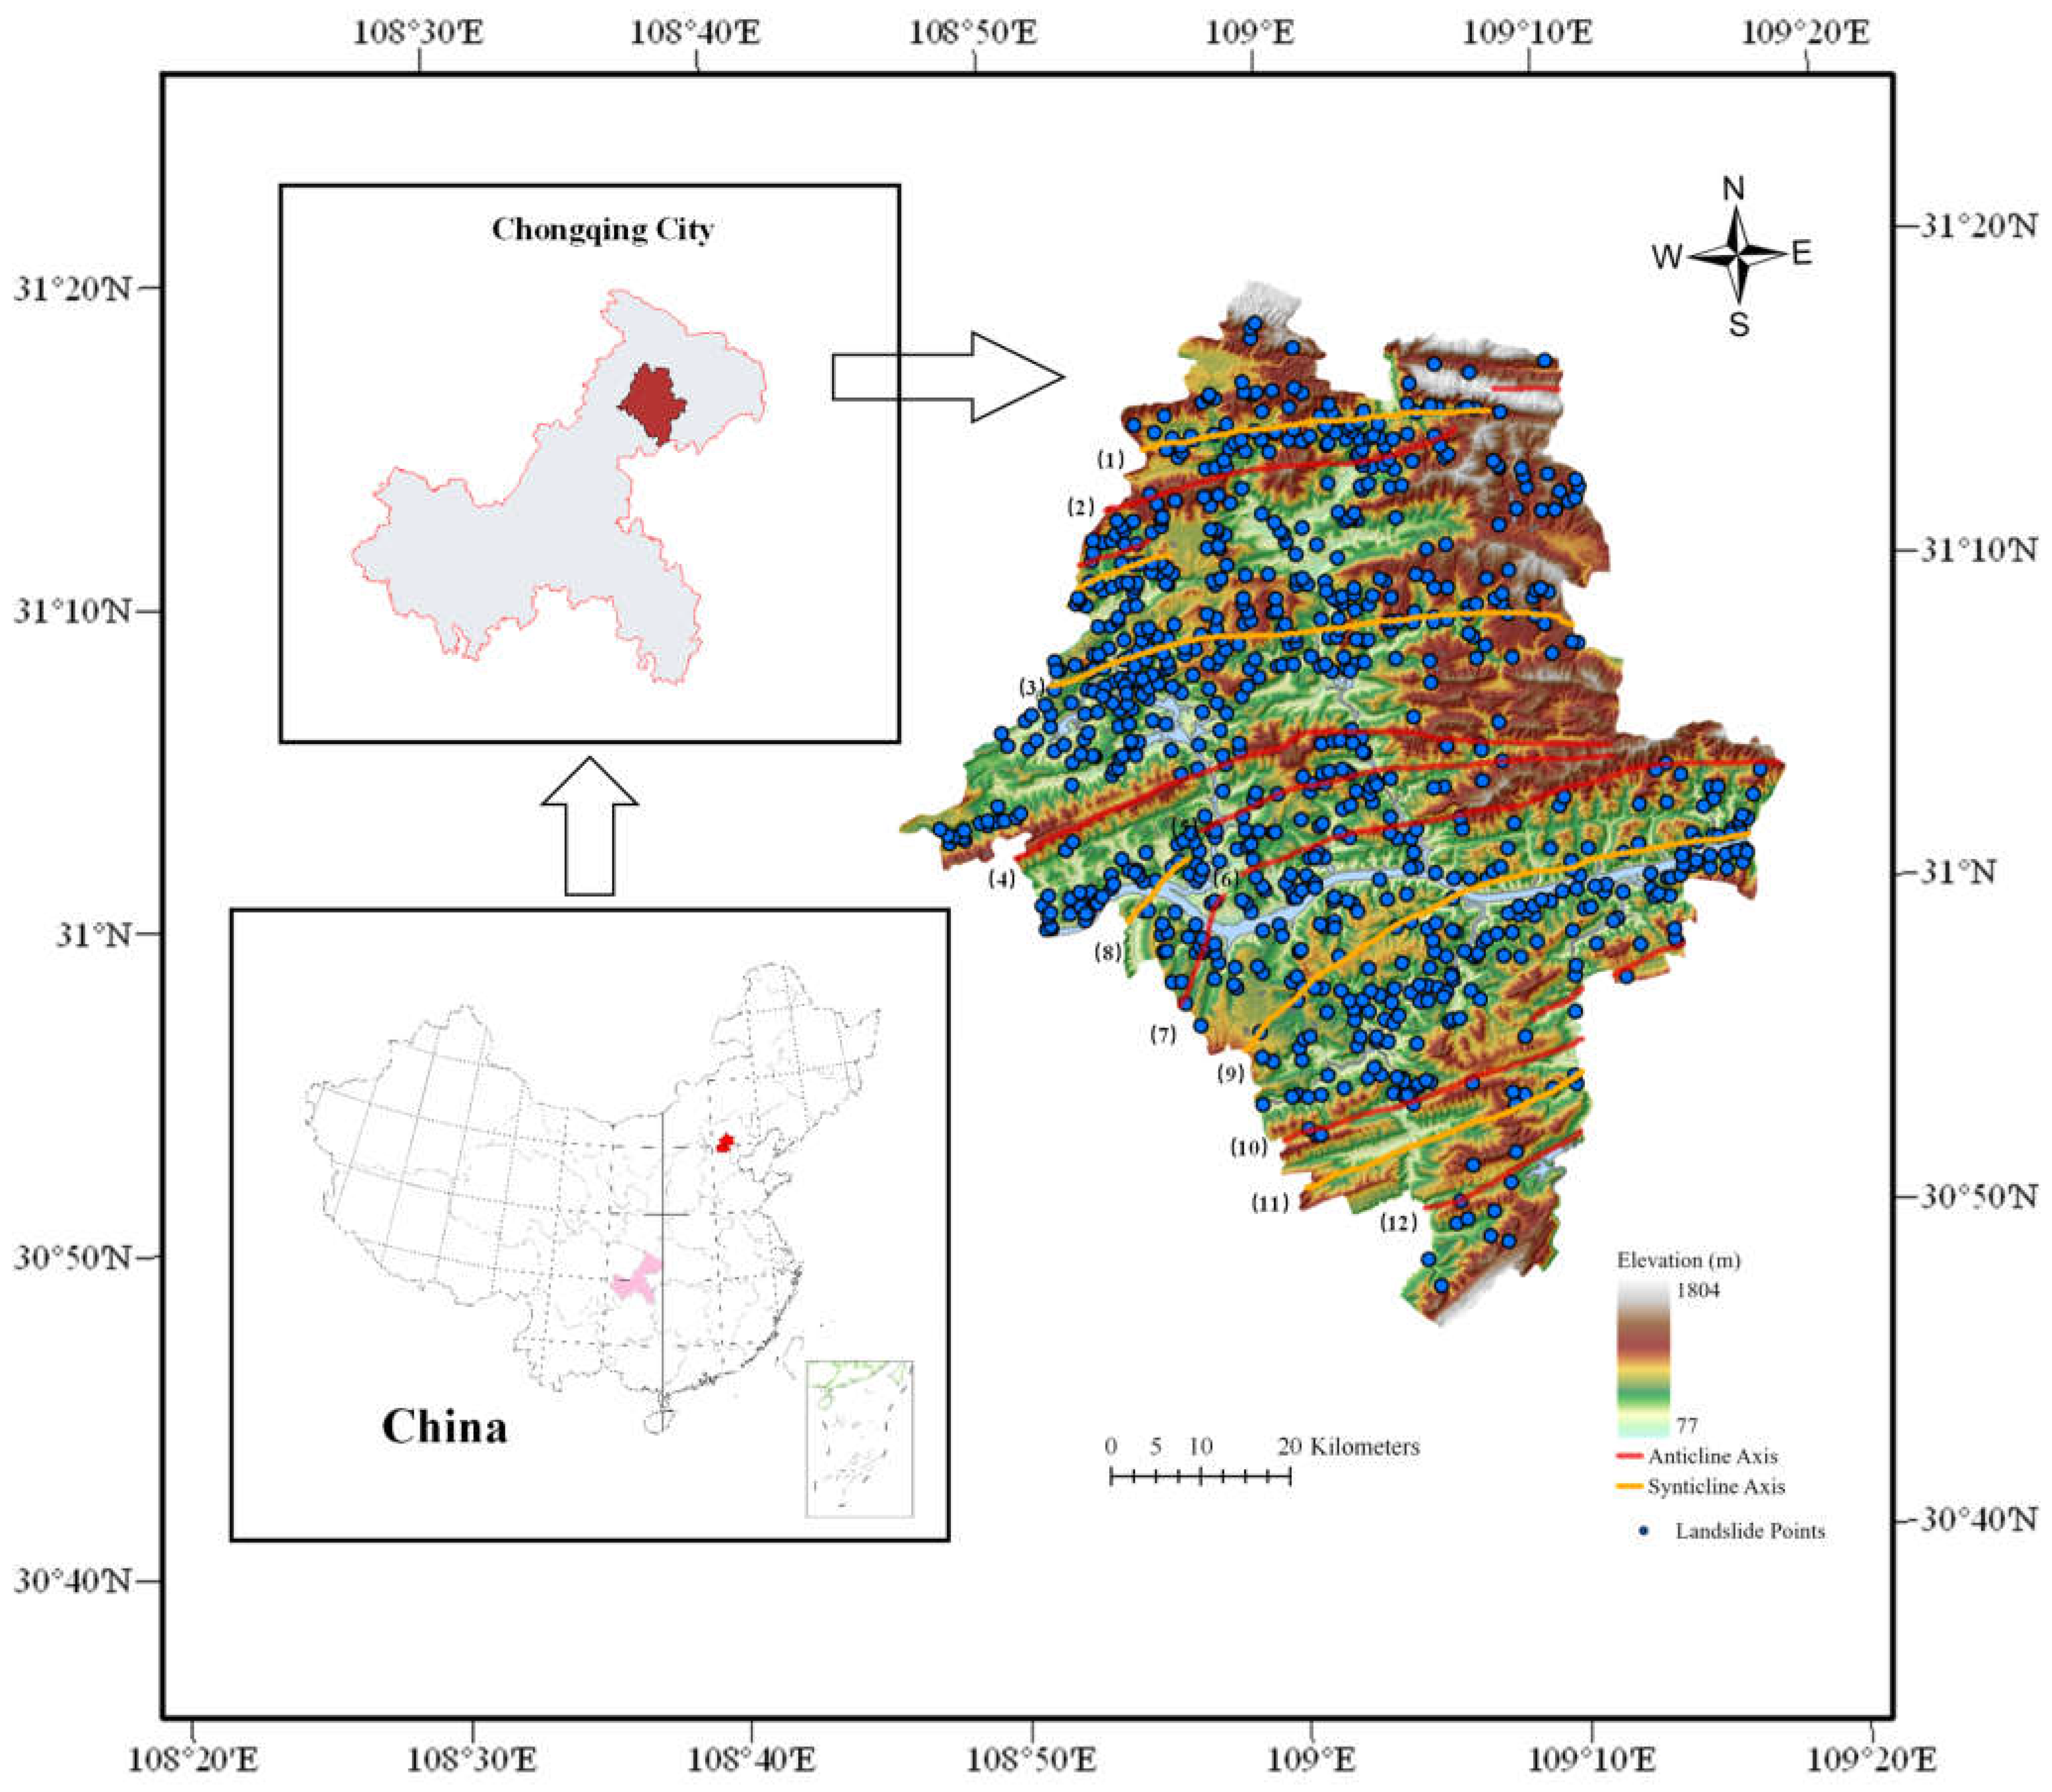
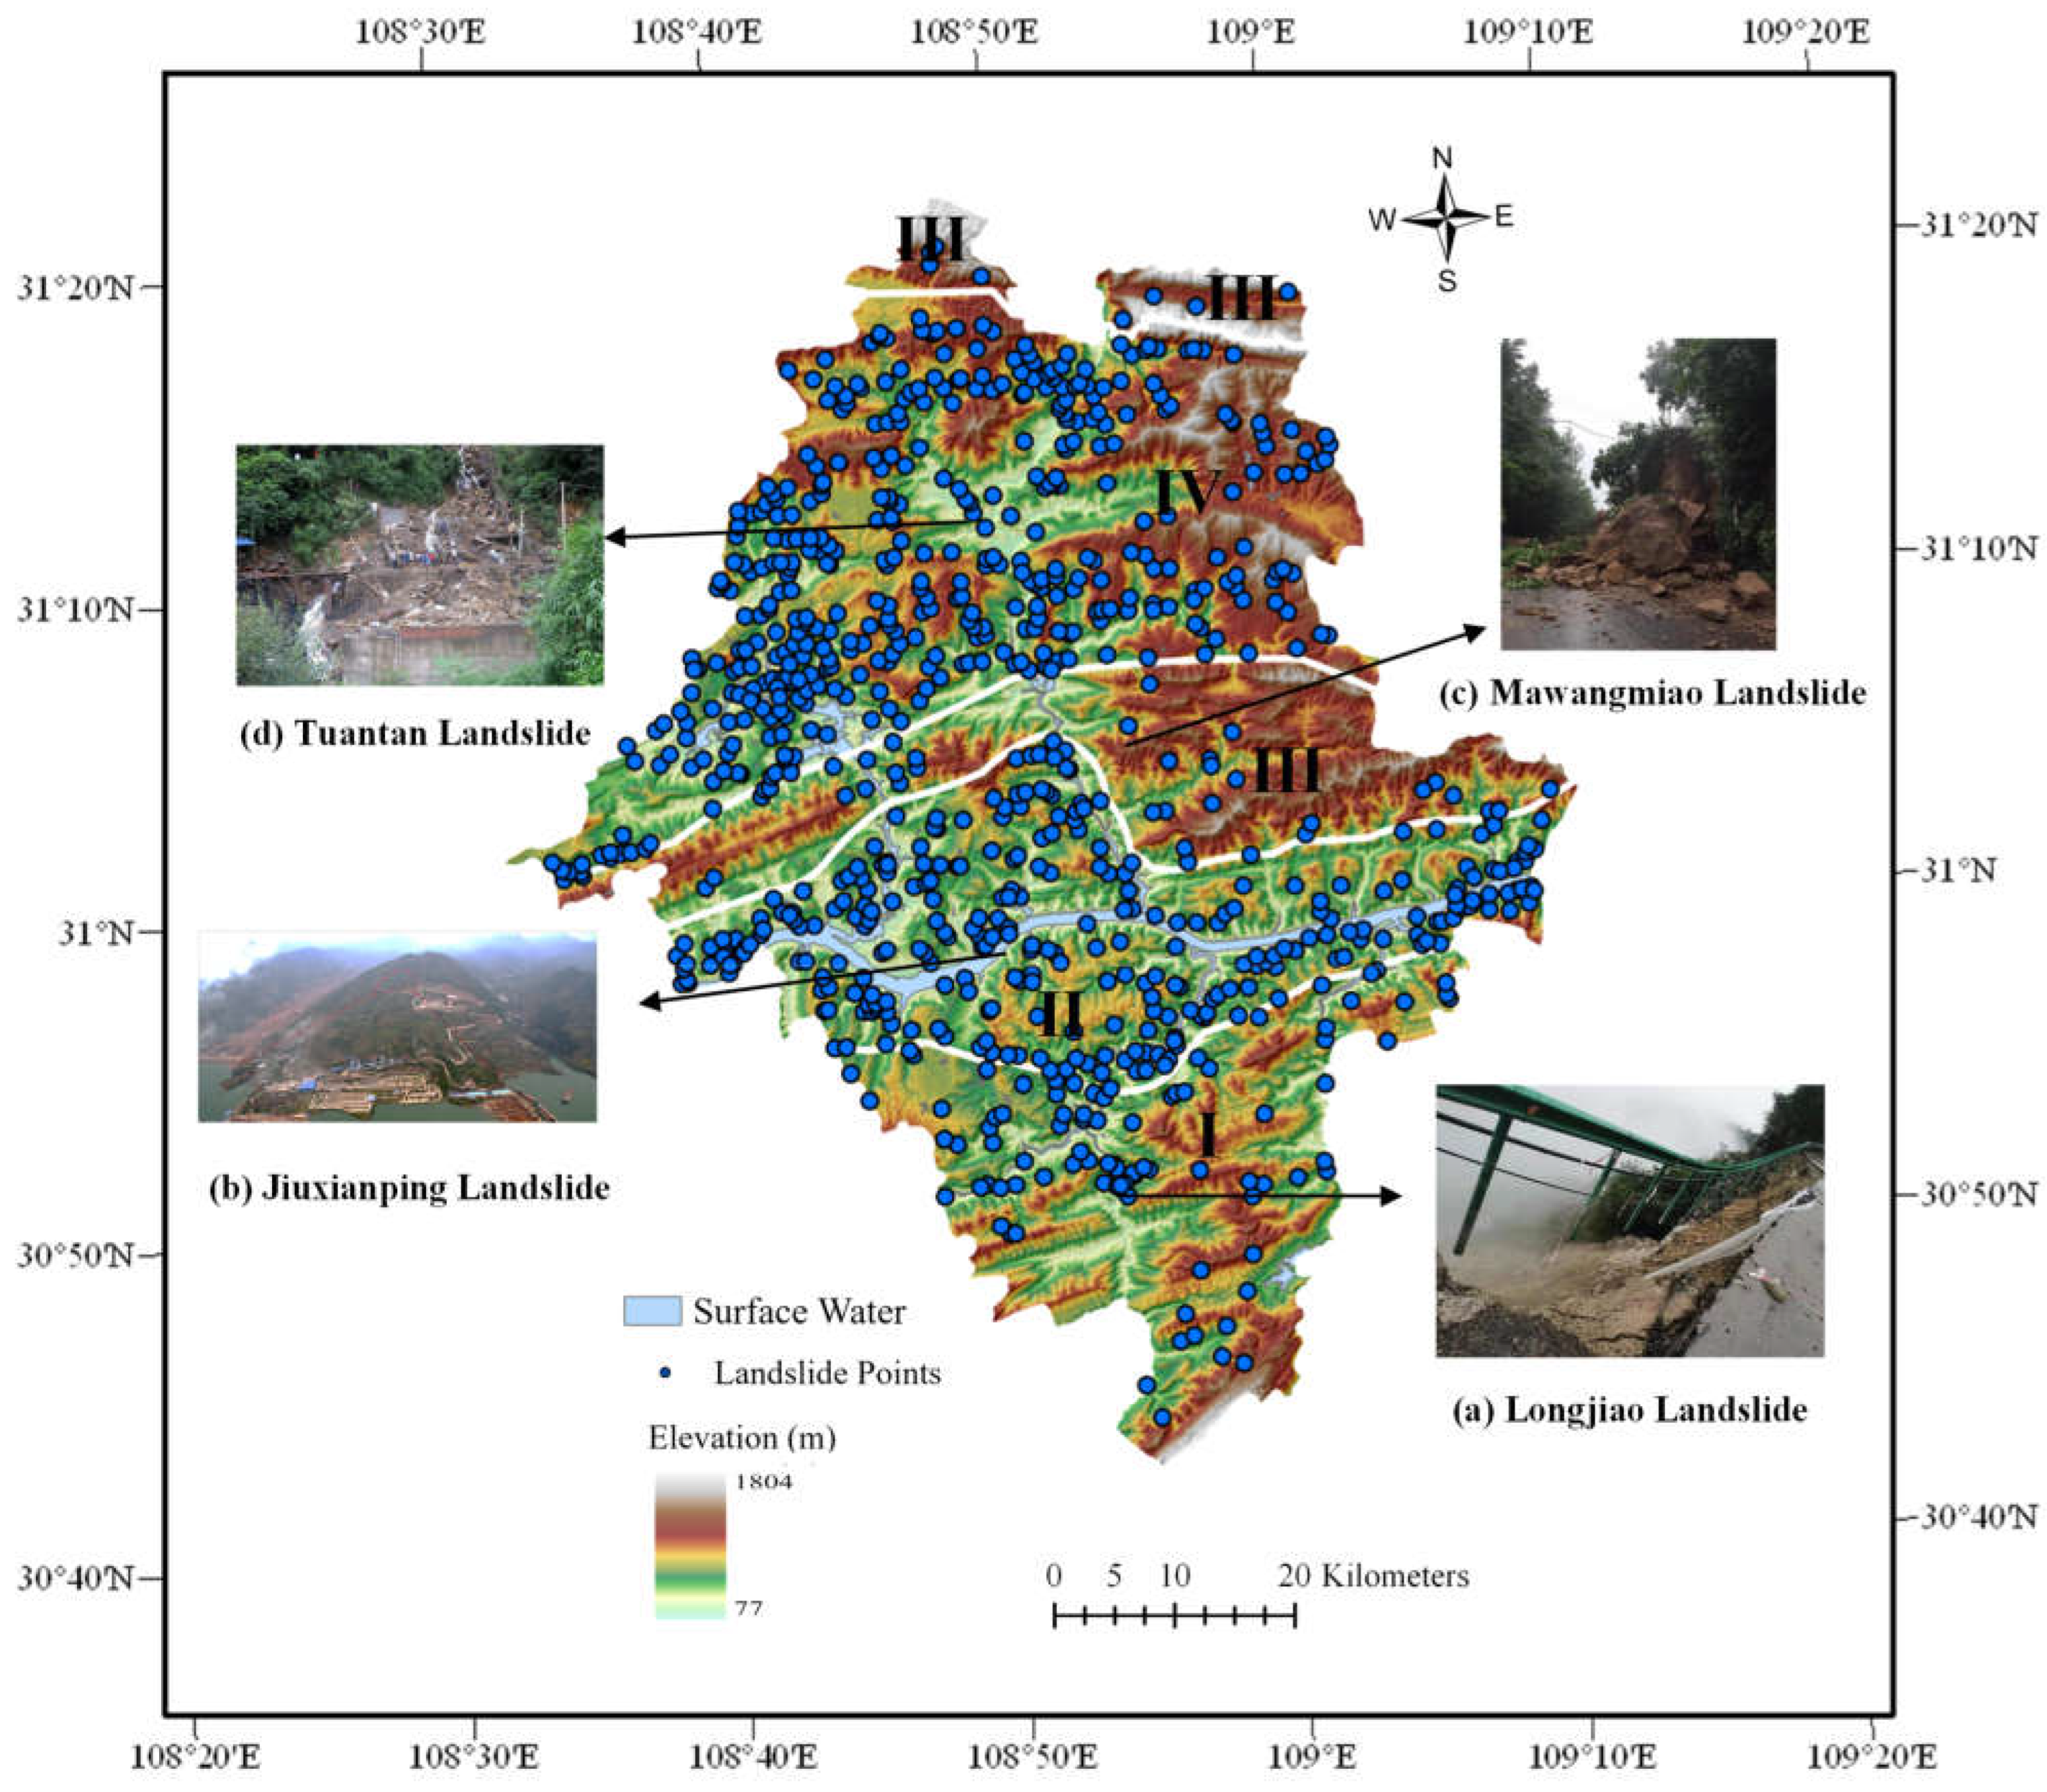
2. Study Area
3. Method Explanation
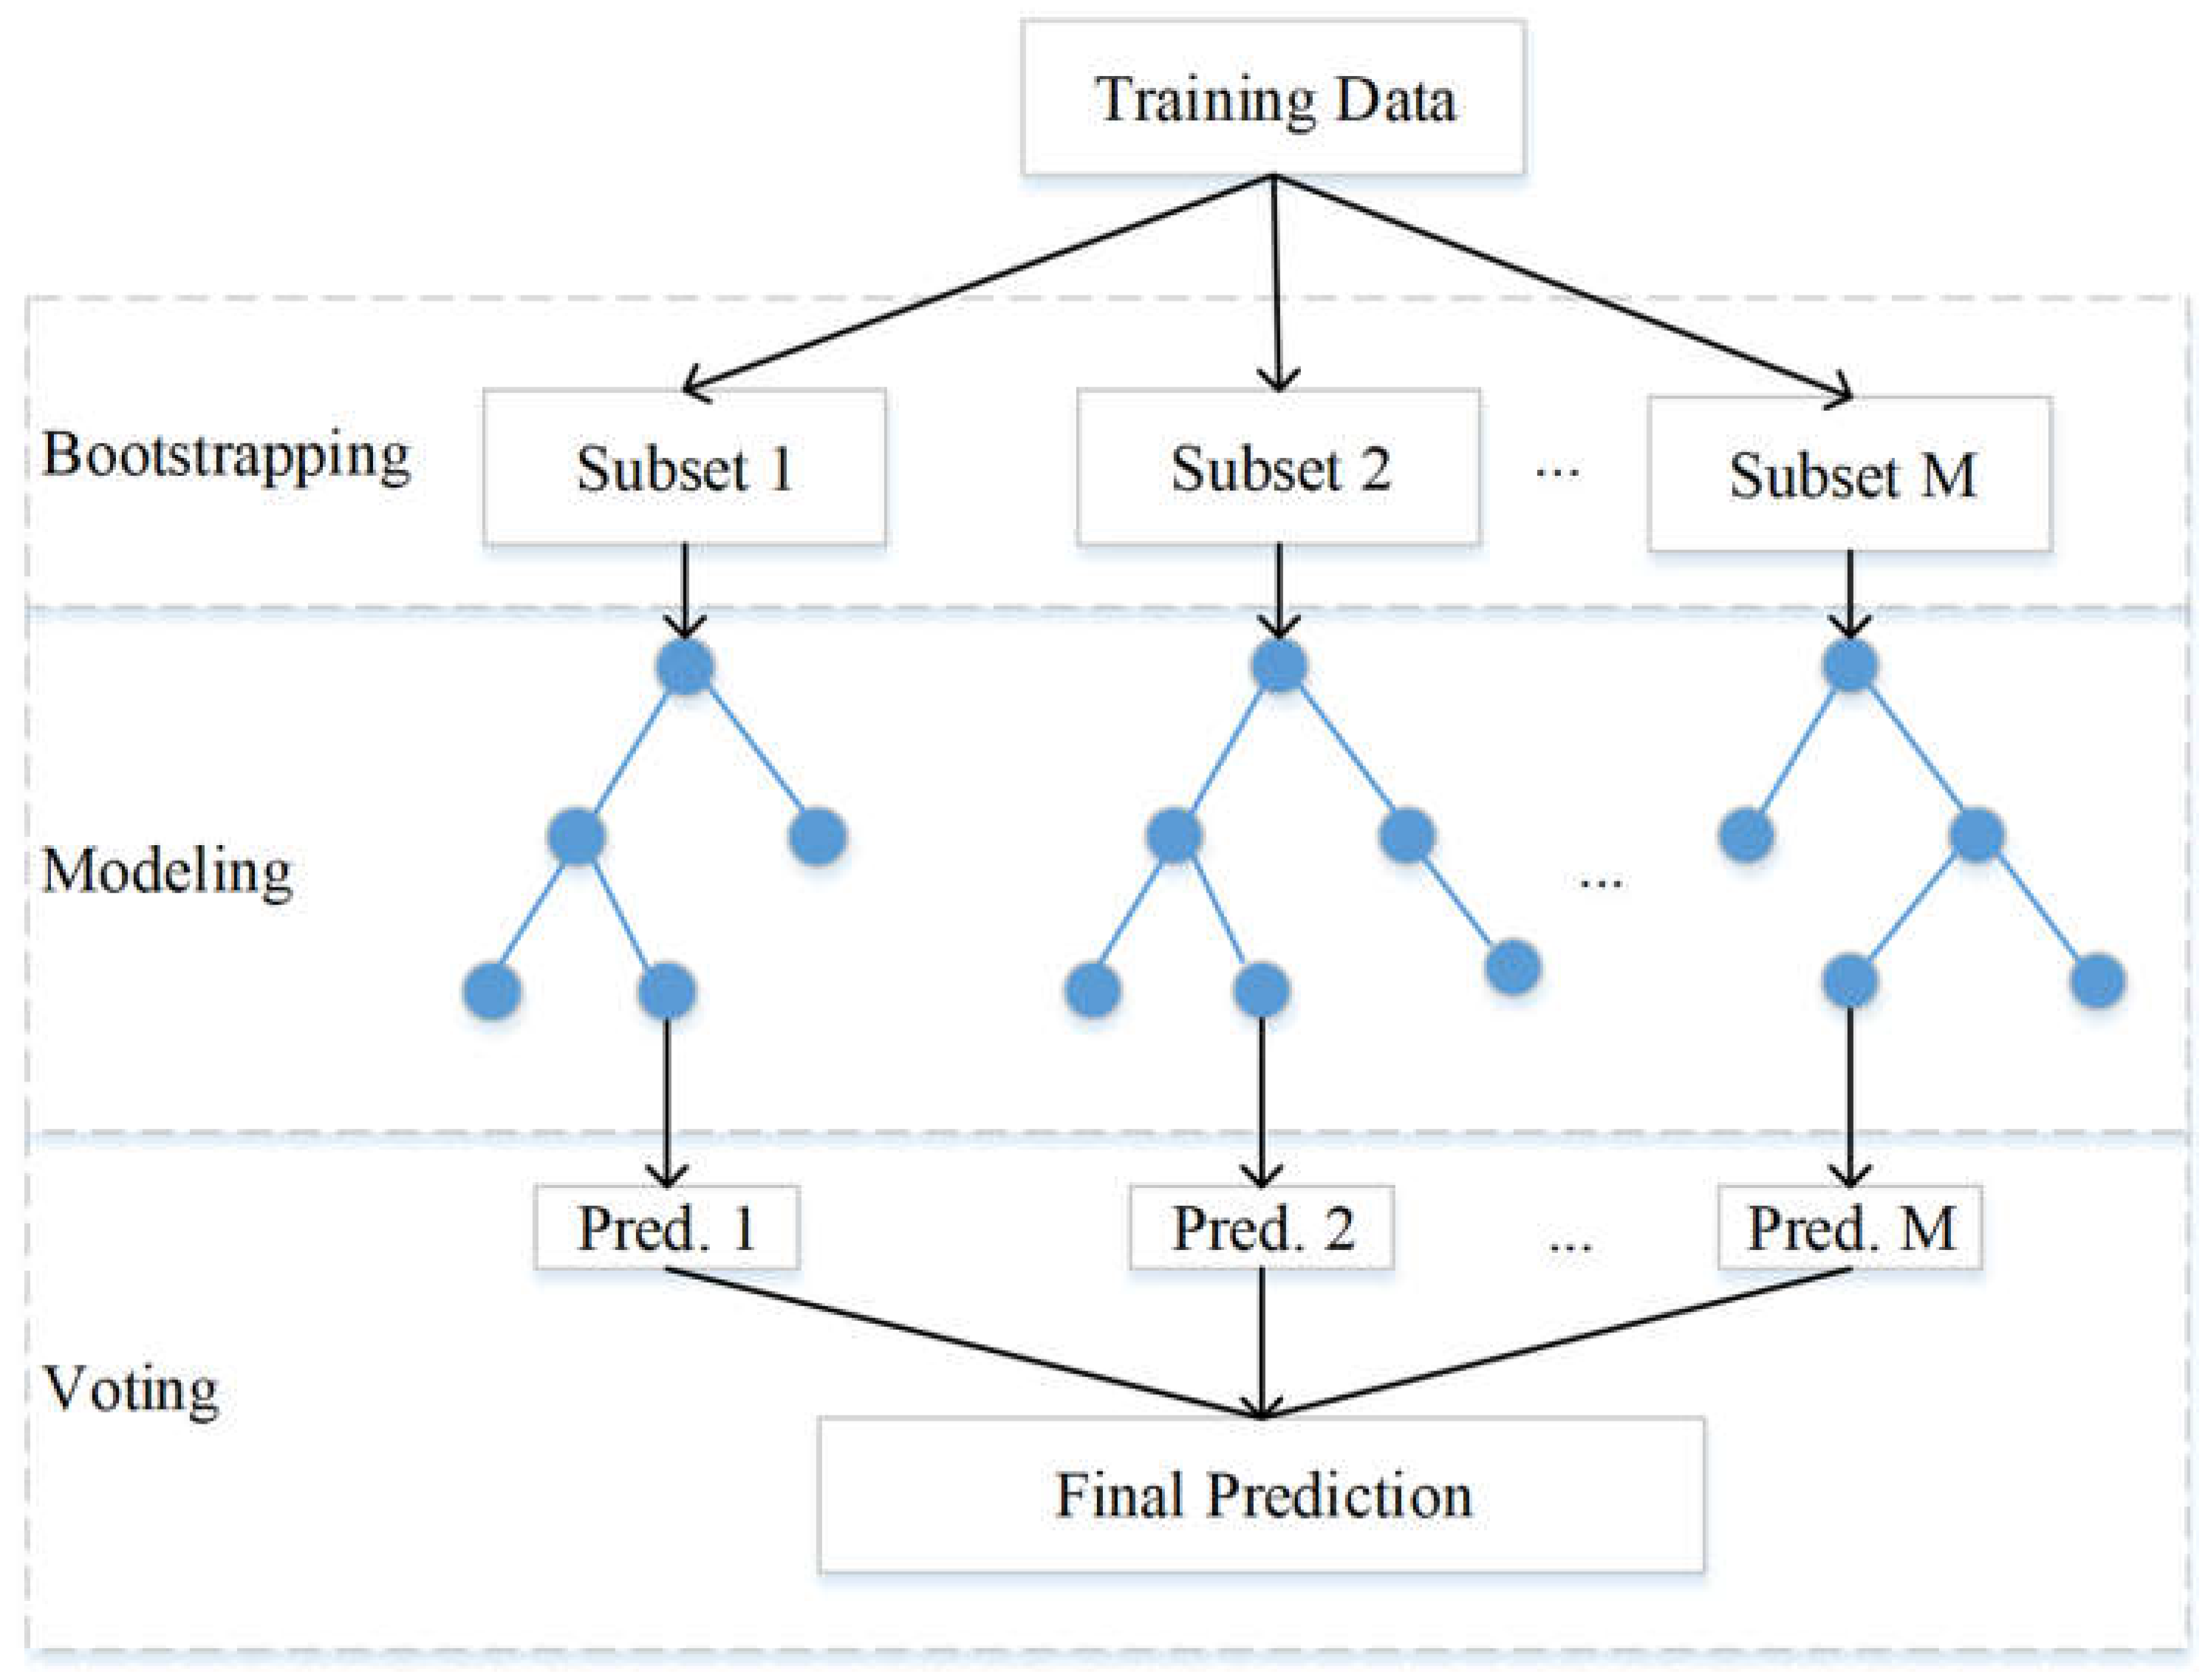
3.1. Random Forest
3.2. Grid Search
3.3. Performance Measure
4. Methodology
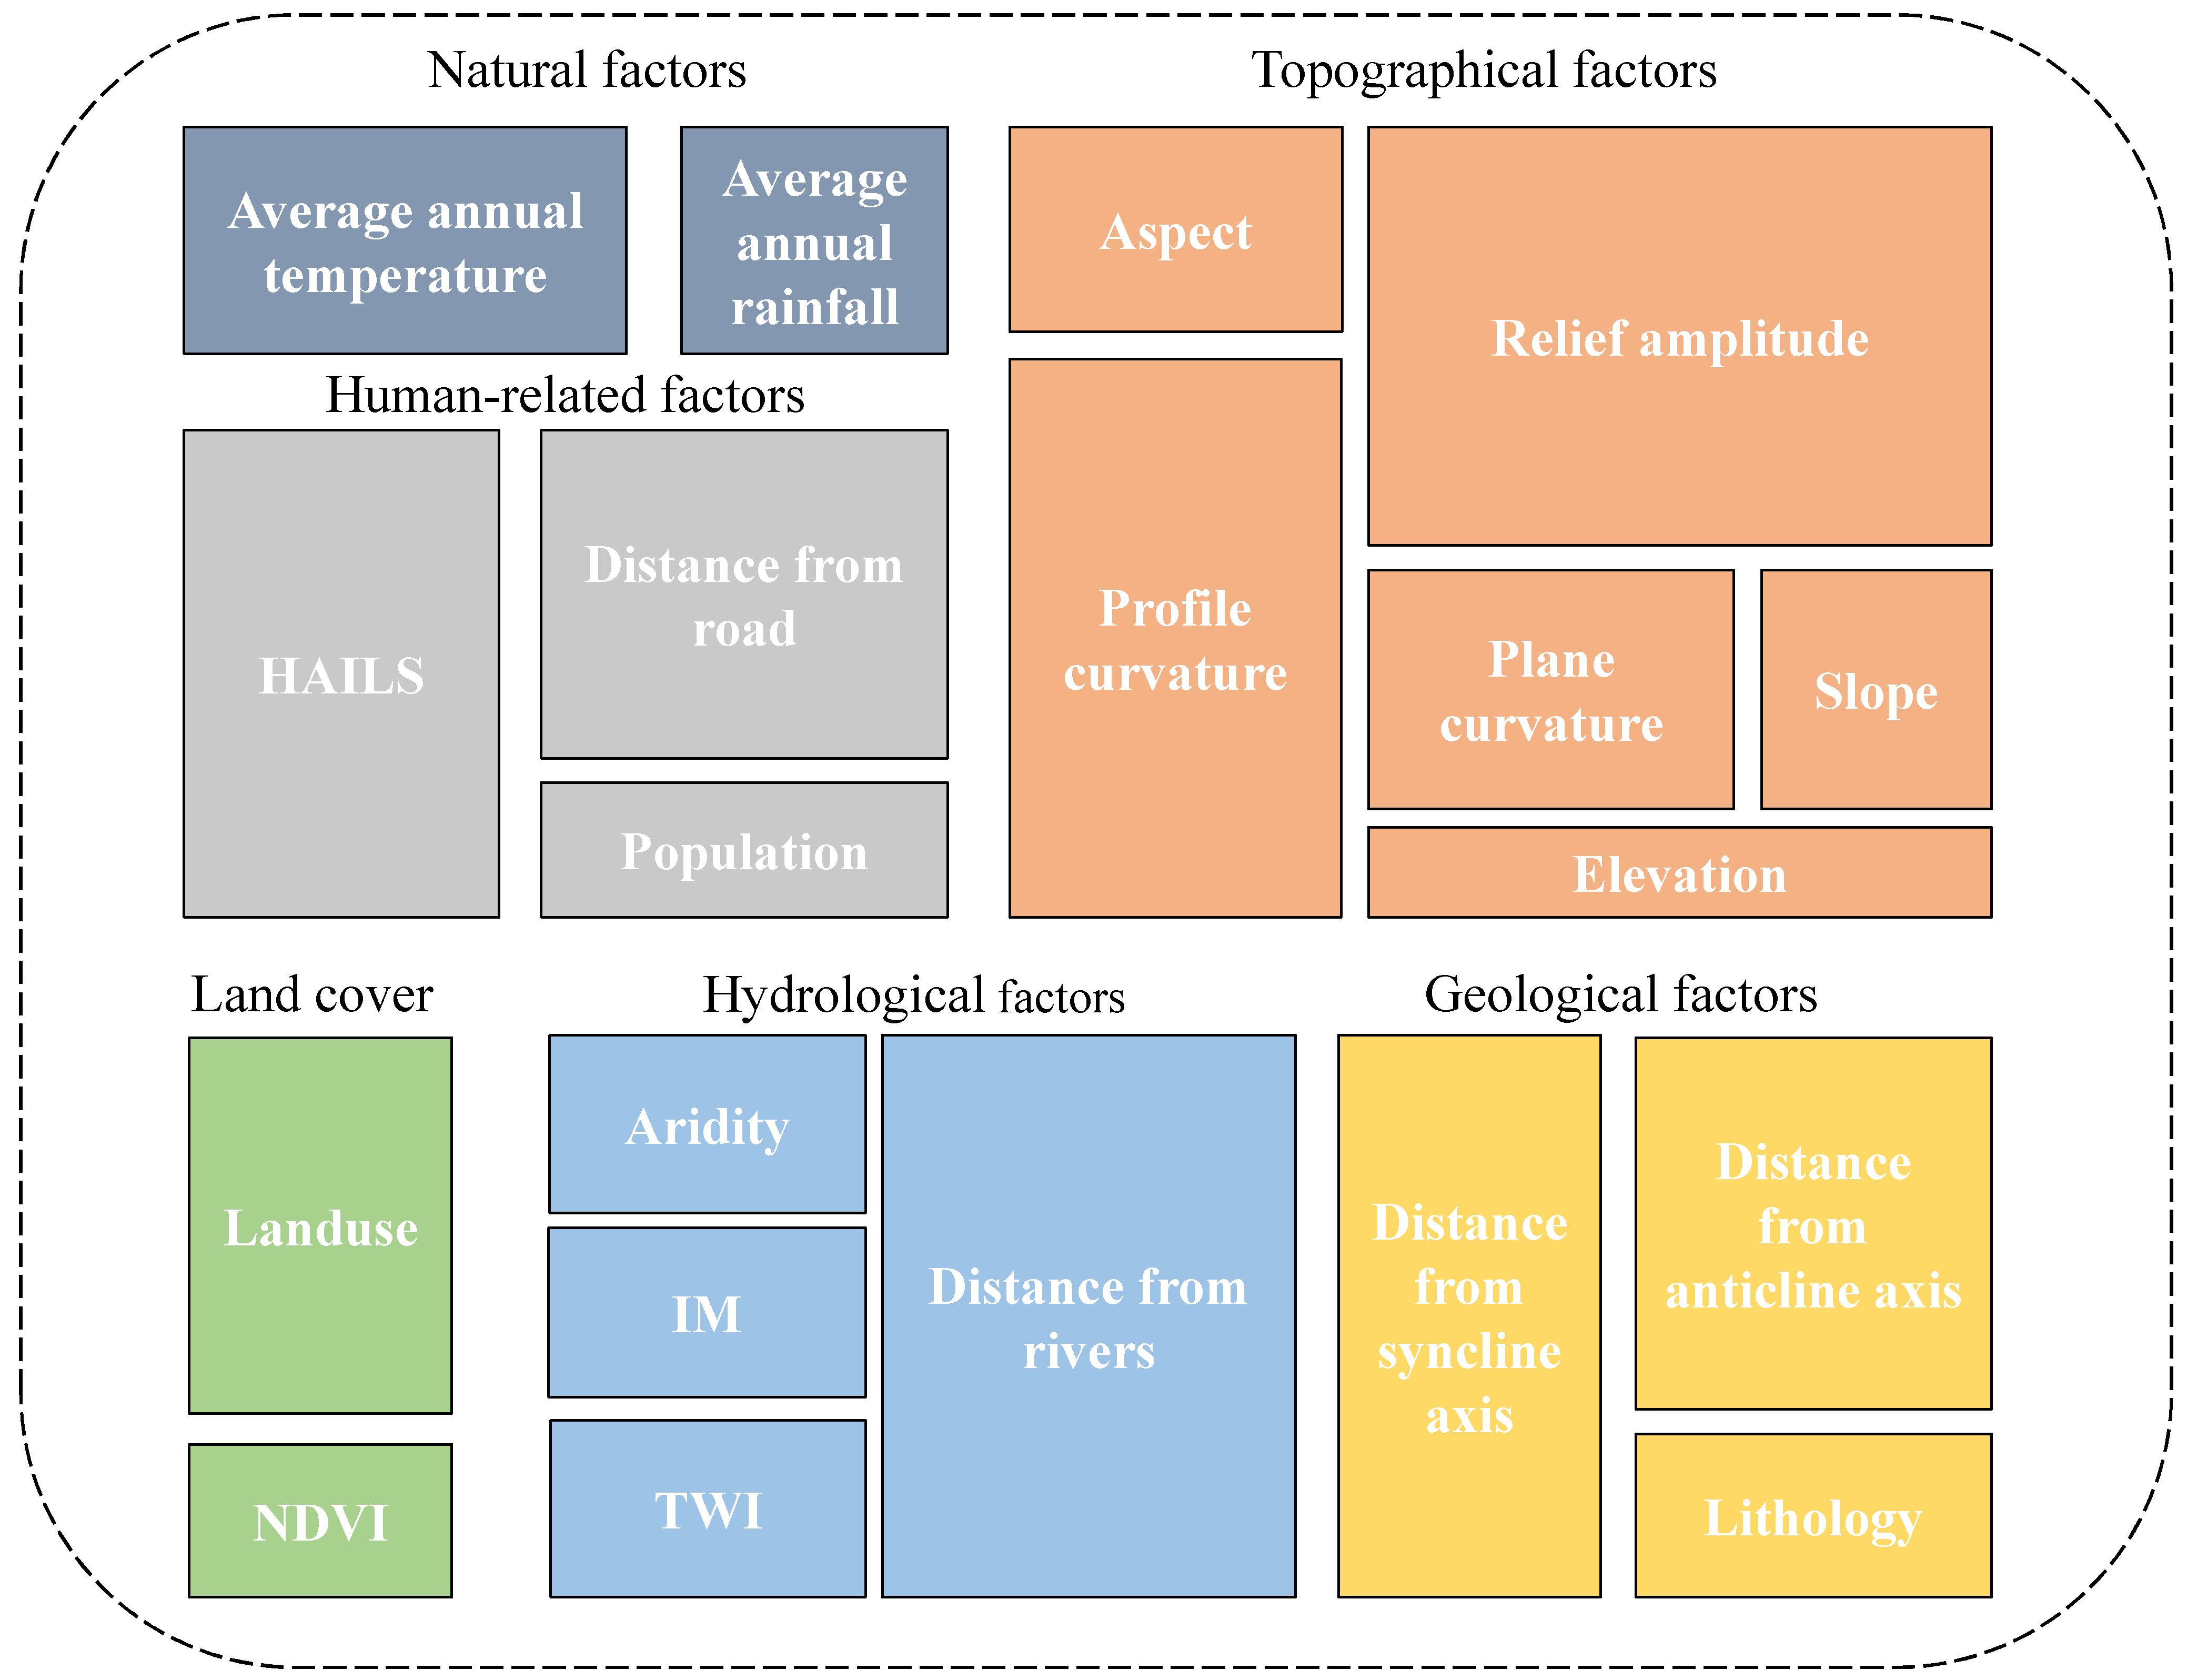
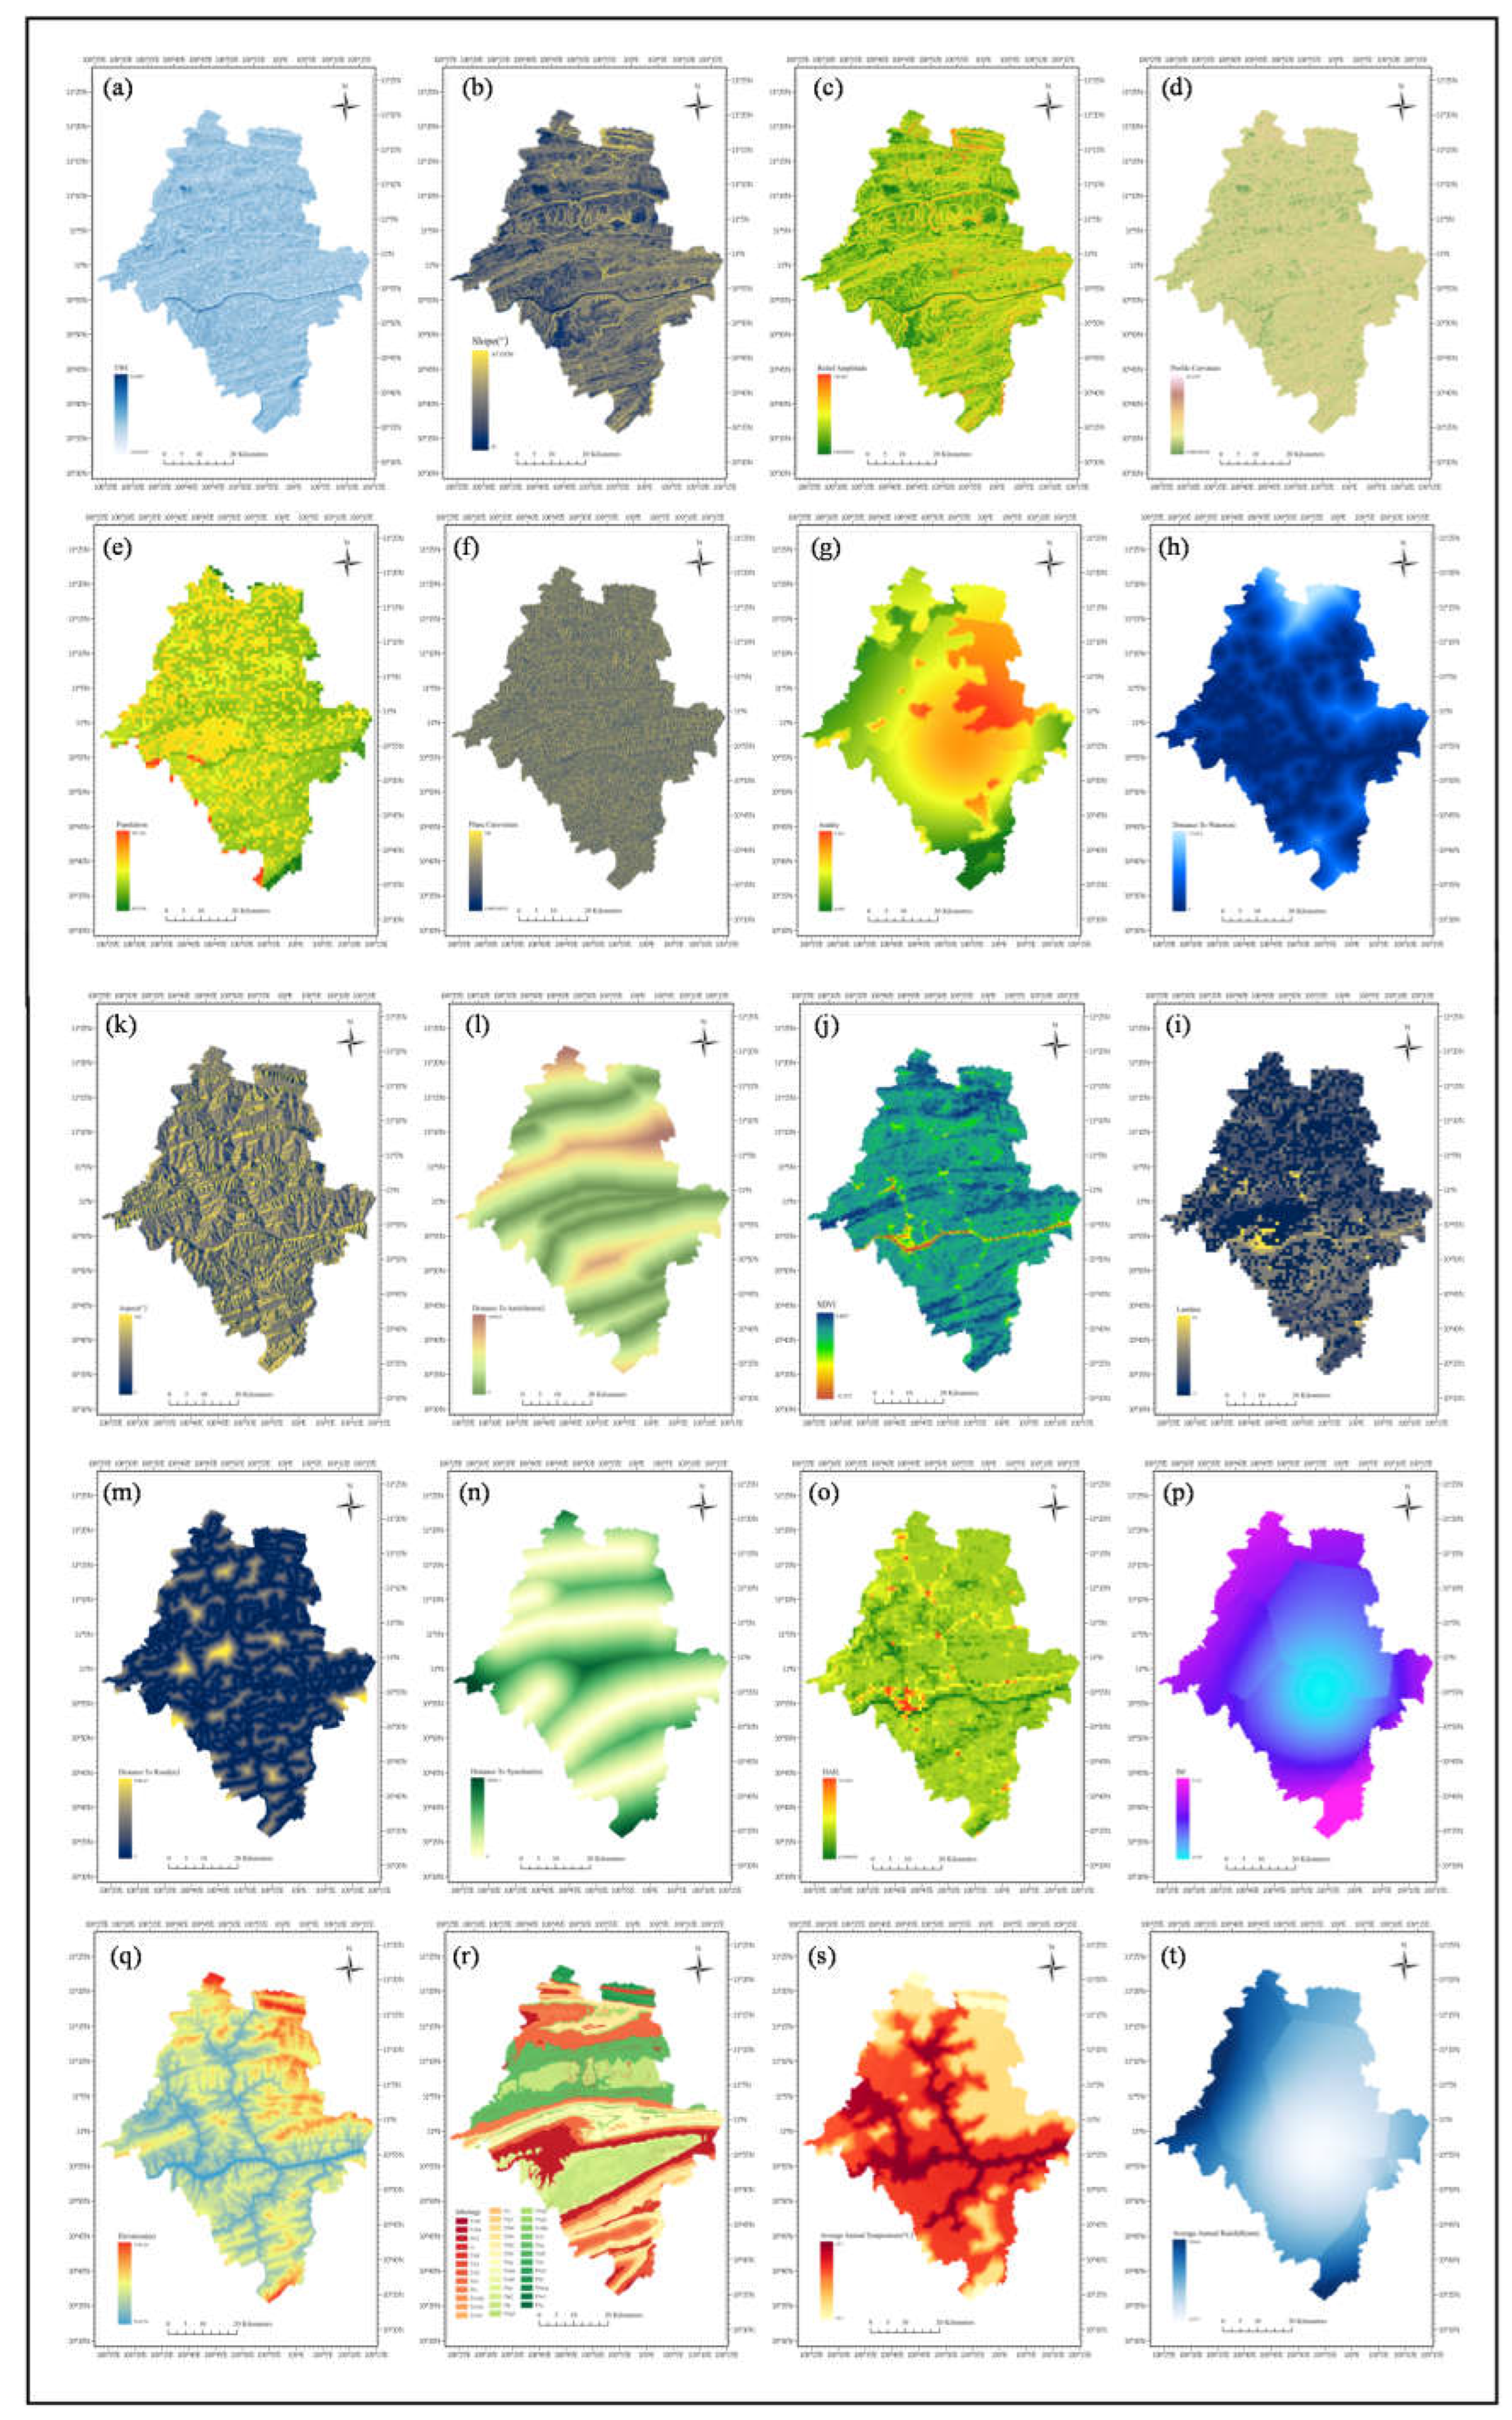
4.1. Data Collection and Preparation
4.2. Model Development and Application
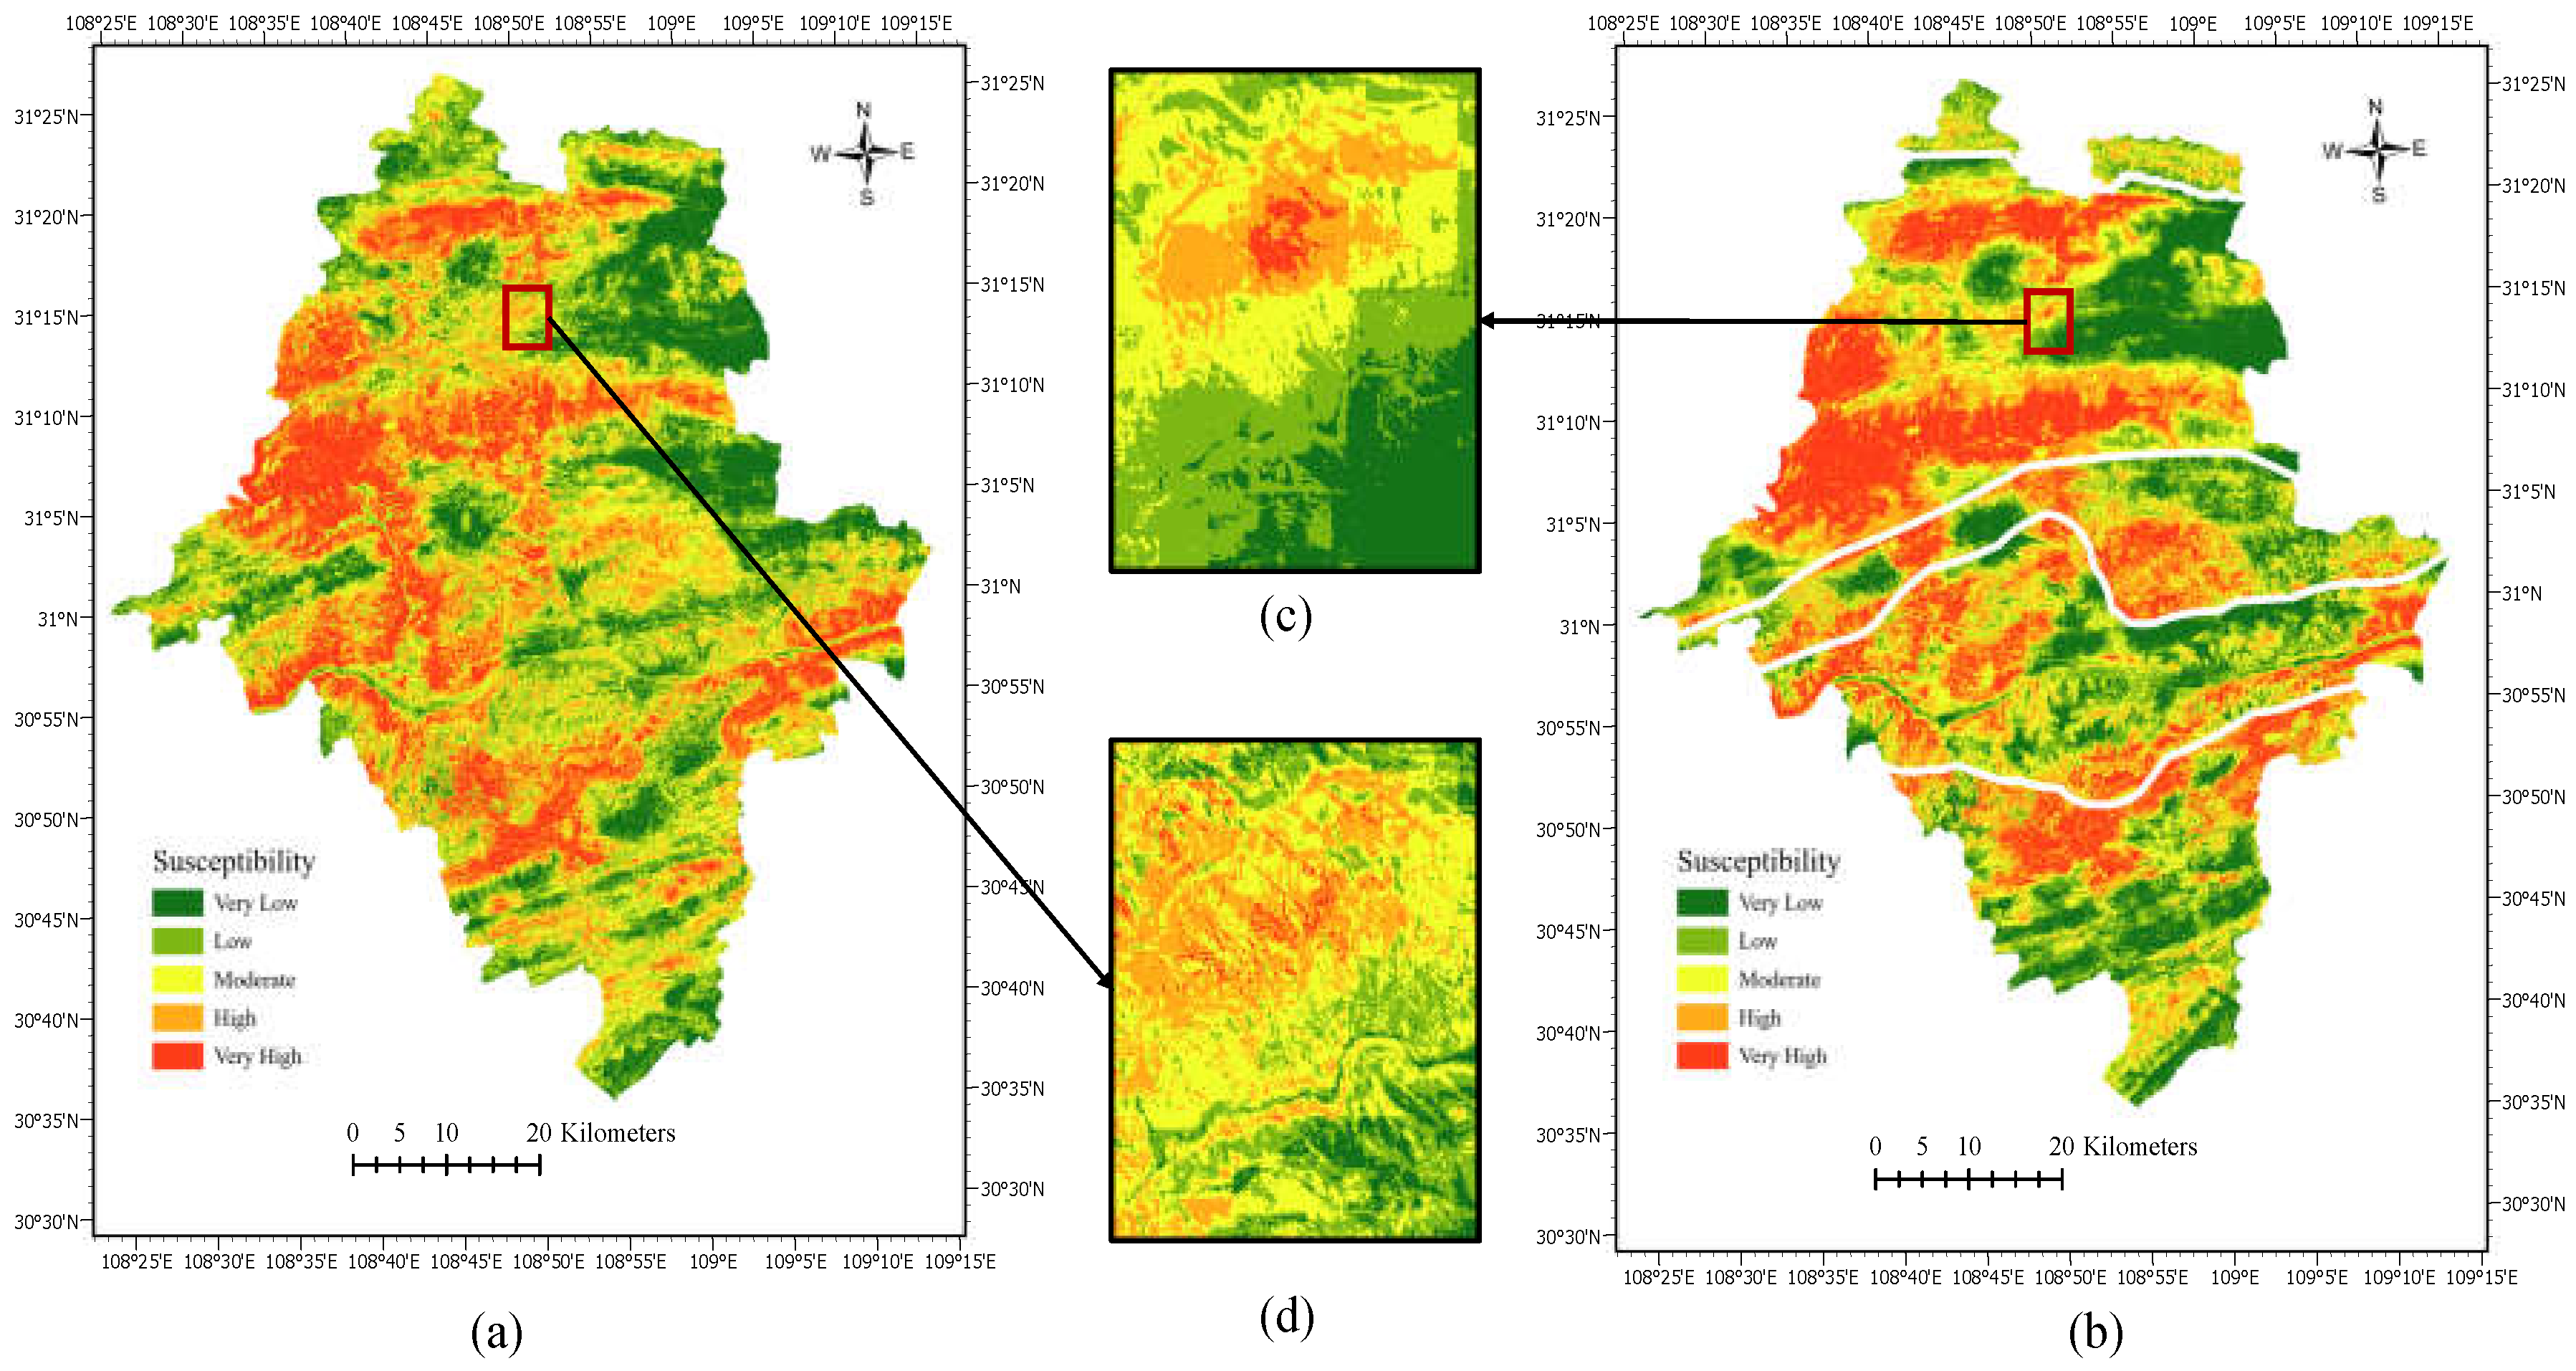
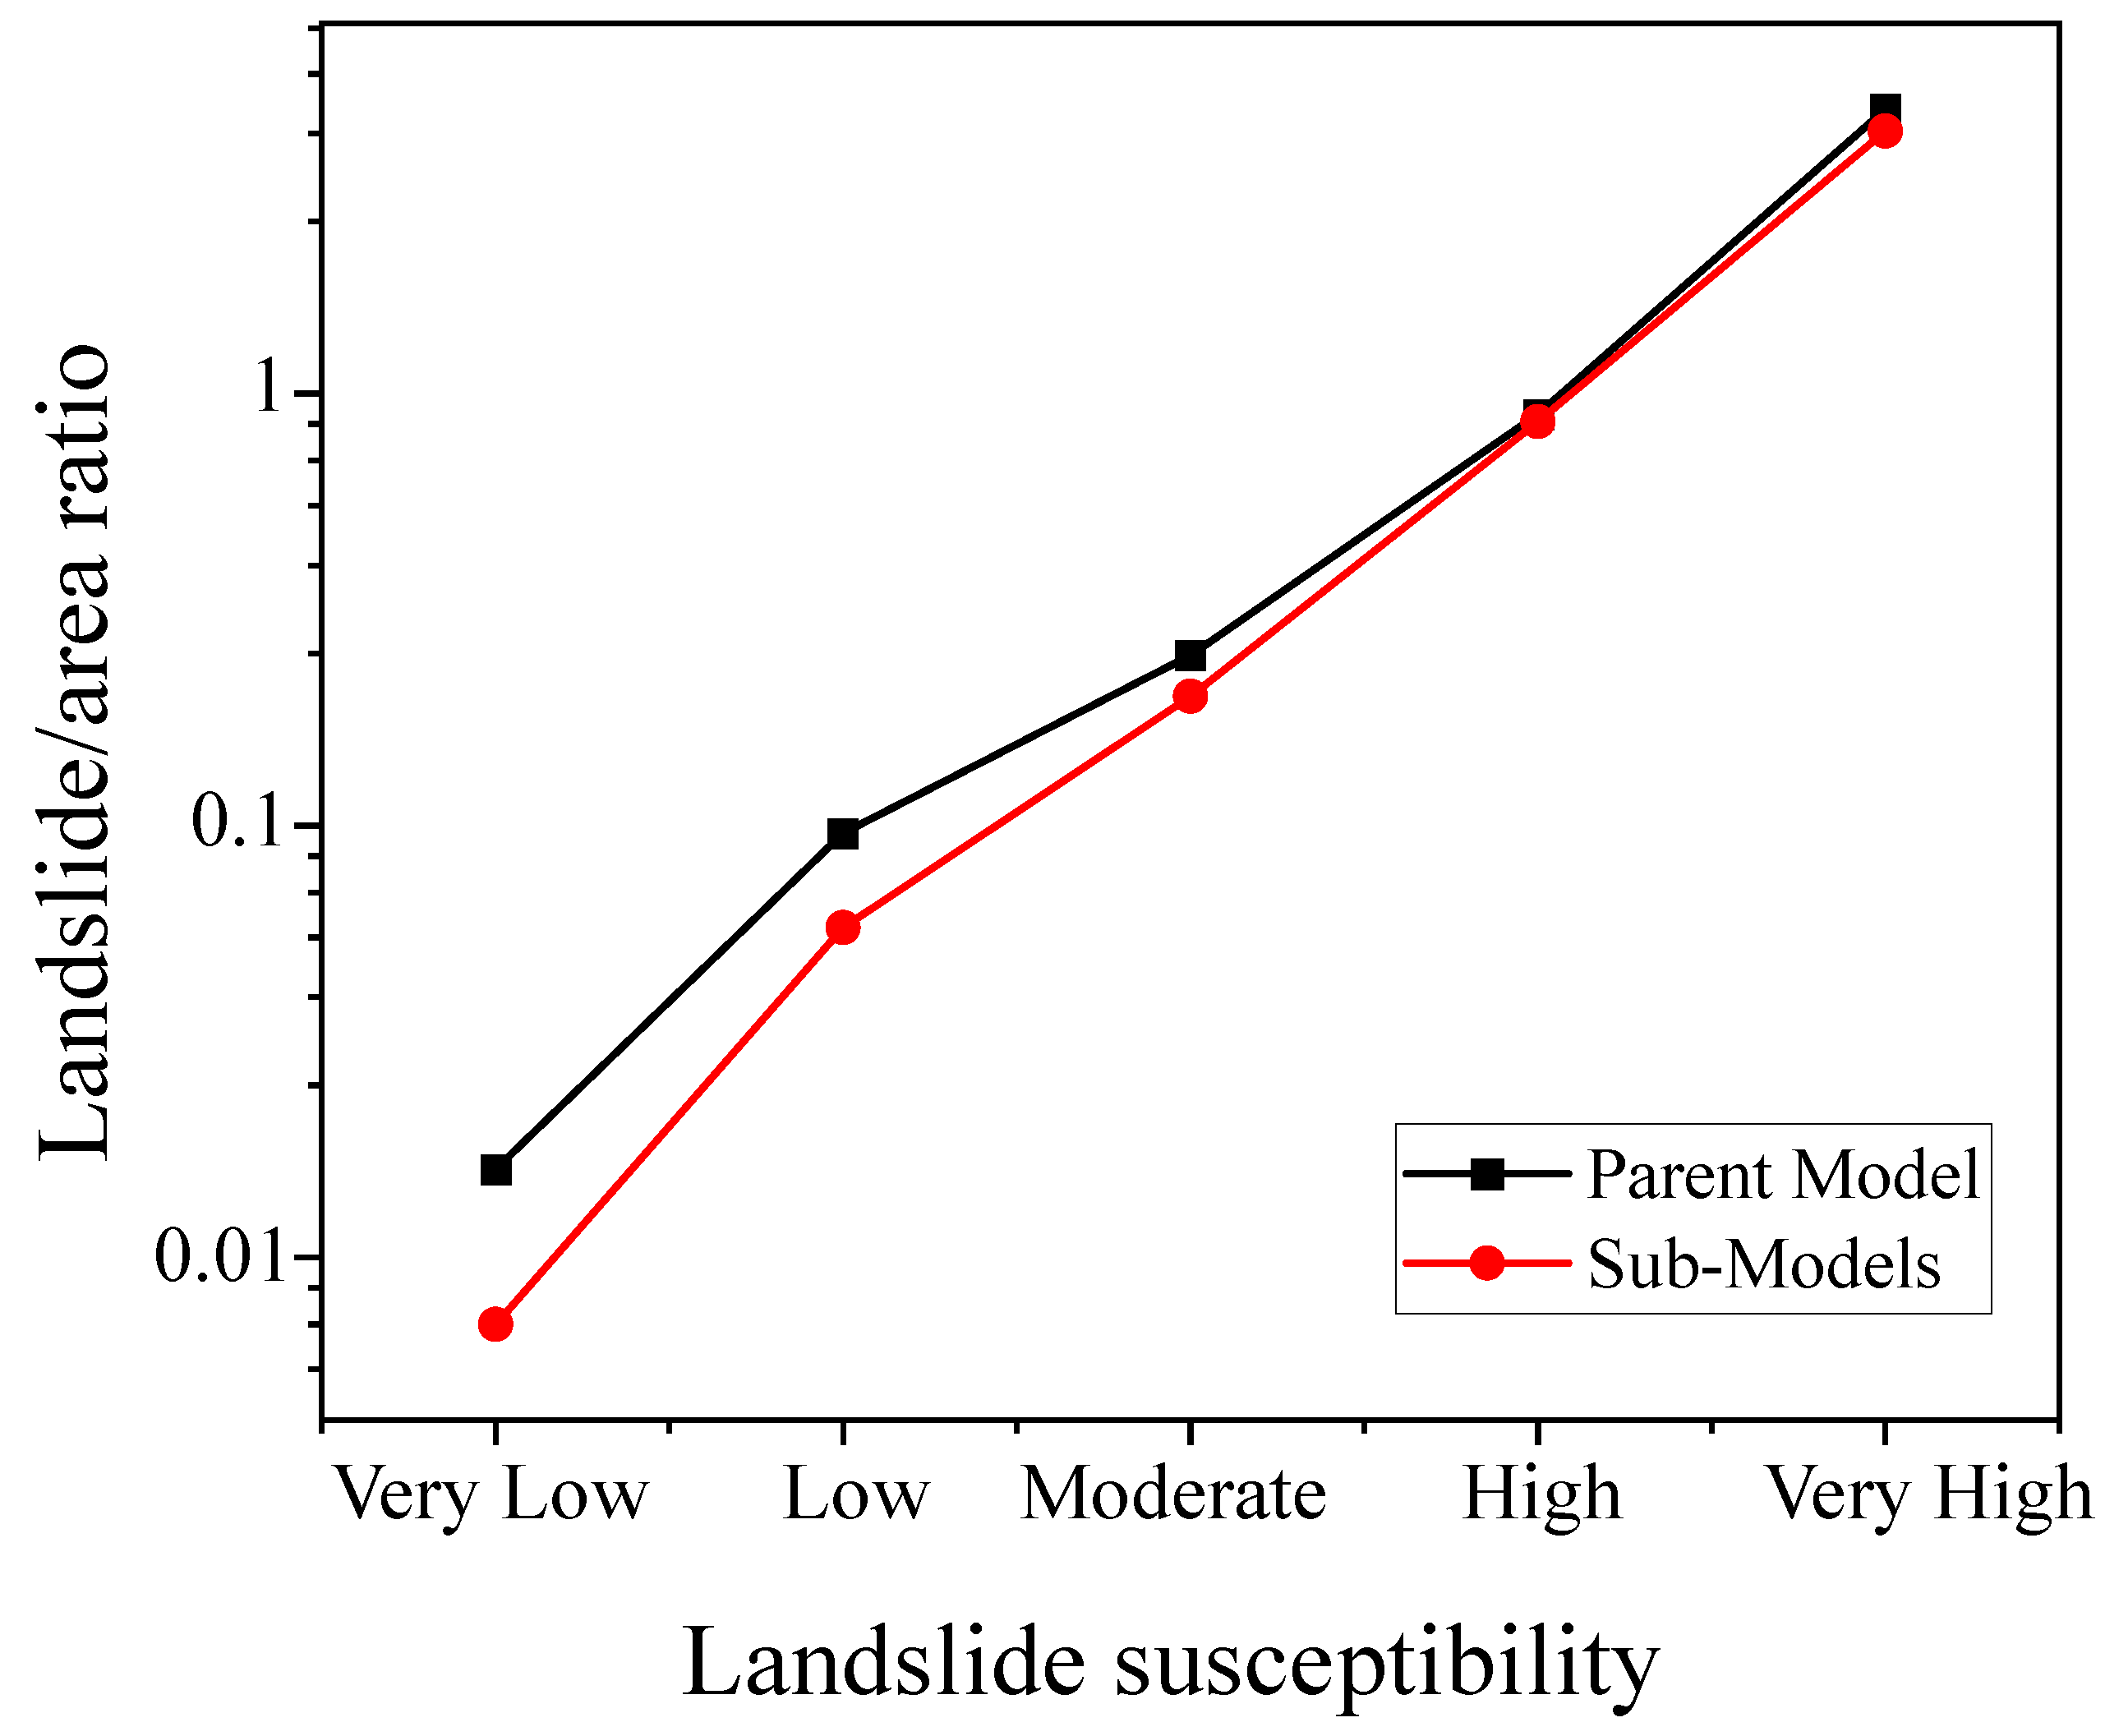
5. Results
6. Discussion
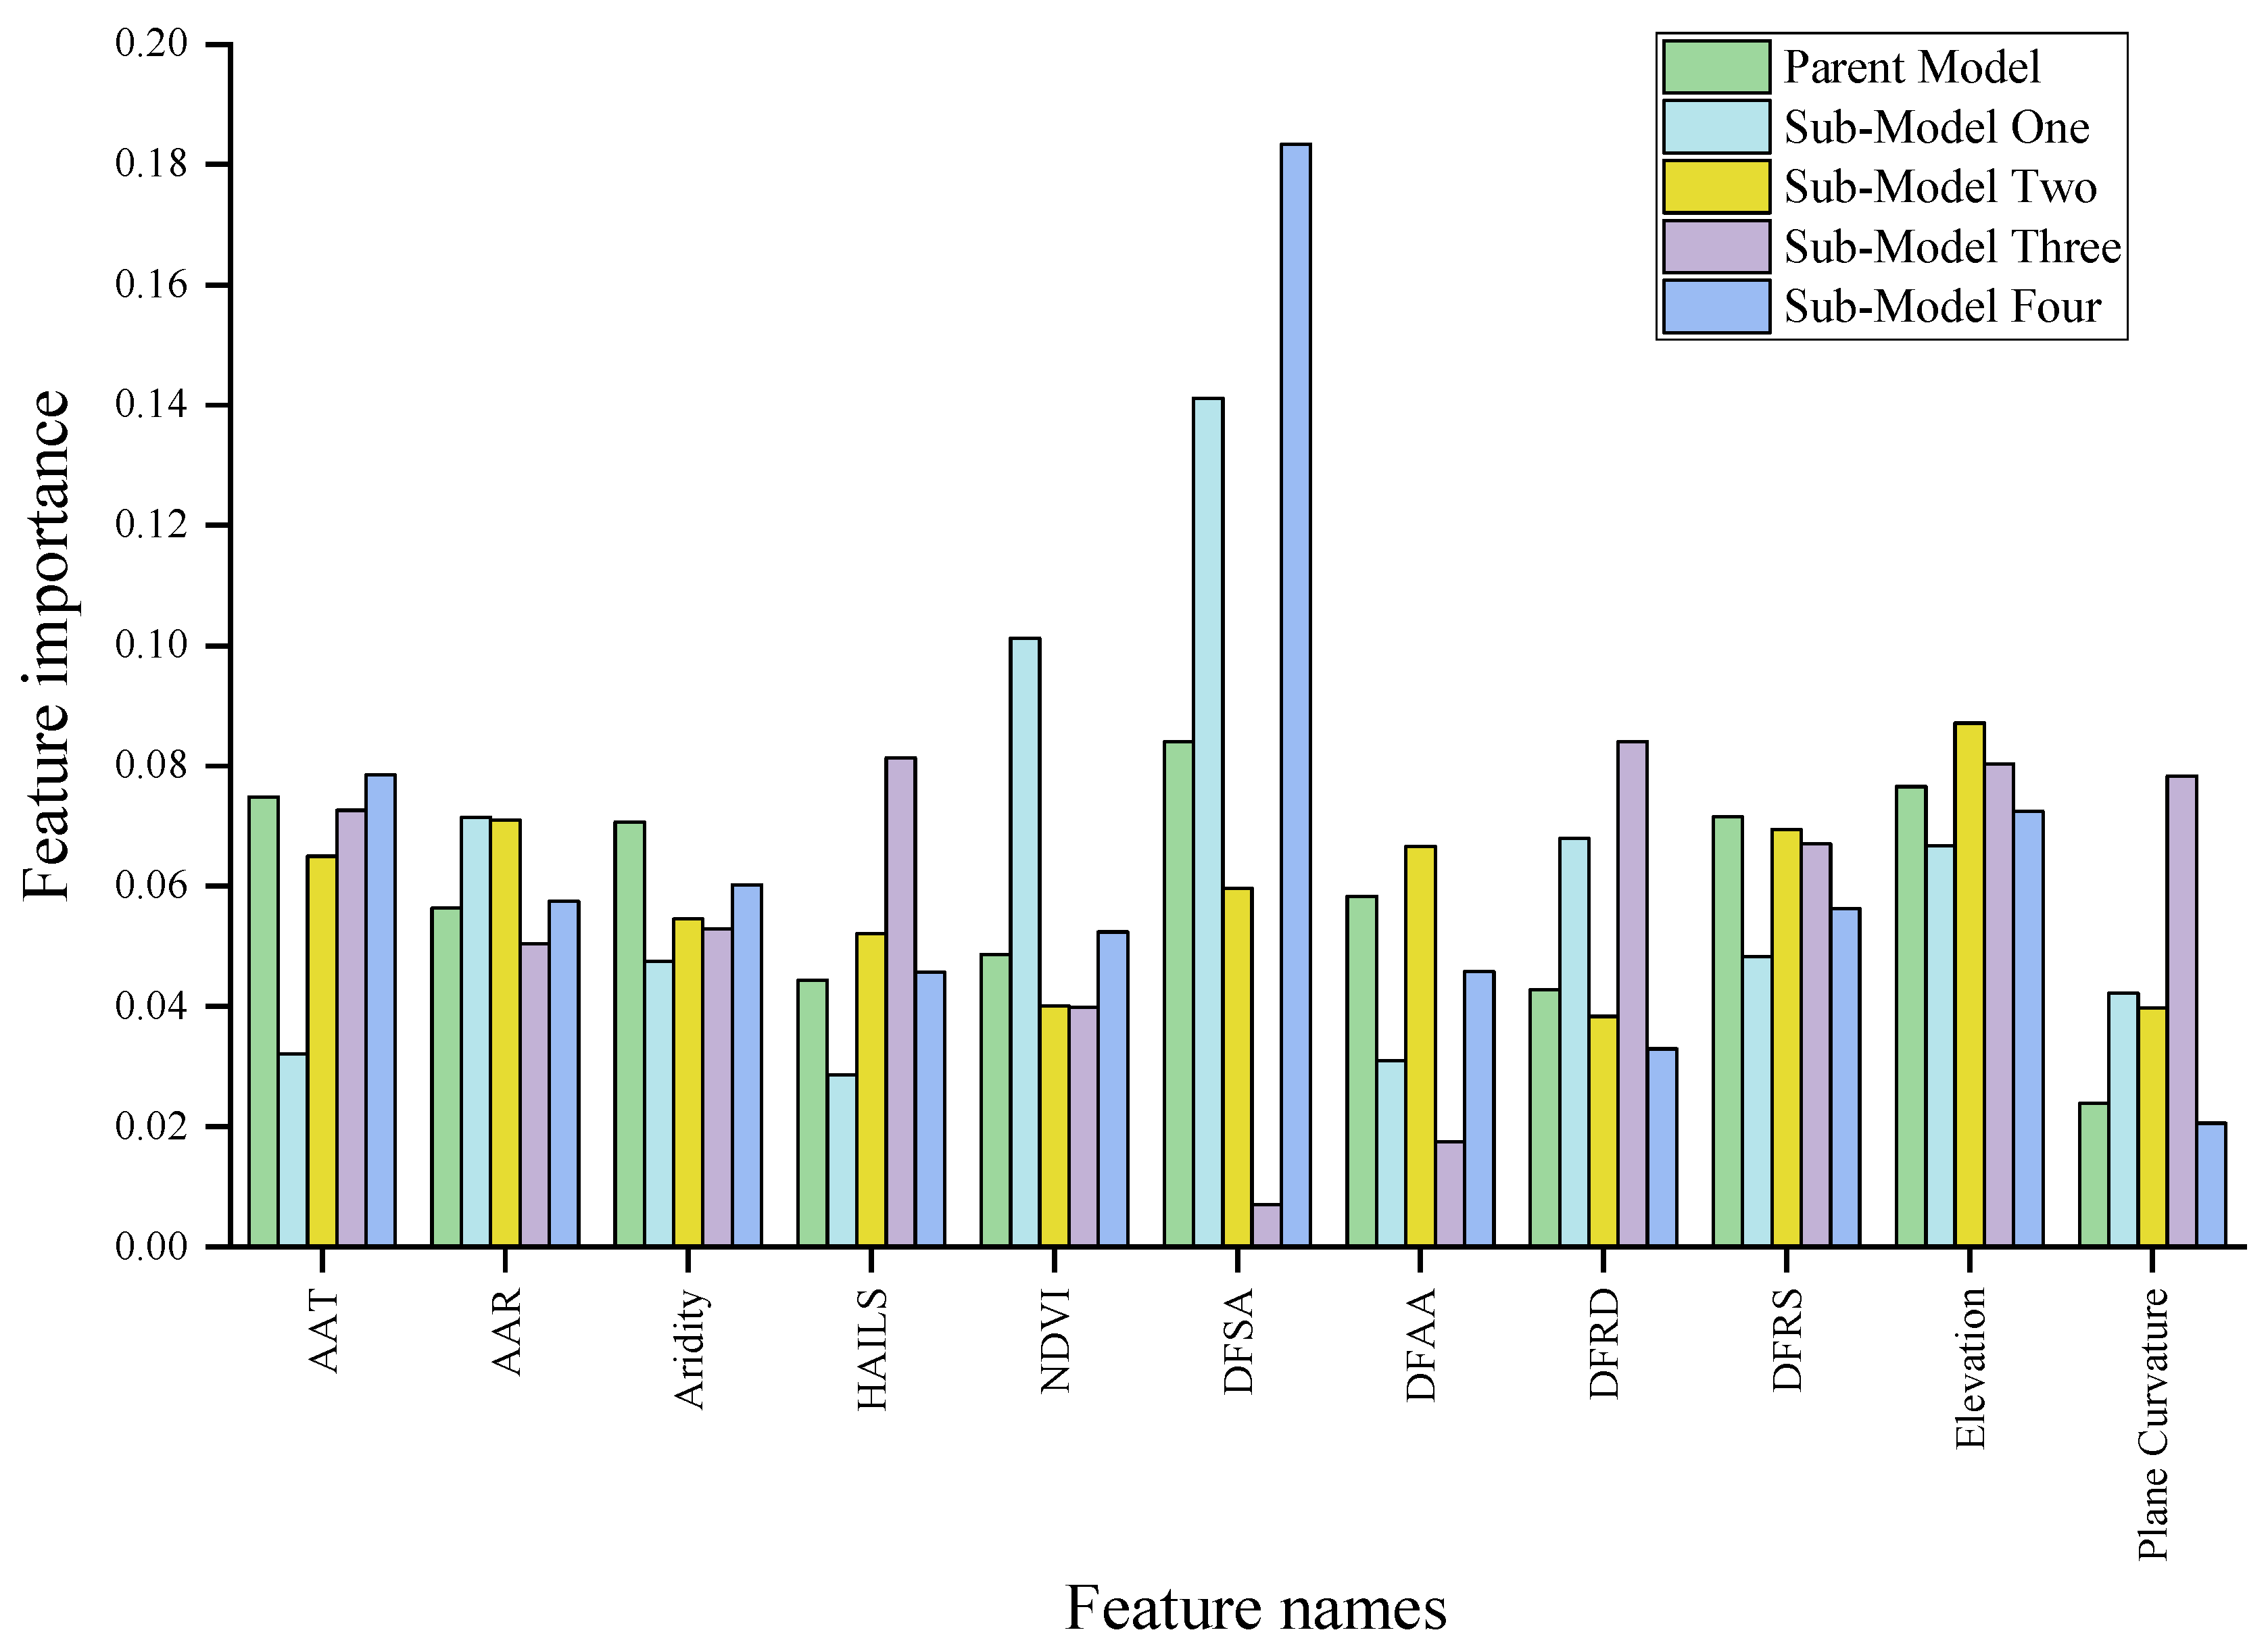
6.1. Feature Importance Analysis
6.2. Model Comparison
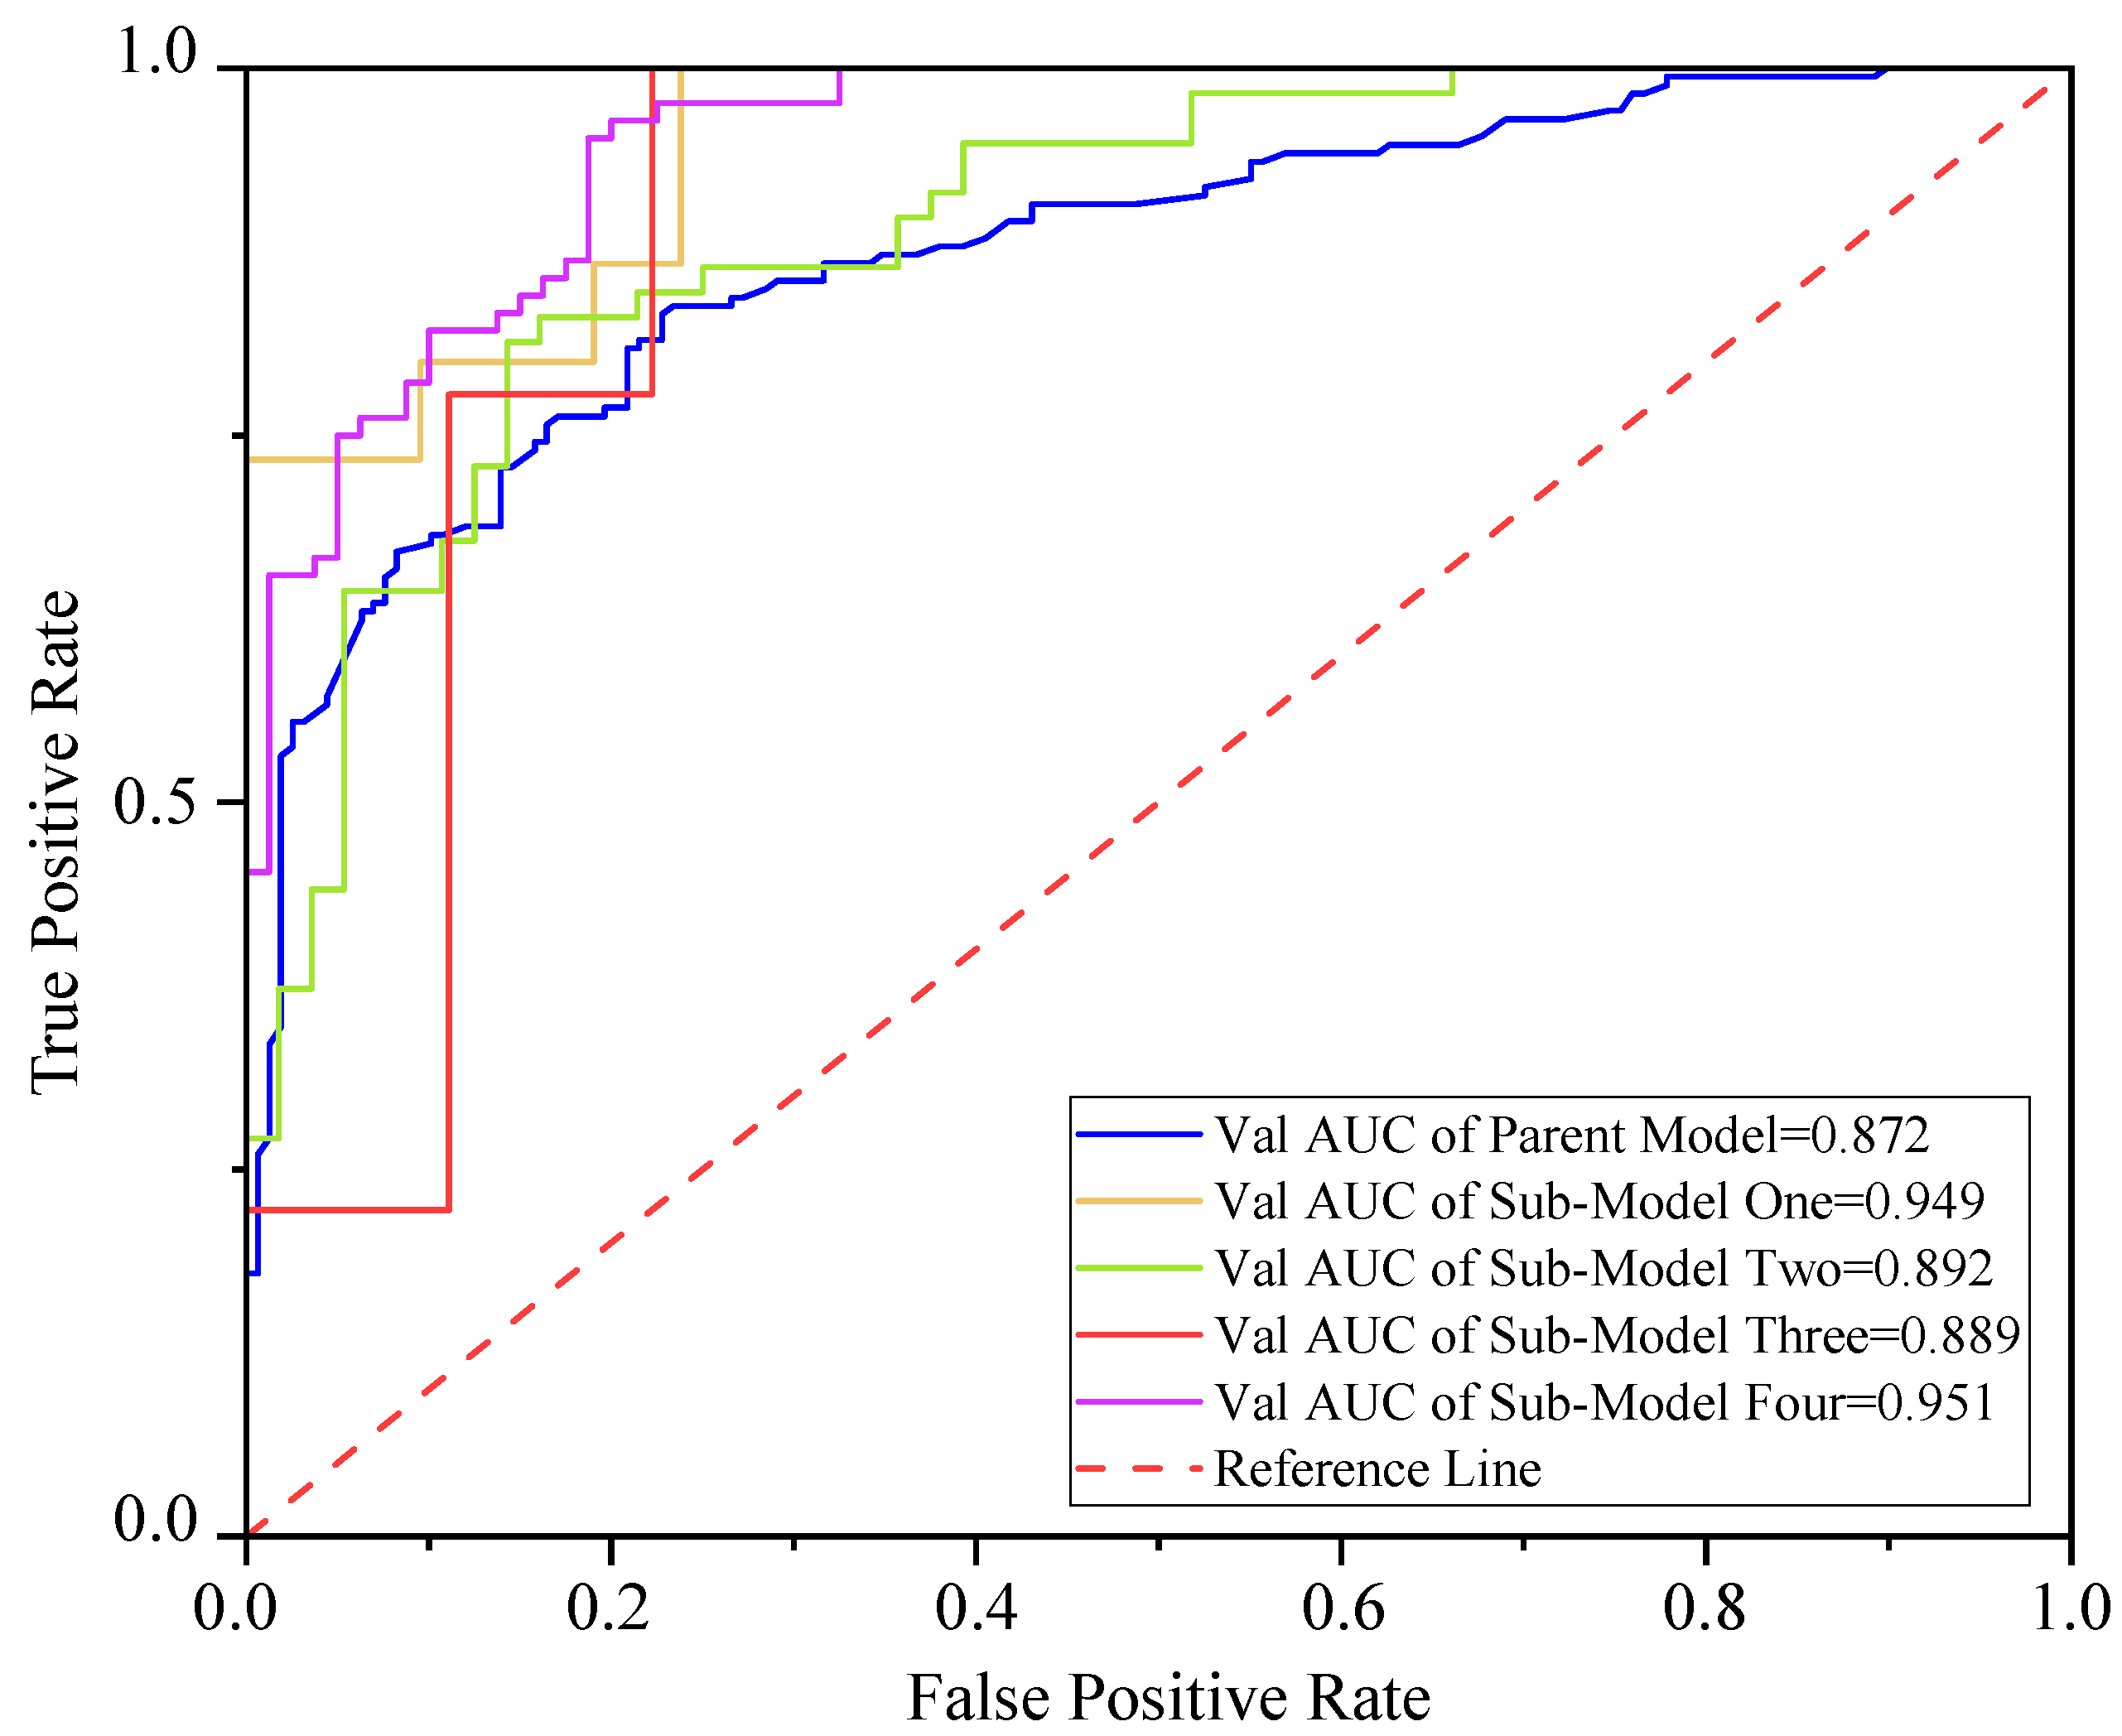
6.2.1. Parent Model
6.2.2. Sub-Models
7. Conclusions
Author Contributions
Funding
Data Availability Statement
Conflicts of Interest
References
- Huang, F.; Huang, J.; Jiang, S.; Zhou, C. Landslide displacement prediction based on multivariable chaotic model and extreme learning machine. Eng. Geol. 2017, 218, 173–186. [Google Scholar] [CrossRef]
- Petley, D. Global patterns of loss of life from landslides. Geology 2012, 40, 927–930. [Google Scholar] [CrossRef]
- Lin, L.; Lin, Q.; Wang, Y. Landslide susceptibility mapping on a global scale using the method of logistic regression. Nat. Hazards Earth Syst. Sci. 2017, 17, 1411–1424. [Google Scholar] [CrossRef] [Green Version]
- Sheng, L.; Wang, W.; Zhu, W. China Statistical Yearbook 2016; China Statistics Press: Beijing, China, 2016. (In Chinese) [Google Scholar]
- Sun, D.; Xu, J.; Wen, H.; Wang, D. Assessment of landslide susceptibility mapping based on Bayesian hyperparameter optimization: A comparison between logistic regression and random forest. Eng. Geol. 2021, 281, 105972. [Google Scholar] [CrossRef]
- Brabb, E. Innovative approaches to landslide hazard mapping. In Proceedings of the 4th International Symposium on Landslides, Toronto, ON, Canada, 16–21 September 1984; Volume 1, pp. 307–324. [Google Scholar]
- Wu, C.; Hong, L.; Wang, L.; Zhang, R.; Pijush, S.; Zhang, W. Prediction of wall deflection induced by braced excavation in spatially variable soils via convolutional neural network. Gondwana Res. 2022. [Google Scholar] [CrossRef]
- Wang, Y.; Tang, H.; Huang, J.; Wen, T.; Ma, J.; Zhang, J. A comparative study of different machine learning methods for reservoir landslide displacement prediction. Eng. Geol. 2022, 298, 106544. [Google Scholar] [CrossRef]
- Huang, F.; Chen, J.; Liu, W.; Huang, J.; Hong, H.; Chen, W. Regional rainfall-induced landslide hazard warning based on landslide susceptibility mapping and a critical rainfall threshold. Geomorphology 2022, 408, 108236. [Google Scholar] [CrossRef]
- He, Q.; Wang, M.; Liu, K. Rapidly assessing earthquake-induced landslide susceptibility on a global scale using random forest. Geomorphology 2021, 391, 107889. [Google Scholar] [CrossRef]
- Sun, D.; Wen, H.; Wang, D.; Xu, J. A random forest model of landslide susceptibility mapping based on hyperparameter optimization using Bayes algorithm. Geomorphology 2020, 362, 107201. [Google Scholar] [CrossRef]
- Smith, H.G.; Spiekermann, R.; Betts, H.; Neverman, A.J. Comparing methods of landslide data acquisition and susceptibility modelling: Examples from New Zealand. Geomorphology 2021, 381, 107660. [Google Scholar] [CrossRef]
- Lim, C.H.; Kim, H.J. Can Forest-Related Adaptive Capacity Reduce Landslide Risk Attributable to Climate Change?—Case of Republic of Korea. Forests 2022, 13, 49. [Google Scholar] [CrossRef]
- Nhu, V.-H.; Shirzadi, A.; Shahabi, H.; Singh, S.K.; Al-Ansari, N.; Clague, J.J.; Jaafari, A.; Chen, W.; Miraki, S.; Dou, J.; et al. Shallow landslide susceptibility mapping: A comparison between logistic model tree, logistic regression, naïve Bayes tree, artificial neural network, and support vector machine algorithms. Int. J. Environ. Res. Public Health 2020, 17, 2749. [Google Scholar] [CrossRef]
- Zhang, W.; Li, H.; Han, L.; Chen, L.; Wang, L. Slope stability prediction using ensemble learning techniques: A case study in Yunyang County, Chongqing, China. J. Rock Mech. Geotech. Eng. 2022, in press. [CrossRef]
- Hu, Q.; Zhou, Y.; Wang, S.; Wang, F. Machine learning and fractal theory models for landslide susceptibility mapping: Case study from the Jinsha River Basin. Geomorphology 2020, 351, 106975. [Google Scholar] [CrossRef]
- Zhou, X.; Wen, H.; Zhang, Y.; Xu, J.; Zhang, W. Landslide susceptibility mapping using hybrid random forest with GeoDetector and RFE for factor optimization. Geosci. Front. 2021, 12, 101211. [Google Scholar] [CrossRef]
- Sun, D.; Gu, Q.; Wen, H.; Shi, S.; Mi, C.; Zhang, F. A Hybrid Landslide Warning Model Coupling Susceptibility Zoning and Precipitation. Forests 2022, 13, 827. [Google Scholar] [CrossRef]
- Zhou, X.; Wen, H.; Li, Z.; Zhang, H.; Zhang, W. An interpretable model for the susceptibility of rainfall-induced shallow landslides based on SHAP and XGBoost. Geocarto Int. TGEI 2022, 1–27, (online). [Google Scholar] [CrossRef]
- Akar, Ö.; Güngör, O. Integrating multiple texture methods and NDVI to the Random Forest classification algorithm to detect tea and hazelnut plantation areas in northeast Turkey. Int. J. Remote Sens. 2015, 36, 442–464. [Google Scholar] [CrossRef]
- Hengl, T.; Heuvelink, G.B.M.; Kempen, B.; Leenaars, J.G.B.; Walsh, M.G.; Shepherd, K.D.; Sila, A.; MacMillan, R.A.; Mendes De Jesus, J.; Tamene, L.; et al. Mapping soil properties of Africa at 250 m resolution: Random forests significantly improve current predictions. PLoS ONE 2015, 10, e0125814. [Google Scholar] [CrossRef]
- Feng, Q.; Liu, J.; Gong, J. Urban flood mapping based on unmanned aerial vehicle remote sensing and random forest classifier—A case of Yuyao, China. Water 2015, 7, 1437–1455. [Google Scholar] [CrossRef]
- Taalab, K.; Cheng, T.; Zhang, Y. Mapping landslide susceptibility and types using Random Forest. Big Earth Data 2018, 2, 159–178. [Google Scholar] [CrossRef]
- Yin, Y.; Wang, L.; Zhang, W.; Dai, Z. Research on the collapse process of a thick-layer dangerous rock on the reservoir bank. Bull. Eng. Geol. Environ. 2022, 81, 109. [Google Scholar] [CrossRef]
- Wang, L.; Zhang, Z.; Huang, B.; Hu, M.; Zhang, C. Triggering mechanism and possible evolution process of the ancient Qingshi landslide in the Three Gorges Reservoir. Geomat. Nat. Hazards Risk 2021, 12, 3160–3174. [Google Scholar] [CrossRef]
- Nakileza, B.R.; Nedala, S. Topographic influence on landslides characteristics and implication for risk management in upper Manafwa catchment, Mt Elgon Uganda. Geoenviron. Disasters 2020, 7, 27. [Google Scholar] [CrossRef]
- Nefeslioglu, H.A.; Gokceoglu, C.; Sonmez, H.; Gorum, T. Medium-scale hazard mapping for shallow landslide initiation: The Buyukkoy catchment area (Cayeli, Rize, Turkey). Landslides 2011, 8, 459–483. [Google Scholar] [CrossRef]
- Breiman, L. Bagging predictors. Mach. Learn. 1996, 24, 123–140. [Google Scholar] [CrossRef] [Green Version]
- Cutler, A.; Stevens, J.R. Random forests for microarrays. Methods Enzymol. 2006, 411, 422–432. [Google Scholar] [CrossRef]
- Zhang, W.; Wu, C.; Zhong, H.; Li, Y.; Wang, L. Prediction of undrained shear strength using extreme gradient boosting and random forest based on Bayesian optimization. Geosci. Front. 2020, 12, 469–477. [Google Scholar] [CrossRef]
- Lee, S.; Pradhan, B. Landslide hazard mapping at Selangor, Malaysia using frequency ratio and logistic regression models. Landslides 2007, 4, 33–41. [Google Scholar] [CrossRef]
- Raghuvanshi, T.K.; Negassa, L.; Kala, P.M. GIS based grid overlay method versus modeling approach—A comparative study for landslide hazard zonation (LHZ) in Meta Robi District of west showa zone in Ethiopia. Egypt. J. Remote Sens. Space Sci. 2015, 18, 235–250. [Google Scholar] [CrossRef] [Green Version]
- Girma, F.; Raghuvanshi, T.K.; Ayenew, T.; Hailemariam, T. Landslide hazard zonation in Ada Berga district, central Ethiopia- A GIS based statistical approach. J. Geomat. 2015, 9, 25–38. [Google Scholar]
- Reichenbach, P.; Rossi, M.; Malamud, B.D.; Mihir, M.; Guzzetti, F. A review of statistically-based landslide susceptibility models. Earth-Sci. Rev. 2018, 180, 60–91. [Google Scholar] [CrossRef]
- Yesilnacar, E.; Topal, T. Landslide susceptibility mapping: A comparison of logistic regression and neural networks methods in a medium scale study, Hendek Region (Turkey). Eng. Geol. 2005, 79, 251–266. [Google Scholar] [CrossRef]
- Mathew, J.; Jha, V.K.; Rawat, G.S. Landslide susceptibility zonation mapping and its validation in part of Garhwal Lesser Himalaya, India, using binary logistic regression analysis and receiver operating characteristic curve method. Landslides 2008, 6, 17–26. [Google Scholar] [CrossRef]
- Wang, X.; Li, S.; Liu, H.; Liu, L.; Liu, Y.; Zeng, S.; Tang, Q. Landslide susceptibility assessment in Wenchuan County after the 5.12 magnitude earthquake. Bull. Eng. Geol. Environ. 2021, 80, 5369–5390. [Google Scholar] [CrossRef]
- LaValle, S.M.; Branicky, M.S. On the Relationship between Classical Grid Search and Probabilistic Roadmaps; Springer Tracts in Advanced Robotics: Berlin/Heidelberg, Germany, 2004; pp. 59–75. [Google Scholar] [CrossRef]
- Liu, C.H.; Chamberlain, B.P.; Little, D.A.; Cardoso, Â. Generalising random forest parameter optimisation to include stability and cost. Mach. Learn. Knowl. Discov. Databases 2017, 10536, 102–113. [Google Scholar] [CrossRef] [Green Version]
- Lujan-Moreno, G.A.; Howard, P.R.; Rojas, O.G.; Montgomery, D.C. Design of experiments and response surface methodology to tune machine learning hyperparameters, with a random forest case-study. Expert Syst. Appl. 2018, 109, 195–205. [Google Scholar] [CrossRef]
- Ivanov, V.; Arosio, D.; Tresoldi, G.; Hojat, A.; Zanzi, L.; Papini, M.; Longoni, L. Investigation on the role of water for the stability of shallow landslides—insights from experimental tests. Water 2020, 12, 1203. [Google Scholar] [CrossRef] [Green Version]
- Wang, F.; Xu, P.; Wang, C.; Wang, N.; Jiang, N. Application of a GIS-based slope unit method for landslide susceptibility mapping along the Longzi River, southeastern Tibetan Plateau, China. ISPRS Int. J. Geo-Inf. 2017, 6, 172. [Google Scholar] [CrossRef] [Green Version]
- Shibasaki, T.; Matsuura, S.; Okamoto, T. Experimental evidence for shallow, slow-moving landslides activated by a decrease in ground temperature. Geophys. Res. Lett. 2016, 43, 6975–6984. [Google Scholar] [CrossRef]
- Zhang, Y.; Zhang, B.; Xu, Q.; Gao, D.; Xu, W.; Ren, R.; Jiang, J.; Wang, S. The Effects of Plant and Soil Characteristics on Partitioning Different Rainfalls to Soil in a Subtropical Chinese Fir Forest Ecosystem. Forests 2022, 13, 123. [Google Scholar] [CrossRef]
- Gonzalez-Ollauri, A.; Mickovski, S.B. Hydrological effect of vegetation against rainfall-induced landslides. J. Hydrol. 2017, 549, 374–387. [Google Scholar] [CrossRef] [Green Version]
- Promper, C.; Puissant, A.; Malet, J.-P.; Glade, T. Analysis of land cover changes in the past and the future as contribution to landslide risk scenarios. Appl. Geogr. 2014, 53, 11–19. [Google Scholar] [CrossRef]


| Predicted Values | Actual Values | |
|---|---|---|
| Positive | Negative | |
| Positive | True Positive (TP) | False Positive (FP) |
| Negative | False Negative (FN) | True Negative (TN) |
| Feature ID | Feature Name | # of Classes | Class Name |
| (a) | |||
| 1 | lithology | 37 | 1. ; 2. ; 3. ; 4. Ss; 5. ; 6. ; 7. ; 8. ; 9. ; 10. ; 11. ; 12. ; 13. ; 14. ; 15. ; 16. ; 17. ; 18. ; 19. ; 20. ; 21. ; 22. ; 23. ; 24. ; 25. ; 26. ; 27. ; 28. ; 29. ; 30. ; 31. ; 32. ; 33. ; 34. ; 35. ; 36. ; 37. |
| 2 | landuse | 15 | 1. Paddy filed; 2. Dry land; 3. Forestland; 4. Shrub land; 5. Sparse woods; 6. Other woods; 7. Grassland with high coverage; 8. Grassland with medium coverage; 9. Grassland with low coverage; 10. Cannel; 11. Reservoir; 12. Urban land use; 13. Rural settlements; 14. Other types of building; 15. Marshland |
| (b) | |||
| Feature ID | Feature Name | Value Range | |
| 3 | Slope (°) | 0–67.0356 | |
| 4 | Average Annual Temperature (°C) | 10.2–18.5 | |
| 5 | Average Annual Rainfall (mm) | 1123.7–1264.8 | |
| 6 | Aridity | 0.698–0.952 | |
| 7 | IM | 14.5–53.47 | |
| 8 | Population | 88.8744–695.201 | |
| 9 | HAILS | 0–78.2 | |
| 10 | NDVI | −0.1372–0.8837 | |
| 11 | Distance from Syncline Axis (m) | 0–19,026.1 | |
| 12 | Distance from Anticline Axis (m) | 0–16,958.8 | |
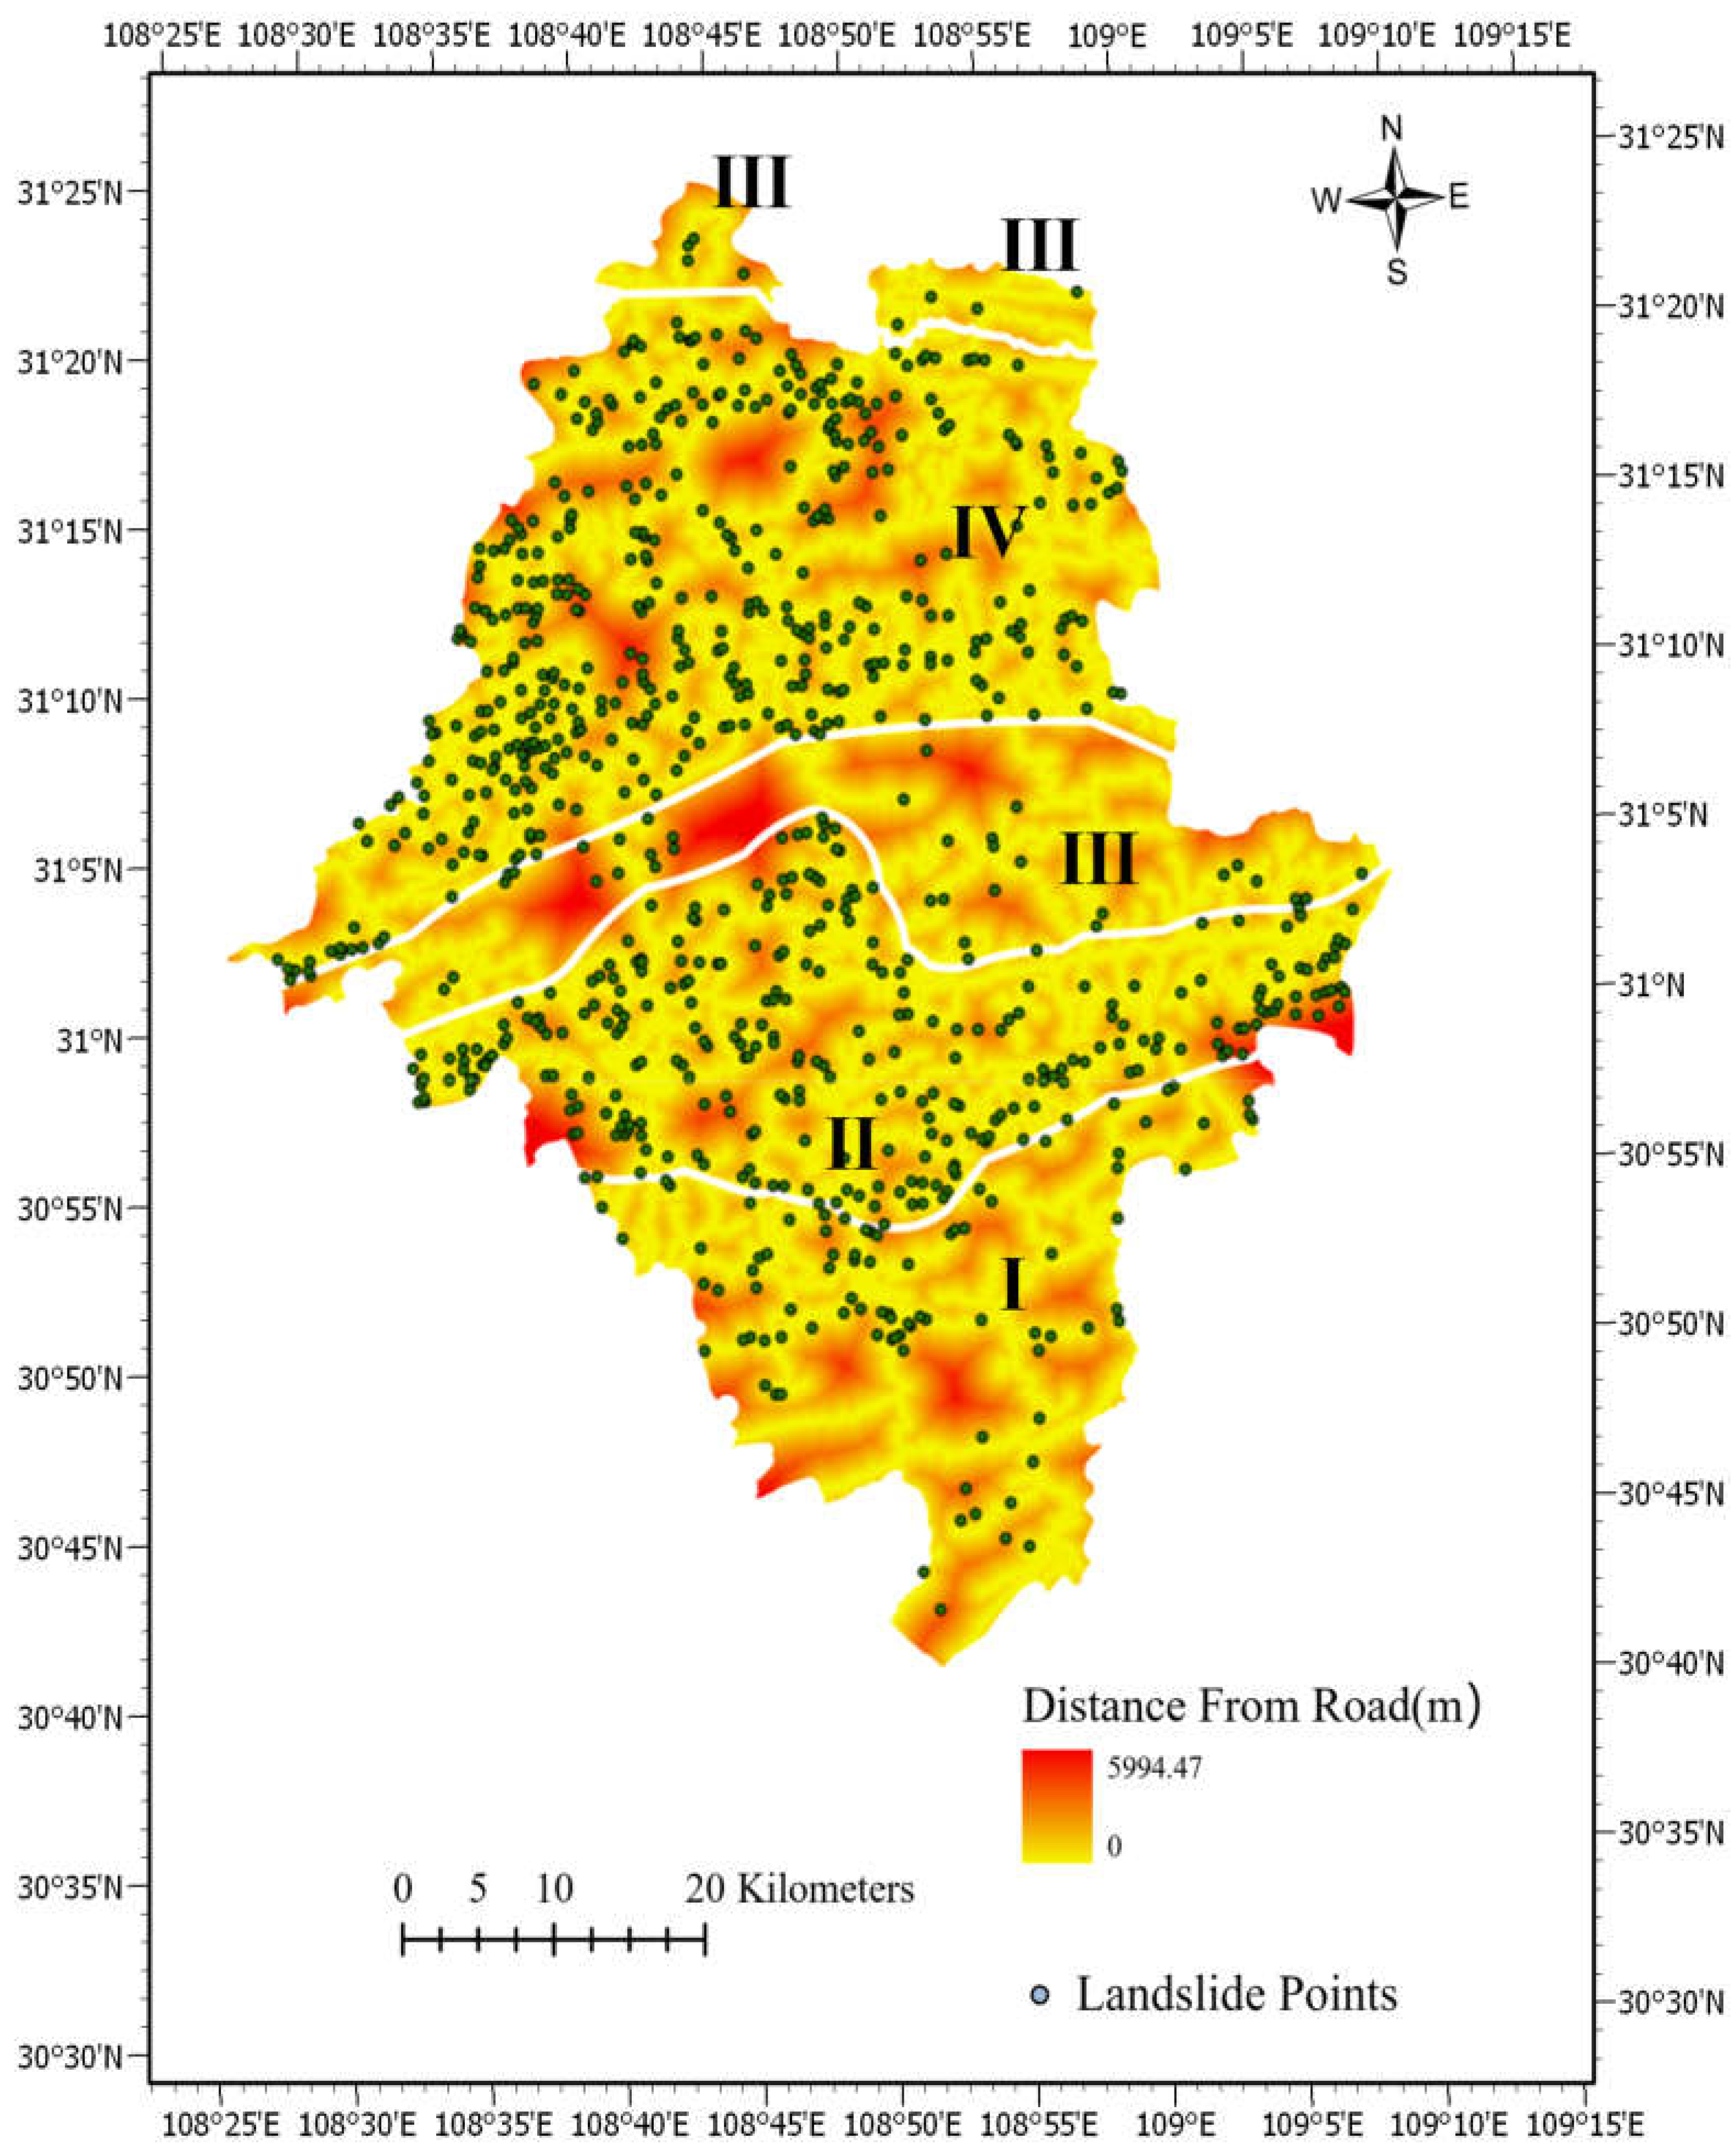
| 13 | Distance from Road (m) | 0–5994.47 | |
| 14 | Distance from Rivers (m) | 0–17,236.8 | |
| 15 | Elevation (m) | 76.0774–1794.29 | |
| 16 | Profile Curvature | 0–44.2457 | |
| 17 | Aspect (°) | 0–360 | |
| 18 | Plane Curvature | 0–360 | |
| 19 | TWI | −0.82–30.1 | |
| 20 | Relief Amplitude | 0–148.865 | |
| Sub-Zone | # of Possitive Samples | # of Negative Samples | Total | Percentage of Trainning Set | # of Training Samples |
|---|---|---|---|---|---|
| I | 89 | 89 | 178 | 80% | 142 |
| II | 286 | 286 | 572 | 80% | 457 |
| III | 44 | 44 | 88 | 80% | 70 |
| IV | 408 | 408 | 816 | 80% | 652 |
| Whole Region | 827 | 827 | 1654 | 80% | 1323 |
| Model | Number of Estimators | Maximum Depth of a Tree |
|---|---|---|
| Parent Model | 175 | 21 |
| Sub-Model One | 10 | 6 |
| Sub-Model Two | 95 | 12 |
| Sub-Model Three | 10 | 4 |
| Sub-Model Four | 100 | 12 |
| Model | Landslides Susceptibility Level | Landslides Susceptibility Threshold | Landslides Ratio | Area Ratio | Landslides/Area Ratio |
|---|---|---|---|---|---|
| Parent Model | Very Low | 0.000–0.239 | 0.24% | 14.60% | 0.016 |
| Low | 0.239–0.408 | 2.18% | 22.80% | 0.096 | |
| Moderate | 0.408–0.573 | 6.05% | 25.23% | 0.248 | |
| High | 0.573–0.741 | 19.22% | 21.47% | 0.895 | |
| Very High | 0.741–1.000 | 72.31% | 15.90% | 4.548 | |
| Sub-Models | Very Low | - | 0.12% | 16.42% | 0.007 |
| Low | - | 1.21% | 20.81% | 0.058 | |
| Moderate | - | 4.48% | 22.56% | 0.199 | |
| High | - | 18.55% | 21.54% | 0.861 | |
| Very High | - | 75.64% | 18.67% | 4.051 | |
| Sub-Model One | Very Low | 0.000–0.235 | 0.00% | 20.22% | 0.000 |
| Low | 0.235–0.435 | 0.00% | 23.88% | 0.000 | |
| Moderate | 0.435–0.631 | 8.99% | 22.36% | 0.402 | |
| High | 0.631–0.831 | 25.84% | 18.64% | 1.386 | |
| Very High | 0.831–1.000 | 65.17% | 14.90% | 4.374 | |
| Sub-Model Two | Very Low | 0.000–0.278 | 0.35% | 15.14% | 0.023 |
| Low | 0.278–0.435 | 2..46% | 22.03% | 0.112 | |
| Moderate | 0.435–0.588 | 4.56% | 24.99% | 0.182 | |
| High | 0.588–0.749 | 13.33% | 22.45% | 0.594 | |
| Very High | 0.749–1.000 | 79.30% | 15.39% | 5.153 | |
| Sub-Model Three | Very Low | 0.000–0.303 | 0.00% | 13.68% | 0.000 |
| Low | 0.303–0.421 | 0.00% | 24.81% | 0.000 | |
| Moderate | 0.421–0.536 | 9.10% | 25.78% | 0.353 | |
| High | 0.536–0.662 | 31.81% | 22.06% | 1.442 | |
| Very High | 0.662–1.000 | 59.09% | 13.67% | 4.323 | |
| Sub-Model Four | Very Low | 0.000–0.227 | 0.00% | 16.59% | 0.000 |
| Low | 0.227–0.427 | 0.74% | 16.20% | 0.0457 | |
| Moderate | 0.427–0.612 | 2.94% | 19.38% | 0.152 | |
| High | 0.612–0.792 | 19.12% | 22.26% | 0.859 | |
| Very High | 0.792–1.000 | 77.20% | 25.57% | 3.020 |
| Zone | Feature Importance Rank | ||||
|---|---|---|---|---|---|
| 1st | 2nd | 3rd | 4th | 5th | |
| Whole Region | Distance from syncline axis (m) | Aridity | Elevation (m) | Distance from rivers (m) | Average Annual Temperature (°C) |
| Sub-Zone I | Distance from syncline axis (m) | NDVI | Average Annual Rainfall (mm) | Distance from Road (m) | Elevation (m) |
| Sub-Zone II | Elevation (m) | Average Annual Rainfall (mm) | Distance from rivers (m) | Distance from anticline axis (m) | Average Annual Temperature (°C) |
| Sub-Zone III | Distance From Road (m) | HAILS | Elevation (m) | Plane Curvature | Average Annual Temperature (°C) |
| Sub-Zone IV | Distance from syncline axis (m) | Average Annual Temperature (°C) | Elevation (m) | Aridity | Average Annual Rainfall (mm) |
Publisher’s Note: MDPI stays neutral with regard to jurisdictional claims in published maps and institutional affiliations. |
© 2022 by the authors. Licensee MDPI, Basel, Switzerland. This article is an open access article distributed under the terms and conditions of the Creative Commons Attribution (CC BY) license (https://creativecommons.org/licenses/by/4.0/).
Share and Cite
Zhang, W.; Liu, S.; Wang, L.; Samui, P.; Chwała, M.; He, Y. Landslide Susceptibility Research Combining Qualitative Analysis and Quantitative Evaluation: A Case Study of Yunyang County in Chongqing, China. Forests 2022, 13, 1055. https://doi.org/10.3390/f13071055
Zhang W, Liu S, Wang L, Samui P, Chwała M, He Y. Landslide Susceptibility Research Combining Qualitative Analysis and Quantitative Evaluation: A Case Study of Yunyang County in Chongqing, China. Forests. 2022; 13(7):1055. https://doi.org/10.3390/f13071055
Chicago/Turabian StyleZhang, Wengang, Songlin Liu, Luqi Wang, Pijush Samui, Marcin Chwała, and Yuwei He. 2022. "Landslide Susceptibility Research Combining Qualitative Analysis and Quantitative Evaluation: A Case Study of Yunyang County in Chongqing, China" Forests 13, no. 7: 1055. https://doi.org/10.3390/f13071055
APA StyleZhang, W., Liu, S., Wang, L., Samui, P., Chwała, M., & He, Y. (2022). Landslide Susceptibility Research Combining Qualitative Analysis and Quantitative Evaluation: A Case Study of Yunyang County in Chongqing, China. Forests, 13(7), 1055. https://doi.org/10.3390/f13071055