Article

Unraveling Visiting-Activity Patterns of Heterogeneous Communities for Urban-Park Planning and Design

Department of Social Sciences, Education University of Hong Kong, Lo Ping Road, Tai Po, Hong Kong, China
*
Author to whom correspondence should be addressed.
Forests 2022, 13(6), 841; https://doi.org/10.3390/f13060841
Submission received: 23 March 2022 / Revised: 21 May 2022 / Accepted: 25 May 2022 / Published: 28 May 2022
(This article belongs to the Section Urban Forestry)

Abstract

:
Urban parks provide essential outdoor recreation space, especially for high-density cities. This study evaluated the park-visiting activity profiles of residents to inform the planning and design of community-relevant parks. The visiting and activity patterns of 465 Hong Kong adult residents were collected using a structured questionnaire. The correlations of visiting and activity patterns of the different socio-demographic groups were analyzed. Varying features of visiting and activity patterns were observed for different socio-demographic groups. Older patrons visited parks intensively for nature-enjoyment activities and had shorter travel if intended for social and physical-exercise activities. The middle-aged respondents with children mainly conducted family based recreation, visited parks more frequently, and traveled farther. The young adults reported lower patronage, but the visit frequency increased with the engagement level in outdoor and physical-exercise activities. The homemakers reported a high visit frequency and enthusiastic participation in social activities. They tended to visit more frequently and stay longer in parks for physical-exercise activities. Our study revealed the urban parks’ divergent patronage behavior and unique roles to disparate user groups. They furnished evidence to apply continually precision park planning, design, and promotion to achieve socially responsive and age-friendly parks.

1. Introduction

Urban parks contribute substantially to the sustainability and vitality of a city by virtue of multiple, diverse, and surpassing benefits. They are typically public open spaces with natural or cultivated vegetation, making them integral and essential components of the urban forest, and serving as public amenity venues in the urban environment [1]. They perform concurrently as recreational [2], environmental [3], ecological [4], and cultural [5] resources. Among the multi-dimensional roles, the foremost, if not predominant, is providing space and opportunities for outdoor recreation. It was observed in a current study that the citizens placed a higher demand on recreational services in green space, particularly park landscape, than that of non-green space [6].
In urban parks, people can establish contact with inherited, modified, or created nature, perform various passive and active activities, gather with friends or family, and meet new friends. Such nature-, physical-, and social-based recreation pursuits in a semi-natural environment can satisfy the tangible and intangible body and mind, and solitary and gregarious needs of park users, promoting their physical and psychological health and wellbeing (e.g., [7,8,9]). Undoubtedly, urban parks can furnish ideal and strategic venues to improve citizens’ quality of life in the spatially and emotionally stressful urban environment.
The design and management of urban parks have a bearing on the composition and activities of the clientele. Understanding and satisfying people’s expectations of parks can foster patronage and activity levels by creating socially responsive public spaces [10]. Hegetschweiler et al. [11] have provided a review on the studies evaluating the effects of demand factors (e.g., socio-demographic background and users’ preference) and supply factors (e.g., physical attributes of sites) on the usage of the urban green infrastructure, including urban parks. The results of various studies discern that a park design failing to cater to user groups’ heterogeneous expectations and needs can reduce the recreational services to the community.
Many studies had explored park patronage characteristics, including visiting and activity patterns and significant variations vis-a-vis socio-demographic characteristics, including race, gender, age, education, and occupation, were evaluated (e.g., [1,12,13,14]). Yet, most studies evaluating activity patterns were conducted in western countries, including a continent-wide comparative survey in Europe [15]. Shan’s studies [16,17] in Chinese cities represented some exceptions. In addition, the age-factor influence on the interactions between socio-demographic characteristics and park usage patterns was rarely studied. Schipperijn et al. [18] and Sang et al. [19] presented two exceptions, which compared the gender effects of different age cohorts. Moreover, the interactions between visiting patterns and activity types in urban parks were barely touched. For instance, Arnberger [20] observed that visitor groups showed different temporal use patterns in urban forests. An improved understanding of the relationship between activity types and visiting patterns could add a helpful dimension to park planning and management.
Using Hong Kong as a case study, we aimed to fill the above knowledge gap by assessing thoroughly the urban park users’ visiting-activity profile. Several studies in Hong Kong investigated visitor activities and behaviors in urban parks [21,22,23], including a specific focus on the elderly group [24] and physical activities [25]. Yet, the activity pattern aspect did not receive sufficient treatment. Our study explored the association of socio-demographic factors with self-reported visiting patterns, including visiting frequency, stay duration and travel time to parks, and activity patterns vis-a-vis an eclectic activity list. The impacts of socio-demographic characteristics on visiting-activity patterns were evaluated by three age groups. Further, we investigated the potential linkages between activity types and visiting patterns. The findings could yield valuable insights to improve park planning and design to meet user needs and changing demographics, especially in the Asian context.

2. Materials and Methods
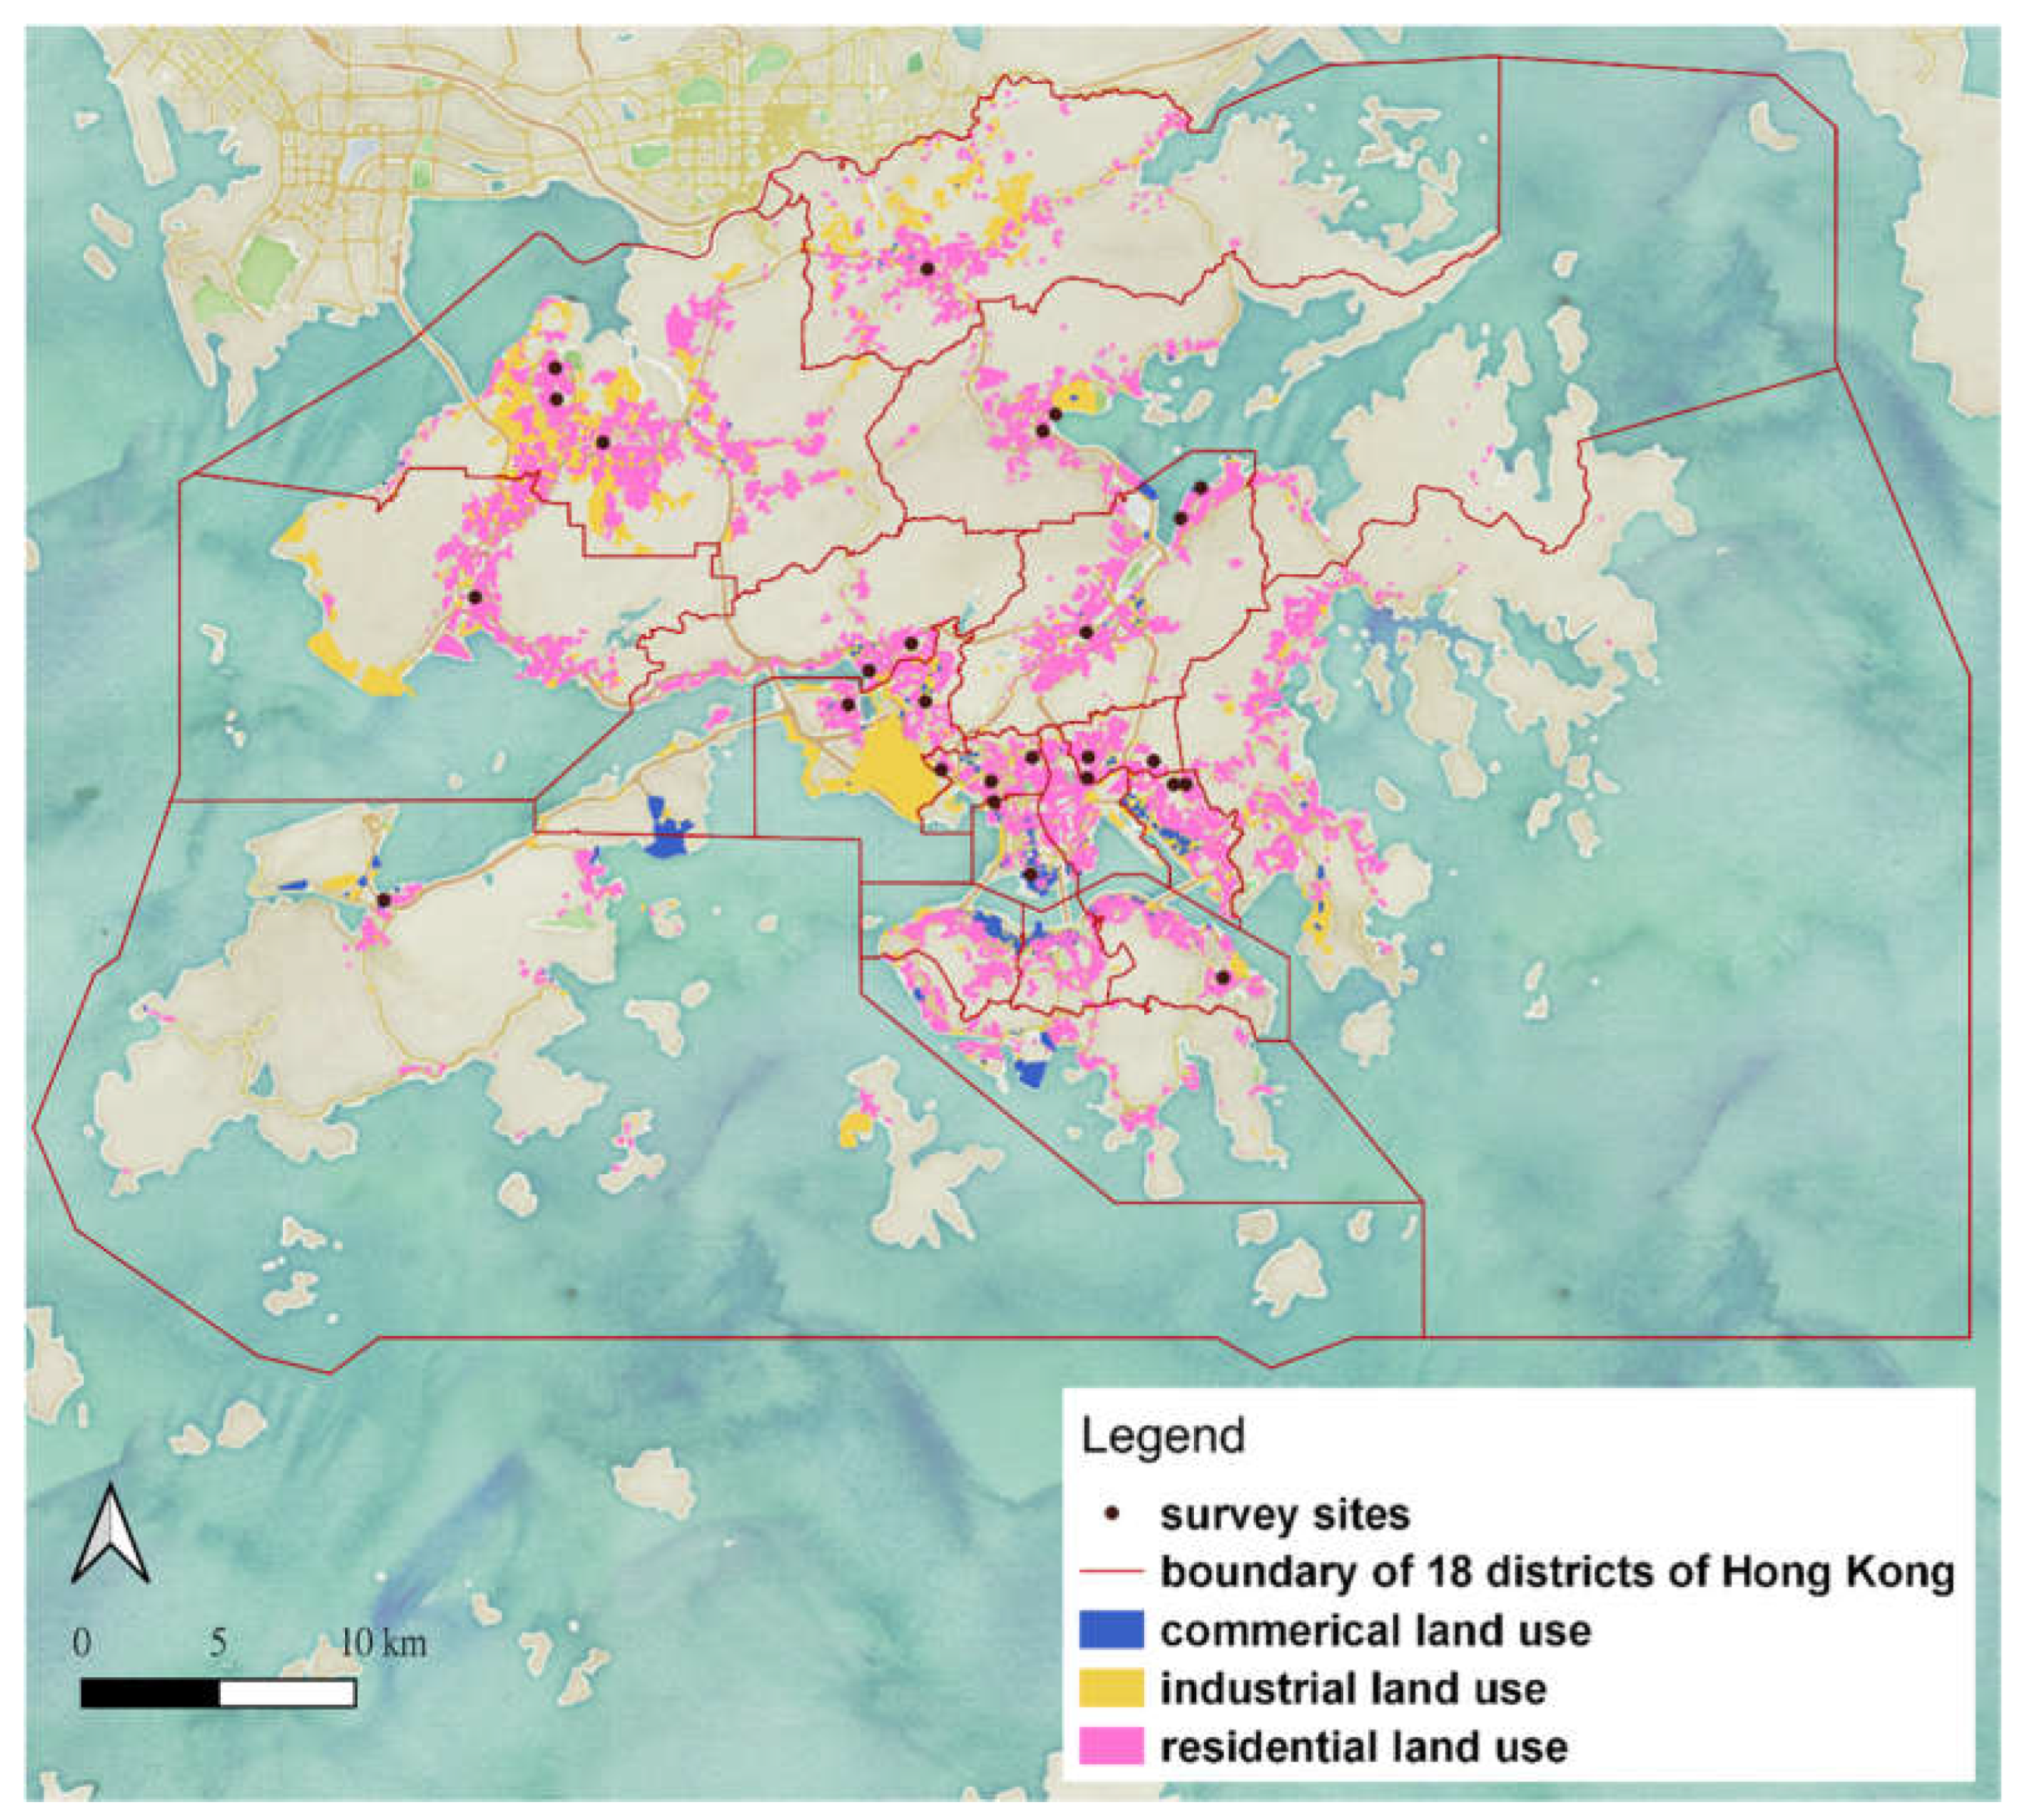
2.1. Study Area

Located on the south coast of China, Hong Kong (22°17′ N, 114°09′ E) has a subtropical climate with a hot-humid summer and cool-dry winter. With a land area of 1106 km2 and a population of 7.5 million (Census and Statistics Department, 2021), it has one of the highest urban population densities in the world (average > 7000 persons/km2).
Hong Kong has 1500 public parks and gardens managed by the government’s Leisure and Cultural Services Department (LSCD), contributing to more than half of the urban open space stock [26]. We surveyed 26 urban parks with an area ≥ 1 hectare, distributed in 14 of the 18 districts and lying in residential areas (Figure 1). The selected parks are situated at the top of the park hierarchy in Hong Kong, being mainly district parks serving the whole district. We did not include the small neighborhood or local parks in our study. The sampling approach aimed at acquiring representative public views by surveying the population dwelling in different parts of Hong Kong with varied socio-demographic profiles. These venues provide diverse active recreational facilities, such as children’s playgrounds, sports fields and courts, swimming pools, jogging tracks, and passive grounds such as lawns, theme gardens, and water features.
In Hong Kong, urban parks are regarded as passive open spaces, which are landscaped recreation open space for people to leisurely enjoy themselves in relatively open and natural surroundings. Typically, soft landscaping should contribute to 70% of the land, with 60% of that part of land for planting trees [27]. There is a quantitative planning guideline that there should be at least 2 m2 open space provision for each person on average. The provision of parks was largely based on this standard. Furthermore, other factors are considered, such as the views of local district councils, changes in population distribution, demographic shifts, changing community needs, utilization rates of existing facilities, and resources availability [26]. There is a general lack of a resident-participatory approach in park development of Hong Kong [28].

2.2. Questionnaire Survey and Data Collection

A dedicated questionnaire was designed and pilot-tested to satisfy the data needs of the research questions. Data were gleaned on the respondents’ visiting patterns, activity patterns, and key socio-demographic information. For visiting patterns, we sought their visit frequency, stay duration, and travel time to reach the park. For activity patterns, we asked their frequency of conducting a particular activity (engagement level) by choosing from five options: “Not suitable”, “None”, “Seldom”, “Occasional”, and “Frequent”. The 30 activities presented to respondents were classified into four groups, namely 12 “enjoying natural ambiance”, 8 “personal passive and passive activities”, 5 “personal active activities”, and 5 “social or group activities”.
A professional research center associated with a university with rich experience conducting social and economic surveys was contracted to implement the surveys. They were executed on weekdays and weekends, from 12:00 to 22:00 h in May and June. The pedestrians walking along the footpaths around and near the chosen parks were our potential respondents. They were selected for the questionnaire survey by the intercept method. The pedestrian located closest to the research assistant was invited to participate. Upon completing one interview, the next respondent was identified similarly by the proximity rule-of-thumb. The interviewers approached 810 people in the parks, and the response rate was 59.9%. A total of 485 questionnaires were completed. The sampling approach was designed to evaluate citizens’ overall park activity and visit patterns in Hong Kong. Therefore, the results did not allow deriving any conclusions on individual parks. Twenty questionnaires were discarded because of unsuitable survey locations or with >5% missing answers, yielding 465 valid questionnaires for data analysis.

2.3. Data Analysis

Data analyses were performed using R (version 4.0.3) and IBM SPSS Statistics 26. The ordinal categories were encoded into numerical values to facilitate quantitative analysis. Principal component analysis (PCA) based on polychoric correlations with varimax rotation was conducted for the data of engagement level in 30 activities (ordinal coding: 1 for “Not applicable/None” to 4 for “Frequent”). The extracted components’ factor scores were estimated using psych in R for further analysis. The pairwise Wilcoxon signed rank test with Bonferroni correction and Spearman’s rank correlation coefficient investigated the relationships between visiting patterns, activity patterns, and socio-demographic factors.
To study the specific age effect on activity patterns and socio-demographic characteristics, the respondents were recoded into three fused age groups (18–30, 31–50, and ≥51). The age grouping allowed testing the hypothesis that they have different park-visiting behaviors. The age limits categorized respondents into young adults, middle-aged adults and older adults. Age 30 (e.g., [29,30]) and 50 (e.g., [31,32]) were used as the group bracketing thresholds in some previous studies. The economic occupation was only considered in the overall scenario due to the small sample size of most sub-groups after age division. To facilitate interpreting the relationships between activity patterns and socio-demographic factors, the engagement level was divided into two levels of activity involvement, namely familiar (“Frequent” or “Occasional” responses) versus scarce (“Seldom”, “None” or “Not applicable” responses). The percentage of respondents stating a familiar level of activity involvement was reckoned as the participation rate.

3. Results

3.1. Respondents’ Socio-Demographic Characteristics

The respondents had diverse socio-demographic characteristics (Table 1). The three fused age groups, 18–30 (young age: Y-group), 31–50 (middle age: M-group), and ≥51 (old age: O-group), comprised 28.2%, 34.9%, and 36.9% of total respondents, respectively. For economic occupation, the full-time workers constituted the largest proportion (40.1%), and the retirees the second largest group (22.7%).
The three fused age groups differed notably in socio-demographic profile. The male:female ratio in the Y- and M- groups were similar, but the O-group had a higher ratio (~6:4). Nearly half of the respondents (45.4%) received tertiary education in the overall data, but the proportion of tertiary graduates decreased from 77.7% in Y-group to 14.1% in the O-group. Most respondents were not married (39.7%) or married with children (44.2%). Up to 86.3% of respondents in the Y-group were not married, but the majority of the O-group were married and had children (70.0%). The distribution in M-group was relatively even, with around half of them married and with children, one-fourth not married, and one-fourth married and without children. Less than one-third (28.4%) of the respondents were immigrants in the overall data, but nearly half of the O-group respondents were immigrants versus only 13.0% in the Y-group and 19.1% in the M-group.

3.2. Visiting Patterns

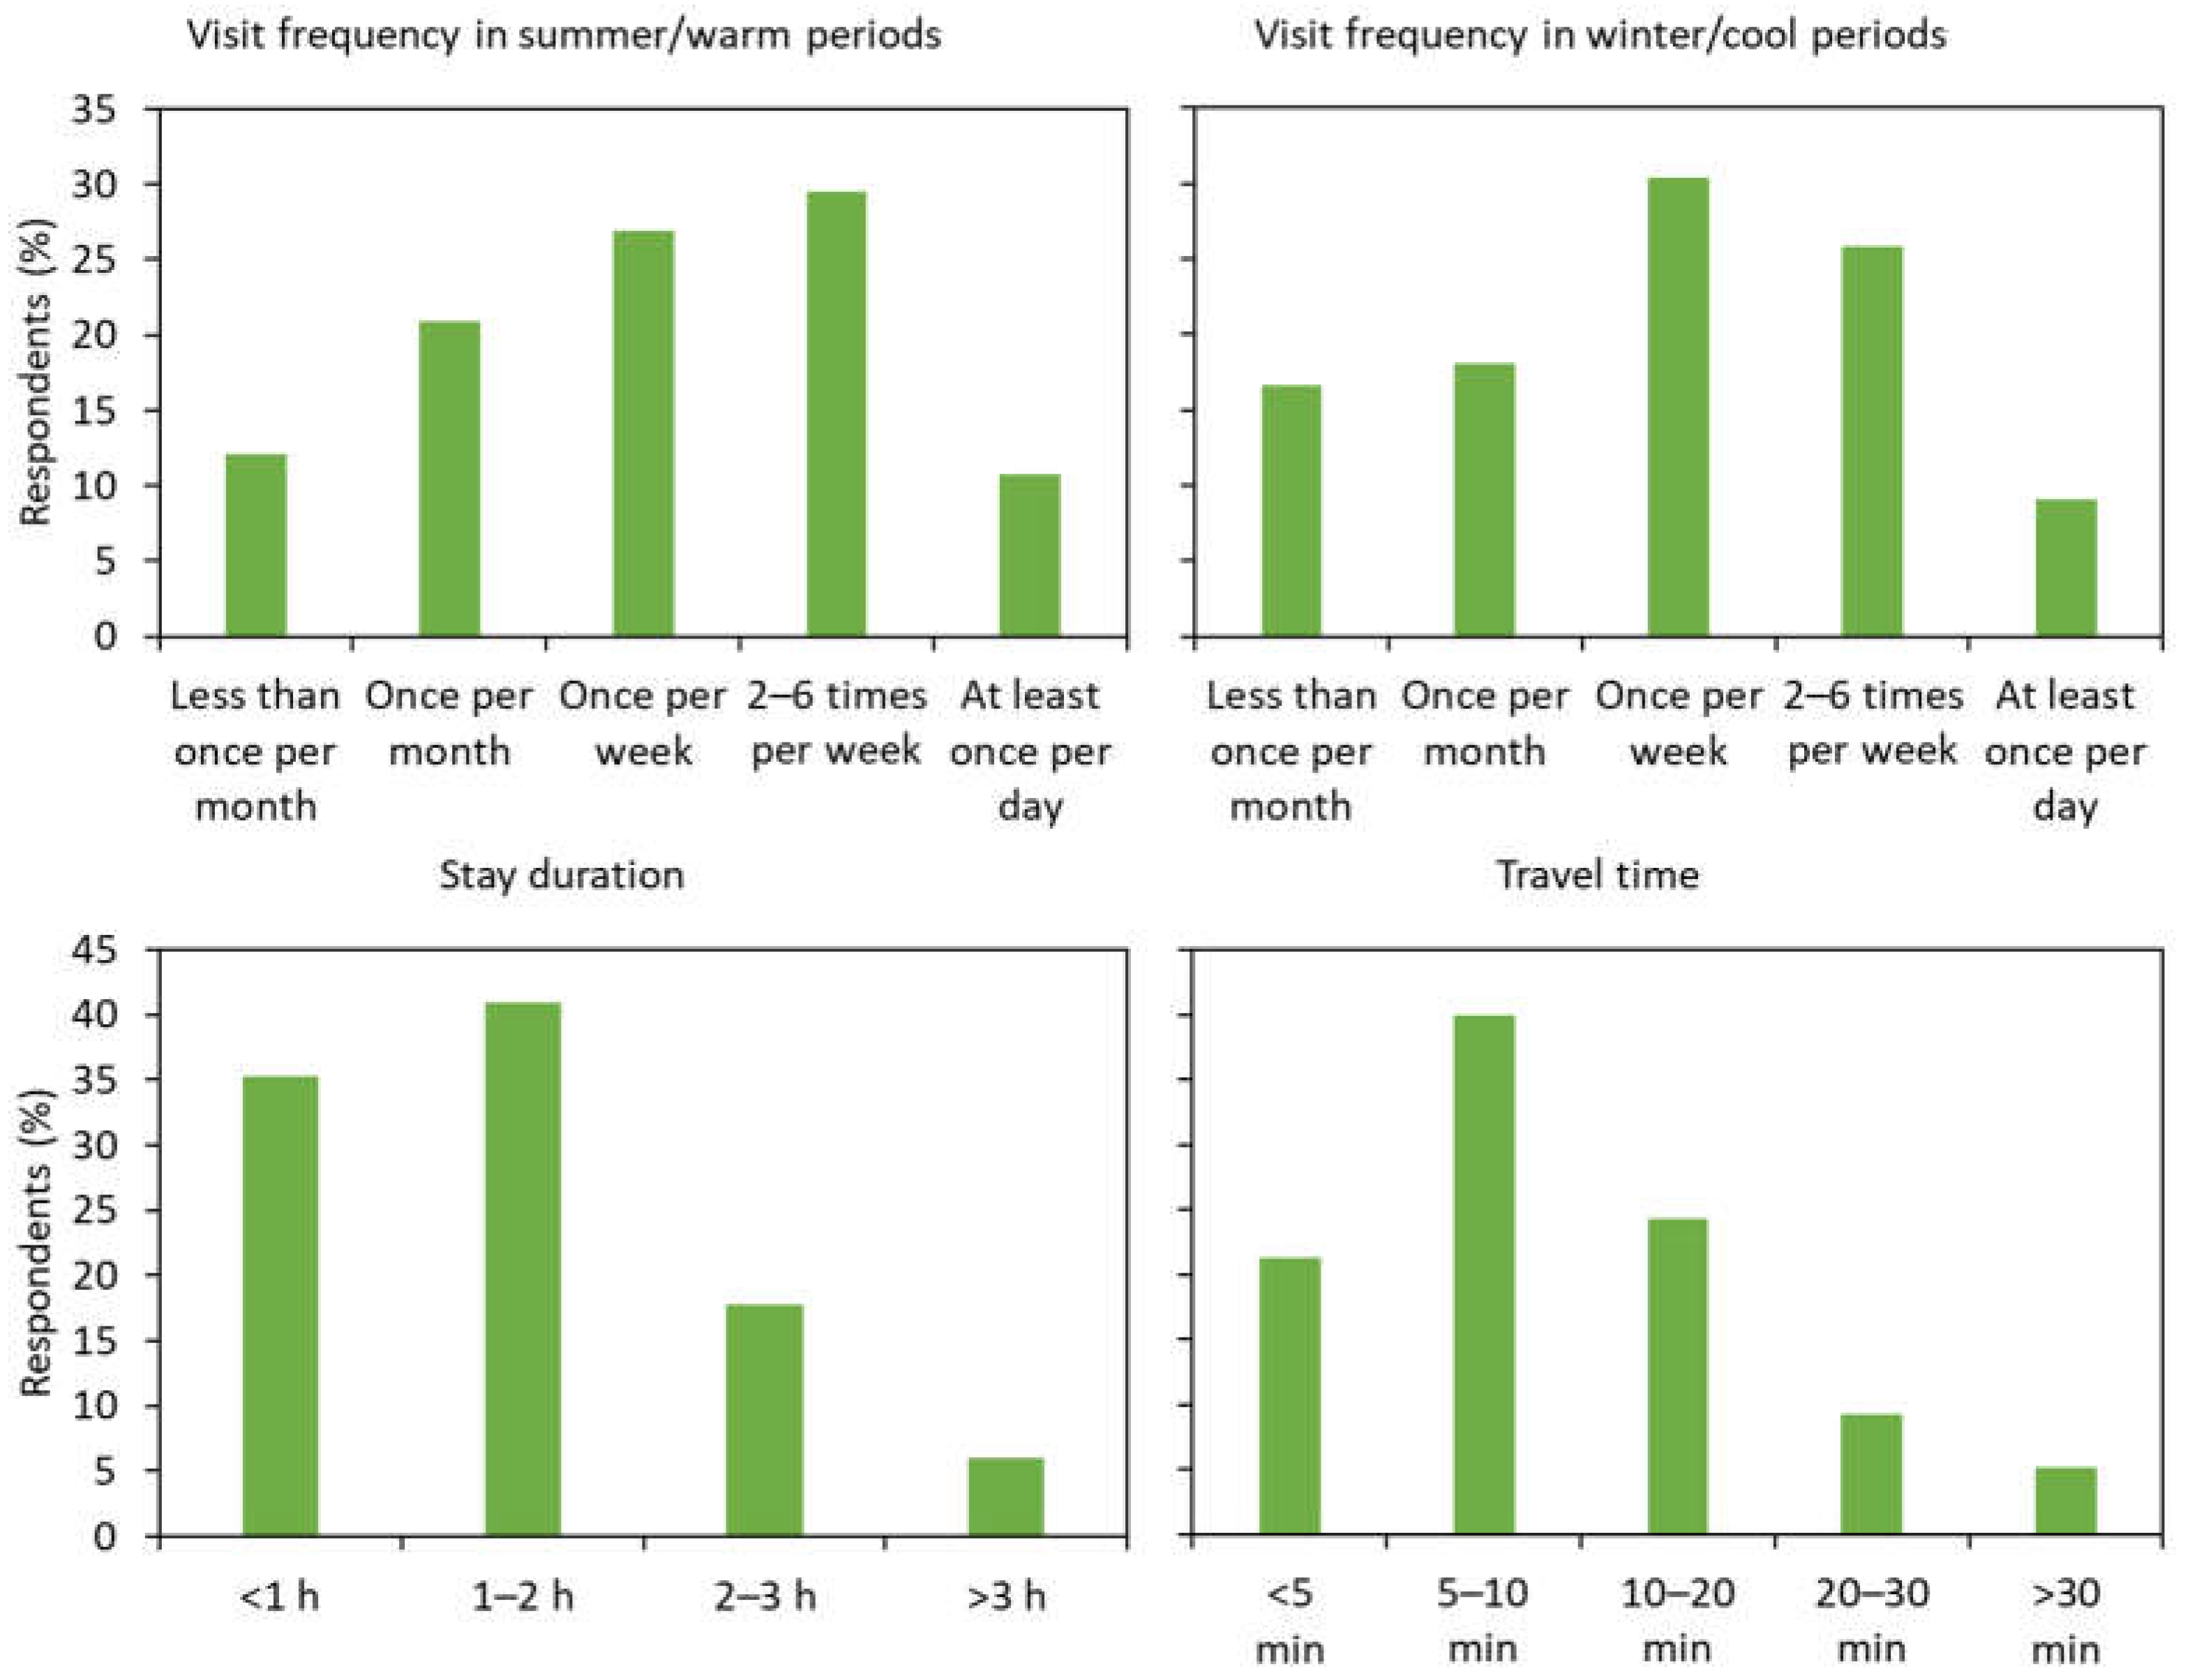
3.2.1. General Visiting Patterns

The park visit frequencies in summer-warm and winter-cool periods were similar (Figure 2). Overall, over 60% of the respondents were frequent visitors (at least once a week). Around one-tenth of the respondents visited the park daily. Most respondents spent less than 1 h (35.3%) or 1–2 h (40.9%) in the park per visit. Over 60% of the respondents took less than 10 min to travel to a park, and only 5.2% of respondents took over half an hour.

3.2.2. Visiting Patterns and Socio-Demographic Factors

Age, economic occupation, gender, education level, and family status were associated with visiting patterns (Table 2). Age was related to all visiting-pattern parameters. The O-group, and similarly the retiree group, reported the highest visit frequency and stay duration, and the Y-group stated the shortest travel time. The homemakers were also frequent visitors, albeit not as frequent as the retirees. They tended to visit parks situated further away from home.
The gender effect on visiting patterns was weak. Less-educated respondents showed a significantly higher visit frequency than the well-educated ones in the O-group only. Visiting patterns were associated with family status in the Y-group, but the M-group had more prominent associations. The M-group respondents with children expressed a higher visit frequency, stay duration, and travel time than their counterparts, notably non-married respondents. In the O-group, no significant relationship existed between visiting patterns and family status. Overall, the immigrants reported a higher visit frequency.

3.3. Activity Patterns

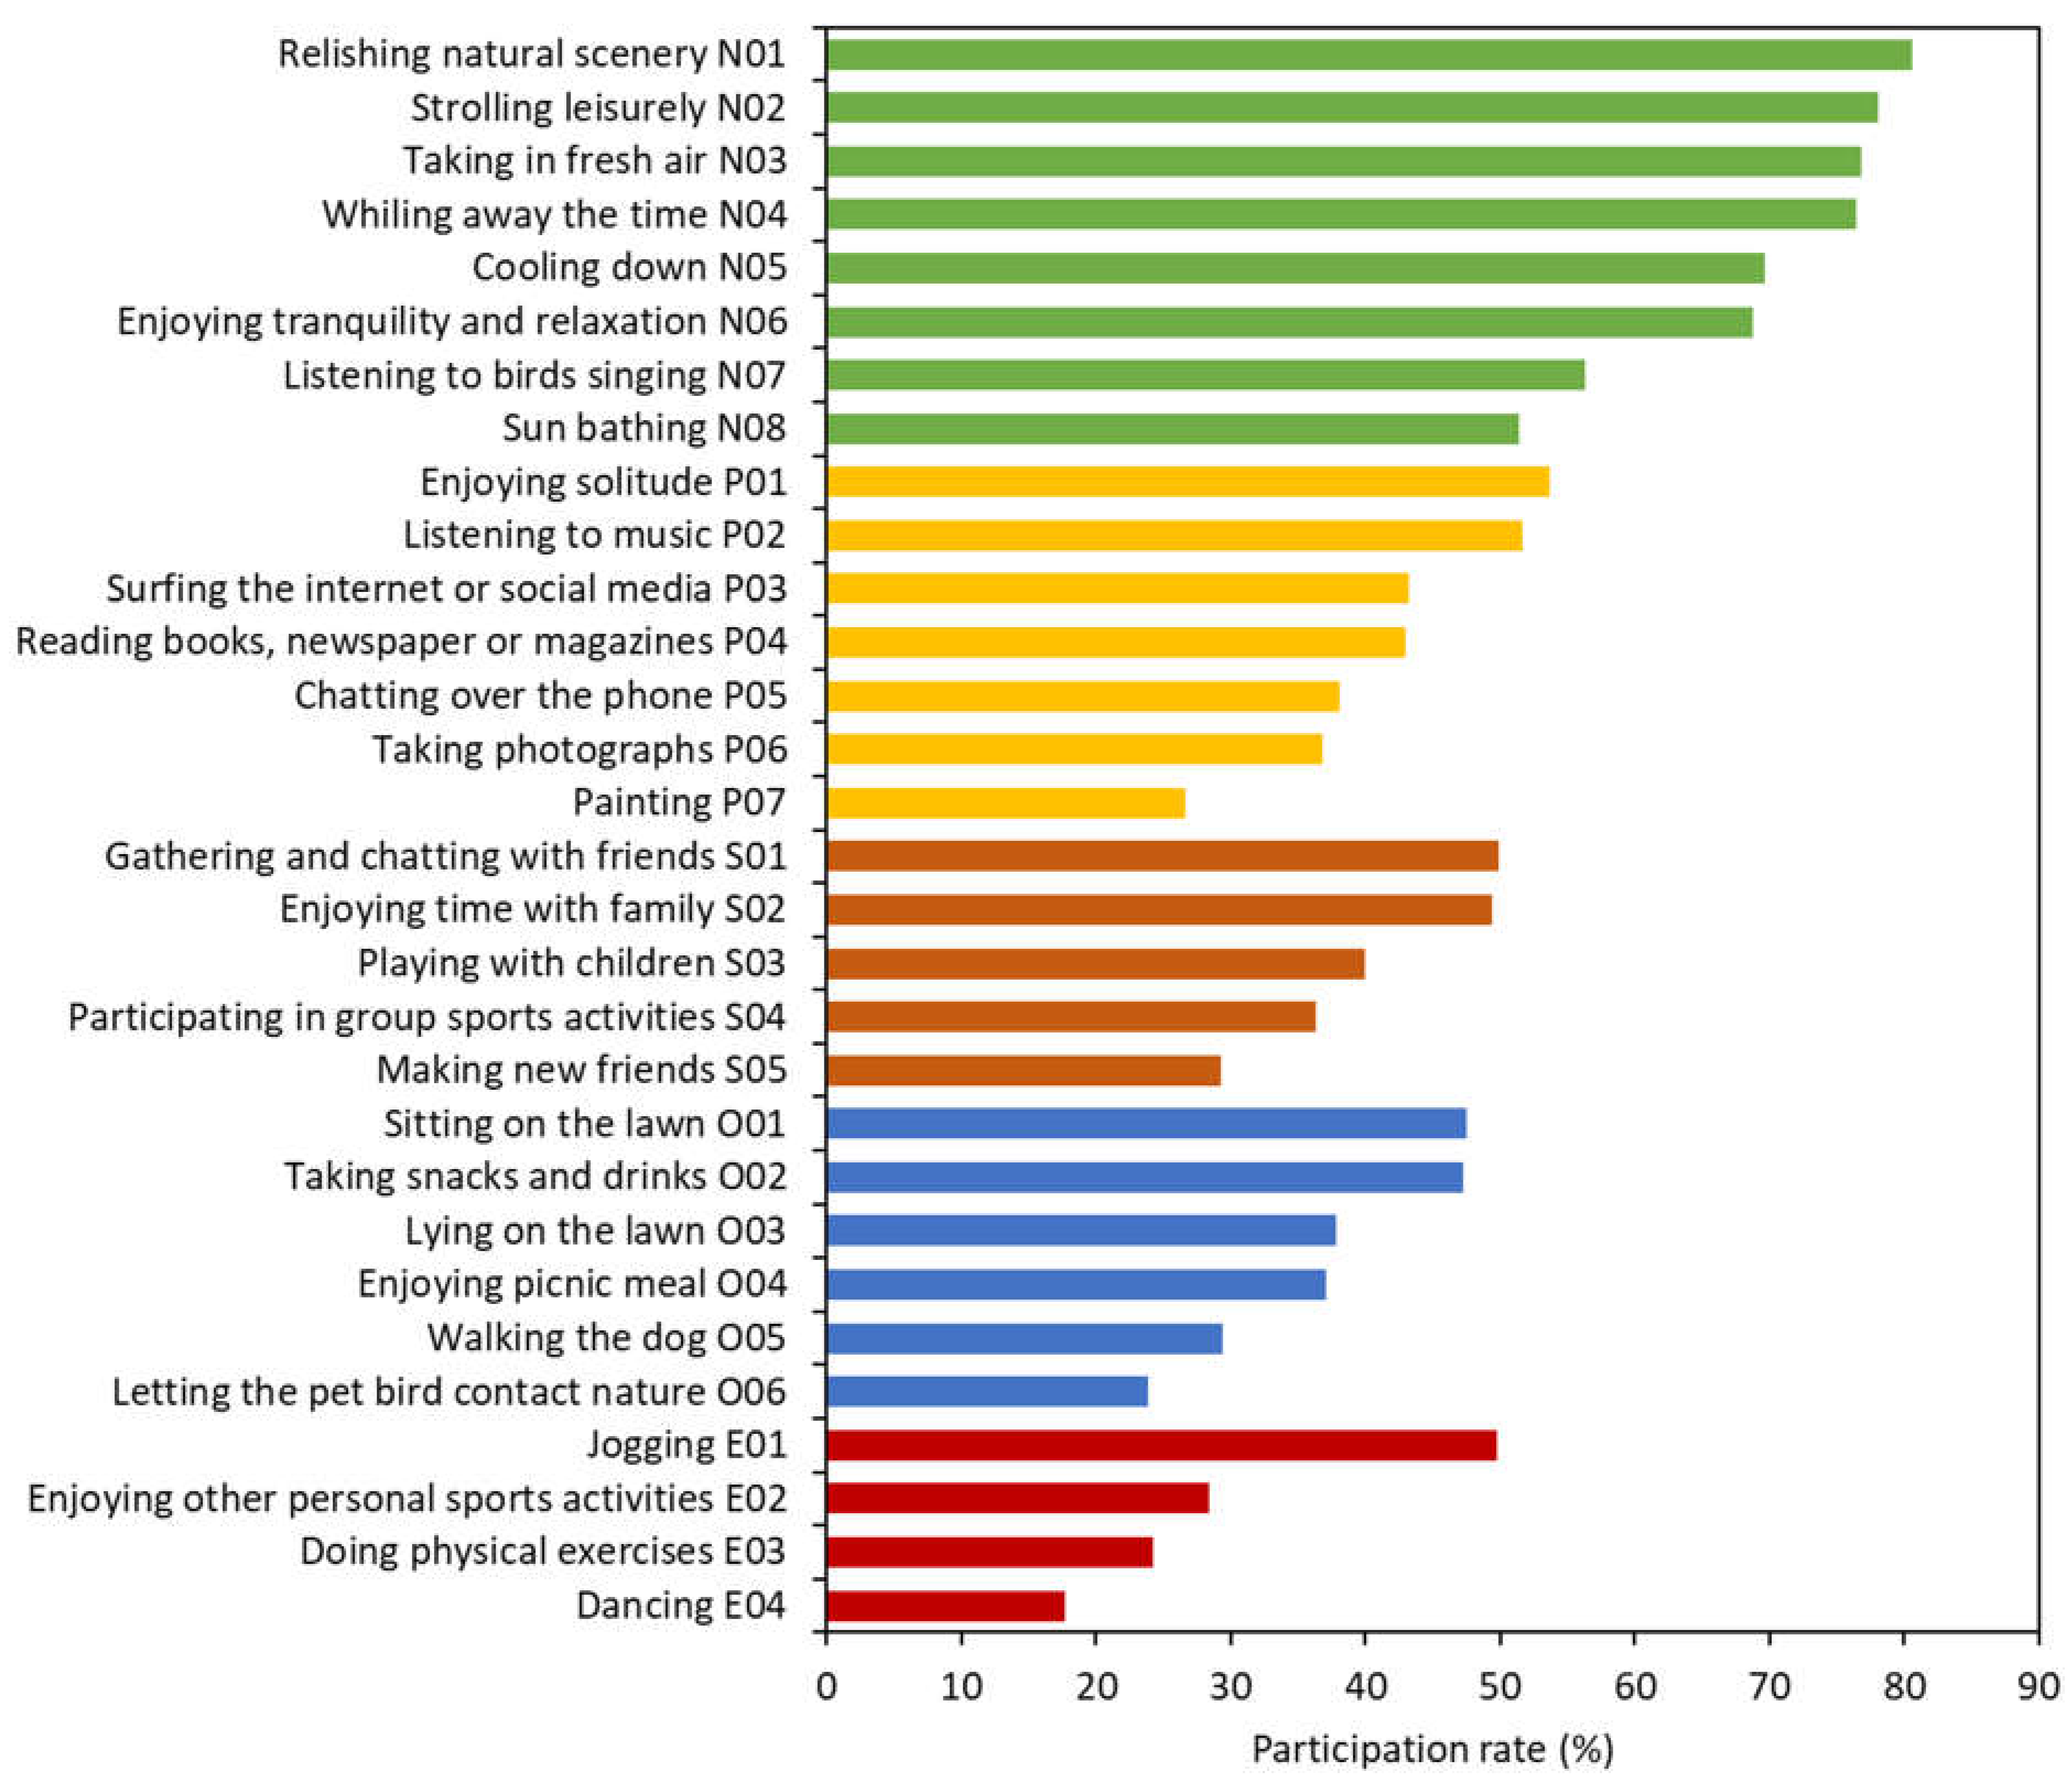
3.3.1. General Activity Patterns

Based on their factor loadings, five components were extracted from the PCA for the engagement level in the 30 activity types (Table 3). According to the nature of the subsumed activity types, the components were labeled as activity clusters by assigning prefixes: N “nature-enjoyment cluster”, P “personal cluster”, O “outdoor cluster”, S “social cluster”, and E “physical-exercise cluster”. Within each activity cluster, the individual activity types were ranked in descending order by participation rate and assigned the trailing two-digit sequential numerals beginning with 01. For example, N01 denotes the first-ranked activity type under the nature-enjoyment cluster.
The “nature-enjoyment cluster” included eight activity types related to the enjoyment of the natural ambiance, such as N01 “relishing natural scenery” and N03 “taking in fresh air”. The “personal cluster” included seven activity types that are personal and passive in nature, such as P02 “listening to music” and P03 “surfing the internet or social media”. The “outdoor cluster” included six activity types related to relishing in the outdoor setting, such as O01 “sitting on the lawn”, O04 “enjoying picnic meal”, and O05 “walking the dog”. The “social cluster” included five activity types involving social interactions between friends or within a family, such as S01 “gathering and chatting with friends” and S03 “playing with children”. The “physical-exercise cluster” included four keeping-fit activity types, such as E01 “jogging” and E03 “doing physical exercises”. Notably, the factor loadings of “jogging” were similar under the principal components representing “personal cluster” (0.51) and “physical-exercise cluster” (0.56).
In descending sequence, the average participation rates of “nature-enjoyment cluster”, “personal cluster”, “social cluster”, “outdoor cluster”, and “physical-exercise cluster” clusters were 69.8%, 41.9%, 41.0%, 37.2%, and 30.0%, respectively. The four activity types with the highest (>75%) participation rates were subsumed under the “nature-enjoyment cluster”. They were N01 “relishing natural scenery”, N02 “strolling leisurely”, N03 “taking in fresh air”, and N04 “whiling away the time” (Figure 3). The least engaged activity types (<30%) included P07 “painting”, O05 “walking the dog”, O06 “letting the pet bird contact nature” (it is a Chinese custom to take pet birds to parks, usually daily, exposing them to the relatively more natural ambiance with greenery), S05 “making new friends”, E02 “enjoying other personal sports activities”, E03 “doing physical exercises”, and E05 “dancing”.

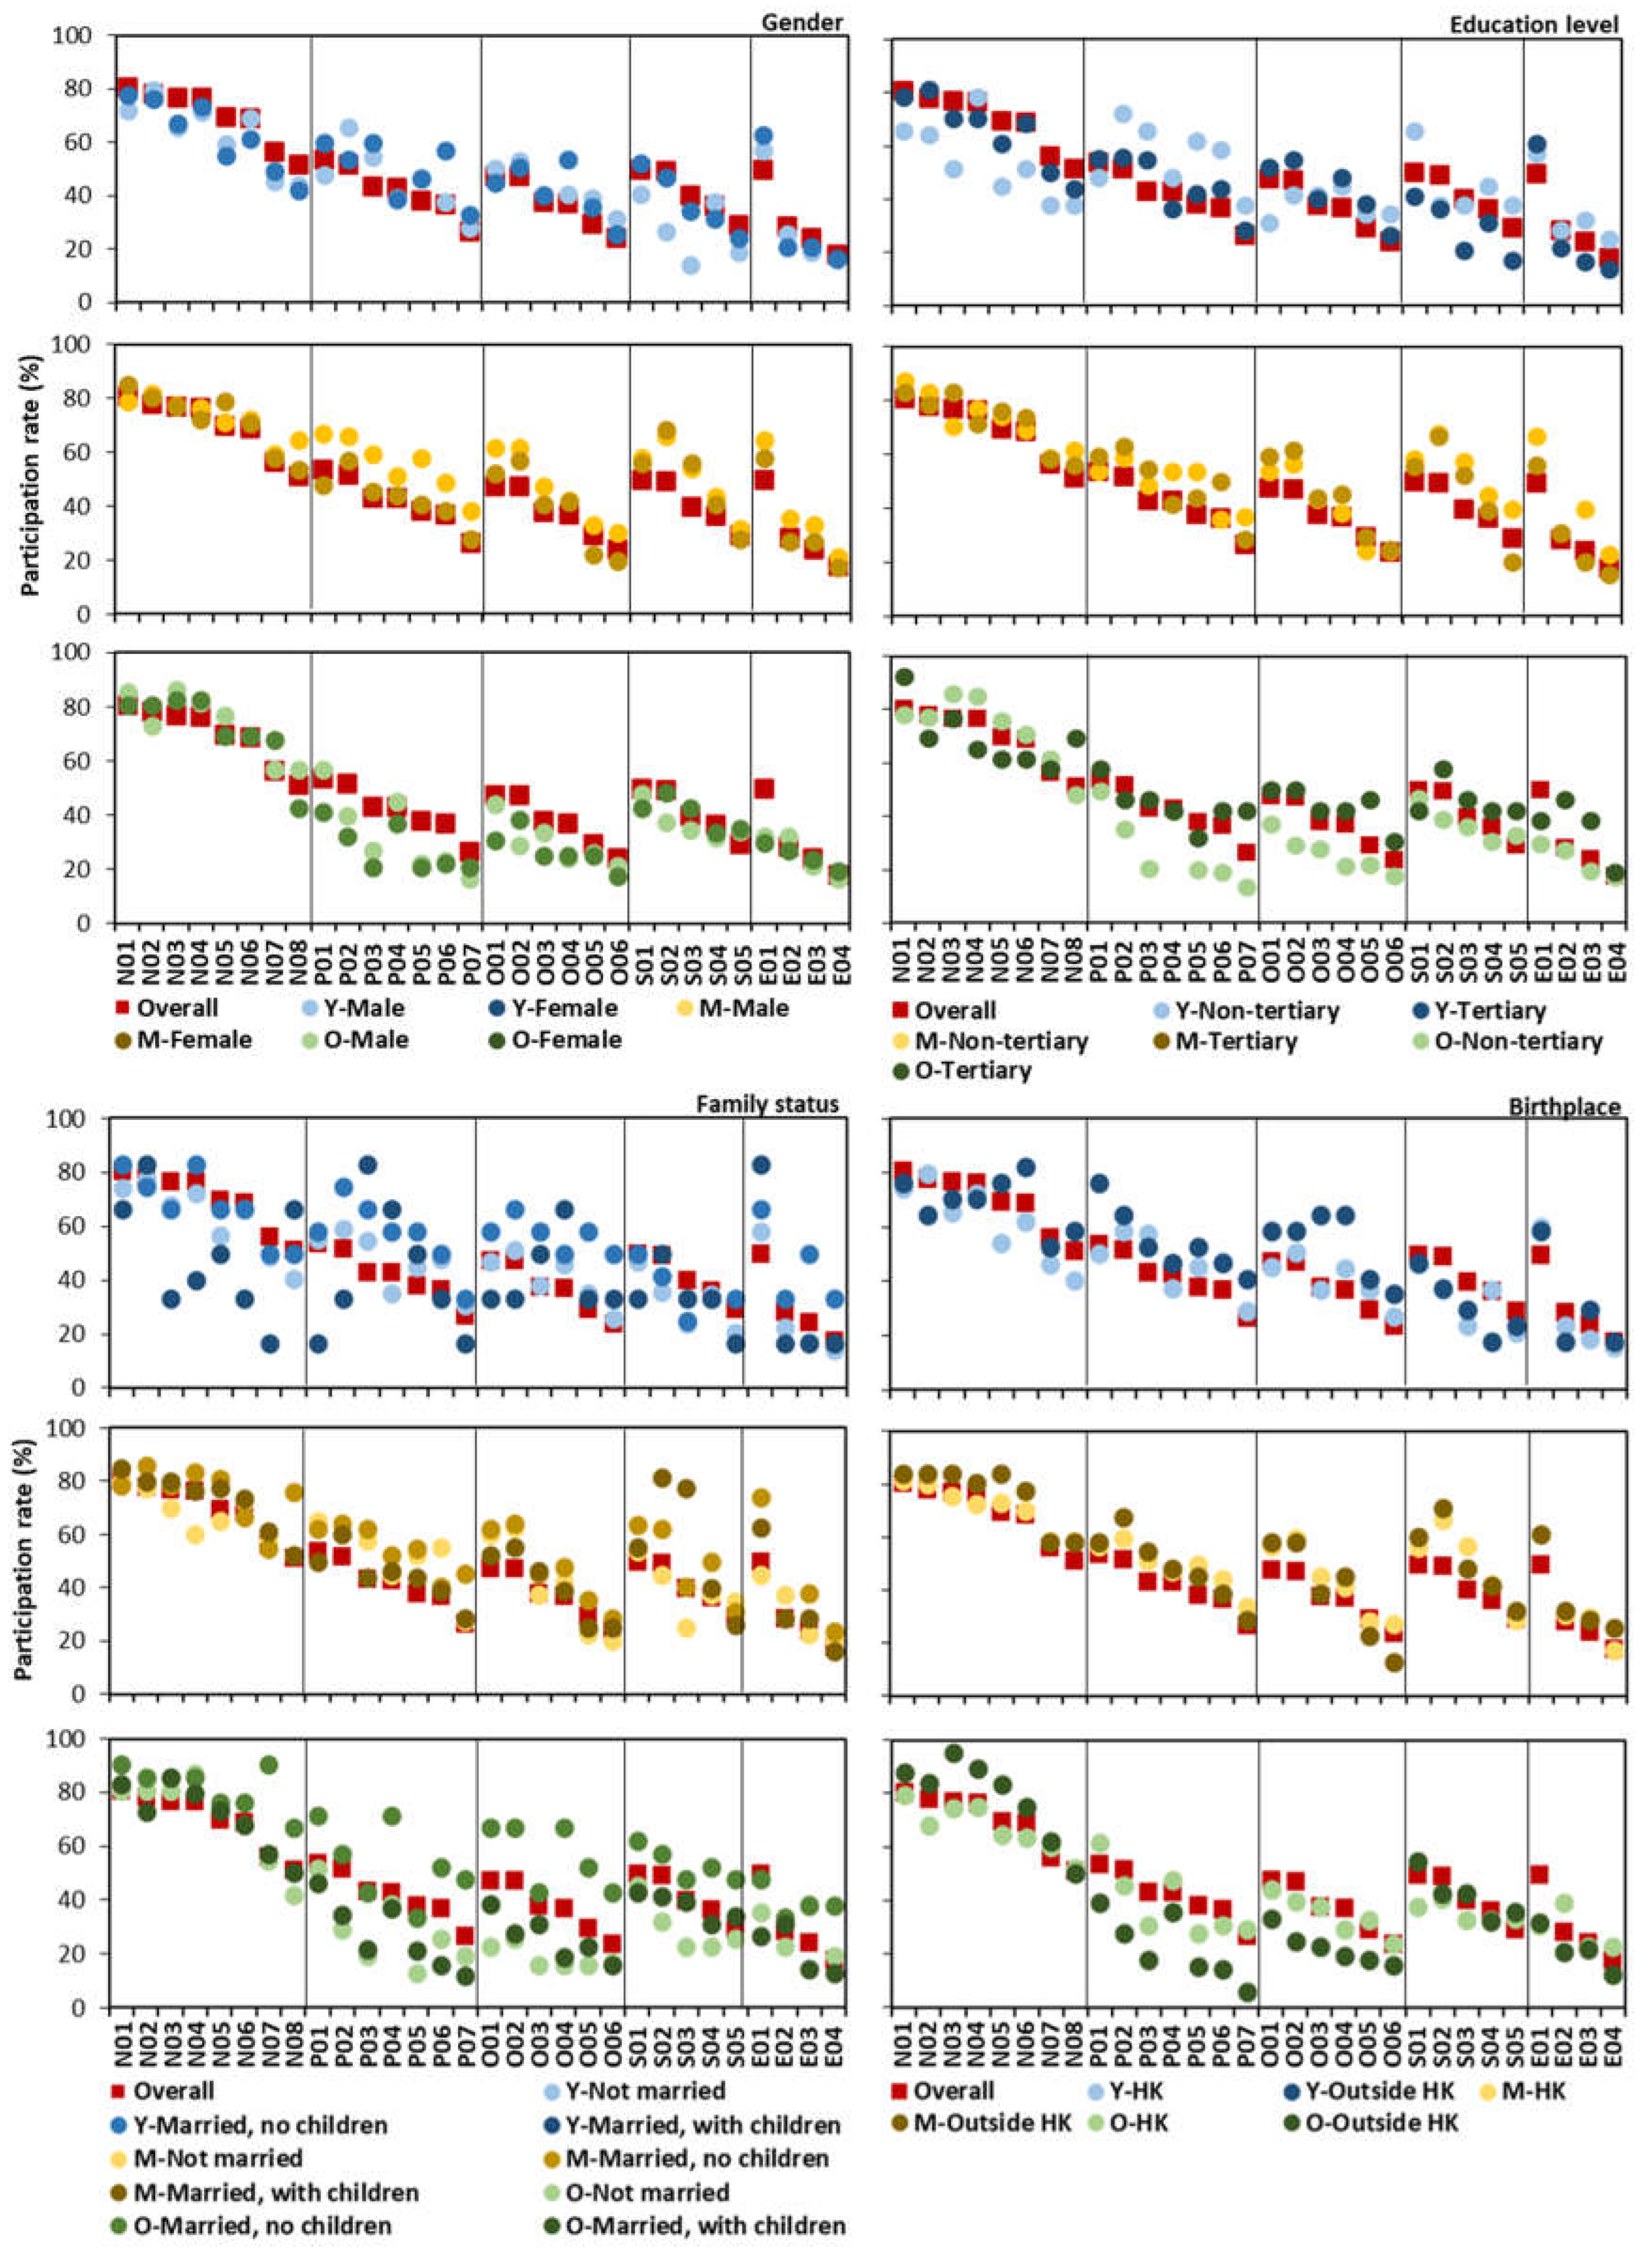
3.3.2. Activity Patterns and Socio-Demographic Factors

The activity patterns were markedly related to the socio-demographic factors (Table 4, Figure 4). The O-group was mainly attached to “nature-enjoyment cluster”, such as N03 “taking in fresh air”. It also had a keen interest in “social cluster” than other clusters, with the highest participation rate in S05 “making new friends” among the three age groups. On the other hand, the Y-group had the highest participation rate in “personal cluster” than other groups, such as P02 “listening to music”, and “outdoor cluster” such as O02 “taking snacks and drinks”. Meanwhile, the M-group stated relatively high participation rates for all activity clusters. E01 “jogging” was an activity type commonly engaging both the Y- and M-groups.
By economic occupation, the retiree, homemaker, and student groups exhibited disparate activity patterns. The retirees were enthusiastic mainly in “nature-enjoyment cluster”. The homemakers had the highest participation rate in “nature-enjoyment cluster”, followed by “social cluster”, but were less attracted to “outdoor cluster” and “personal cluster”. They had notably high participation rates in the whole range of “social cluster” activity types compared with the other groups, including S04 “participating in group sports activities”. They also reported a relatively high participation rate in E03 “doing physical exercises”. The students seldom used the parks for “social cluster”, except S01 “gathering and chatting with friends”. They were more interested in “personal cluster”, such as P06 “taking photographs”, and E01 “jogging”.
The activity patterns of males and females were similar irrespective of age (Table 4, Figure 5). Yet, it was apparent that the young males were less likely to conduct “social interaction”, especially S02 “enjoying time with family” and “playing with children”. Meanwhile, the middle-aged males enjoyed more “personal cluster”, such as P01 “enjoying solitude”, and P05 “chatting over the phone”.
The education level showed marked associations with some activities, with a divergence between the three age groups. In the O-group, the non-tertiary respondents focused more on “nature-enjoyment cluster”. In contrast, the tertiary respondents spread their pursuits to the other four activity clusters. In the Y-group, the non-tertiary respondents participated more earnestly in “social cluster”, particularly S01 “gathering and chatting with friends”, but less in “nature-enjoyment cluster”. In the M-group, more non-tertiary members engaged in “physical-exercise cluster”, mainly E01 “jogging” and E03 “doing physical exercises”, than non-tertiary counterparts.
The married respondents with no children in the O-group participated more keenly than the other marital categories in all activity clusters. However, the small sample size of this category (N = 20) may create biased results. In the M-group, the respondents with children presented high participation rates in “social cluster”, notably S02 “spending time with family”, and S03 “playing with children”.
The immigrants and locally born residents only expressed substantially different activity patterns within the O-group. The immigrants were particularly fond of “nature-enjoyment cluster”, especially N03 “taking in fresh air”. In contrast, they had significantly lower participation rates for most activity types in “outdoor cluster” and “personal cluster”.

3.3.3. Correlations between Engagement Level in Activity Clusters and Visitor Groups

Table 5 shows the correlations between the engagement level in five activity clusters and six socio-economic factors. In the younger groups (especially the young-age and student groups), “nature-enjoyment cluster” was positively correlated with “personal cluster”. In addition, “personal cluster” was negatively associated with “physical-exercise cluster” in the student group. In contrast, “nature-enjoyment cluster” was negatively correlated with “personal cluster” in the retiree and homemaker groups.
Other significant correlations were found for the remaining socio-demographic groups. For example, “personal cluster” was negatively related to “physical-exercise cluster” in the young, well-educated, and not married groups. “Social cluster” was positively related to “personal cluster” in the married, no children respondents in the M-group, and to “nature-enjoyment cluster” in the respondents with children in the O-group. For the locally born group in the O-group, “personal cluster” was positively associated with “outdoor cluster” and “physical-exercise cluster”, as well as for “outdoor cluster” with “social cluster”. However, negative relationships were observed for immigrants in these clusters.

3.3.4. Correlations between Engagement Level in Activity Clusters and Visiting Patterns

Table 6 reported the correlations between engagement level in activity clusters and visiting patterns. The frequent visitors of the young-age and student groups had a high engagement level for “outdoor cluster” and “physical-exercise cluster”. Meanwhile, the students more commonly engaged in “social cluster” had a lower visit frequency in the summer/warm periods. On the other hand, the frequent visitors of the old-age group engaged more in “nature-enjoyment cluster” but less in “personal cluster”. In addition, “physical-exercise cluster” was correlated with a shorter travel time to parks within the old-age group.
Similarly, the frequent visitors of the retiree group conducted more “nature-enjoyment cluster”. Moreover, the retirees stayed for a shorter period and traveled a shorter time if they were inclined to use parks for “physical-exercise cluster”. The travel time was also negatively associated with “social cluster”. Alternatively, the homemakers stayed longer in parks and visited parks more frequently for “physical-exercise cluster”.
The remaining socio-demographic groups displayed some specific relationships between the engagement level in activity clusters and visiting patterns. For instance, the non-local respondents of the Y- and M-groups stayed shorter in parks if they engaged more in “nature-enjoyment cluster”. The M-group’s less-educated male respondents had a shorter travel time to parks if they sought “personal cluster”.

4. Discussion

4.1. Park Patronage Behavior

The nearest urban green space may not always be preferred by individual users [18]. As our survey sites were relatively large parks (>1 hectare) by local standard, many respondents might choose them instead of nearby smaller parks. Other local studies found that the proximity to a residential area was not included as the top ten important indicators in urban park management [28]. The residents preferred large parks to small ones [33]. A large park could provide more and better facilities and functions to satisfy a larger clientele pool and more discerning users. However, proximity would remain an influential consideration for many residents in choosing the preferred urban parks [34]. As few of our respondents traveled over 20 min to reach an urban park, the innate desires for a convenient location have been emphatically expressed. To this end, pocket parks embedded in the neighborhood may offer a choice to local residents who are hesitant or have difficulty traveling a long distance [35].
Similar to the studies in various geographical regions (e.g., [36] in Australia; [17] in China; [15] in Europe), activities such as relaxation, getting fresh air, enjoying nature, and strolling were the most popular motives for visiting urban green spaces in our study. The universality of humanity towards mainstream park functions has been expressed regardless of natural and cultural divergence.
In addition to the wide variations in visit frequency, as reported in previous Hong Kong studies [21,23], we observed a varying stay duration and travel time for different groups. The activity patterns were not thoroughly investigated in previous local studies. Lo and Jim [22] reported that the older communities demonstrated a propensity for socially oriented park usage. In our study, activity patterns were highly dependent on socio-demographic backgrounds. The negligible effects of gender on visiting-activity patterns were likely due to the general gender equality in Hong Kong. Akin to the studies of Peters et al. [7] and Das et al. [37], we observed the effect of respondents with immigration background on park usage behavior. However, we found that the influences, especially on activity patterns, depended on the age factor and was akin to the education-level effect.
Nature orientation and park availability were proposed as the drivers of park visitation [38]. We found that the activity preference, affected by the socio-demographic context, could modify the visiting patterns. The roles of the activity types on visiting patterns, often neglected in the past, furnish valuable information for park managers to develop precision strategies to achieve specific targets. They include identifying activities linked with visit loyalty to promote park patronage. Moreover, the negative relationship between engagement level in activities and travel time calls for satisfying the latent demand for more neighborhood parks. Meanwhile, the correlations amongst the activity types indicated reliably the activity preference of different visitor groups. For example, students who used parks for physical activities were less interested in personal activities.

4.2. Implications for Urban Park Planning and Design

The distinctive usage patterns and expectations of different visitor cohorts signify the need for urban parks to meet their diverse and disparate needs. It is critical to consider current and changing demographics [35] and devise commensurate group-specific strategies [18] in developing and managing urban parks. Using Hong Kong as a case study, the implications and applications regarding four park clientele groups based on their unique needs are discussed below. The first two groups were commonly considered in the literature, but the last two were seldom addressed.
The significance of urban parks to senior citizens has been discussed in Hong Kong (e.g., [23,39]) and elsewhere (e.g., [19,40]). Our findings have corroborated the high dependency for parks and preference for nature-oriented activities of the retirees and older adults. A local study [24] suggested that the elderlies’ intense use of urban parks was motivated by a high demand rather than high satisfaction. The inordinately cramped indoor living space in Hong Kong would bolster the push driver to find refuge and relief in nearby public open spaces [33].
Performing physical and social activities in parks can enhance the elderly’s physical and mental wellbeing [41,42]. The heavy reliance of senior residents on urban parks calls for enlisting them as strategic venues to promote healthy aging in the progressively aging society in developed economies such as Hong Kong through innovative and elderly friendly design [43]. The high participation rate in “strolling leisurely” indicated the critical role of urban parks in promoting age-relevant outdoor exercises. The walking paths with design features that can enrich physical and visual experience should be incorporated [44,45]. Moreover, introducing facilities to incentivize non-customary active activities, including novel elderly play apparatus for exercise and fun [46] and covered or shaded areas [47], may further raise the physical activity level. Likewise, our findings supported the significant roles of parks as a social venue for the elderly [24,48]. However, the relatively modest participation rates of social activities in the absolute term urge the enhancement of suitable park features, such as a serene and relaxed setting [49], to augment the social support functions of parks.
For senior respondents, travel time had negative correlations with the engagement level in “social activities” and “physical activities”. This result suggested the importance of providing proximal parks to promote these activities. Unfortunately, the existing neighborhood and street parks are often tiny in area with inadequate facilities and poor environmental quality [24]. Their design and location could be revamped to meet the local recreation demands of elderly residents.
The second group of park clientele is families with children. The high visit frequency of respondents with children was reported in previous studies [23,50]. The especially high participation rate for family related activities confirmed an essential function of parks as a family supportive space.
This group’s longer stay duration and travel time indicated a desire for large parks with a good facility range and a higher sense of safety [34,51]. Yet, the longer travel time at the same time implied the shortage of suitable parks close to their homes. The economically disadvantaged families may be particularly prone to inadequate accessible parks with attractive and diverse play facilities [52]. Policy-makers could improve accessibility and facility diversity of family friendly parks to address availability, inclusiveness, and social equity issues [53].
Further, family friendly parks should embody enlightened playground designs that could effectively foster children’s physical activity level and social-skill development [54,55]. Nature’s protective and healing functions in the urban park setting for children’s physical and mental development could receive more attention, particularly to create opportunities to interact with diverse natural components through creative design [23,56].
The needs of the young generation, as an important park clientele group, tend to receive inadequate attention. The young generation found most local parks unattractive [57], explaining their low usage rate. Therefore, park design could be modified to encourage patronage by the younger citizens. Unlike the old-age or children-adolescent groups [10,55], the young adult group received little research attention with only a few exceptions [1,58,59].
Contrary to the elderly who focuses on nature enjoyment, young people seek escape from the stressful urban life by engaging in leisurely activities in the semi-natural and serene ambiance of the urban green space [18,60]. A China study reported that young people preferred to cluster at the park periphery for privacy and solitude [61]. The high engagement level in “nature-enjoyment cluster” and “personal cluster” among the younger respondents in our study signified the preference of naturalistic space for stress-relieving personal activities. The shorter travel time to parks of the young adults implied the inclination to use nearby parks. It will be pragmatic to designate small refuge zones in neighborhood parks with creative placement of vegetation and outdoor furniture to accommodate their desire to pursue relaxing and restful activities in somewhat secluded niches in urban parks [62]. Jogging is another common activity among young adults in urban parks. To satisfy the burgeoning demand, parks can be customized to enhance the running experience. For example, a relatively long-distance and non-repetitive running stretch or a circular jogging track in a cloistered site can be provided [63].
Additionally, young respondents’ visiting frequency had positive correlations with engagement level in “outdoor activities” and “physical activities”. This result provide hints on the positioning of urban parks to boost usage for outdoor and physical activities for the young generation. The encounters could nurture an attachment to parks and cultivate support and concern towards park planning and management [64,65].
The homemakers is another park clientele group that has often been ignored in park planning and management. Almost all (97.5%) homemaker respondents in our study were women. They used urban parks to perform their parental duty and obtain social support in their neighborhood, including group sports activities. Only a handful of studies had explicitly discussed the value of the urban parks to women [19,66,67,68]. Yet, the housewives’ health was more dependent on the amount of green space [69].
The rather high visit frequency and a strong preference for social-oriented activities among the homemaker respondents in our study indicated the importance of urban parks to their life. The longer travel time of the group to the park revealed that some factors other than distance were driving their park choice. For example, they may travel to a distant park to meet friends, find a safer park or use better facilities [70]. In addition, this group’s engagement level in physical activities was associated with high loyalty to urban parks, calling for more attention to this activity group. The small sample size of homemakers might have limited the explanatory power of our findings. Future research could evaluate their expectations in depth to inform park design and fill the provision gaps.
Meanwhile, the divergent activity patterns of the socio-demographic groups indicate that a changing social structure will reshape the relative roles of urban parks. For example, the increasingly aging population, escalating non-marriage rate, and decreasing birth rate may alter visitor profiles and visiting patterns. The community’s rising education level can furnish another evolving factor to modify the demands. Markedly, a relatively large proportion of the old-age group in our study was immigrants, mainly from mainland China. They demonstrated different visiting-activity patterns vis-a-vis local counterparts. However, the decreased number and increased education level of recent immigrants anticipated a modified elderly park usage pattern in the future.
The changing societal fashions and trends may also re-model activity patterns. For example, increasing health awareness of the new generation and social trend are likely to increase jogging and other relatively active health-enhancing activities [71,72]. The emergent new diseases may induce differential responses from different age groups vis-à-vis park usage. Therefore, the decision-makers need to make projections proactively based on demographic and social trends and regularly review the park planning and design to adjust to contemporary needs. An entrenched, outdated and unenterprising practice is impractical if not anachronistic for socially relevant and temporally sensitive expectations of urban parks.

4.3. Limitations of the Study

Our study was conducted before the prevalence of the COVID-19 pandemic. The recent COVID-19 pandemic could alter visit and activity patterns in the short term. If it gradually becomes endemic, the patterns could be further adjusted in the longer run [70,73,74]. The influence of such progressive transformations could be investigated in future studies. Furthermore, the small sample size of some sub-categories of socio-demographic groups may restrict the explanatory power of our findings.

5. Conclusions

Our results have enriched the knowledge base of visiting-activity patterns in the Asian region and the effects of socio-demographic factors of different age brackets. Further, we observed significant correlations between visiting parameters and activity types versus the socio-demographic context. Such multiple relationships were not explored in previous local studies and were rarely evaluated in other geographical regions. These associations improved our understanding of the differential park patronage characteristics of different segments of society.
Our findings highlighted the need to plan and manage community-relevant and community-responsive outdoor recreational venues. In particular, the design of urban parks catering to four specific user groups was scrutinized in our local case, which could be applied to other cities with a context similar to Hong Kong. These user groups can receive more attention. The diverse visiting-activity patterns of heterogeneous groups can inform customized strategies to enhance socially inclusive park use.
The lessons learned in our Hong Kong case study include specific recommendations for four user groups and the need to adjust to changing community composition and needs. While the quantitative increment of park development is important, the qualitative improvement must not be overlooked. Parks facilities and accessibility can be upgraded to foster the physical and social activity levels of the elderly visitors. Family friendly venues can be established to support and encourage outdoor recreation of family groups. Parks can be revamped to offer good quality and naturalistic space for personal activities and jogging, and promoting parks as a venue for energetic outdoor and physical activities for younger adults. Parks can be embraced as a hub for social interactions and physical activities for homemakers. Urban park development could keep pace with the changing societal and demographic trends.
While our findings may not be directly and entirely transferable to other regions, the research approach and results have commonality elements and reference values for parks in other jurisdictions. We believed that our results had broadened the knowledge base and perspective toward the dissimilar recreational roles of urban parks to the heterogeneous and changing community segments. We also offered preliminary directions for future studies to explore the intricate relationships of visiting and activity patterns.

Author Contributions

Conceptualization, C.-Y.J.; methodology, C.-Y.J. and L.-C.H.; validation, C.-Y.J. and L.-C.H.; formal analysis, L.-C.H.; investigation, C.-Y.J.; data curation, C.-Y.J. and L.-C.H.; writing—original draft preparation, C.-Y.J. and L.-C.H.; writing—review and editing, C.-Y.J.; visualization, L.-C.H.; supervision, C.-Y.J.; project administration, C.-Y.J.; funding acquisition, C.-Y.J. All authors have read and agreed to the published version of the manuscript.

Funding

This research was funded by the Research Matching Grant Scheme of the University Grants Council of Hong Kong.

Institutional Review Board Statement

The study was conducted in accordance with the Declaration of Helsinki, and approved by the Human Research Ethics Committee of the University of Hong Kong on 15 March 2018 with reference number EA1803001.

Informed Consent Statement

Informed consent was obtained from all subjects involved in the study.

Data Availability Statement

Not applicable.

Acknowledgments

We appreciate the questionnaire survey service provided by a university in Hong Kong.

Conflicts of Interest

The authors declare no conflict of interest.

References

  1. Konijnendijk, C.C.; Annerstedt, M.; Nielsen, A.B.; Maruthaveeran, S. Benefits of Urban Parks. A Systematic Review. A Report for IFPRA; International Federation of Park and Recreation Administration: Copenhagen, Denmark; Alnarp, Sweden, 2013. [Google Scholar]
  2. Sasidharan, V.; Willits, F.K.; Godbey, G. Cultural differences in urban recreation patterns: An examination of park usage and activity participation across six population subgroups. Manag. Leis. 2005, 10, 19–38. [Google Scholar] [CrossRef]
  3. Kim, G.; Coseo, P. Urban park systems to support sustainability: The role of urban park systems in hot arid urban climates. Forests 2018, 9, 439. [Google Scholar] [CrossRef] [Green Version]
  4. Goddard, M.A.; Dougill, A.J.; Benton, T.G. Scaling up from gardens: Biodiversity conservation in urban environments. Trends Ecol. Evol. 2010, 25, 90–98. [Google Scholar] [CrossRef] [PubMed]
  5. Gilmore, A. The park and the commons: Vernacular spaces for everyday participation and cultural value. Cult. Trends 2017, 26, 34–46. [Google Scholar] [CrossRef] [Green Version]
  6. Chen, T.; Zhao, Y.; Yang, H.; Wang, G.; Mi, F. Recreational services from green space in Beijing: Where supply and demand meet? Forests 2021, 12, 1625. [Google Scholar] [CrossRef]
  7. Peters, K.; Elands, B.; Buijs, A. Social interactions in urban parks: Stimulating social cohesion? Urban For. Urban Green. 2010, 9, 93–100. [Google Scholar] [CrossRef] [Green Version]
  8. Hartig, T.; Mitchell, R.; De Vries, S.; Frumkin, H. Nature and health. Annu. Rev. Public Health 2014, 35, 207–228. [Google Scholar] [CrossRef] [Green Version]
  9. Mukherjee, D.; Safraj, S.; Tayyab, M.; Shivashankar, R.; Patel, S.A.; Narayanan, G.; Ajay, V.S.; Ali, M.K.; Narayan, K.M.V.; Tandon, N.; et al. Park availability and major depression in individuals with chronic conditions: Is there an association in urban India? Health Place 2017, 47, 54–62. [Google Scholar] [CrossRef]
  10. Rivera, E.; Timperio, A.; Loh, V.H.; Deforche, B.; Veitch, J. Important park features for encouraging park visitation, physical activity and social interaction among adolescents: A conjoint analysis. Health Place 2021, 70, 102617. [Google Scholar] [CrossRef]
  11. Hegetschweiler, K.T.; de Vries, S.; Arnberger, A.; Bell, S.; Brennan, M.; Siter, N.; Olafsson, A.S.; Voigt, A.; Hunziker, M. Linking demand and supply factors in identifying cultural ecosystem services of urban green infrastructures: A review of European studies. Urban For. Urban Green. 2017, 21, 48–59. [Google Scholar] [CrossRef] [Green Version]
  12. Tinsley, H.E.; Tinsley, D.J.; Croskeys, C.E. Park usage, social milieu, and psychosocial benefits of park use reported by older urban park users from four ethnic groups. Leis. Sci. 2002, 24, 199–218. [Google Scholar] [CrossRef]
  13. Sreetheran, M. Exploring the urban park use, preference and behaviours among the residents of Kuala Lumpur, Malaysia. Urban For. Urban Green. 2017, 25, 85–93. [Google Scholar] [CrossRef]
  14. Veitch, J.; Wang, W.C.; Salmon, J.; Carver, A.; Giles-Corti, B.; Timperio, A. Who goes to metropolitan parks? A latent class analysis approach to understanding park visitation. Leis. Sci. 2018, 40, 343–355. [Google Scholar] [CrossRef]
  15. Fischer, L.K.; Honold, J.; Botzat, A.; Brinkmeyer, D.; Cvejić, R.; Delshammar, T.; Elands, B.; Haase, D.; Kabish, N.; Karie, S.J.; et al. Recreational ecosystem services in European cities: Sociocultural and geographical contexts matter for park use. Ecosyst. Serv. 2018, 31, 455–467. [Google Scholar] [CrossRef]
  16. Shan, X.Z. Socio-demographic variation in motives for visiting urban green spaces in a large Chinese city. Habitat Int. 2014, 41, 114–120. [Google Scholar] [CrossRef]
  17. Shan, X.Z. The socio-demographic and spatial dynamics of green space use in Guangzhou, China. Appl. Geogr. 2014, 51, 26–34. [Google Scholar] [CrossRef]
  18. Schipperijn, J.; Stigsdotter, U.K.; Randrup, T.B.; Troelsen, J. Influences on the use of urban green space: A case study in Odense, Denmark. Urban For. Urban Green. 2010, 9, 25–32. [Google Scholar] [CrossRef]
  19. Sang, Å.O.; Knez, I.; Gunnarsson, B.; Hedblom, M. The effects of naturalness, gender, and age on how urban green space is perceived and used. Urban For. Urban Green. 2016, 18, 268–276. [Google Scholar] [CrossRef]
  20. Arnberger, A. Recreation use of urban forests: An inter-area comparison. Urban For. Urban Green. 2006, 4, 135–144. [Google Scholar] [CrossRef]
  21. Wong, K.K. Urban park visiting habits and leisure activities of residents in Hong Kong, China. Manag. Leis. 2009, 14, 125–140. [Google Scholar] [CrossRef]
  22. Lo, A.Y.; Jim, C.Y. Differential community effects on perception and use of urban greenspaces. Cities 2010, 27, 430–442. [Google Scholar] [CrossRef] [Green Version]
  23. Mak, B.K.; Jim, C.Y. Linking park users’ socio-demographic characteristics and visit-related preferences to improve urban parks. Cities 2019, 92, 97–111. [Google Scholar] [CrossRef]
  24. Lau, K.K.L.; Yung, C.C.Y.; Tan, Z. Usage and perception of urban green space of older adults in the high-density city of Hong Kong. Urban For. Urban Green. 2021, 64, 127251. [Google Scholar] [CrossRef]
  25. Chow, B.C.; McKenzie, T.L.; Sit, C.H. Public parks in Hong Kong: Characteristics of physical activity areas and their users. Int. J. Environ. Res. Public Health 2016, 13, 639. [Google Scholar] [CrossRef] [Green Version]
  26. Audit Commission. Development and Management of Parks and Gardens; Hong Kong Government: Hong Kong SAR, China, 2013. Available online: https://www.aud.gov.hk/pdf_e/e60ch04.pdf (accessed on 22 March 2022).
  27. Planning Department. Hong Kong Planning Standards and Guidelines; Hong Kong Government: Hong Kong SAR, China, 2022. Available online: https://www.pland.gov.hk/pland_en/tech_doc/hkpsg/full/pdf/ch4.pdf (accessed on 22 March 2022).
  28. Chan, C.S.; Si, F.H.; Marafa, L.M. Indicator development for sustainable urban park management in Hong Kong. Urban For. Urban Green. 2018, 31, 1–14. [Google Scholar] [CrossRef]
  29. Dowda, M.; Ainsworth, B.E.; Addy, C.L.; Saunders, R.; Riner, W. Correlates of physical activity among US young adults, 18 to 30 years of age, from NHANES III. Ann. Behav. Med. 2003, 26, 15–23. [Google Scholar] [CrossRef] [PubMed]
  30. Ravenscroft, N.; Markwell, S. Ethnicity and the integration and exclusion of young people through urban park and recreation provision. Manag. Leis. 2000, 5, 135–150. [Google Scholar] [CrossRef]
  31. Dzhambov, A.M.; Dimitrova, D.D. Elderly visitors of an urban park, health anxiety and individual awareness of nature experiences. Urban For. Urban Green. 2014, 13, 806–813. [Google Scholar] [CrossRef]
  32. Payne, L.L.; Orsega-Smith, E.; Roy, M.; Godbey, G.C. Local park use and personal health among older adults: An exploratory study. J. Park Recreat. Adm. 2005, 23, 1–20. [Google Scholar]
  33. Lo, A.Y.; Jim, C.Y. Citizen attitude and expectation towards greenspace provision in compact urban milieu. Land Use Policy 2012, 29, 577–586. [Google Scholar] [CrossRef] [Green Version]
  34. Tu, X.; Huang, G.; Wu, J.; Guo, X. How do travel distance and park size influence urban park visits? Urban For. Urban Green. 2020, 52, 126689. [Google Scholar] [CrossRef]
  35. Azagew, S.; Worku, H. Socio-demographic and physical factors influencing access to urban parks in rapidly urbanizing cities of Ethiopia: The case of Addis Ababa. J. Outdoor Recreat. Tour. 2020, 31, 100322. [Google Scholar] [CrossRef]
  36. Weber, D.; Anderson, D. Contact with nature: Recreation experience preferences in Australian parks. Ann. Leis. Res. 2010, 13, 46–69. [Google Scholar] [CrossRef]
  37. Das, K.V.; Fan, Y.; French, S.A. Park-use behavior and perceptions by race, Hispanic origin, and immigrant status in Minneapolis, MN: Implications on park strategies for addressing health disparities. J. Immigr. Minority Health 2017, 19, 318–327. [Google Scholar] [CrossRef] [PubMed]
  38. Lin, B.B.; Fuller, R.A.; Bush, R.; Gaston, K.J.; Shanahan, D.F. Opportunity or orientation? Who uses urban parks and why. PLoS ONE 2014, 9, e87422. [Google Scholar]
  39. Tan, Z.; Lau, K.K.L.; Roberts, A.C.; Chao, S.T.Y.; Ng, E. Designing urban green spaces for older adults in Asian cities. Int. J. Environ. Res. Public Health 2019, 16, 4423. [Google Scholar] [CrossRef] [Green Version]
  40. Loukaitou-Sideris, A.; Levy-Storms, L.; Chen, L.; Brozen, M. Parks for an aging population: Needs and preferences of low-income seniors in Los Angeles. J. Am. Plan. Assoc. 2016, 82, 236–251. [Google Scholar] [CrossRef]
  41. Irvine, K.N.; Warber, S.L.; Devine-Wright, P.; Gaston, K.J. Understanding urban green space as a health resource: A qualitative comparison of visit motivation and derived effects among park users in Sheffield, UK. Int. J. Environ. Res. Public Health 2013, 10, 417–442. [Google Scholar] [CrossRef]
  42. Roe, J.; Mondschein, A.; Neale, C.; Barnes, L.; Boukhechba, M.; Lopez, S. The urban built environment, walking and mental health outcomes among older adults: A pilot study. Front. Public Health 2020, 8, 528. [Google Scholar] [CrossRef]
  43. Pericu, S. Designing for an ageing society: Products and services. Des. J. 2017, 20, S2178–S2189. [Google Scholar] [CrossRef] [Green Version]
  44. Zhai, Y.; Baran, P.K. Urban park pathway design characteristics and senior walking behavior. Urban For. Urban Green. 2017, 21, 60–73. [Google Scholar] [CrossRef]
  45. Veitch, J.; Flowers, E.; Ball, K.; Deforche, B.; Timperio, A. Designing parks for older adults: A qualitative study using walk-along interviews. Urban For. Urban Green. 2020, 54, 126768. [Google Scholar] [CrossRef]
  46. Leifer, D. Playground attraction. Nurs. Stand. 2008, 22, 18–19. [Google Scholar] [CrossRef] [PubMed]
  47. Duan, Y.; Wagner, P.; Zhang, R.; Wulff, H.; Brehm, W. Physical activity areas in urban parks and their use by the elderly from two cities in China and Germany. Landsc. Urban Plan. 2018, 178, 261–269. [Google Scholar] [CrossRef]
  48. Yung, E.H.K.; Ho, W.K.O.; Chan, E.H.K. Elderly satisfaction with planning and design of public parks in high density old districts: An ordered logit model. Landsc. Urban Plan. 2017, 165, 39–53. [Google Scholar]
  49. Veitch, J.; Ball, K.; Rivera, E.; Loh, V.; Deforche, B.; Best, K.; Timperio, A. What entices older adults to parks? Identification of park features that encourage park visitation, physical activity, and social interaction. Landsc. Urban Plan. 2022, 217, 104254. [Google Scholar] [CrossRef]
  50. Kemperman, A.D.; Timmermans, H.J. Heterogeneity in urban park use of aging visitors: A latent class analysis. Leis. Sci. 2006, 28, 57–71. [Google Scholar] [CrossRef]
  51. Flowers, E.P.; Timperio, A.; Hesketh, K.D.; Veitch, J. Comparing the features of parks that children usually visit with those that are closest to home: A brief report. Urban For. Urban Green. 2020, 48, 126560. [Google Scholar] [CrossRef]
  52. Rigolon, A.; Browning, M.; Jennings, V. Inequities in the quality of urban park systems: An environmental justice investigation of cities in the United States. Landsc. Urban Plan. 2018, 178, 156–169. [Google Scholar] [CrossRef]
  53. Kimpton, A. A spatial analytic approach for classifying greenspace and comparing greenspace social equity. Appl. Geogr. 2017, 82, 129–142. [Google Scholar] [CrossRef] [Green Version]
  54. Yilmaz, S.; Bulut, Z. Analysis of user’s characteristics of three different playgrounds in districts with different socio-economical conditions. Build. Environ. 2007, 42, 3455–3460. [Google Scholar] [CrossRef]
  55. Veitch, J.; Ball, K.; Rivera, E.; Loh, V.; Deforche, B.; Timperio, A. Understanding children’s preference for park features that encourage physical activity: An adaptive choice based conjoint analysis. Int. J. Behav. Nutr. Phys. Act. 2021, 18, 133. [Google Scholar] [CrossRef] [PubMed]
  56. Aynal, S.O. The importance and value of school yards in early childhood education. In Environment and Ecology at the Beginning of 21st Century; Efe, R., Bizzarri, C., Cürebal, I., Nyusupova, G.N., Eds.; St. Kliment Ohridski University Press: Sofia, Bulgaria, 2015; pp. 313–325. [Google Scholar]
  57. Lai, C. Open Space Opinion Survey; Civic Exchange: Hong Kong SAR, China, 2019; Available online: https://civic-exchange.org/wp-content/uploads/2018/10/Civic-Exchange-Open-Space-Opinion-Survey-SUMMARY-REPORT-CH.pdf (accessed on 22 March 2022).
  58. Sultz, J. Motivations and Constraints to Young Adult and Minority Visitation to Sites in the National Park Service; University of South Carolina: Columbia, SC, USA, 2021; Senior Thesis 454. [Google Scholar]
  59. van Aalst, I.; Brands, J. Young people: Being apart, together in an urban park. J. Urban. Int. Res. Placemaking Urban Sustain. 2021, 14, 1–17. [Google Scholar] [CrossRef] [Green Version]
  60. Home, R.; Hunziker, M.; Bauer, N. Psychosocial outcomes as motivations for visiting nearby urban green spaces. Leis. Sci. 2012, 34, 350–365. [Google Scholar] [CrossRef]
  61. Mu, B.; Liu, C.; Mu, T.; Xu, X.; Tian, G.; Zhang, Y.; Kim, G. Spatiotemporal fluctuations in urban park spatial vitality determined by on-site observation and behavior mapping: A case study of three parks in Zhengzhou City, China. Urban For. Urban Green. 2021, 64, 127246. [Google Scholar] [CrossRef]
  62. Gray, G.W.; Deneke, F.J. Urban Forestry, 2nd ed.; Krieger Publishing: Malabar, FL, USA, 1992. [Google Scholar]
  63. Tan, K.W. A greenway network for Singapore. Landsc. Urban Plan. 2006, 76, 45–66. [Google Scholar] [CrossRef]
  64. Ryan, R.L. The role of place attachment in sustaining urban parks. In The Humane Metropolis: People and Nature in the 21st-Century City; Platt, R.H., Ed.; University of Massachusetts Press: Amherst, MA, USA, 2006; pp. 61–74. [Google Scholar]
  65. Plunkett, D.; Fulthorp, K.; Paris, C.M. Examining the relationship between place attachment and behavioral loyalty in an urban park setting. J. Outdoor Recreat. Tour. 2019, 25, 36–44. [Google Scholar] [CrossRef]
  66. Krenichyn, K. ‘The only place to go and be in the city’: Women talk about exercise, being outdoors, and the meanings of a large urban park. Health Place 2006, 12, 631–643. [Google Scholar] [CrossRef]
  67. Veitch, J.; Abbott, G.; Kaczynski, A.T.; Stanis, S.A.W.; Besenyi, G.M.; Lamb, K.E. Park availability and physical activity, TV time, and overweight and obesity among women: Findings from Australia and the United States. Health Place 2016, 38, 96–102. [Google Scholar] [CrossRef]
  68. Khairrussalleh, N.; Hussain, N. Women’s pattern of use at two recreational parks in Klang Valley, Malaysia. Alam Cipta 2017, 10, 18–25. [Google Scholar]
  69. De Vries, S.; Verheij, R.A.; Groenewegen, P.P.; Spreeuwenberg, P. Natural environments—Healthy environments? An exploratory analysis of the relationship between greenspace and health. Environ. Plan. A 2003, 35, 1717–1731. [Google Scholar] [CrossRef] [Green Version]
  70. Talal, M.L.; Santelmann, M.V. Visitor access, use, and desired improvements in urban parks. Urban For. Urban Green. 2021, 63, 127216. [Google Scholar] [CrossRef]
  71. Zanon, D.; Curtis, J.; Lockstone-Binney, L.; Hall, J. Examining future park recreation activities and barriers relative to societal trends. Ann. Leis. Res. 2019, 22, 506–531. [Google Scholar] [CrossRef]
  72. Chen, D.; Long, X.; Li, Z.; Liao, C.; Xie, C.; Che, S. Exploring the Determinants of Urban Green Space Utilization Based on Microblog Check-In Data in Shanghai, China. Forests 2021, 12, 1783. [Google Scholar] [CrossRef]
  73. Geng, D.C.; Innes, J.; Wu, W.; Wang, G. Impacts of COVID-19 pandemic on urban park visitation: A global analysis. J. For. Res. 2021, 32, 553–567. [Google Scholar] [CrossRef]
  74. Rice, W.L.; Pan, B. Understanding changes in park visitation during the COVID-19 pandemic: A spatial application of big data. Well-Being Space Soc. 2021, 2, 100037. [Google Scholar] [CrossRef]
Figure 1. Map of Hong Kong indicating the locations of the 26 urban park sites where the questionnaire surveys were conducted in their vicinity. Map tiles by Stamen Design (stamen.com, accessed on 22 March 2022), under CC BY 3.0 (creativecommons.org, accessed on 22 March 2022). Map data by OpenStreetMap (openstreetmap.org, accessed on 22 March 2022), under CC BY SA (creativecommons.org, accessed on 22 March 2022). © OpenStreetMap contributors: Data are available under the Open Database License (opendatacommons.org, accessed on 22 March 2022; osm.org/copyright).
Forests 13 00841 g001
Figure 2. The visiting patterns of the respondents (%) are based on their park-visiting behaviors.
Forests 13 00841 g002
Figure 3. The participation rate (percentage of respondents answering “Frequent” or “Occasional”) in 30 activity types grouped into five activity clusters: N for nature-enjoyment cluster, P for personal cluster, S for social cluster, O for outdoor cluster, and E for physical-exercise cluster.
Forests 13 00841 g003
Figure 4. The participation rate (%) in 30 activity types with reference to the socio-economic factors of age and economic occupation. Note. Refer to Table 3 for the codes of the activity types.
Forests 13 00841 g004
Figure 5. The participation rate (%) in 30 activity types with reference to the socio-economic factors of gender, education level, family status, and birthplace by three age sectors. Note. Refer to Table 3 for the codes of the activity types.
Forests 13 00841 g005
Table 1. Six main socio-demographic characteristics of the respondents by overall (all age) scenario and three fused age groups (Y: young age; M: middle age, O: old age). Valid percent is shown.
Socio-Demographic VariableOverall
(All-Age)
N, %
Y-Group
(Age 18–30) 1
N, %
M-Group
(Age 31–50) 1
N, %
O-Group
(Age ≥ 51) 1
N, %
Chi-Square (χ2) Test
Age (N = 464)
18–30131, 28.2
31–50162, 34.9
≥51171, 36.9
Economic occupation (N = 459)
Full-time184, 40.1
Part-time/unemployed61, 13.3
Retired104, 22.7
Homemaker41, 8.9
Student69, 15.5
Gender (N = 464) 7.18, p = 0.028
Male244, 52.664, 48.976, 46.9103, 60.6
Female220, 47.467, 51.186, 53.167, 39.4
Education level (N = 463) 124.59, p = 0.00
Non-tertiary253, 54.629, 22.378, 48.1146, 85.9
Tertiary210, 45.4101, 77.784, 51.924, 14.1
Family status (N = 464) 189.06, p = 0.00
Not married184, 39.7113, 86.340, 24.731, 18.2
Married, no children75, 16.212, 9.242, 25.920, 11.8
Married, with children205, 44.26, 4.680, 49.4119, 70.0
Birthplace (N = 465) 58.21, p = 0.00
Hong Kong333, 71.6114, 87.0131, 80.987, 50.9
Outside Hong Kong132, 28.417, 13.031, 19.184, 49.1
1 Bold/italic text indicates that the cell has significantly more/fewer counts than expected based on the post-hoc analysis of Pearson residuals.
Table 2. The visiting patterns of the respondents (%) in relation to six socio-demographic factors by three age sectors (A), indicated by the median (Mdn) and interquartile range (IQR) of the ordinal scale of visiting frequency, stay duration, and travel time.
Socio-Demographic VariableVisiting Pattern 1
Visit Frequency (Summer/Warm Periods)Visit Frequency (Winter/Cool Periods)Stay DurationTravel Time
MdnIQRp2MdnIQRp2MdnIQRp2MdnIQRp2
Age
Young age32, 4b32, 3b21, 2c21, 2b
Middle age32, 4b32, 3b21, 2b22, 3a
Old age43, 4a43, 4a21, 3a22, 3a
Economic occupation
Full-time32, 3.75c32, 3c21, 2b22, 3ab
Part-time/unemployed32, 4bc32, 4bc21, 2b22, 3ab
Retired44, 5a43, 4a32, 3a22, 3ab
Homemaker42.5, 5b32, 4ab21, 2b32, 3a
Student32, 3c32, 3bc21, 2b21, 2.5b
Gender
YMale32, 4 32, 4 21, 2 21, 2
Female22, 3 32, 3 21, 2 21, 3
MMale32, 4 32, 3 21, 2 22, 3
Female32, 3.5 32, 3 21, 2 32, 3
OMale43, 4 43, 4 22, 3a22, 3
Female42, 5 43, 4 21, 3b22, 3
Education level
YNon-tertiary32, 4 31.5, 4 21, 2 21,3
Tertiary32, 3.75 32, 3 21, 2 21, 2
MNon-tertiary32, 4 32, 4 21, 2 32, 3.5
Tertiary32, 3 32, 3 21, 2 22, 3
ONon-tertiary43, 5a43, 4a21, 3 22, 3
Tertiary32.25, 4b33, 4b22, 3 22, 3
Family status
YNot married32, 3.5+32, 3+21, 2 21, 2+
Married, no children33, 4+3.53, 4+21.25, 2.75 22, 3+
Married, with children42.5, 4.25+42.5, 4.25+1.51, 2 31.75, 3.25+
MNot married32, 3+21, 3b1.51, 2b22, 3ab
Married, no children32, 3+2.51, 3ab21, 2b21, 3b
Married, with children32, 4+32, 4a22, 3a32, 3.75a
ONot married42, 4 31, 4 21, 3 22, 3
Married, no children42.25, 4 42.25, 4 21, 3 22, 3
Married, with children43, 4 43, 4 21.25, 3 22, 3
Birthplace
YHong Kong32, 4 32, 3 21, 2 21, 2
Outside Hong Kong32, 4 32, 3.5 21, 2 21.5, 3
MHong Kong32, 3 32, 3 21, 2 22, 3
Outside Hong Kong32, 4 32, 4 21, 2 31, 4
OHong Kong43, 4 43, 4 21, 3 22, 3
Outside Hong Kong43, 5 43, 5 21.75, 3 22, 3
1 Ordinal coding protocols: Visit frequency—1 for “less than once per month”, 2 for “once per month”, 3 for “once per week”, 4 for “2–6 times per week”, 5 for “at least once per day”; Stay duration—1 for “<1 h”, 2 for “1–2 h”, 3 for “2–3 h”, 4 for “>3 h”; Travel time—1 for “<5 min”, 2 for “5–10 min”, 3 for “10–20 min”, 4 for “20–30 min”, 5 for “>30 min”. 2 Different letters denote significant difference by the post-hoc analysis of Wilcoxon signed rank test with Bonferroni correction at the overall scenario for age and economic activity status, and at the three age groups for gender, education level, and family status. + indicates a significant difference is not observed by the post-hoc analysis.
Table 3. The 30 visitor activity types are classified into five activity clusters based on their PCA factor loadings in relation to activity engagement level. Cronbach’s alpha (α) is >0.7 for all clusters.
CodeActivity TypeFactor Loading 1 on Activity Cluster
Nature-Enjoyment (N)
α = 0.831
Personal (P)
α = 0.825
Outdoor (O)
α = 0.832
Social (S)
α = 0.838
Physical-Exercise (E)
α = 0.762
N01Relishing natural scenery0.84
N02Strolling leisurely0.66
N03Taking in fresh air0.82
N04Whiling away the time0.71
N05Cooling down0.78
N06Enjoying tranquility and relaxation0.75
N07Listening to birds singing0.53 0.41
N08Sun bathing0.53 0.45
P01Enjoying solitude 0.49
P02Listening to music 0.73
P03Surfing the internet or social media 0.83
P04Reading books, newspapers, or magazines 0.45
P05Chatting over the phone 0.73
P06Taking photographs 0.71
P07Painting 0.580.47
O01Sitting on the lawn 0.69
O02Taking snacks and drinks 0.430.55
O03Lying on the lawn 0.70
O04Enjoying picnic meal 0.490.65
O05Walking the dog 0.71
O06Letting the pet bird contact with nature 0.74
S01Gathering and chatting with friends 0.79
S02Enjoying time with family 0.79
S03Playing with children 0.80
S04Participating in group sports activities 0.76
S05Making new friends 0.670.47
E01Jogging 0.51 0.56
E02Enjoying other personal sports activities 0.71
E03Doing physical exercises 0.82
E04Dancing 0.74
% variance explained15.314.513.411.410.5
1 Only factor loadings ≥ 0.4 were listed. If the factor loadings of an activity type were ≥0.4 at more than one principal component, the activity type was assigned to the activity cluster with the higher PCA factor loading. The lower PCA factor loading is italicized.
Table 4. The engagement level in five activity clusters in terms of average participation rates (PR) and PCA component scores (CS), by respondents’ six socio-demographic factors.
Socio-Demographic VariableEngagement Level in Activity Cluster 1
Nature-Enjoyment (N)Personal
(P)
Outdoor
(O)
Social
(S)
Physical-Exercise (E)
PR (%), CSp2PR (%), CSp2PR (%), CSp2PR (%), CSp2PR (%), CSp2
Age
Young age62.9, −0.266b47.4, 0.476a42.1, 0.097+32.8, −0.274b29.8, −0.009
Middle age72.3, −0.003a48.9, 0.229a42.3, 0.072+50.1, 0.154a35.2, −0.034
Old age72.9, 0.214a30.5, −0.583b28.2, −0.151+38.2, 0.059a25.3, 0.037
Economic occupation
Full-time70.0, −0.058+48.4, 0.275a44.4, 0.111a43.3, 0.004ab32.3, −0.175
Part-time/unemployed65.7, −0.201+48.0, 0.165a39.4, 0.030ab45.9, 0.125ab38.3, 0.211
Retiree72.7, 0.241+25.9, −0.775b23.9, −0.194ab34.1, −0.049ab20.9, 0.023
Home-maker72.3, 0.120+35.2, −0.383b27.2, −0.212b54.1, 0.475a32.3, 0.222
Student65.9, −0.103+45.9, 0.501a40.6, 0.059ab31.2, −0.349b27.9, 0.061
Gender
YMale63.2, −0.219 45.6, 0.416 42.4, 0.069 27.6, −0.452 29.4, 0.097
Female62.7, −0.310 49.7, 0.533 41.8, 0.124 37.8, −0.105 30.2, −0.110
MMale72.7, −0.024 55.5, 0.311 46.1, 0.103 50.6, 0.077 38.5, 0.026
Female71.9, 0.016 43.0, 0.157 39.0, 0.044 49.8, 0.221 32.3, −0.086
OMale73.3, 0.206 32.9, −0.538 29.7, −0.130 37.2, −0.013 25.6, −0.059
Female71.8, 0.209 27.7, −0.643 27.0, −0.170 40.6, 0.172 25.0, 0.007
Education level
YNon-tertiary54.0, −0.659b56.2, 0.649 37.9, −0.050 44.8, 0.217a35.7, 0.049
Tertiary65.6, −0.155a45.3, 0.428 43.3, 0.122 29.4, −0.431b28.2, −0.041
MNon-tertiary72.8, −0.100 48.9, 0.125 40.2, 0.024 53.7, 0.284 40.0, 0.148a
Tertiary72.6, −0.088 48.8, 0.325 44.2, 0.115 46.8, 0.032 30.7, −0.203b
ONon-tertiary72.8, 0.264 28.5, −0.671b26.0, −0.208 37.2, 0.051 23.5, −0.016
Tertiary69.2, −0.048 44.1, −0.075a43.6, 0.167 46.2, 0.115 35.6, 0.367
Family status
YNot married63.1, −0.244 47.0, 0.491 40.6, 0.043 32.3, −0.304 27.9, −0.051
Married, no children67.7, −0.268 57.1, 0.461 57.0, 0.374 36.7, −0.196 45.8, 0.272
Married with children48.8, −0.671 42.9, 0.220 41.7, 0.561 33.3, −0.127 33.3, 0.218
MNot married66.9, 0.026 51.8, 0.389 40.8, 0.020 39.3, −0.356b31.2, 0.025
Married, no children75.6, −0.103 54.4, 0.408 47.2, 0.106 49.3, 0.107b41.1, 0.105
Married with children73.3, 0.036 44.5, 0.055 40.4, 0.079 56.0, 0.433a34.1, −0.136
ONot married71.0, 0.241 28.1, −0.695 18.9, −0.497b29.7, −0.221 29.0, 0.220
Married, no children82.1, 0.437 53.7, −0.069 56.3, 0.394a53.3, 0.202 39.3, 0.301
Married with children71.2, 0.171 27.0, −0.651 25.8, −0.158b37.7, 0.100 21.2, −0.065
Birthplace
YHK62.0, −0.332 46.7, 0.483 40.4, 0.034 33.1, −0.235 29.6, −0.003
Outside HK69.1, 0.179 54.6, 0.423 54.0, 0.524 31.0, −0.539 30.9, −0.053
MHK71.4, −0.042 48.9, 0.238 43.0, 0.112 50.0, 0.141 34.7, −0.060
Outside HK76.2, 0.163 48.8, 0.189 39.2, −0.099 50.7, 0.206 37.1, 0.075
OHK67.3, −0.109b39.0, −0.329a34.7, 0.039a35.5, −0.039 28.8, 0.073
Outside HK78.4, 0.548a22.3, −0.847b22.3, −0.348b41.7, 0.160 21.6, −0.000
1 The average participation rates in the five activity clusters are: N = 69.8%, P = 41.9%, O = 37.2%, S = 41.0% and E = 30.0%. Italic number indicates the average participation rate is below the average value. 2 Different letters denote significant difference of component scores from PCA by the post-hoc analysis of Wilcoxon signed rank test with Bonferroni correction at the overall scenario for age and economic activity status, and at the three age groups for gender, education level, and family status. + indicates that a significant difference is not observed by the post-hoc analysis.
Table 5. The correlations between the respondents’ engagement level in five activity clusters 1 and six socio-demographic factors, determined by Spearman’s correlation coefficients of the PCA component scores.
Socio-Demographic VariableCorrelation Coefficient
Age
Young ageN & P (+0.339 **)
Middle ageN & P (+0.214 **)
Economic occupation
Full-timeN & P (+0.224 **)
Part-time/unemployed
RetiredN & P (−0.201 *)
Home-makerN & P (−0.319 *)
StudentN & P (+0.474 **); P & E (−0.421 **)
Gender
YMaleN & P (+0.258 *)
FemaleN & P (+0.425 **)
MMaleN & P (+0.226 *)
FemaleN & P (+0.218 *)
Education level
YNon-tertiaryN & P (+0.402 *); N & O (+0.371 *); N & E (+417 *)
TertiaryN & P (+0.351 **); P & E (−0.216 *)
MTertiaryN & P (+0.318 **); N & O (−0.221 *); P & O (−0.385 **)
Family status
YNot marriedN & P (+0.358 **); P & E (−0.232 *)
Married, no childrenP & E (+0.797 **)
MNot marriedN & P (+0.378 *)
Married, no childrenP & S (+0.491 **)
OMarried, no childrenP & O (+0.565 **)
Married, with childrenN & S (+0.218 *)
Birthplace
YHKN & P (+0.370 **)
MHKN & P (+0.284 **)
OHKP & O (+0.309 **); P & S (+0.386 **); P & E (+0.479 **); O & S (+0.320 **)
Outside HKP & O (−0.270 **); P & E (−0.279 **); O & S (−0.227 *)
1 The five activity clusters were coded: N for nature-enjoyment cluster, P for personal cluster, O for outdoor cluster, S for social cluster, and E for physical-exercise cluster. The number in brackets indicates the correlation coefficient, with statistical significance at * for p < 0.05 and ** for p < 0.01. Only significant relationships with a correlation coefficient ≥0.2 are listed.
Table 6. The correlations between the respondents’ engagement level in five activity clusters 1 and visiting patterns with reference to six socio-demographic factors, determined by Spearman’s correlation coefficients of the PCA component scores and ordinal level of the visit frequency of summer/warm periods (Vw) and winter/cool periods (Vc), stay duration (Sd) and travel time (Tt).
Socio-Demographic VariableCorrelation Coefficient
Age
Young ageO & Vw/Vc (+0.289 **/+0.272 **); E & Vw/Vc (+0.214 */+0.252 **)
Old ageN & Vw (+0.269 **); P & Vw/Vc (−0.320 **/−0.256 **); E & Tt (−0.227 **)
Economic occupation
Full-timeO & Sd (+0.204 **)
Part-time/unemployedO & Sd (+0.302 *)
RetiredN & Vw/Vc (+0.388 **/+0.314 **); P & Vw (−0.233 *); S & Tt (−0.202 *);
E & Sd/Tt (−0.217 */−0.362 *)
Home-makerE & Vw/Vc/Sd (+0.320 */+0.315 */+0.374 *)
StudentO & Vw/Vc (+0.342 **/0.371 **); S & Vw (−0.284 *); E & Vw/Vc (+0.269 */0.275 *)
Gender
YMaleN & Vw (+0.331 **); O & Vw/Vc (+0.327 **/0.288 *); E & Vc (0.346 **)
FemaleO & Vw/Vc/ Sd (+0.259 */+0.256 */+0.255 *)
MMaleP & Tt (−0.249 *)
OMaleN & Vw/Vc (+0.286 */0.281 **); P & Vw/Vc/Sd (−0.376 **/−0.264 **/−0.291 **);
E & Tt (−0.306 **)
FemaleN & Vw (+0.263 *); P & Vw/Vc (−0.289 */0.253 *); O & Tt (−0.246 *)
Education level
YNon-tertiaryE & Vc (+0.395 *)
TertiaryO & Vw/Vc (+0.273 **/0.242 *); E & Vc (+0.220 *)
MNon-tertiaryP & Tt (−0.267 *)
TertiaryP & Sd (−0.249 *)
ONon-tertiaryN & Vw (+0.260 **); P & Vw/Vc (−0.313 **/0.233 **); E & Tt (−0.207 *)
TertiaryN & Vc (+0.410 *); E & Tt (−0.479 *)
Family status
YNot marriedN & Vw (+0.242 **); O & Vw/Vc (+0.281 **/0.258 **); E & Vw/Vc (+0.200 */0.235 *)
Married, no childrenS & Sd (+0.769 **)
Married, with childrenP & Tt (+0.820 *)
MMarried, no childrenN & Tt (+0.402 **); O & Sd (+0.466 **)
Married, with childrenN & Vw (+0.285 *); E & Vc/Tt (+0.227 */−0.242 *)
ONot marriedN & Vw (+0.388 *); P & Vw (−0.381 *); O & Tt (−0.364 *)
Married, no childrenN & Tt (+0.456 *); P & Vw/Vc/Sd (−0.532 */−0.522 */−0.642 *); O & Sd (−0.528 *);
S & Sd (−0.644 **); E & Sd (−0.463 *)
Married, with childrenN & Vw/Vc (+0.289 **/0.214 *); P & Vw/Vc (−0.285 **/−0.257 **)
Birthplace
YHKN & Vw (+0.225 *); O & Vw/Vc (+0.326 **/+0.303 **); E & Vw/Vc (+0.212 */0.263 **)
Outside HKN & Sd (−0.498 *)
MOutside HKN & Sd (−0.422 *); S & Sd (+0.449 *)
OHKN & Vw/Vc (+0.263 */0.234 *); P & Vw/Vc/Sd (−0.284 **/−0.248 */−0.389 **);
S & Tt (−0.275 **); E & Tt (−0.233 *)
Outside HKN & Vw (+0.216 *); P & Vw/Vc (−0.340 **/−0.281 **); O & Tt (−0.228 *); E & Tt (−0.224 *)
1 The five activity clusters were coded: N for nature-enjoyment cluster, P for personal cluster, O for outdoor cluster, S for social cluster, and E for physical-exercise cluster. The number in brackets indicates the correlation coefficient, with statistical significance at * for p < 0.05 and ** for p < 0.01. Only significant relationships with a correlation coefficient ≥0.2 are listed.
Publisher’s Note: MDPI stays neutral with regard to jurisdictional claims in published maps and institutional affiliations.

