Article

Screening of Key Indices and the Gene Transcriptional Regulation Analysis Related to Salt Tolerance in Salix matsudana Seedlings

1
Taishan Mountain Forest Ecosystem Research Station, Key Laboratory of State Forestry Administration for Silviculture of the Lower Yellow River, Shandong Agricultural University, Tai’an 271018, China
2
Dongying Landscaping Center (Shandong), Dongying 257091, China
*
Author to whom correspondence should be addressed.
Forests 2022, 13(5), 754; https://doi.org/10.3390/f13050754
Submission received: 2 April 2022 / Revised: 8 May 2022 / Accepted: 11 May 2022 / Published: 13 May 2022
(This article belongs to the Special Issue Strategies for Tree Improvement under Stress Conditions)

Abstract

:
Pot experiments were performed to comparatively study the differences in 16 salt tolerance indices between the seedlings of six Salix matsudana clones under the stress of various concentrations of NaCl (0, 0.1%, 0.3%, 0.5%, and 0.7%), including the salt injury index, shoot fresh weight, root fresh weight, leaf water content, relative conductivity, malondialdehyde content, and antioxidant enzyme activity. The salt-tolerant clones and key indices of salt tolerance were selected. Transcriptome sequencing analysis was performed on the selected salt-tolerant and salt-sensitive clones under salt stress, and the links between the physiological indices of salt tolerance and gene expression were analyzed. Results: (1) Superoxide dismutase (SOD), peroxidase (POD), chlorophyll, and net photosynthetic rate were closely related to the salt tolerance of Salix matsudana at the seedling stage. The regression equation was constructed as follows: salt tolerance index (y) = 0.224x10 + 0.216x11 + 0.127x12 + 0.191x7 − 0.187 (x10 = chlorophyll, x11 = SOD, x12 = POD, x7 = net photosynthetic rate). (2) The number of differentially expressed genes between the seedlings of salt-tolerant and salt-sensitive clones varied with the time of exposure (0 h, 4 h, 12 h, and 24 h) to 200 mmol·L−1 NaCl stress. The most differentially expressed genes in Sm172 were detected upon 24 h vs. 4 h of salt treatment, while the most in Sm6 were in the 24 h vs. 0 h comparison. Gene Ontology analysis and Kyoto Encyclopedia of Genes and Genomes analysis showed that several differentially expressed genes were involved in carotenoid biosynthesis and plant mitogen-activated protein kinase signaling pathways. The nine highly expressed transcription factor genes (Sm172-f2p30-2392, Sm172-f2p28-2386, Sm6-f8p60-2372, Sm6-f2p39-2263, Sm6-f16p60-2374, Sm6-f3p60-931, Sm6-f2p60-1067, Sm172-f3p54-1980, and Sm172-f3p54-1980) were closely correlated with the four key indices of salt tolerance. These genes could become genetic resources for salt tolerance breeding of Salix matsudana.

1. Introduction

The coastal saline-alkali land of the Yellow River Delta suffers frequent natural disasters, soil salinization, and great difficulty in afforestation, which restricts the growth of many tree species [1,2,3]. The selection of salt-tolerant afforestation tree species is a key measure to improving the outcome of afforestation. Willow (Salix matsudana) is a native arbor species naturally distributed in this area that has a certain tolerance to salt. Selection and breeding of improved willow varieties could greatly help with the construction of shelter forests in the Yellow River Delta.
Early studies on salt resistance in willows have focused on their salt resistance ability and physiological characteristics. Salix matsudana can grow in a culture medium with a NaCl concentration of 0.1–0.2 g L−1, whereas the salt stress caused by 0.4 g L−1 NaCl significantly inhibits its growth [4]. Salt stress damages the stems and leaves of willow [5]; reduces its growth increment, biomass, and leaf water content [6]; and causes ion toxicity, osmotic stress, and secondary oxidative stress to the plant, thereby hindering its photosynthesis, growth, and metabolism [7]. When osmotic stress occurs, osmotic adjustment substances (soluble sugars and soluble proteins) accumulate in plant cells to maintain a higher water potential [8,9]. Osmotic stress and the toxicity of excessive Na+ will cause the accumulation of reactive oxygen species in plants [10]. The antioxidant enzyme system (including superoxide dismutase (SOD) and peroxidase (POD)) in plants will be activated [11], which scavenges peroxide ions and reduces the oxidative damage to the cells [12,13].
As molecular biology techniques have advanced, research on the salt tolerance of willows has advanced to the molecular level. Qiao et al. analyzed the salt-stress-responsive proteome of Salix matsudana [14]. Zhou et al. discovered significantly different miRNA expressions between salt-sensitive and salt-tolerant Salix matsudana under various salt stress conditions [15]. Chen et al. identified candidate genes for salt stress response in Salix matsudana [16]. Shan et al. found that the physiological and metabolic processes of plants could be regulated by controlling salt-stress-related genes [17]. Yang et al. [18] found that in a high-salt environment, the upregulation of H+-ATPase gene expression in vacuoles led to cytoplasmic sequestration of Na+ [19]. Plants also respond to salt stress by regulating the expression of salt-tolerance-related transcription factors such as WRKY, MYB, and basic helix-loop-helix (BHLH) [20,21,22].
With the gradual maturation of sequencing technology, research based on transcriptome sequencing has expanded from animals to plants. Transcriptomic research in plants has mainly focused on stress resistance, regulation of physiological mechanisms, and nutrient utilization. Studies on stress resistance mainly focus on salt and alkali tolerance, disease resistance, and drought resistance [23,24,25,26]. Transcriptome sequencing plays an increasingly important role in mining the salt tolerance genes of plant species, such as Jatropha curcas, citrus, cotton, wheat, and rose [27,28,29,30,31,32]. The application of third-generation single-molecule sequencing technology reduces the difficulty of analyzing the nonparametric transcriptome and allows for the easy sequencing of the complete genome and full-length transcripts, making the in-depth study of transcription mechanisms more convenient. However, there have been few studies on the relationship between the physiological salt-stress-responsive indices and the molecular mechanism of salt tolerance that have used third-generation sequencing technology and have applied the findings to the breeding of salt-tolerant varieties.
The present study examined 16 salt-tolerance-related indices in seedlings of Salix matsudana. On this basis, correlation analysis, grey cluster analysis, principal component analysis, and stepwise regression analysis were performed to screen out the key indices, pick the salt-tolerant and salt-sensitive Salix matsudana clones, and derive the equation that accurately reflected the salinity resistance of Salix matsudana. Transcriptome analysis was carried out on the selected salt-tolerant and salt-sensitive clones. The pathways involved in the salt tolerance of Salix matsudana and their relevant genes were identified on the basis of the differentially expressed genes and the key indices of salt tolerance. Eventually, an identification method of salt tolerance that was stable and efficient in both the physiological and molecular aspects was established for Salix matsudana at the seedling stage. This study might provide a theoretical and technical basis for the selection and breeding of improved varieties that can tolerate the salinity of coastal saline-alkali land.

2. Materials and Methods

2.1. Experimental Materials

The research objects included a total of five willow clones: the improved salt-tolerant varieties Luliu 2 and Luliu 6, which were registered by the Shandong Academy of Forestry Sciences, as well as three unapproved clones with good traits (preliminarily named Jinan 1, Jinan 2, and Binzhou 1) in the experimental forest of Jinan, Shandong Province. The widely popular Willow No. 172 was used as the control. We numbered Luliu 2, Luliu 6, Jinan 1, Jinan 2, Binzhou 1, and Willow No. 172 as Sm2, Sm6, SmA, SmB, SmC, and Sm172 for this paper, respectively. The branches used in this study were collected from the experimental forest of Xicang Village, Changqing District, Jinan City, Shandong Province.

2.2. Experimental Methods

(1) Pot experiment: In April 2017, potted seedlings were cultivated with sieved soil. The soil was taken from the Forestry Experimental Station of Shandong Agricultural University. Before loading, it was screened to remove impurities and homogenized. The soil is sandy loam with a pH of 7.05 ± 0.03, a total nitrogen content of 1.27 ± 0.14 g·kg−1, the hydrolyzable nitrogen content of 94.36 ± 13.89 mg·kg−1, the available phosphorus content of 32.01 ± 4.10 mg·kg−1, the available potassium content of 56.72 ± 7.83 mg·kg−1, and the organic matter content of 16.27 ± 2.39 g·kg−1. The cuttings of Salix matsudana clones Sm6 and Sm172 were selected and planted into greenhouse flowerpots at the Forestry Experimental Station of Shandong Agricultural University. The upper diameter of the flowerpots was 30 cm, the lower diameter was 20 cm, and the height was 25 cm. The weight of the soil in each pot was 10 kg. After planting, each cutting protruded approximately 2 cm above the soil surface. Regular watering management was conducted during the study. After the cuttage seedlings survived, the weak seedlings were eliminated in July 2017, while the seedlings that grew well and had no obvious diseases and pests were selected for experiments. The greenhouse was equipped with a water curtain, fan, and other temperature control equipment. During the experiment, the day and night temperatures in the greenhouse were controlled at (25 ± 2) °C and (20 ± 2) °C respectively, and the relative humidity was 65–70%.
Soil salinity was determined by the gravimetric method. A soil salinity gradient (0.1%, 0.3%, 0.5%, and 0.7%) was prepared, and deionized water was used as the blank control. First, the mass of NaCl needed for each stress level was calculated. NaCl solutions with the corresponding concentrations were prepared in deionized water and added three times in equal amounts (irrigation once every 7 days). A tray was placed below each pot to prevent the loss of salt. The physiological and biochemical indices were measured 15 days after the last addition of the salt.
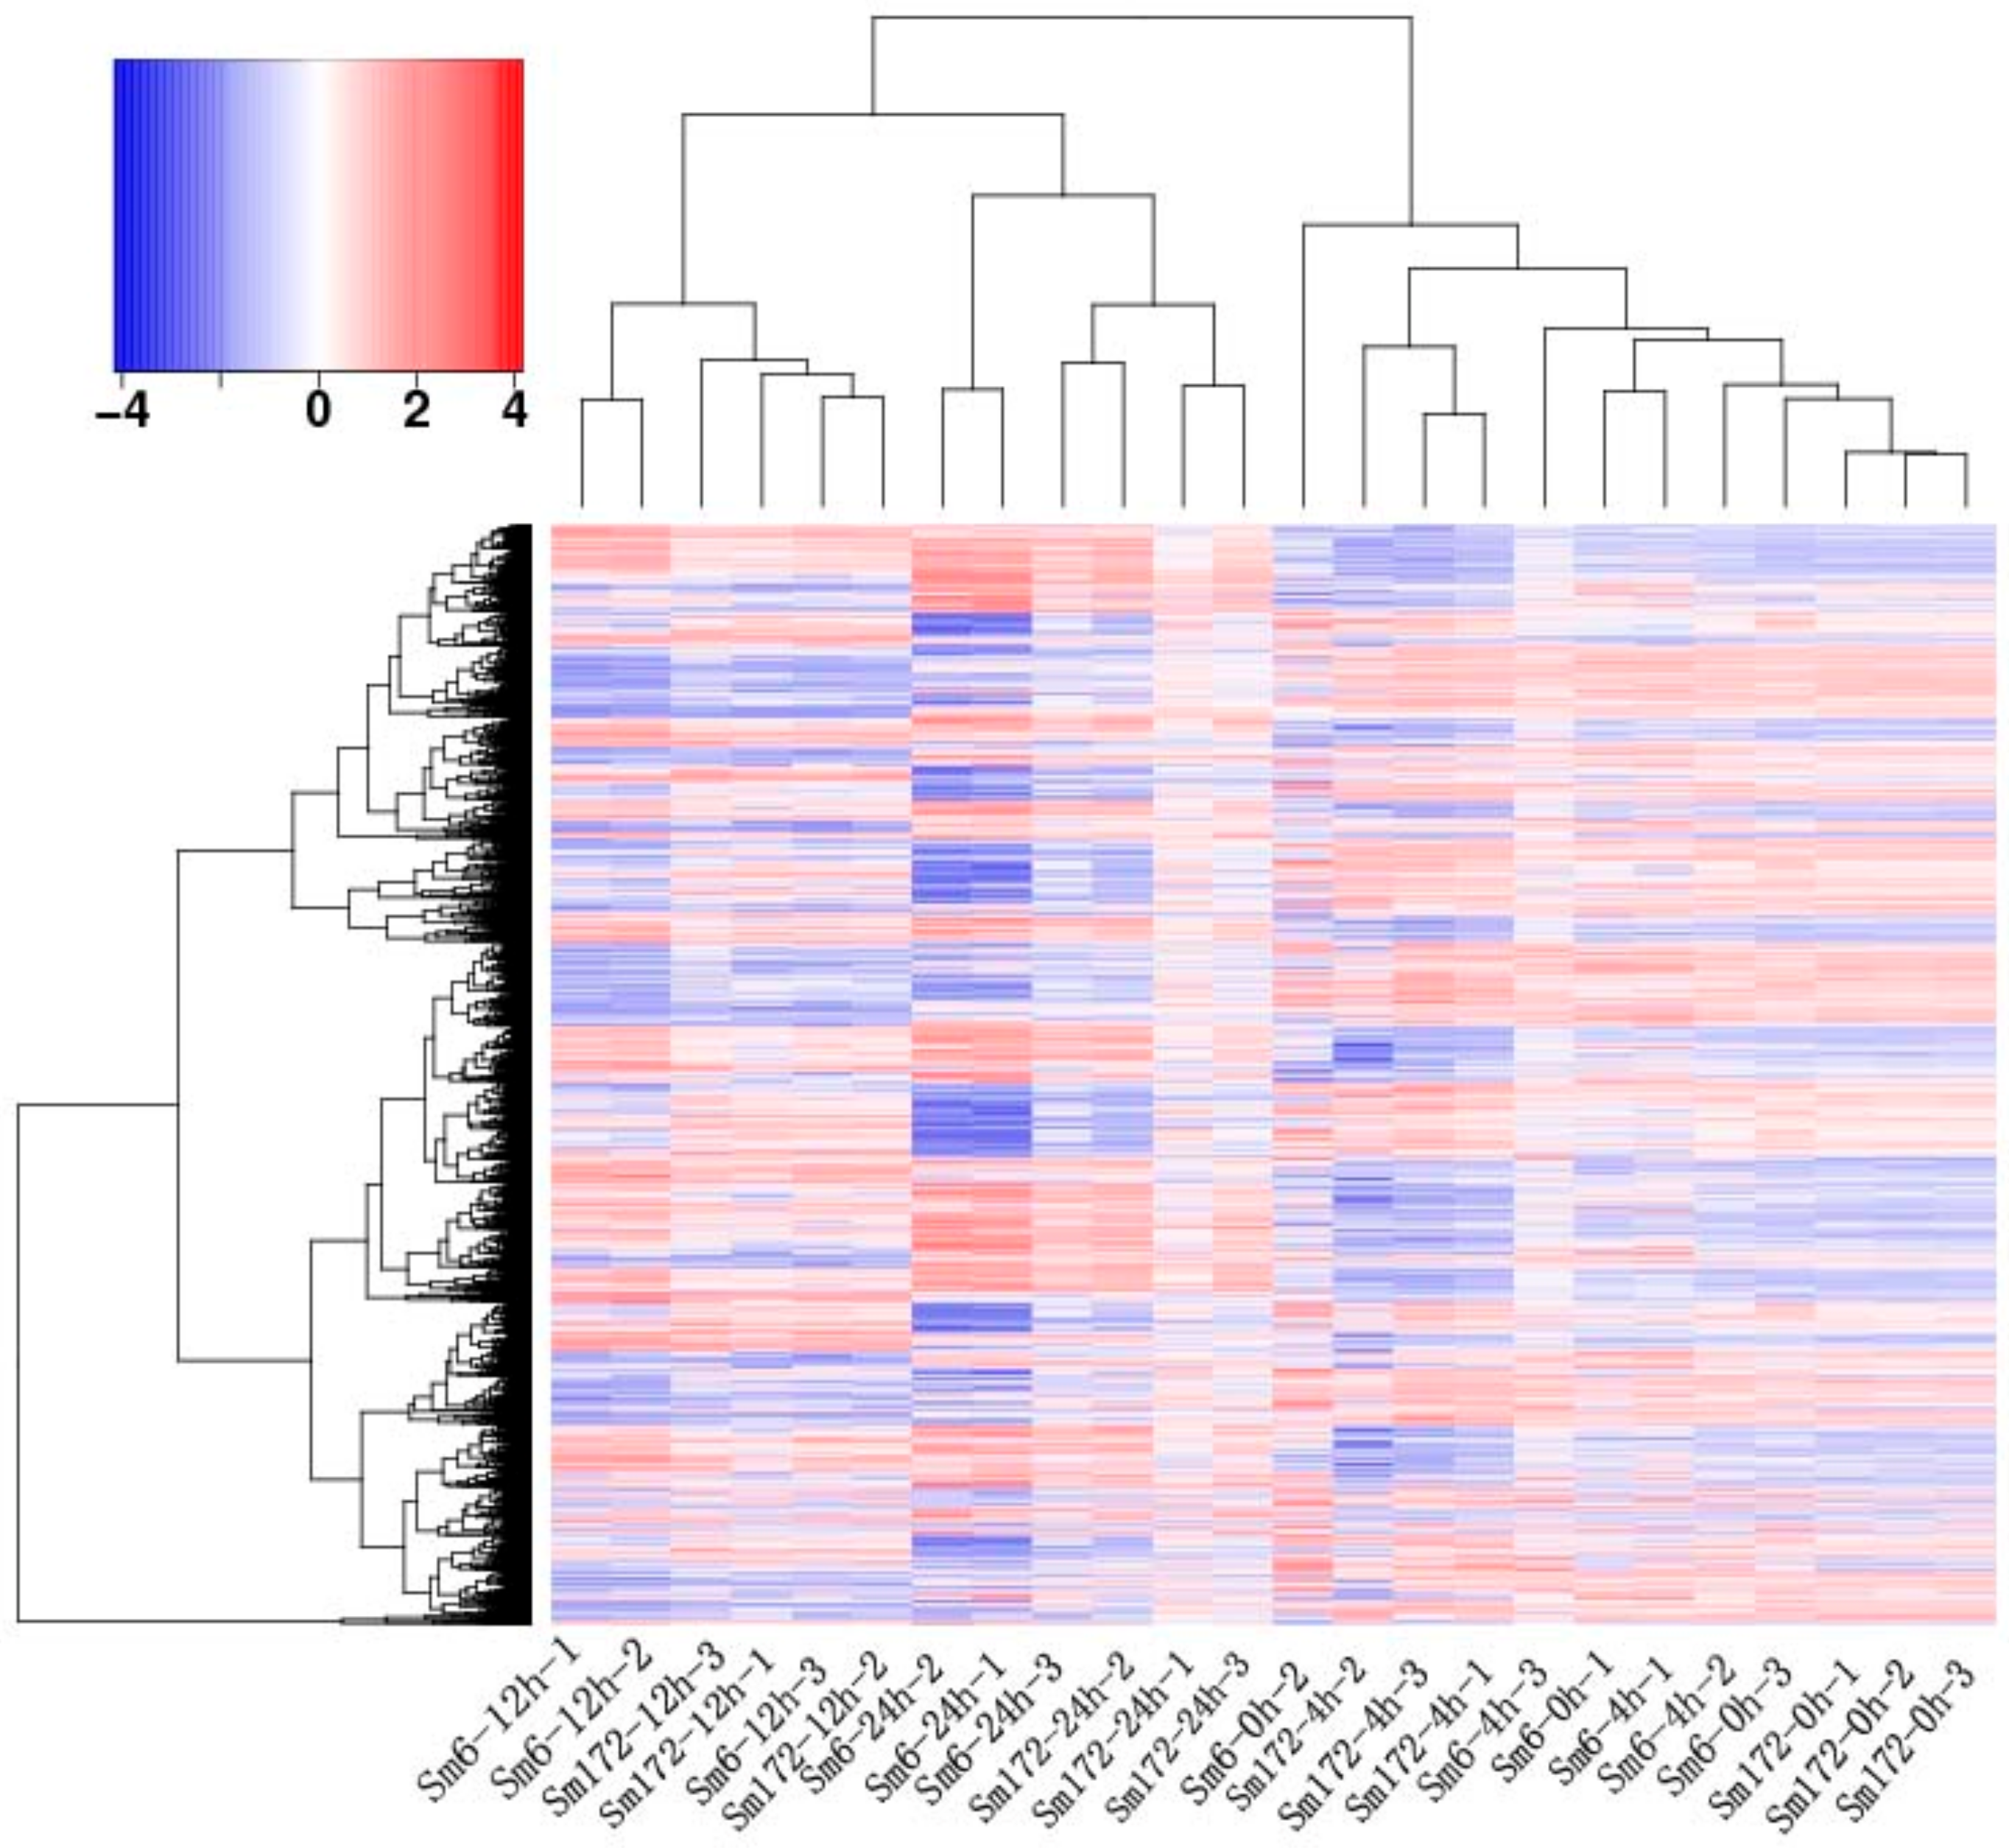
(2) Transcriptome analysis: Transcriptome sequencing was performed using a combination of second-generation and third-generation sequencing technologies. Normally growing Sm6 and Sm172 adult plants (one each) were selected. Several branches with similar growth were cut at a length of approximately 15 cm. The cuttings were placed in beakers filled with deionized water and cultivated in a constant-temperature light incubator. After the branches took root and grew new leaves, various groups of branches were soaked in 200 mmol·L−1 NaCl solution for 0, 4, 12, and 24 h. The leaves were collected from all groups immediately after the soaking treatment. During sampling, leaves were collected from 3 plants in each group and mixed. Immediately after collection, the samples were placed in liquid nitrogen and then stored in a −80 °C freezer. The samples were saved for procedures such as RNA extraction.

2.3. Determination of Salt Tolerance Indices and Data Analysis

We grouped the indices related to the salt tolerance of Salix matsudana into four groups, salt injury indices, physiological and biochemical indices, biomass indices, and photosynthetic indices (Table 1), and used them to establish the standard equation of salt tolerance index. The root fresh weight (RFW), shoot fresh weight (SFW), relative leaf water content (RWC), relative seedling height (RH), and relative diameter (RD) were determined according to the method developed by Chen et al. [33]. The chlorophyll content was measured following Wang et al. [34]. Using a portable photosynthesis system (CIRAS-2), the net photosynthetic rate (Pn), stomatal conductance (GS), and intercellular CO2 concentration (Ci) were measured between 9:00 a.m. and 11:00 a.m. at a saturated light intensity of 1200 μmol·m−2s−1 and a leaf chamber temperature of 25 °C. The relative conductivity (RC) and malondialdehyde (MDA) content were determined as described by Qin et al. [35]. The activities of peroxidase (POD) and superoxide dismutase (SOD) were determined following Li et al., and the contents of soluble sugar (SS) and starch (SST) were determined according to Wang et al. [36,37].
All statistical analyses were conducted using Statistical Product Service Solutions for Windows 22.0 (SPSS, Chicago, IL, USA).

2.4. Sequencing Method and Analysis

Leaf RNA was extracted, and a cDNA library was constructed. Second-generation sequencing was performed on the Illumina HiSeq high-throughput sequencing platform. The third-generation full-length transcriptome sequencing was performed by Anoroad Gene Technology Co., Ltd. (Beijing, China) with the PacBio Sequel sequencer. Sequencing quality was assessed using FastQC. Functional annotation was performed with Trinotate. GO classification was performed with BLAST2GO. COG classification was performed using eggNOG. Metabolic pathway analysis was performed using the KEGG. Differential expression analysis was conducted with DESeq. The GO classification of the differentially expressed Unigene and Pathway enrichment analysis were performed using GOseq.

2.5. Verification of the Differentially Expressed Genes

RNAs were extracted from Sm6 and Sm172 that had received salt treatment for 0, 4, 12, or 24 h. The RNAs were reverse-transcribed, and 12 randomly selected salt-tolerance-related genes of Salix matsudana were subjected to real-time fluorescence quantitative verification. The polymerase chain reaction (PCR) system (20 μL) was set up as follows: SYBR Green 10 μL, forward primer (10 mM) 1 μL, reverse primer (10 mM) 1 μL, cDNA 2 μL, and ddH2O to a total volume of 20 μL. The PCR conditions were as follows: predenaturation at 95 °C for 30 s and 40 cycles of denaturation at 95 °C for 5 s and optimal annealing temperature 60 °C for 30 s.

3. Results

3.1. Comprehensive Evaluation of the Salt Tolerance of Salix matsudana Clones at the Seedling Stage

3.1.1. Analysis of Variance of Salt Tolerance Index between NaCl Treatment Concentration and Tree Species

Analysis of variance (Table 2) showed that all indexes showed significant or extremely significant differences under different NaCl concentrations and among different clones. Analysis of variance showed that the data of the indicators selected in this test were reliable.

3.1.2. Analysis of the Correlation between Salt Resistance Capability and Salt Tolerance Index

Correlation analysis of the 16 indices (Table 3) showed that there were various degrees of correlation between the indices in Salix matsudana exposed to salt stress. The salt injury index was positively correlated with the intercellular concentrations of CO2 and malondialdehyde and negatively correlated with stomatal conductance, net photosynthetic rate, chlorophyll, biomass, and growth weight. The range of change varied between the indices, indicating that the results might be one-sided if single indices were used to evaluate the salt tolerance of Salix matsudana. The salt tolerance of Salix matsudana is a complex comprehensive trait.

3.1.3. Grey Relational Cluster Analysis of the Indices of Various Clones

The grey correlation degree was calculated from the membership function values of the relative values of the 16 indices of the six varieties (Table 4), and the indices were subjected to cluster analysis. At a fixed critical value r ∈ (0,1), the index xi and the index xj were considered to be the same type of index when ξij ≥ r (i ≠ j). In this experiment, the critical value r = 0.57 was used to screen out two types of index clusters: C1 = {x4, x8, x11, x12, x14, x15, x16} and C2 = {x1, x2, x3, x5, x6, x7, x9, x10, x13}. In the above classification, leaf water content, intercellular CO2 concentration, SOD, POD, electrical conductivity, soluble sugar, and soluble starch were classified into one category, while the salt injury index, chlorophyll content, shoot fresh weight, root fresh weight, seedling height growth, ground diameter growth, stomatal conductance, net photosynthetic rate, and malondialdehyde were classified into another category. Table 5 shows that these two types of indices contributed different amounts to the comprehensive evaluation of salt tolerance.

3.1.4. Principal Component Analysis of the Two Types of Indices

Since the cumulative variance contribution rates of the two types of indices were both greater than 85% (85.94% and 87.15%, respectively), these indices could be subjected to principal component analysis (Table 6). To evaluate the salt tolerance of the examined varieties, the comprehensive salt tolerance value (S) of each variety was calculated from the scores of the two types of indices obtained by principal component analysis (S = F1 × W1 + F2 × W2). The scoring formula for the C1 comprehensive indices was F1 = hc1 × yc1, while the scoring formula for C2 comprehensive indices was F2 = hc2 × yc2. The weight coefficient of principal components (h) was generally expressed as the variance contribution rate (namely, hc1 = 0.8594, hc2 = 0.8715). The linear combination of principal components of the C1 and C2 indices was obtained through principal component analysis: yc1 = 0.113x3 + 0.116x10 + 0.124x5 + 0.123x1 + 0.118x9 + 0.121x6 + 0.123x2 + 0.128x7 + 0.112x13; yc2 = −0.15x8 − 0.21x4 + 0.391x11 + 0.013x14 − 0.262x16 − 0.26x15 + 0.344x12. The weight coefficients of the index clusters (w1 = 0.561 and w2 = 0.439) were calculated through the analytic hierarchy process.
The S values are given in Table 6. On the basis of a cut-off value of 0.7, Sm6, Sm2, and SmA of the six Salix matsudana varieties were salt-tolerant, whereas Sm172, SmC, and SmB were salt-sensitive.

3.1.5. Screening of the Identification Indices of Salt Tolerance of Salix matsudana at the Seedling Stage

Using the comprehensive salt tolerance value of the six varieties and the salt-stress-related indices, a regression equation was established to identify the salt tolerance of Salix matsudana at the seedling stage. The equation was used to screen out the identification indices of salt tolerance at the seedling stage. An optimal regression equation was established through stepwise regression analysis using the comprehensive S value as the dependent variable and the relative values of the indices as the independent variables: y = 0.224x10 + 0.216x11 + 0.127x12 + 0.191x7 − 0.187 (r = 0.949, R2 = 0.90), where y is the S index, x10 is chlorophyll, x11 is SOD, x12 is POD, and x7 is Pn. The regressors x10, x11, and x12 were extremely significantly correlated with y (p = 0.009, 0.000, and 0.002, respectively), while x7 was significantly correlated with y (p = 0.034). According to the equation, chlorophyll, SOD, POD, and Pn could be used as key indices to identify the salt tolerance of Salix matsudana at the seedling stage.

3.2. Transcriptome Analysis of Salix matsudana under NaCl Stress

3.2.1. Classification of the Salix matsudana Genes That Were Differentially Expressed in Response to Salt Stress

The second-generation sequencing data were compared and quantified using the full-length transcripts as a reference. The obtained read count was compared between groups, yielding intergroup ratios. The genes with |log2Ratio| ≥ 1 and q < 0.05 were considered significantly differentially expressed genes between two groups. The number of differential genes varied with the duration of salt treatment (Table 7). The differential genes were roughly divided into three major categories on the basis of the clustering results: 12 h salt treatment, 24 h salt treatment, and 0–4 h salt treatment (Figure 1). The results of NT, NR, and BLASTX annotation showed that a greater number of differential genes were annotated at 12 h vs. 0 h, 12 h vs. 4 h, 24 h vs. 0 h, and 24 h vs. 4 h (4362 genes on average). According to the annotation results of the major databases, more than 98.33% of genes in the NT and NR databases were annotated (Table 8).

3.2.2. Pathway Analysis of the Differentially Expressed Genes

All the metabolic pathways in the KEGG were subjected to enrichment analysis using the hypergeometric test. The 20 KEGG metabolic pathways with the most significant enrichment of the differentially expressed genes were identified (Table 9), which gave us an intuitive understanding of the metabolic processes and signal transduction pathways altered in Salix matsudana under salt stress. More differentially expressed genes were detected after 12 h and 24 h of stress treatment, and more metabolic pathways were involved at these times, such as amino acid biosynthesis, plant hormone signal transduction, amino acid and nucleotide sugar metabolism, cysteine and methionine metabolism, mitogen-activated protein kinase (MAPK) signaling pathway, and carbon metabolism. These findings indicate that these metabolic pathways might play an important role in the salt stress response of Salix matsudana.

3.2.3. Salix matsudana Genes Differentially Expressed in Response to Salt Stress and Expression Verification

Analysis of the transcriptome data revealed that Salix matsudana adapted to and resisted salt stress and conducted self-regulation mainly through participating in carotenoid biosynthesis, MAPK signaling, phytohormone signal transduction, flavonoid biosynthesis, starch metabolism, and sucrose metabolism. The differential genes were screened out using a multiple of difference >2 and a corrected p < 0.01. Among the nine differential genes with the most significant gene expression difference, Sm172-f2p30-2392, Sm172-f2p28-2386, Sm6-f8p60-2372, and Sm172-f2p39-2386 were involved in the synthesis of 9-cis-epoxycarotenoid dioxygenase (NCED) and the regulation of NCED and abscisic acid (ABA) contents. Sm6-f2p39-2263 participated in the synthesis of asparagine synthase and positively regulated the response of Salix matsudana to salt stress. Sm6-f16p60-2374 was involved in circadian rhythm and photosensitive processes. Sm172-f3p54-1980 was involved in ABA-activated signaling pathways and was closely related to leaf senescence. Sm6-f3p60-931, Sm6-f2p60-1067, and Sm172-f2p30-1863 were involved in MAPK metabolic pathway. Sm6-f2p60-1067 was related to the PYL gene. It promoted the ABA signal response by inducing PYL overexpression. Sm172-f2p30-1863 was related to the synthesis of protein phosphatase 2C (PP2C). Silencing of Sm172-f2p30-1863 promoted the signal response of ABA. As a result of these changes, Salix matsudana became more sensitive to ABA and more promptly regulated its own response mechanism in the face of stress.
The expression of the nine selected genes was verified by fluorescence-based quantitative PCR. The genes numbered Sm172-f2p30-2392, Sm172-f2p28-2386, Sm6-f8p60-2372, Sm6-f2p39-2263, Sm6-f16p60-2374, Sm6-f3p60-931, Sm6-f2p60-1067, Sm172-f3p54-1980, and Sm172-f3p54-1980 were upregulated. The change trend of the expression of the nine genes was consistent with the results of transcriptome sequencing (Figure 2).

4. Discussion

This study analyzed the chosen indices using a combination of the analytic hierarchy process and principal component analysis, which was more reasonable than directly doing principal component analysis on all indices. SOD, POD, chlorophyll, and net photosynthetic rate may be used as key indices to identify the salt tolerance of Salix matsudana at the seedling stage [38,39,40]. Upon salt stress, the antioxidant enzymes such as SOD and POD were activated in all clones of Salix matsudana, which led to the elimination of the toxicity of free radicals. SOD prevents the formation of free radicals and the damage to cells mainly by regulating the content of O2−. It is the first line of defense against cell damage [39,41]. POD plays an important role in protecting cells from H2O2 stress [42]. In response to salt stress, photosynthesis is reduced in Salix matsudana. The accumulation of photosynthetic products is inhibited, which hinders the growth and development of plants and even causes plant death [43]. As an important photosynthetic pigment, chlorophyll plays an important role in absorption, transmission, and transformation of light energy [3,44,45]. Therefore, the change in chlorophyll content is an important index of plant growth [46]. Salt stress leads to ion toxicity, hinders the absorption of Mg2+ by plants, blocks the synthesis of chlorophyll, reduces chlorophyll content, and thus seriously hinders photosynthesis [47,48,49,50,51]. Such findings are consistent with the research results of Gong et al. [52,53].
Under salt stress, reactive oxygen species activate a variety of MAPK signaling cascades, inducing specific cellular responses. This study found that in Salix matsudana exposed to salt stress, the most strongly expressed MAPK signaling pathway was the mitogen-activated protein kinase (MPK). This study showed that H2O2 phosphorylated mitogen-activated protein kinase kinase 4/5 (MKK4/5) by activating ANP1 upstream of the MPK cascade, thereby phosphorylating MPK3. This result is consistent with the findings of Kim et al. [54] and Kovtun et al. [55]. H2O2 also directly activated MPK3 by inducing the formation of nucleoside diphosphate kinase 2 (NDPK2), in line with the findings of Moon et al. [56]. The serine-threonine protein kinase OXI1 (oxidative-signal-inducible 1) was also activated by peroxide and responded through the downstream MPK3. In the process of cell death caused by reactive oxygen species through the above three pathways, MPK3 is significantly upregulated, and the level of reactive oxygen species (such as H2O2) is increased [57], which eventually leads to cell death. When Salix matsudana is exposed to low salt stress or short-term salt stress, the upregulation of MPK3 and the increase in H2O2 lead to elevated activities of SOD and POD in the antioxidant system, which allows the resistance to the damage of reactive oxygen species and maintenance of normal physiological function of cells. Therefore, improving the activity of antioxidant enzymes in plants and increasing the level of plant antioxidant metabolism are important ways to enhance the salt tolerance of plants. Alleviation of the harm of salt stress to Salix matsudana could be achieved by inhibiting the expression of the MPK3-related gene Sm6-f3p60-931, which suppressed the activity of MPK3 and inhibited the production of reactive oxygen species. This biological process played a certain positive role in the salt stress resistance of Salix matsudana and provided evidence that SOD and POD are key indices of salt tolerance in Salix matsudana.
In addition, this study showed that MPK3 of the MAPK pathway cascade was significantly upregulated under salt stress, which reduced the function of SPEECHLESS (SPCH) and inhibited stomatal development. The basic helix-loop-helix (bHLH)-type transcription factors that regulate stomatal development include three members: SPCH, MUTE, and FAMA. These proteins are involved in the regulation of the initiation of the M cell lineage, the formation of guard mother cells, and the symmetrical division of guard mother cells [58,59]. SPCH has a region between the bHLH domain and the C-terminal region that is rich in the acidic amino acids serine and threonine. It mediates the direct phosphorylation of SPCH by MPK3 [60,61,62], which hinders stomatal development and directly hinders photosynthesis. Therefore, physiological study of Salix matsudana showed that, with more concentrated or longer salt treatment, the net photosynthetic rate was reduced in each Salix matsudana clone. This finding provides evidence that the net photosynthetic rate is a key index of salt tolerance in Salix matsudana.
Moreover, genes with large differences in expression levels are involved in the synthesis of NCED. According to the metabolic pathway map of carotenoid biosynthesis, carotenoid biosynthesis is related to ABA synthesis [54,63]. ABA plays a central role in plant responses to stressful environments [64,65]. In the process of ABA synthesis, zeaxanthin epoxidase catalyzes the conversion of carotene to violaxanthin. NCED further catalyzes the conversion of 9-cis-flavin to xanthotoxin, which further leads to the production of abscisic aldehyde. Abscisic aldehyde is eventually converted into ABA under the action of an amine oxidase. These findings are consistent with the results of Li et al. [23]. NCED is a member of the carotenoid cleavage dioxygenase family. It is the most important rate-limiting enzyme in the process of ABA biosynthesis in higher plants and belongs to a class of key genes involved in the regulation of ABA biosynthesis [66,67]. NCED expression level is positively correlated with ABA content in plants [68,69,70]. Therefore, the goal of plant physiological self-regulation might be achieved through the control of the expression of NCED synthesis-related genes such as Sm172-f2p28-2386, Sm172-f2p30-2392, Sm172-f2p39-2386, and Sm6-f8p60-2372, which further control the expression of NCED and regulate the content of ABA in plants. In future research on the salt tolerance of Salix matsudana, ABA might become a key index.
These data provide a scientific basis for future research on the mechanism of Salix matsudana salt tolerance, deliver a simpler method for the identification and breeding of salt-tolerant Salix matsudana varieties, and can guide the selection of salt-tolerant tree species in the coastal saline-alkali land of the Yellow River Delta.

Author Contributions

Conceptualization, Y.P. and B.C.; formal analysis, P.M.; investigation, Y.G., W.L. and X.C.; data curation, T.W. and L.G.; writing—original draft preparation, Y.P.; writing—review and editing, P.M. and B.C.; visualization, L.G.; supervision, B.C.; funding acquisition, B.C. All authors have read and agreed to the published version of the manuscript.

Funding

This research was funded by the Central Finance Forestry Reform and Development Fund (Forestry Science and Technology Promotion Demonstration Subsidy) ([2020]TG08), the Major Scientific and Technological Innovation in Shandong (2017CXGC0316), and the National Forestry Public Welfare Industry Research Project (201404107).

Institutional Review Board Statement

Not applicable.

Informed Consent Statement

Not applicable.

Data Availability Statement

Not applicable.

Conflicts of Interest

The authors declare no conflict of interest.

References

  1. Liu, P.; Bai, J.; Ding, Q.; Shao, H.; Gao, H.; Xiao, R. Effects of Water Level and Salinity on TN and TP Contents in Marsh Soils of the Yellow River Delta, China. CLEAN–Soil Air Water 2012, 40, 1118–1124. [Google Scholar] [CrossRef]
  2. Liu, S.; Hou, X.; Yang, M.; Cheng, F.; Coxixo, A.; Wu, X.; Zhang, Y. Factors driving the relationships between vegetation and soil properties in the yellow river delta, china. Catena 2018, 165, 279–285. [Google Scholar] [CrossRef]
  3. Xia, J.; Ren, J.; Zhang, S.; Wang, Y.; Fang, Y. Forest and grass composite patterns improve the soil quality in the coastal saline-alkali land of the yellow river delta, china. Geoderma 2019, 349, 25–35. [Google Scholar] [CrossRef]
  4. Li, B.; Ouyang, J.; Wang, J.; Wu, H.; Liu, X.; Zou, J. Effects of NaCl on seedling growth and some physiological characteristics of Salix matsudana Koidz. J. Tianjin Norm. Univ. 2017, 37, 37–42. [Google Scholar]
  5. Dimitriou, I.; Aronsson, P.; Weih, M. Stress tolerance of five willow clones after irrigation with different amounts of landfill leachate. Bioresour. Technol. 2006, 97, 150–157. [Google Scholar] [CrossRef]
  6. Wang, Y.; Yuan, H.W.; Li, M.; Li, Y.J.; Ma, X.J.; Tan, F.; Zhang, J. Phenotypic and physiological responses of two willow varieties to salt stress. Isr. J. Plant Sci. 2013, 61, 73–82. [Google Scholar] [CrossRef]
  7. Yang, Y.; Yan, G. Elucidating the molecular mechanisms mediating plant salt-stress responses. New Phytol. 2018, 217, 523–539. [Google Scholar] [CrossRef] [Green Version]
  8. Hasegawa, P.M. Sodium (Na+) homeostasis and salt tolerance of plants. Environ. Exp. Bot. 2013, 92, 19–31. [Google Scholar] [CrossRef]
  9. Munns, R.; Tester, M. Mechanisms of salinity tolerance. Annu. Rev. Plant Biol. 2008, 59, 651–681. [Google Scholar] [CrossRef] [Green Version]
  10. Zhang, M.; Smith, J.A.C.; Harberd, N.P.; Jiang, C. The regulatory roles of ethylene and reactive oxygen species (ROS) in plant salt stress responses. Plant Mol. Biol. 2016, 91, 651–659. [Google Scholar] [CrossRef]
  11. Foyer, C.H.; Shigeoka, S. Understanding oxidative stress and antioxidant functions to enhance photosynthesis. Plant Physiol. 2011, 155, 93–100. [Google Scholar] [CrossRef] [PubMed] [Green Version]
  12. Meloni, D.A.; Oliva, M.A.; Martinez, C.A.; Cambraia, J. Photosynthesis and activity of superoxide dismutase, peroxidase and glutathione reductase in cotton under salt stress. Environ. Exp. Bot. 2003, 49, 69–76. [Google Scholar] [CrossRef]
  13. Barba-Espín, G.; Clemente-Moreno, M.J.; Álvarez, S.A.; García-Legaz, M.F.; Hernández, J.A.; Díaz-Vivancos, P. Salicylic acid negatively affects the response to salt stress in pea plants. Plant Biol. 2011, 13, 909–917. [Google Scholar] [CrossRef] [PubMed]
  14. Qiao, G.; Zhang, X.; Jiang, J.; Liu, M.; Han, X.; Yang, H.; Zhuo, R. Comparative proteomic analysis of responses to salt stress in chinese willow (Salix matsudana koidz). Plant Mol. Biol. Rep. 2014, 32, 814–827. [Google Scholar] [CrossRef]
  15. Zhou, J. Changes of miRNA Expression in Populus Euphratica and Salix Mandshurica under Salt Stress; Chinese Academy of Forestry: Beijing, China, 2010. [Google Scholar]
  16. Chen, Y.; Jiang, Y.; Chen, Y.; Feng, W.; Liu, G.; Yu, C.; Lian, B.; Zhong, F.; Zhang, J. Uncovering candidate genes responsive to salt stress in Salix matsudana (koidz) by transcriptomic analysis. PLoS ONE 2020, 15, e0236129. [Google Scholar] [CrossRef]
  17. Shan, L.; Zhao, S.; Xia, G. Research Progress on the Identification of Salt-tolerance Related Genes and Molecular Mechanism on Salt Tolerance in Higher Plants. Mol. Plant Breed. 2006, 4, 15. [Google Scholar]
  18. Yang, H.B.; Dung, C.H.; Xu, X.F.; Wang, Y.; Han, Z.H. Effects of NaCl and Iso-osmotic polyethylene glycol stress on Na+/H+ antiport activity of three malus species with different salt tolerance. J. Integr. Agric. 2014, 13, 1276–1283. [Google Scholar] [CrossRef]
  19. Yang, Y.Q.; Han, X.L.; Ma, L.; Wu, Y.J.; Liu, X.; Fu, H.Q.; Liu, G.Y.; Lei, X.G.; Guo, Y. Dynamic changes of phosphatidylinositol and phosphatidylinositol 4-phosphate levels modulate H+-atpase and Na+/H+ antiporter activities to maintain ion homeostasis in arabidopsis under salt stress. Mol. Plant 2021, 14, 2000–2014. [Google Scholar] [CrossRef]
  20. Filiz, E.; Kurt, F. Expression and co-expression analyses of WRKY, MYB, bHLH and bZIP transcription factor genes in potato (Solanum tuberosum) under abiotic stress conditions: RNA-seq data analysis. Potato Res. 2021, 64, 721–741. [Google Scholar] [CrossRef]
  21. Das, A.; Pramanik, K.; Sharma, R.; Gantait, S.; Banerjee, J. In-silico study of biotic and abiotic stress-related transcription factor binding sites in the promoter regions of rice germin-like protein genes. PLoS ONE 2019, 14, e0211887. [Google Scholar] [CrossRef]
  22. Mokhtari, F.; Rafiei, F.; Shabani, L.; Shiran, B. Differential expression pattern of transcription factors across annual medicago genotypes in response to salinity stress. Biol. Plant. 2017, 61, 227–234. [Google Scholar] [CrossRef]
  23. Li, H.; Li, D.F.; Chen, A.G.; Tang, H.J.; Li, J.J.; Huang, S.Q. RNA-seq for comparative transcript profiling of kenaf under salinity stress. J. Plant Res. 2017, 130, 365–372. [Google Scholar] [CrossRef] [PubMed] [Green Version]
  24. Okay, S.; Derelli, E.; Unver, T. Transcriptome-wide identification of bread wheat wrky transcription factors in response to drought stress. Mol. Genet. Genom. 2014, 289, 765–781. [Google Scholar] [CrossRef] [PubMed]
  25. Meng, C.; Quan, T.Y.; Li, Z.Y.; Cui, K.L.; Yan, L.; Liang, Y.; Dai, J.L.; Xia, G.M.; Liu, S.W. Transcriptome profiling reveals the genetic basis of alkalinity tolerance in wheat. BMC Genom. 2017, 18, 24. [Google Scholar] [CrossRef] [PubMed] [Green Version]
  26. Kumar, S.; Kanakachari, M.; Gurusamy, D.; Kumar, K.; Narayanasamy, P.; Venkata, P.K.; Solanke, A.; Gamanagatti, S.; Hiremath, V.; Katageri, I.S.; et al. Genome-wide transcriptomic and proteomic analyses of bollworm-infested developing cotton bolls revealed the genes and pathways involved in the insect pest defence mechanism. Plant Biotechnol. J. 2016, 14, 1438–1455. [Google Scholar] [CrossRef] [Green Version]
  27. Zhang, F.; Zhu, G.; Du, L.; Shang, X.; Cheng, C.; Yang, B.; Hu, Y.; Cai, C.; Guo, W. Genetic regulation of salt stress tolerance revealed by RNA-seq in cotton diploid wild species, gossypium davidsonii. Sci. Rep. 2016, 6, 20582. [Google Scholar] [CrossRef] [Green Version]
  28. Chen, M.-S.; Zhao, M.-L.; Wang, G.-J.; He, H.-Y.; Bai, X.; Pan, B.-Z.; Fu, Q.-T.; Tao, Y.-B.; Tang, M.-Y.; Martínez-Herrera, J.; et al. Transcriptome analysis of two inflorescence branching mutants reveals cytokinin is an important regulator in controlling inflorescence architecture in the woody plant jatropha curcas. BMC Plant Biol. 2019, 19, 468. [Google Scholar] [CrossRef]
  29. Goyal, E.; Amit, S.K.; Singh, R.S.; Mahato, A.K.; Chand, S.; Kanika, K. Transcriptome profiling of the salt-stress response in Triticum aestivum cv. Kharchia local. Sci. Rep. 2016, 6, 27752. [Google Scholar] [CrossRef] [Green Version]
  30. Amirbakhtiar, N.; Ismaili, A.; Ghaffari, M.R.; Firouzabadi, F.N.; Shobbar, Z.S.; Jain, M. Transcriptome response of roots to salt stress in a salinity-tolerant bread wheat cultivar. PLoS ONE 2019, 14, e0213305. [Google Scholar] [CrossRef]
  31. Tian, X.; Wang, Z.; Zhang, Q.; Huacong, C.; Wang, P.; Lu, Y.; Jia, G.; Sara, A. Genome-wide transcriptome analysis of the salt stress tolerance mechanism in Rosa chinensis. PLoS ONE 2018, 13, e0200938. [Google Scholar] [CrossRef]
  32. Xie, R.; Pan, X.; Zhang, J.; Ma, Y.; He, S.; Zheng, Y.; Ma, Y. Effect of salt-stress on gene expression in citrus roots revealed by RNA-seq. Funct. Integr. Genom. 2017, 18, 155–173. [Google Scholar] [CrossRef] [PubMed]
  33. Chen, Y.; Li, C.; Lei, C.; Yi, J.; Gong, M. Identification and Comprehensive Evaluation of Drought Tolerance in Diploid Potato, S. phureja Germplasm Resources. Mol. Plant Breed. 2019, 17, 3416. [Google Scholar] [CrossRef]
  34. Wang, Z.; Li, M.; Hao, R.L.; Chen, L.Q.; Han, Y.Q.; Zhang, B. Comparison of photosynthetic characteristics of broomcorn millet spike mutants. J. Shanxi Agric. Sci. 2020, 48, 879–883. [Google Scholar] [CrossRef]
  35. Qin, Y. Study on Cold Resistance of Introduced Ornamental Bamboo Species in Shandong Province. Master’s Thesis, Shandong Agricultural University, Tai’an, China, 2014. [Google Scholar]
  36. Li, H.S. Principles and Techniques of Plant Physiological and Biochemical Experiments; Higher Education Press: Beijing, China, 2000; pp. 164–165. [Google Scholar]
  37. Wang, X.Y.; Wang, S.L.; Tang, Y.; Zhou, W.M.; Zhou, L.; Zhong, Q.L.; Dai, L.M.; Yu, D.P. Characteristics of non-structural carbohydrate reserves of three dominant tree species in broadleaved korean pine forest in Changbai mountain, China. Chin. J. Appl. Ecol. 2019, 30, 1608–1614. [Google Scholar] [CrossRef]
  38. Yu, C.W.; Guan, Z.Q.; Hong, Y.L.; Wu, Y.J.; Wang, C.; Liu, G.F.; Yang, C.P. Enhanced salt tolerance of transgenic poplar plants expressing a manganese superoxide dismutase from tamarix androssowii. Mol. Biol. Rep. 2010, 37, 1119–1124. [Google Scholar] [CrossRef]
  39. Foyer, C.H.; Noctor, G. Redox signaling in plants. Antioxid. Redox Signal. 2013, 18, 2087–2090. [Google Scholar] [CrossRef]
  40. Kravchik, M.; Bernstein, N. Effects of salinity on the transcriptome of growing maize leaf cells point at cell-age specificity in the involvement of the antioxidative response in cell growth restriction. BMC Genom. 2013, 14, 24. [Google Scholar] [CrossRef] [Green Version]
  41. Amor, N.B.; Jiménez, A.; Megdiche, W.; Lundqvist, M.; Sevilla, F.; Abdelly, C. Response of antioxidant systems to nacl stress in the halophyte cakile maritima. Physiol. Plant. 2010, 126, 446–457. [Google Scholar] [CrossRef]
  42. Chaparzadeh, N.; D’Amico, M.L.; Khavari-Nejad, R.A.; Izzo, R.; Navari-Izzo, F. Antioxidative responses of Calendula officinalis under salinity conditions. Plant Physiol. Biochem. 2004, 42, 695–701. [Google Scholar] [CrossRef]
  43. Yang, J.Y.; Zheng, W.; Tian, Y.; Wu, Y.; Zhou, D.W. Effects of various mixed salt-alkaline stresses on growth, photosynthesis, and photosynthetic pigment concentrations of medicago ruthenica seedlings. Photosynthetica 2011, 49, 275–284. [Google Scholar] [CrossRef]
  44. Wu, Y.; Jin, X.; Liao, W.; Hu, L.; Dawuda, M.M.; Zhao, X.; Tang, Z.; Gong, T.; Yu, J. 5-aminolevulinic acid (ALA) alleviated salinity stress in cucumber seedlings by enhancing chlorophyll synthesis pathway. Front. Plant Sci. 2018, 9, 635. [Google Scholar] [CrossRef] [PubMed] [Green Version]
  45. Huihui, Z.; Yue, W.; Xin, L.; Guoqiang, H.; Yanhui, C.; Zhiyuan, T.; Jieyu, S.; Nan, X.; Guangyu, S. Chlorophyll synthesis and the photoprotective mechanism in leaves of mulberry (Morus alba L.) seedlings under NaCl and NaHCO3 stress revealed by tmt-based proteomics analyses. Ecotoxicol. Environ. Saf. 2020, 190, 110164. [Google Scholar] [CrossRef] [PubMed]
  46. Koldobika, H.; María, B.J.; Isabel, F.; Marta, P.; Ignacio, G.-P.J. Functional role of red (retro)-carotenoids as passive light filters in the leaves of Buxus sempervirens L.: Increased protection of photosynthetic tissues? J. Exp. Bot. 2005, 56, 2629–2636. [Google Scholar] [CrossRef]
  47. Mukhtar, E.; Siddiqi, E.H.; Bhatti, K.H.; Nawaz, K.; Hussain, K. Gas exchange attributes can be valuable selection criteria for salinity tolerance in canola cultivars (Brassica napus L.). Pak. J. Bot. 2013, 45, 35–40. [Google Scholar]
  48. Ye, L.; Zhao, X.; Bao, E.C.; Cao, K.; Zou, Z.R. Effects of arbuscular mycorrhizal fungi on watermelon growth, elemental uptake, antioxidant, and photosystem II activities and stress-response gene expressions under salinity-alkalinity stresses. Front. Plant Sci. 2019, 10, 863. [Google Scholar] [CrossRef] [Green Version]
  49. Guo, R.; Zhou, J.; Ren, G.X.; Hao, W. Physiological responses of linseed seedlings to iso osmotic polyethylene glycol, salt, and alkali stresses. Agron. J. 2013, 105, 764–772. [Google Scholar] [CrossRef]
  50. Guo, R.; Zhou, J.; Hao, W.P.; Gu, F.X.; Liu, Q.; Li, H.R.; Xia, X.; Mao, L.L. Germination, growth, chlorophyll fluorescence and ionic balance in linseed seedlings subjected to saline and alkaline stresses. Plant Prod. Sci. 2014, 17, 20–31. [Google Scholar] [CrossRef] [Green Version]
  51. He, Q. The Ionic Response and Physiological Ecological Changes of Ph.Praecox under Salt Stress. Ph.D. Thesis, Chinese Academy of Forestry, Beijing, China, 2011. [Google Scholar]
  52. Gong, B.; Wen, D.; Vandenlangenberg, K.; Wei, M.; Yang, F.; Shi, Q.; Wang, X. Comparative effects of NaCl and NaHCO3 stress on photosynthetic parameters, nutrient metabolism, and the antioxidant system in tomato leaves. Entia Hortic. 2013, 157, 1–12. [Google Scholar] [CrossRef]
  53. Hui-Hui, Z.; Guang-Liang, S.; Jie-Yu, S.; Xin, L.; Ma-Bo, L.; Liang, M.; Nan, X.; Guang-Yu, S. Photochemistry and proteomics of mulberry (Morus alba L.) seedlings under NaCl and NaHCO3 stress. Ecotoxicol. Environ. Saf. 2019, 184, 109624. [Google Scholar] [CrossRef]
  54. Kim, S.H.; Woo, D.H.; Kim, J.M.; Lee, S.Y.; Chung, W.S.; Moon, Y.H. Arabidopsis MKK4 mediates osmotic-stress response via its regulation of MPK3 activity. Biochem. Biophys. Res. Commun. 2011, 412, 150–154. [Google Scholar] [CrossRef]
  55. Kovtun, Y.I.; Chiu, W.L.; Tena, G.; Sheen, J. Functional analysis of oxidative stress-activated mitogen-activated protein kinase cascade in plants. Proc. Natl. Acad. Sci. USA 2000, 97, 2940–2945. [Google Scholar] [CrossRef] [Green Version]
  56. Moon, H.; Lee, B.; Choi, G.; Shin, S.; Prasad, D.T.; Lee, O.; Kwak, S.S.; Kim, D.N.J.; Bahk, J.; Hong, J.C. NDP kinase 2 interacts with two oxidative stress-activated MAPKs to regulate cellular redox state and enhances multiple stress tolerance in transgenic plants. Proc. Natl. Acad. Sci. USA 2003, 100, 358–363. [Google Scholar] [CrossRef] [PubMed] [Green Version]
  57. Su, J.; Yang, L.; Zhu, Q.; Wu, H.; He, Y.; Liu, Y.; Xu, J.; Jiang, D.; Zhang, S. Active photosynthetic inhibition mediated by MPK3/MPK6 is critical to effector-triggered immunity. PLoS Biol. 2018, 16, e2004122. [Google Scholar] [CrossRef] [PubMed]
  58. Macalister, C.A.; Ohashi-Ito, K.; Bergmann, D. Transcription factor control of asymmetric cell divisions that establish the stomatal lineage. Nature 2007, 445, 537–540. [Google Scholar] [CrossRef] [PubMed]
  59. Morales-Navarro, S.; Pérez-Díaz, R.; Ortega, A.; Marcos, A.D.; Mena, M.; Fenoll, C.; González-Villanueva, E.; Ruiz-Lara, S. Overexpression of a sdd1-like gene from wild tomato decreases stomatal density and enhances dehydration avoidance in arabidopsis and cultivated tomato. Front. Plant Sci. 2018, 9, 940. [Google Scholar] [CrossRef] [PubMed]
  60. Lampard, G.R.; Lukowitz, W.; Ellis, B.E.; Bergmann, D.C. Novel and expanded roles for mapk signaling in arabidopsis stomatal cell fate revealed by cell type-specific manipulations. Plant Cell 2009, 21, 3506–3517. [Google Scholar] [CrossRef] [Green Version]
  61. Zhang, Y.; Guo, X.; Dong, J. Phosphorylation of the polarity protein BASL differentiates asymmetric cell fate through MAPKS and SPCH. Curr. Biol. 2016, 26, 2957–2965. [Google Scholar] [CrossRef] [Green Version]
  62. Samakovli, D.; Ticha, T.; Vavrdova, T.; Ovecka, M.; Luptovciak, I.; Zapletalova, V.; Kucharova, A.; Krenek, P.; Krasylenko, Y.; Margaritopoulou, T. Yoda-hsp90 module regulates phosphorylation-dependent inactivation of speechless to control stomatal development under acute heat stress in arabidopsis. Mol. Plant Engl. Version 2020, 13, 612–633. [Google Scholar] [CrossRef]
  63. Wang, Y.H.; Que, F.; Li, T.; Zhang, R.R.; Khadr, A.; Xu, Z.S.; Tian, Y.S.; Xiong, A.S. DcABF3, an ABF transcription factor from carrot, alters stomatal density and reduces ABA sensitivity in transgenic arabidopsis. Plant Sci. 2021, 302, 110699. [Google Scholar] [CrossRef]
  64. Hasegawa, P.M.; Bressan, R.A.; Zhu, J.K.; Bohnert, H.J. Plant cellular and molecular responses to high salinity. Annu. Rev. Plant Physiol. Plant Mol. Biol. 2000, 51, 463–499. [Google Scholar] [CrossRef] [Green Version]
  65. Finkelstein, R.R.; Gampala, S.; Rock, C.D. Abscisic acid signaling in seeds and seedlings. Plant Cell 2002, 14 (Suppl. S1), S15–S45. [Google Scholar] [CrossRef] [PubMed] [Green Version]
  66. Kitahata, N.; Ito, S.; Kato, A.; Ueno, K.; Nakano, T.; Yoneyama, K.; Yoneyama, K.; Asami, T. Abamine as a basis for new designs of regulators of strigolactone production. J. Pestic. Sci. 2011, 36, 53–57. [Google Scholar] [CrossRef] [Green Version]
  67. Zhao, J.; Li, J.; Zhang, J.; Chen, D.; Qin, G. Genome-wide identification and expression analysis of the carotenoid cleavage oxygenase gene family in five rosaceae species. Plant Mol. Biol. Rep. 2021, 39, 739–751. [Google Scholar] [CrossRef]
  68. Li, Q.H.; Yu, X.T.; Chen, L.; Zhao, G.; Li, S.Z.; Zhou, H.; Dai, Y.; Sun, N.; Xie, Y.F.; Gao, J.S.; et al. Genome-wide identification and expression analysis of the NCED family in cotton (Gossypium hirsutum L.). PLoS ONE 2021, 16, e0246021. [Google Scholar] [CrossRef]
  69. Milosavljevic, A.; Prokic, L.; Marjanovic, M.; Stikic, R.; Sabovljevic, A. The effects of drought on the expression of TAO1, NCED and EIL1 genes and ABA content in tomato wild-type and flacca mutant. Arch. Biol. Sci. 2012, 64, 297–306. [Google Scholar] [CrossRef]
  70. Awan, S.Z.; Chandler, J.O.; Harrison, P.J.; Sergeant, M.J.; Bugg, T.D.H.; Thompson, A.J. Promotion of germination using hydroxamic acid inhibitors of 9-cis-epoxycarotenoid dioxygenase. Front. Plant Sci. 2017, 8, 357. [Google Scholar] [CrossRef] [PubMed] [Green Version]
Figure 1. Cluster map of DEGs.
Forests 13 00754 g001
Figure 2. Expression profiles of 9 key DEGs in two poplar cultivars. Note: Sm172 stands for willow 172; Sm6 stands for Luliu 6.
Forests 13 00754 g002aForests 13 00754 g002b
Table 1. Indexes for standard equation construction.
CategoryIndexesAbbreviationsRelative Value Codes
PhenotypeSalt injury indexSIIx1
BiomassShoot fresh weightSFWx2
Root fresh weightRFWx3
Water contentRWCx4
Seedling height growthRHx5
Ground diameter growthRDx6
Photosynthetic indexNet photosynthetic ratePnx7
Intercellular CO2 concentrationCix8
Stomatal conductanceGSx9
ChlorophyllChlx10
Physiological and biochemical indexSuperoxide dismutaseSODx11
PeroxidasePODx12
MalondialdehydeMDAx13
ConductivityECx14
Soluble sugarSSx15
Soluble starchSSTx16
Table 2. ANOVA analyses of effects of salt and clone treatments and their interaction on the growth, biomass, photosynthetic, physiological, and biochemical of Salix matsudana.
VariablesSalt TreatmentClone TreatmentSalt × Clones
F-Valuep-ValueF-Valuep-ValueF-Valuep-Value
SFW120.94<0.0018.793<0.0011.935<0.05
RFW47.081<0.0014.34<0.012.902<0.001
RWC3.497<0.053.898<0.012.759<0.001
RH555.974<0.00116.797<0.0019.68<0.001
RD558.212<0.0014.719<0.0016.314<0.001
Chl249.154<0.001181.623<0.00131.436<0.001
GS44.091<0.0013.91<0.011.944<0.05
Pn1293.128<0.00191.144<0.00111.486<0.001
Ci3.931<0.011.5390.1911.1410.336
MDA532.732<0.001811.72<0.00140.707<0.001
POD97.785<0.001100.371<0.00116.692<0.001
SOD720.173<0.001818.479<0.00185.472<0.001
EC7.072<0.0013.505<0.012.766<0.001
SS128.4570 < 0.001226.815<0.00166.527<0.001
SST0.5180.7234.314<0.011.4450.138
Table 3. Correlation coefficient of every single index.
SIIGSPNCIRWCSFWRFWSODMDAECSSSSTChlPODRH
GS−0.760 ***
PN−0.911 ***0.882 ***
CI0.477 **−0.222−0.467 **
RWC0.161−0.185−0.2680.003
SFW−0.875 ***0.744 ***0.827 ***−0.378 *−0.146
RFW−0.776 ***0.458 *0.714 ***−0.617 **−0.1390.666 ***
SOD−0.042−0.268−0.133−0.038−0.127−0.0970.061
MDA0.581 **−0.503 **−0.606 **0.537 **−0.193−0.561 **−0.375 *0.019
EC−0.3240.541 **0.394 *−0.07−0.0740.2460.234−0.505 **−0.013
SS0.32−0.445 *−0.421 *0.140.141−0.103−0.07−0.020.229−0.276
SST0.045−0.166−0.142−0.0710.0350.092−0.0550.26−0.093−0.1650.515 **
Chl−0.631 **0.610 **0.665 ***−0.235−0.1080.658 ***0.422 *0.082−0.519 **−0.057−0.374 *−0.208
POD−0.032−0.136−0.095−0.0240.086−0.170.1830.363 *0.3030.012−0.25−0.454 *−0.019
RH−0.926 ***0.829 ***0.914 ***−0.338−0.1720.899 ***0.668 ***−0.023−0.591 **0.361−0.364 *−0.0720.665 ***−0.109
RD−0.948 ***0.753 ***0.889 ***−0.496 **−0.2800.887 ***0.712 ***−0.018−0.565 **0.384 *−0.360.0250.582 **−0.0710.908 ***
Notes: All original data are the average value of three repetitions. Except for the salt damage index, we calculated the relative value of each index (relative value = value of salt treated material/value of control material). Salt damage level: Grade 1: the plant is strong, the leaves are flat, green, and shiny; Grade 2: the plant wilts slightly, the leaf edge turns yellow or loses water slightly; Grade 3: plants wilt, and leaves droop, shrink, and turn yellow; Grade 4: the plant is seriously wilted, and the leaves fall off or wither; Grade 5: all leaves dry or fall off. Salt damage index = Σ (number of damaged plants at all levels) × Corresponding grade value)/(total number of plants investigated × Maximum salt damage level value). Levels of significance are indicated by asterisks: * p < 0.05; ** p < 0.01; *** p < 0.001.
Table 4. Grey correlation degree of every single index.
Evaluation ItemCorrelation DegreeRanking
SOD0.7591
POD0.7282
EC0.6563
RWC0.6274
SST0.6235
SS0.6136
CI0.5747
RFW0.5628
MDA0.5549
RH0.54610
RD0.5411
Chl0.53712
SFW0.53213
GS0.52414
PN0.52315
SII0.49716
Table 5. Principal component eigenvalues, contribution rate, and cumulative contribution rate of C1 and C2 indicators.
CategoryIndexesCharacteristic ValueContribution Rate (%)Cumulative Contribution Rate (%)
C1Pn7.73485.94%85.94%
RH0.431
SFW0.344
SII0.219
RD0.106
GS0.08
Chl0.051
RFW0.027
MDA0.007
C2SOD5.4987.15%87.15%
POD1.513
SST1.245
SS1.044
RWC0.545
CI0.354
EC0.189
Table 6. Comparison of score calculated by principal components in six Salix matsudana.
TypeSm6Sm2SmASm172SmCSmB
F11.5938924121.7398305741.614287821.636881991.5064935421.407123631
F2−0.005852612−0.393786624−0.444860471−0.619278358−0.474227168−0.518359797
S0.8916043460.8031726240.710321720.6464275970.6369571510.561836407
Sort by salt S values123456
Notes: F1: Score of class C1 index; F2: Score of class C2 index; S: Consolidated values.
Table 7. Summary of differentially expressed genes.
NameUpDownTotalProportion
Sm172t24h-Sm172t12h155467422287.10%
Sm172t24h-Sm172t4h24861519400512.72%
Sm172t24h-Sm172t0h1710111828289%
Sm172t12h-Sm172t4h19142515442914.10%
Sm172t12h-Sm172t0h14502584403412.80%
Sm172t4h-Sm172t0h2231954181.30%
Sm6t24h-Sm6t12h1795133531309.90%
Sm6t24h-Sm6t4h22842503478715.20%
Sm6t24h-Sm6t0h24942671516516.40%
Sm6t12h-Sm6t4h17433157490015.60%
Sm6t12h-Sm6t0h19772774475115.10%
Sm6t4h-Sm6t0h5210620.10%
Sm6t24h-Sm172t24h48661140.30%
Sm6t12h-Sm172t12h331340.10%
Sm6t4h-Sm172t4h4972537502.30%
Sm6t0h-Sm172t0h2424480.10%
Name: variance comparison combination; Up: upregulated gene; Down: downregulated gene; Total: sum of differential genes; Proportion: the proportion of significantly different genes in this group in the total different genes in this group.
Table 8. Gene annotations in databases.
Comparison CombinationsAnnotated NumberThe Proportion of Annotated Genes in Databases
NTNRBLASTXBLASTPPFAMeggNOGKEGG
Sm6t4h-Sm6t0h6298.39%98.39%88.71%83.87%74.19%69.35%41.94%
Sm6t12h-Sm6t0h475199.64%99.41%87.77%79.44%73.08%66.93%34.50%
Sm6t12h-Sm6t4h490099.61%99.27%87.98%79.33%73.08%65.88%33.16%
Sm6t24h-Sm6t0h516599.59%99.17%88.02%79.09%73.20%67.76%35.28%
Sm6t24h-Sm6t4h478799.56%99.08%87.61%78.96%73.05%66.79%33.61%
Sm6t24h-Sm6t12h313099.55%99.20%87.73%79.20%70.93%66.90%30.83%
Sm172t4h-Sm172t0h41898.56%98.33%87.80%78.47%74.64%59.33%23.68%
Sm172t12h-Sm172t0h403499.43%99.23%88.23%79.33%72.43%66.04%32.15%
Sm172t12h-Sm172t4h442999.53%99.32%87.56%79.25%73.40%65.39%32.38%
Sm172t24h-Sm172t0h282899.26%98.76%86.32%76.59%70.47%65.56%31.26%
Sm172t24h-Sm172t4h400599.30%98.90%86.44%77.60%71.16%65.99%30.91%
Sm172t24h-Sm172t12h222899.69%99.15%88.51%80.30%71.99%66.47%32.36%
Table 9. The top 20 KEGG pathways with the highest concentration of DEGs.
Metabolic Pathway IDNumber of DEGs in this Pathway with AnnotationsPathway Annotation
Sm64 h–0 h12 h–0 h12 h–4 h24 h–0 h24 h–4 h24 h–12 h
ko012300796777600Biosynthesis of amino acids
ko040750061798655Plant hormone signal transduction
ko005200393937400Amino sugar and nucleotide sugar metabolism
ko002700363245360Cysteine and methionine metabolism
ko04016000555532MAPK signaling pathway-plant
ko0120000073640Carbon metabolism
ko005000293303225Starch and sucrose metabolism
ko04712036320032Circadian rhythm-plant
ko009410293116170Flavonoid biosynthesis
ko002800181923260Valine, leucine, and isoleucine degradation
ko000710172122240Fatty acid degradation
ko00940027290260Phenylpropanoid biosynthesis
ko00260026028260Glycine, serine, and threonine metabolism
ko005610202102016Glycerolipid metabolism
ko0005201516161412Galactose metabolism
ko01212002425220Fatty acid metabolism
ko0062000034310Pyruvate metabolism
ko00053019220180Ascorbate and aldarate metabolism
ko00592020200160alpha-Linolenic acid metabolism
ko00906413140130Carotenoid biosynthesis
Metabolic Pathway IDNumber of DEGs in this Pathway with AnnotationsPathway Annotation
Sm1724 h–0 h12 h–0 h12 h–4 h24 h–0 h24 h–4 h24 h–12 h
ko040750560808353Plant hormone signal transduction
ko0471203532172729Circadian rhythm—plant
ko04016000515433MAPK signaling pathway—plant
ko005000342720022Starch and sucrose metabolism
ko009400292418240Phenylpropanoid biosynthesis
ko00941825270249Flavonoid biosynthesis
ko00270003719310Cysteine and methionine metabolism
ko012300069000Biosynthesis of amino acids
ko005610181715013Glycerolipid metabolism
ko0007301719909Cutin, suberine, and wax biosynthesis
ko009060171410010Carotenoid biosynthesis
ko00592001413139alpha-Linolenic acid metabolism
ko00280001613170Valine, leucine, and isoleucine degradation
ko004500111310110Selenocompound metabolism
ko0019602015900Photosynthesis—antennal proteins
ko00944310130116Flavone and flavonol biosynthesis
ko009450119680Stilbenoid, diarylheptanoid, and gingerol biosynthesis
ko0033000016180Arginine and proline metabolism
ko0003000201300Pentose phosphate pathway
ko046260000320Plant–pathogen interaction
Publisher’s Note: MDPI stays neutral with regard to jurisdictional claims in published maps and institutional affiliations.

