Article

A Data-Driven Model for Spatial Shallow Landslide Probability of Occurrence Due to a Typhoon in Ningguo City, Anhui Province, China

1
School of Civil Engineering and Architecture, Anhui University of Science and Technology, Huainan 232001, China
2
Key Laboratory of Western China’s Mineral Resources and Geological Engineering, Ministry of Education, Chang’an University, Xi’an 710054, China
3
National Institute of Natural Hazards, Ministry of Emergency Management of China, Beijing 100085, China
*
Authors to whom correspondence should be addressed.
Forests 2022, 13(5), 732; https://doi.org/10.3390/f13050732
Submission received: 8 March 2022 / Revised: 25 April 2022 / Accepted: 5 May 2022 / Published: 8 May 2022
(This article belongs to the Special Issue Landslides in Forests around the World: Causes and Mitigation)

Abstract

:
From 9 to 11 August 2019, the southeast coastal areas of China were hit by Typhoon Lekima, which caused a large number of shallow landslides. The typhoon resulted in a maximum rainfall of 402 mm during 3 days in Ningguo City. In this study, satellite images were acquired before and after the rainfall and visual interpretation was used to identify 414 shallow landslides in Ningguo City, and a complete database of shallow landslides caused by the typhoon-induced rainfall in Ningguo City was created. Nine landslide-influencing factors were selected—elevation, slope, aspect, strata, distance to faults, distance to rivers, distance to roads, normalized vegetation difference index, and rainfall—and the relationships between the rainfall-induced landslide distribution and the influencing factors were analyzed. The Bayesian probability method was combined with a logistic regression model to establish a landslide probability map for the study area. The real probabilities of landslide occurrence in the study area under five different rainfall conditions were calculated, and probability maps of landslide occurrence were drawn. The results of this study provide a reference for disaster prevention and reduction of typhoon rainstorm landslides in the southeast coastal areas of China and a future basis for decision making by the Ningguo government departments before a typhoon rainstorm occurs.

1. Introduction

The southeast coastal areas of China are frequently hit by typhoons. According to the statistics, from 1949 to 2018, a total of 493 typhoons landed in China, an average of 7 typhoons create landfall every year, making China one of the countries with the most frequent typhoon landfalls and suffering the most severe typhoon damage in the world [1]. The more developed the regional economy and the greater the population density, the more serious the casualties and economic losses a typhoon produces [2,3]. The southeast coastal areas of China have a fragile geological environment, hilly mountains, and undergo frequent engineering activities. Under the influence of typhoons and rainstorms, geological disasters are extremely prone to occur, including the largest number of landslides and the most serious damage. For example, in 2004, Typhoon Rananim caused a large number of mudslides and landslides in Yongjia, Yueqing, and other counties in Zhejiang Province, resulting in 28 deaths [4,5]. In 2015, Typhoon Soudelor caused 81 geological disasters, including collapses, landslides, and mudslides in Taishun County, Zhejiang Province, resulting in six casualties and a direct economic loss of 41.18 million yuan [6]. In 2019, Typhoon Lekima caused a landslide in Shanzao Village, Yongjia County, Zhejiang Province. The landslide blocked the river and quickly formed a barrier lake, resulting in a dam burst. This landslide-barrier-lake disaster chain of events resulted in 32 deaths [7]. Moreover, the typhoon and rainstorm affected 100,000 people and killed 8 people in Ningguo City, Anhui Province, resulting in a direct economic loss of 2594 billion yuan [8]. The heavy casualties and huge economic losses caused by typhoon rainstorms and the geological disasters they induce make it necessary to research the spatial prediction of typhoon rainstorm-induced landslides in the southeast coastal area of China, which can provide a reference for government decision-making and disaster prevention and mitigation of such landslides before typhoons and heavy rainstorms.
At present, there are two methods for the spatial prediction of regional landslides: deterministic and statistical [9,10,11]. The deterministic method combines a hydrological model, surface runoff model, and slope stability model to evaluate the stability of each grid in the region, after which the spatial prediction of landslides in a region under the action of rainfall is carried out, such as the landslide susceptibility, landslide risk, and landslide probability maps. The statistical methods are mainly divided into two types. One is to determine the statistics of the rainfall factors influencing landslides in specific regions, to determine the rainfall threshold, and to carry out the spatial prediction of regional landslides under the action of rainfall. This method only considers the rainfall factors [12,13,14]. The other is to use a regression model, machine learning, and other methods to determine the impacts of various geomorphic, geological, road, and rainfall factors on the landslide; these factors are used to evaluate the landslide risk under future rainfall in the region and predict the landslide area [15,16,17]. The deterministic method requires knowledge of the hydraulic conductivity and the physical-mechanical parameters of the rock and soil mass. Although probabilistic methods such as the Monte Carlo method can be used to deal with the uncertainties of these parameters, using this method in the spatial prediction of landslides in a wide range of areas is still limited [12,18]. Statistical analysis methods based on regression models and machine learning require a large number of landslide cases and a large amount of data on the various landslide impact factors. With the development of computer technology, geographic information system (GISs), and remote sensing technology, these data have become easier to obtain and process. Although this method does not consider the physical and mechanical mechanisms of landslide occurrence, a few studies have shown that statistical analysis methods have high prediction accuracies in terms of the spatial prediction of landslides [19,20,21].
In this study, the landslides in Ningguo City caused by Typhoon Lekima in the southeast coastal areas of China in 2019 were taken as an example (1) to establish a complete database of the landslides induced by Typhoon Lekima in Ningguo City based on satellite images; (2) to analyze the relationships between the landslide distribution and the elevation, slope, aspect, strata, distance to faults, distance to rivers, distance to roads, normalized vegetation difference index (NDVI), and rainfall and explore the landslide development; (3) to use a logistic regression model to classify the typhoon rainstorm landslide susceptibility in the study area based on the above 9 factors; and (4) to calculate the probability of landslide occurrence under different rainfall conditions based on the Bayesian probability method and a logistic regression model and create a landslide hazard zoning map.

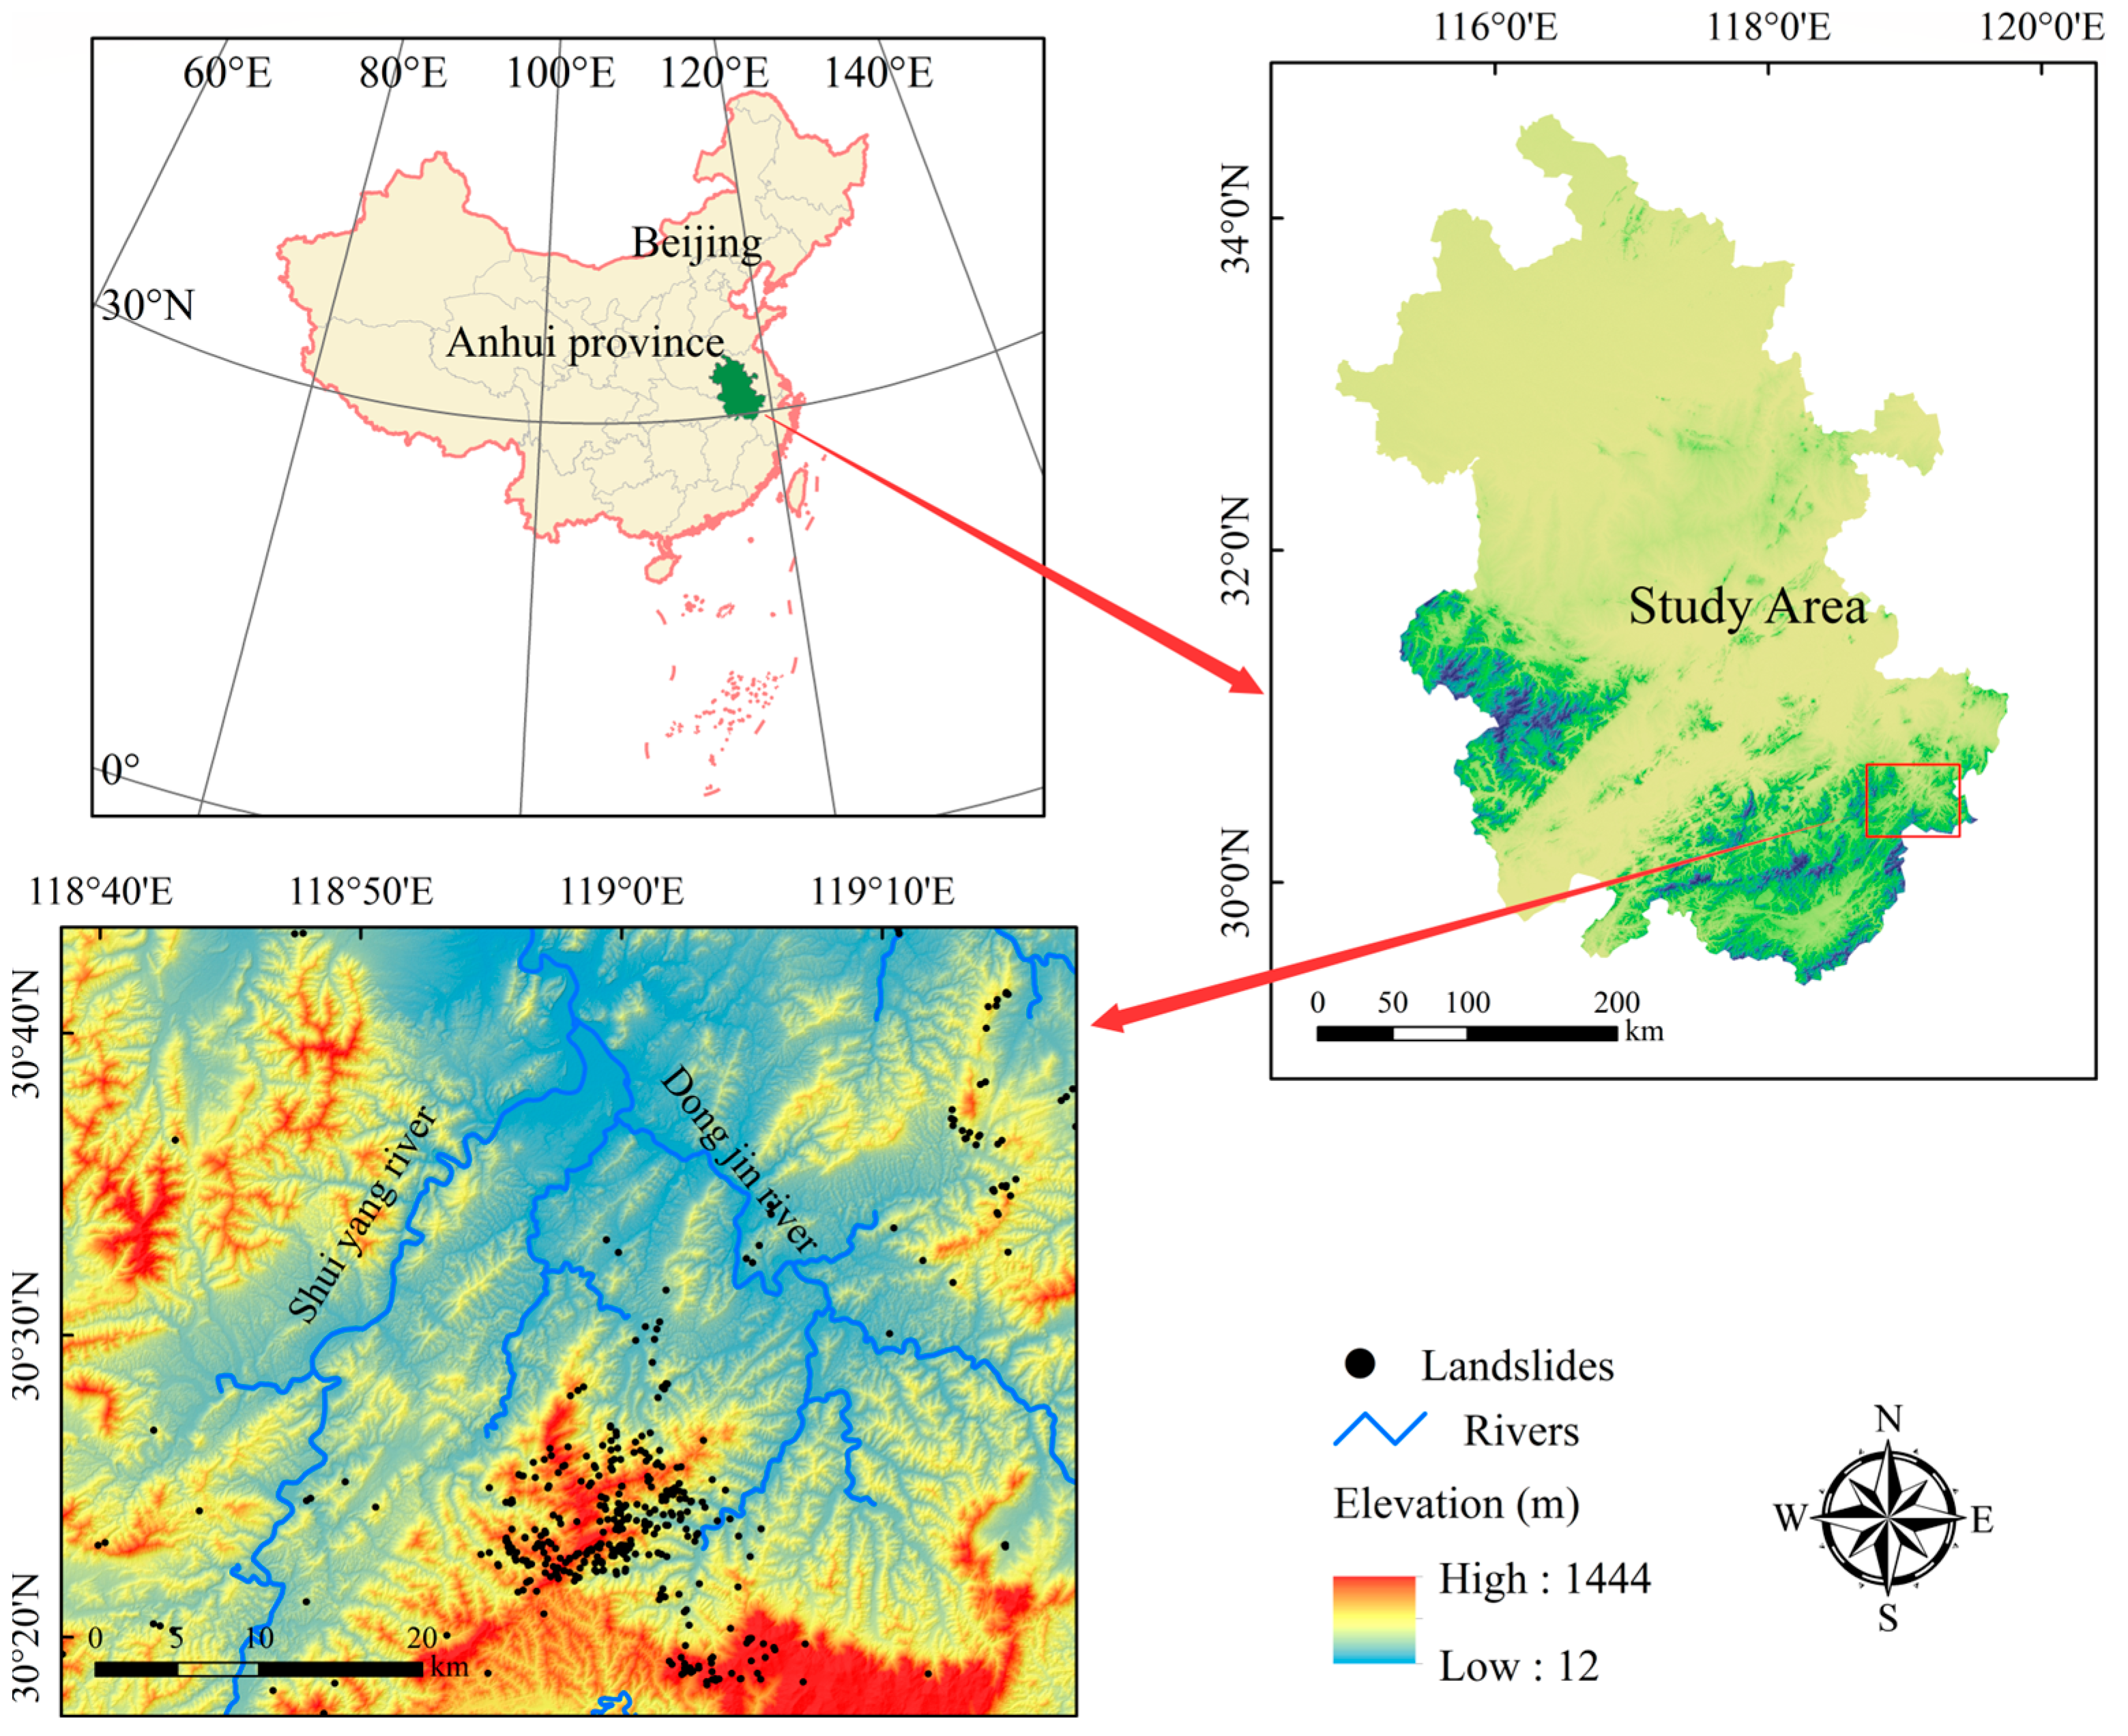
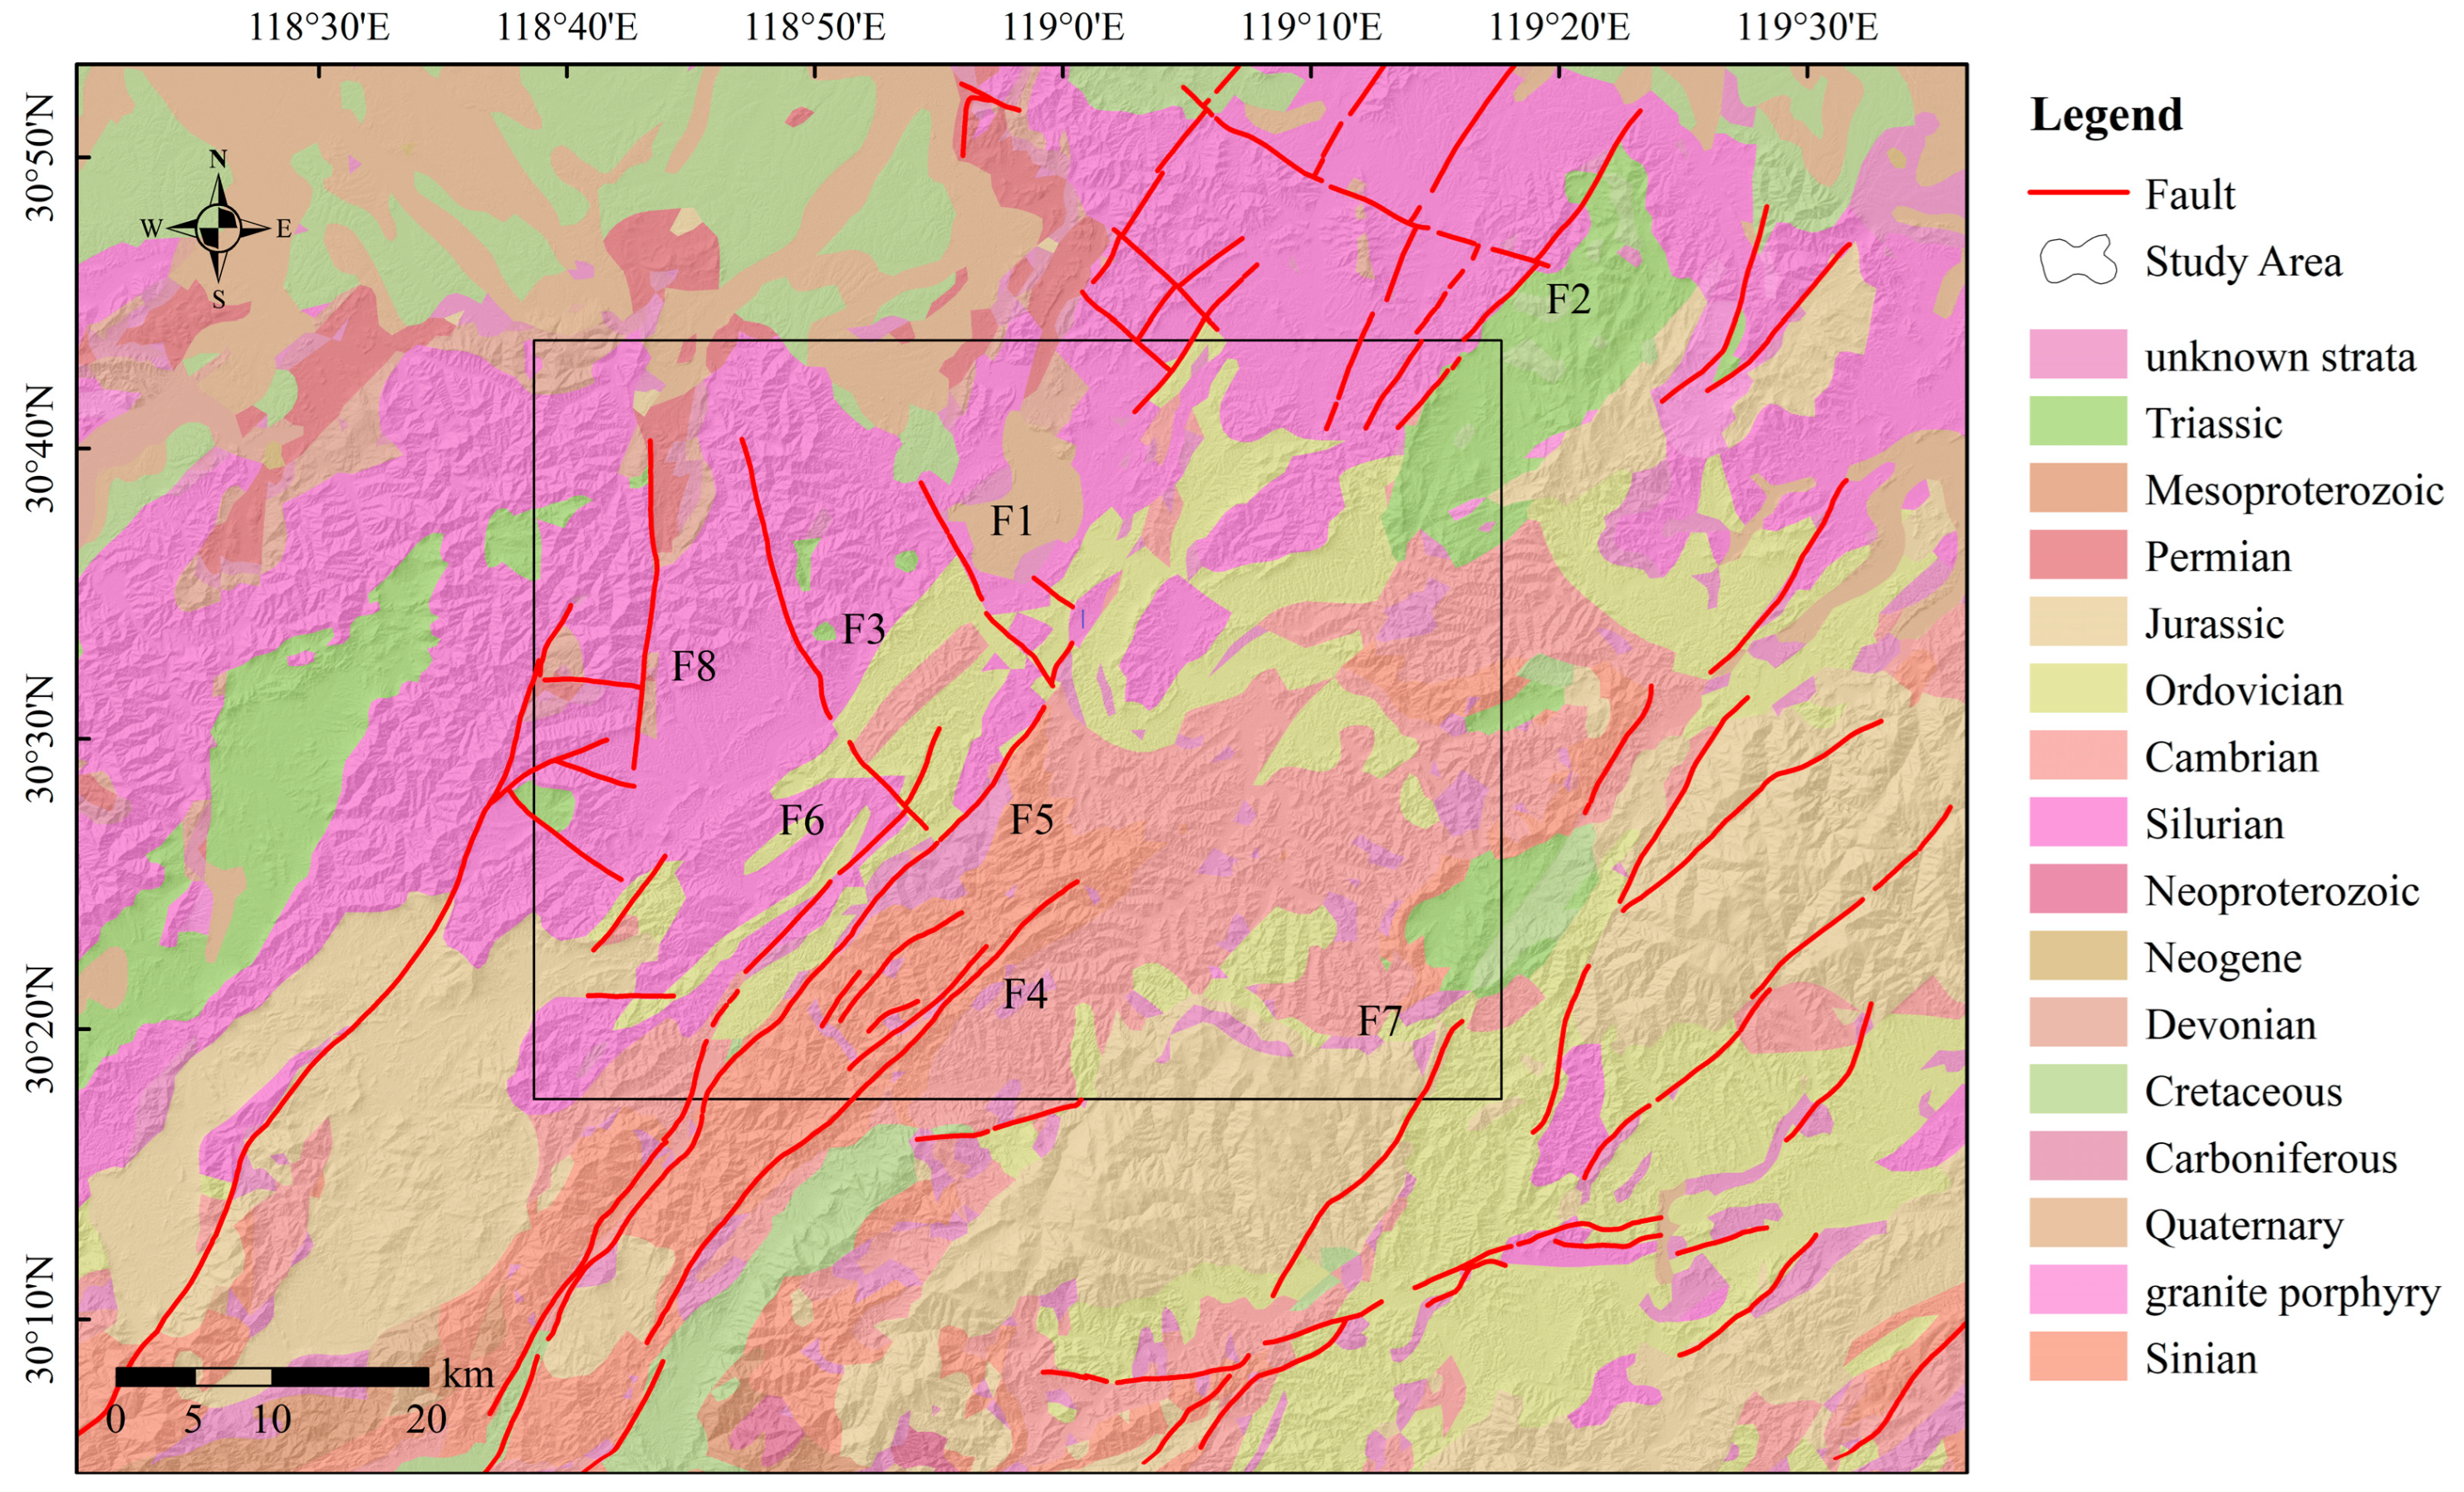
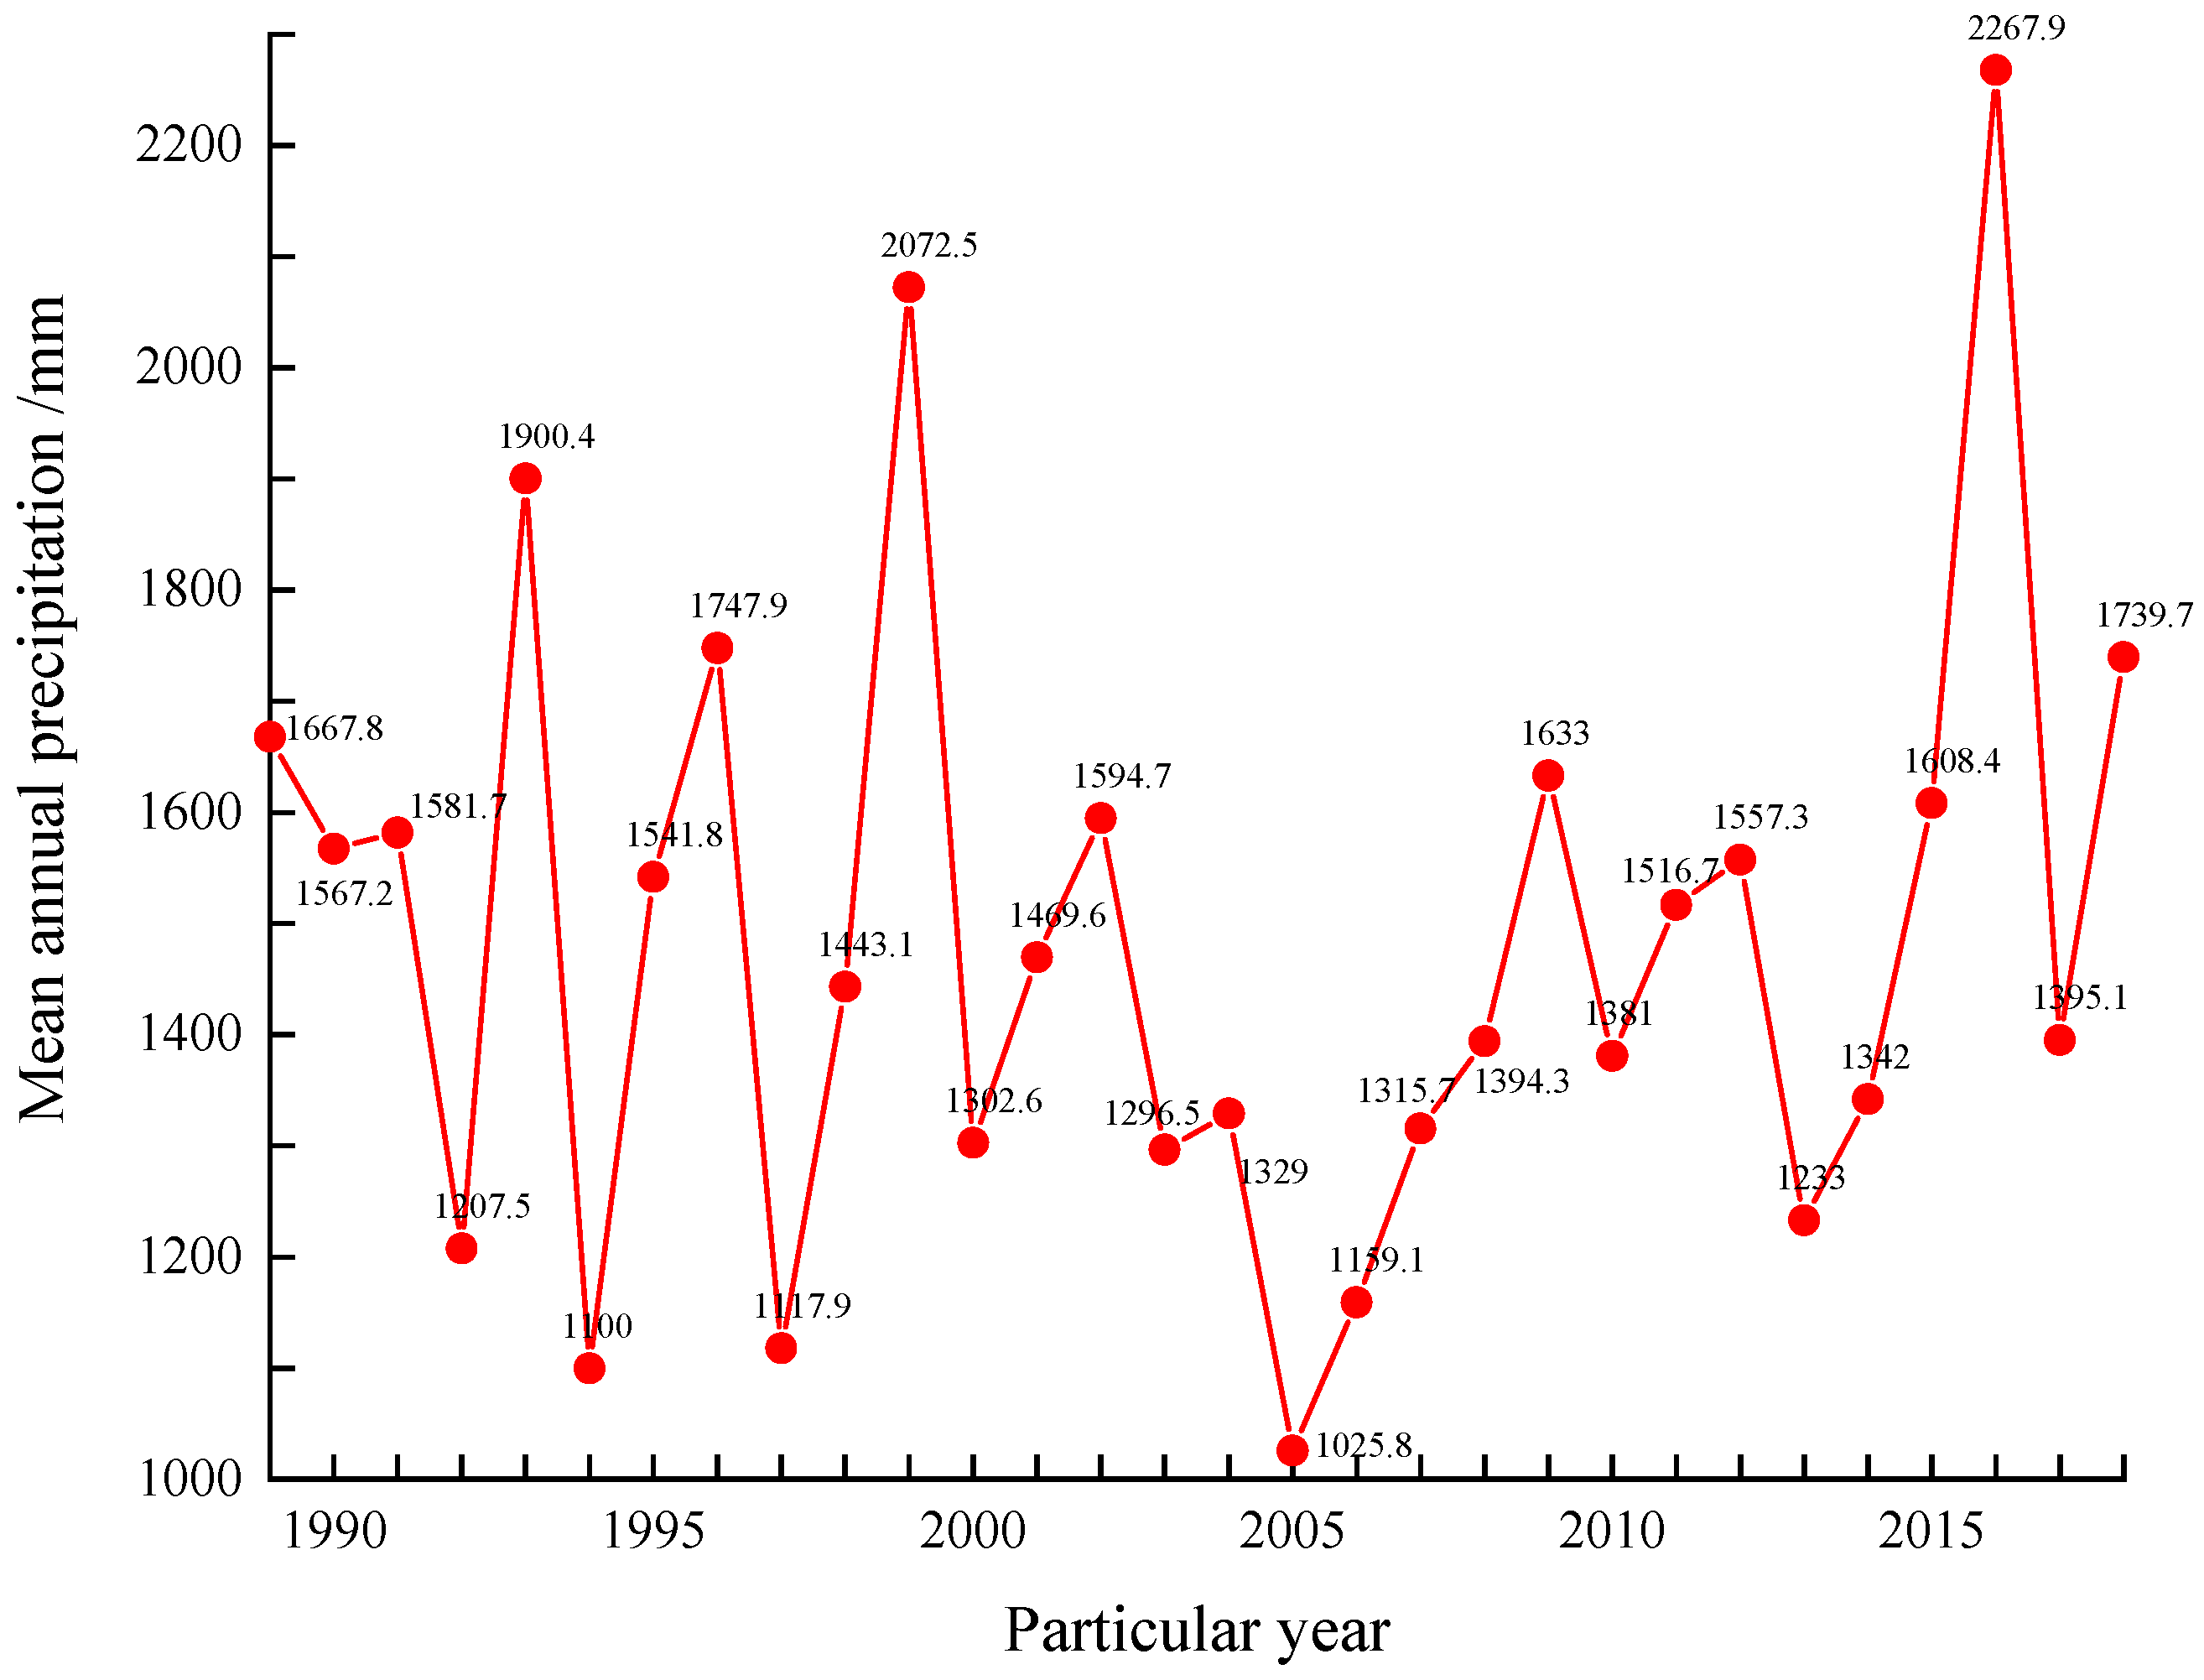
2. Geological Background

The study area (118°38′–119°17′ E, 30°43′–30°42′ N) is located in Ningguo City, Anhui Province, China, with slightly different local boundaries. The total area is 3002 km2. The geomorphology of the area is mountainous and hilly; the southeastern and southwestern regions are mountainous and the central and northern regions are hilly. The overall terrain is high in the south and low in the north. The highest elevation is 1444 m, and the lowest elevation is 12 m (Figure 1). The strata in the study area are the characteristic strata in the Yangtze region, and the exposed strata include Silurian (S), Cambrian (∈), Ordovician (O), Sinian (Z), Triassic (T), Jurassic (J), Quaternary (Qp), Devonian (D), Permian (P), Cretaceous (K), Carboniferous (C), granite porphyry (γπ), and a small number of unknown strata (using NONE as its code). Among them, the Silurian and Cambrian strata are the most commonly exposed (Figure 2). The study area is located in the Jiangnan uplift belt in the southeastern part of the Yangtze region. The geological structure is relatively complex. The main body of the structure is NW-trending, and the NW-trending faults are also well-developed (Figure 2). The neotectonic movement in the region has been characterized by intermittent slow uplift and local uplift. The seismic activity in the study area is low, the magnitude is small, and there are no active fractures [22]. The study area has a humid subtropical monsoon climate zone in the northern midlatitude region, with four distinct seasons, a mild climate, and abundant rainfall. In the hydrologic regionalization of China, it is located in the wet zone and has abundant water and the hydrogeological conditions are relatively simple. The main rivers in the region are the Shuiyang, Dongjin, Zhongjin, and Xijin rivers. Figure 3 shows the annual average rainfall in Ningguo City. It can be seen from the figure that the average annual rainfall in Ningguo City is more than 1000 mm. In particular, in 2016, the annual average rainfall reached 2267.9 mm.

3. Data and Methods

3.1. Data

Artificial visual interpretation of the landslides was carried out based on 3 m resolution planet satellite images. Satellite images acquired on 2 August, 5 August, and 6 August 2019 were selected to represent the area before the landslides occurred in the study area, and satellite images acquired on 17 August and 27 August 2019, were selected to represent the area after the landslides occurred in the study area. The elevation, slope, and aspect were extracted from a 12.5 m resolution digital elevation model (DEM) downloaded from the Advanced Land Observing Satellites (ALOSs) (earth observation satellites of Japan) (https://search.asf.alaska.edu, accessed on 10 January 2022). The faults and rivers are from Deng Qidong’s Active Tectonic map of China. The strata were extracted by vectorization of a 1:500,000 geological map in ArcGIS, and the roads were extracted from national roads data (https://malagis.com/, accessed on 10 January 2022). The NDVI data were downloaded from the Geospatial Data Cloud (http://www.gscloud.cn/search, accessed on 10 January 2022); the selected product was a composite of 1–5 August 2019, i.e., corresponding to the date of the landslides. The rainfall data were collected by six meteorological stations in the study area (http://data.cma.cn, accessed on 10 January 2022) and the distances from these meteorological stations to the center of the study area are 56.55 km, 46.85 km, 11.95 km, 59.19 km, 58.07 km, and 72.71 km.

3.2. Methods

Using the latitude and longitude grid in the ArcGIS platform, the study area was divided into several small areas. Then, the satellite images acquired before and after the landslides were compared one by one, mainly including a comparison of the tonal changes of the images, which are caused by the destruction of surface vegetation induced by landslides. The white areas in the images represent vegetation destruction and valley areas, and the green areas in the images represent vegetation coverage areas. If one small area is green before the typhoon and turns white after the typhoon, then this area was affected by a landslide. A complete landslide inventory for the study area was then obtained. Typical landslide examples are shown in Figure 4. Figure 4a is an image acquired before the landslides occurred, and Figure 4b is an image acquired after the landslides occurred.
The relationships between the spatial distribution of the landslides and the various influencing factors were analyzed based on the established landslide database. The real probability of landslide occurrence under different rainfall conditions was calculated by combining the Bayesian probability method with a logistic regression model [23]. The sample points were selected to be uniformly distributed throughout the entire study area. The size of the study area was 3002.3 km2, and 50 points per square kilometer were evenly selected, i.e., 150,100 points in total. To avoid repeated points in each grid, the minimum distance between sample points was set to 30 m. The obtained random points within a landslide area were defined as landslide samples, and those within non-landslide areas were defined as non-landslide samples. Finally, 72 landslide samples and 15,028 non-landslide samples were obtained. The state quantity of landslide occurrence was defined as 1, and the state quantity of non-occurrence was defined as 0.

4. Results and Analysis

4.1. Landslide Database

The landslide database established through artificial visual interpretation contains 414 landslides. The total landslide area was 1.42 km2, of which the smallest landslide area was 235 m2 and the largest landslide area was 49,826 m2. The number and area proportion of the landslides in different zones are presented in Table 1. The largest number of landslides had areas of 0–2000 m2, accounting for 47.6% (197) of the total number of landslides. Those with areas of 2000–5000 m2 accounted for 31.7% of the total landslide area, i.e., 0.45 km2. This indicates that the landslides induced by the typhoon rainstorm were mostly small.

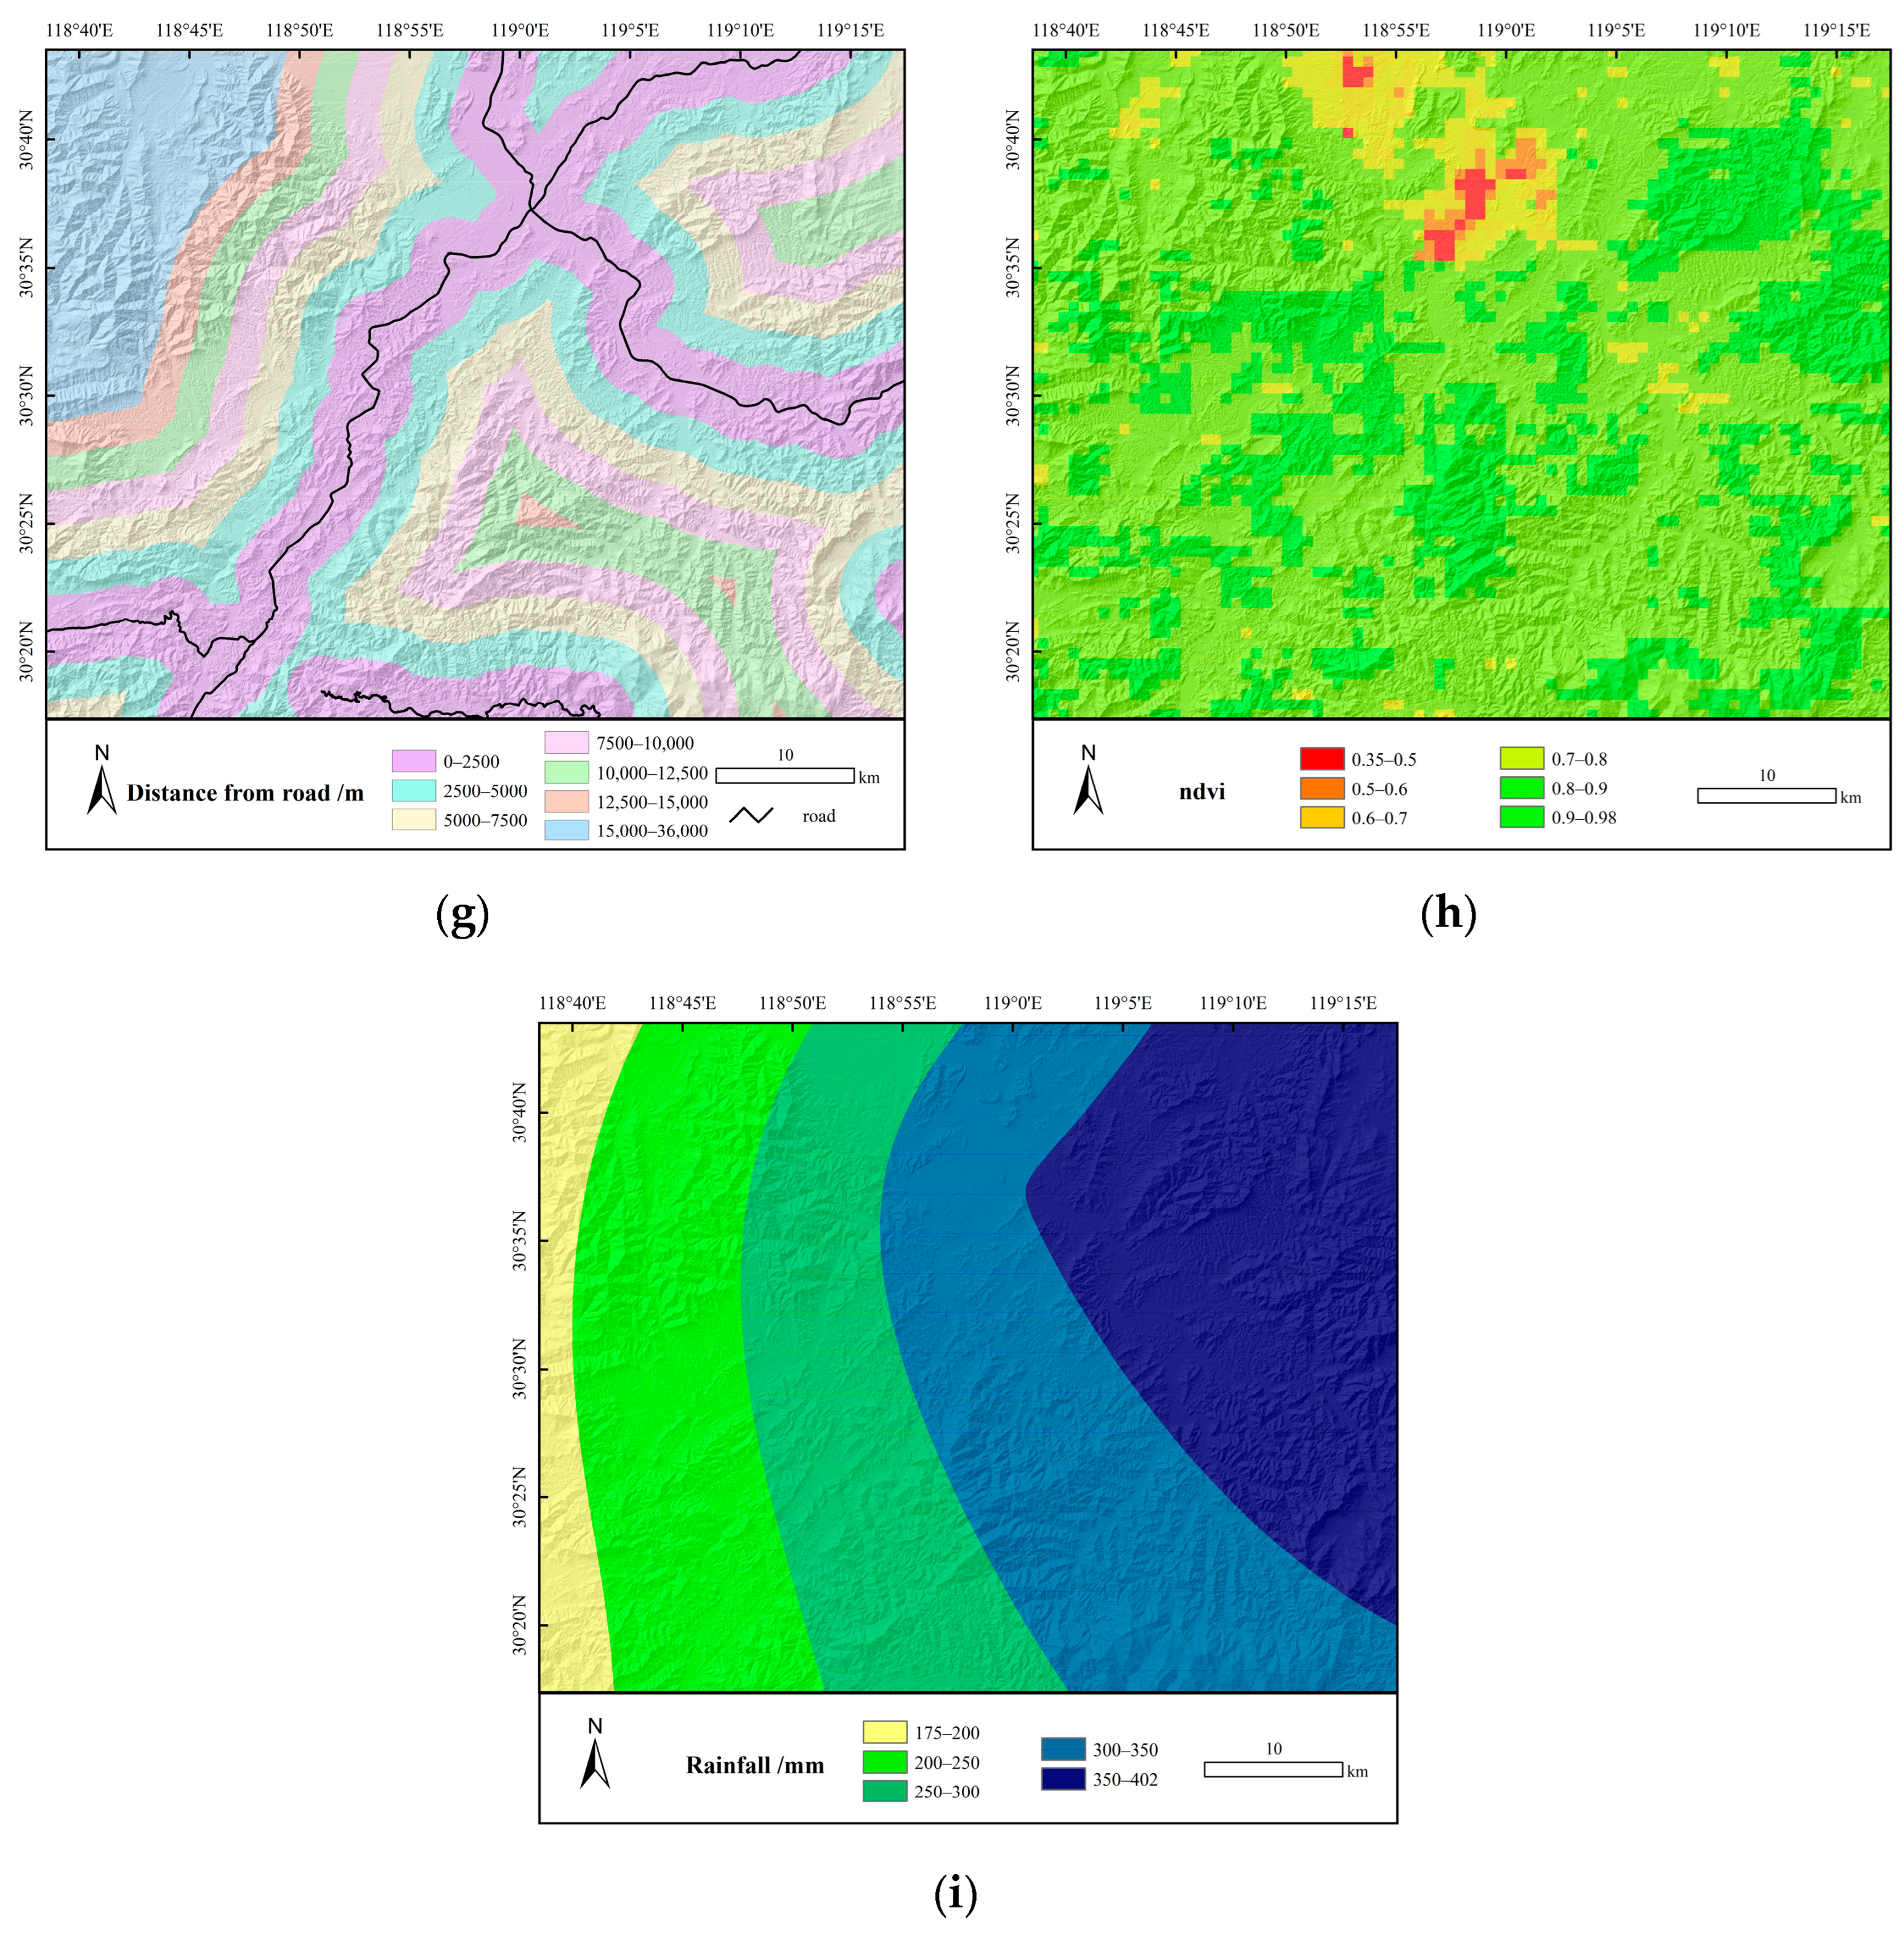
4.2. Analysis of Factors Influencing the Landslides

Based on previous studies [24,25,26] and the actual situation of these typhoon rainstorm-induced landslides, nine influencing factors were selected for the landslide analysis: elevation, slope, aspect, strata, distance to faults, distance to rivers, distance to roads, NDVI, and rainfall (Figure 5). All factor layers were transformed into 30 m × 30 m grid layers, and the landslide surface was converted into a point. The landslide point was extracted into each factor layer. The relationships between the landslide and each factor are shown in Figure 6. To intuitively analyze the relationships between the spatial distribution of the landslides and the influencing factors, the influencing factors were reclassified (Table 2) [24,25,26]. The slope direction and strata were classified as classification factors, and the other factors were classified as continuous factors.
The classified area and its relationship with LND and LAP are shown in Figure 6. As can be seen in Figure 6, the largest proportion of landslides occurred in the elevation range of 750–1000 m; when the elevation was greater than 250 m, the number of landslides decreased (Figure 6a). In the slope range of 30–40°, the distribution of landslides was more concentrated, and when the slope was greater than 50° or less than 10°, almost no landslides occurred (Figure 6b). The occurrence probability of landslides was the largest in the southeast slope direction (Figure 6c). The landslides were concentrated at distances of 7500–12,500 m from the roads (Figure 6d). The occurrence probability of landslides was the highest in the Sinian strata, and almost no landslides occurred in the Cretaceous, Quaternary, Permian, Devonian, Carboniferous, and granite porphyry strata (Figure 6e). The probability of landslide occurrence was the largest for distances to rivers of 6000–9000 m (Figure 6f). Most of the landslides were concentrated at distances of 3000–4000 m from the faults (Figure 6g). The landslide distribution was concentrated in the NDVI range of 0.8–0.98 (Figure 6h). The landslide distribution was most concentrated in the rainfall range of 300–350 mm (Figure 6i).

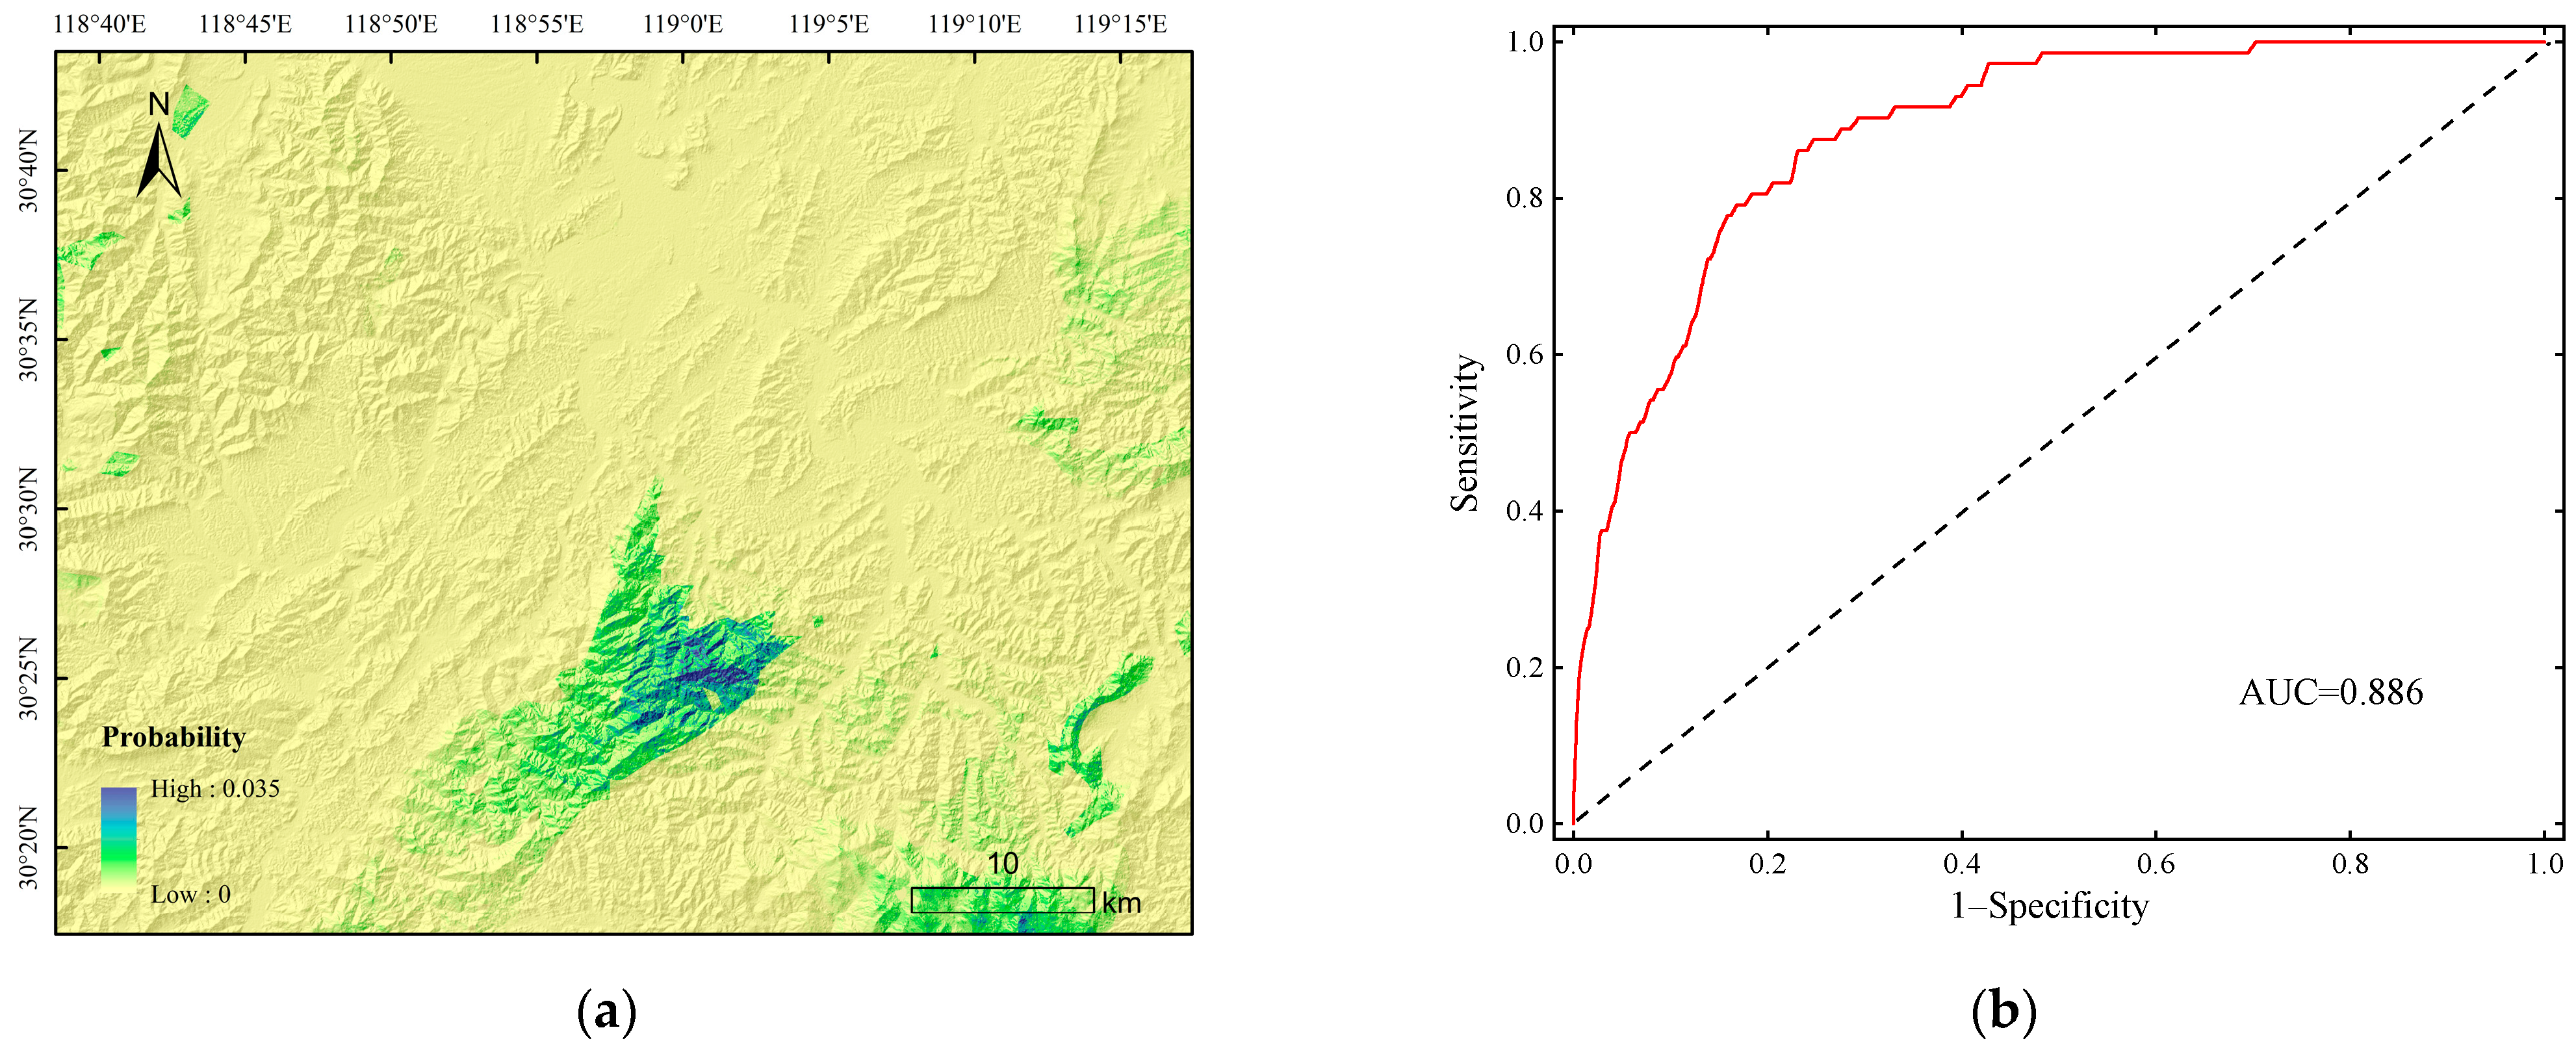
4.3. Calculation of Landslide Probability

The landslide samples and non-landslide samples were extracted into each factor layer and substituted into the SPSS software to calculate the regression coefficient of each factor. Finally, an absolute probability index graph was obtained through superposition of each factor layer. By importing the nine factors into the SPSS software for logistic regression analysis and by classifying the factors for classification covariable processing, the regression coefficient of the first range was set to zero. If the regression coefficients of the other ranges are positive, it is more conducive to the occurrence of landslides than the first range. For the continuous factors, if the weight value is positive, the probability of landslide occurrence is positively correlated with the factor, and if the weight value is negative, the probability of landslide occurrence is negatively correlated with the factor. The weights of each continuous variable and the regression coefficients of the different intervals for the classification variables were obtained. The results are presented in Table 3.
It can be seen in Table 3 that the weights of elevation, slope, rainfall, distance to faults, distance to rivers, and distance to roads are positive, so they are positively correlated with the occurrence of landslides. The NDVI weight is negative, so it is negatively correlated with the occurrence of landslides. The weight values of the strata and slope greatly differ in each interval of the classification because there are no landslides in some of the classification ranges; there are many landslides in other classification ranges, and different categories have large differences for rainfall-induced landslides. Based on the logistic regression model, each layer was superimposed in ArcGIS to obtain a landslide occurrence probability model and the accuracy of the model was verified using the receiver operating characteristic (ROC) curve. The area under the curve (AUC) refers to the area under the ROC curve. When the AUC is greater than 0.7, the model has a high accuracy [15,23]. The research results are shown in Figure 7. It can be seen in Figure 7 that the AUC = 0.886, indicating that the accuracy of the model is very high and the results are reliable.

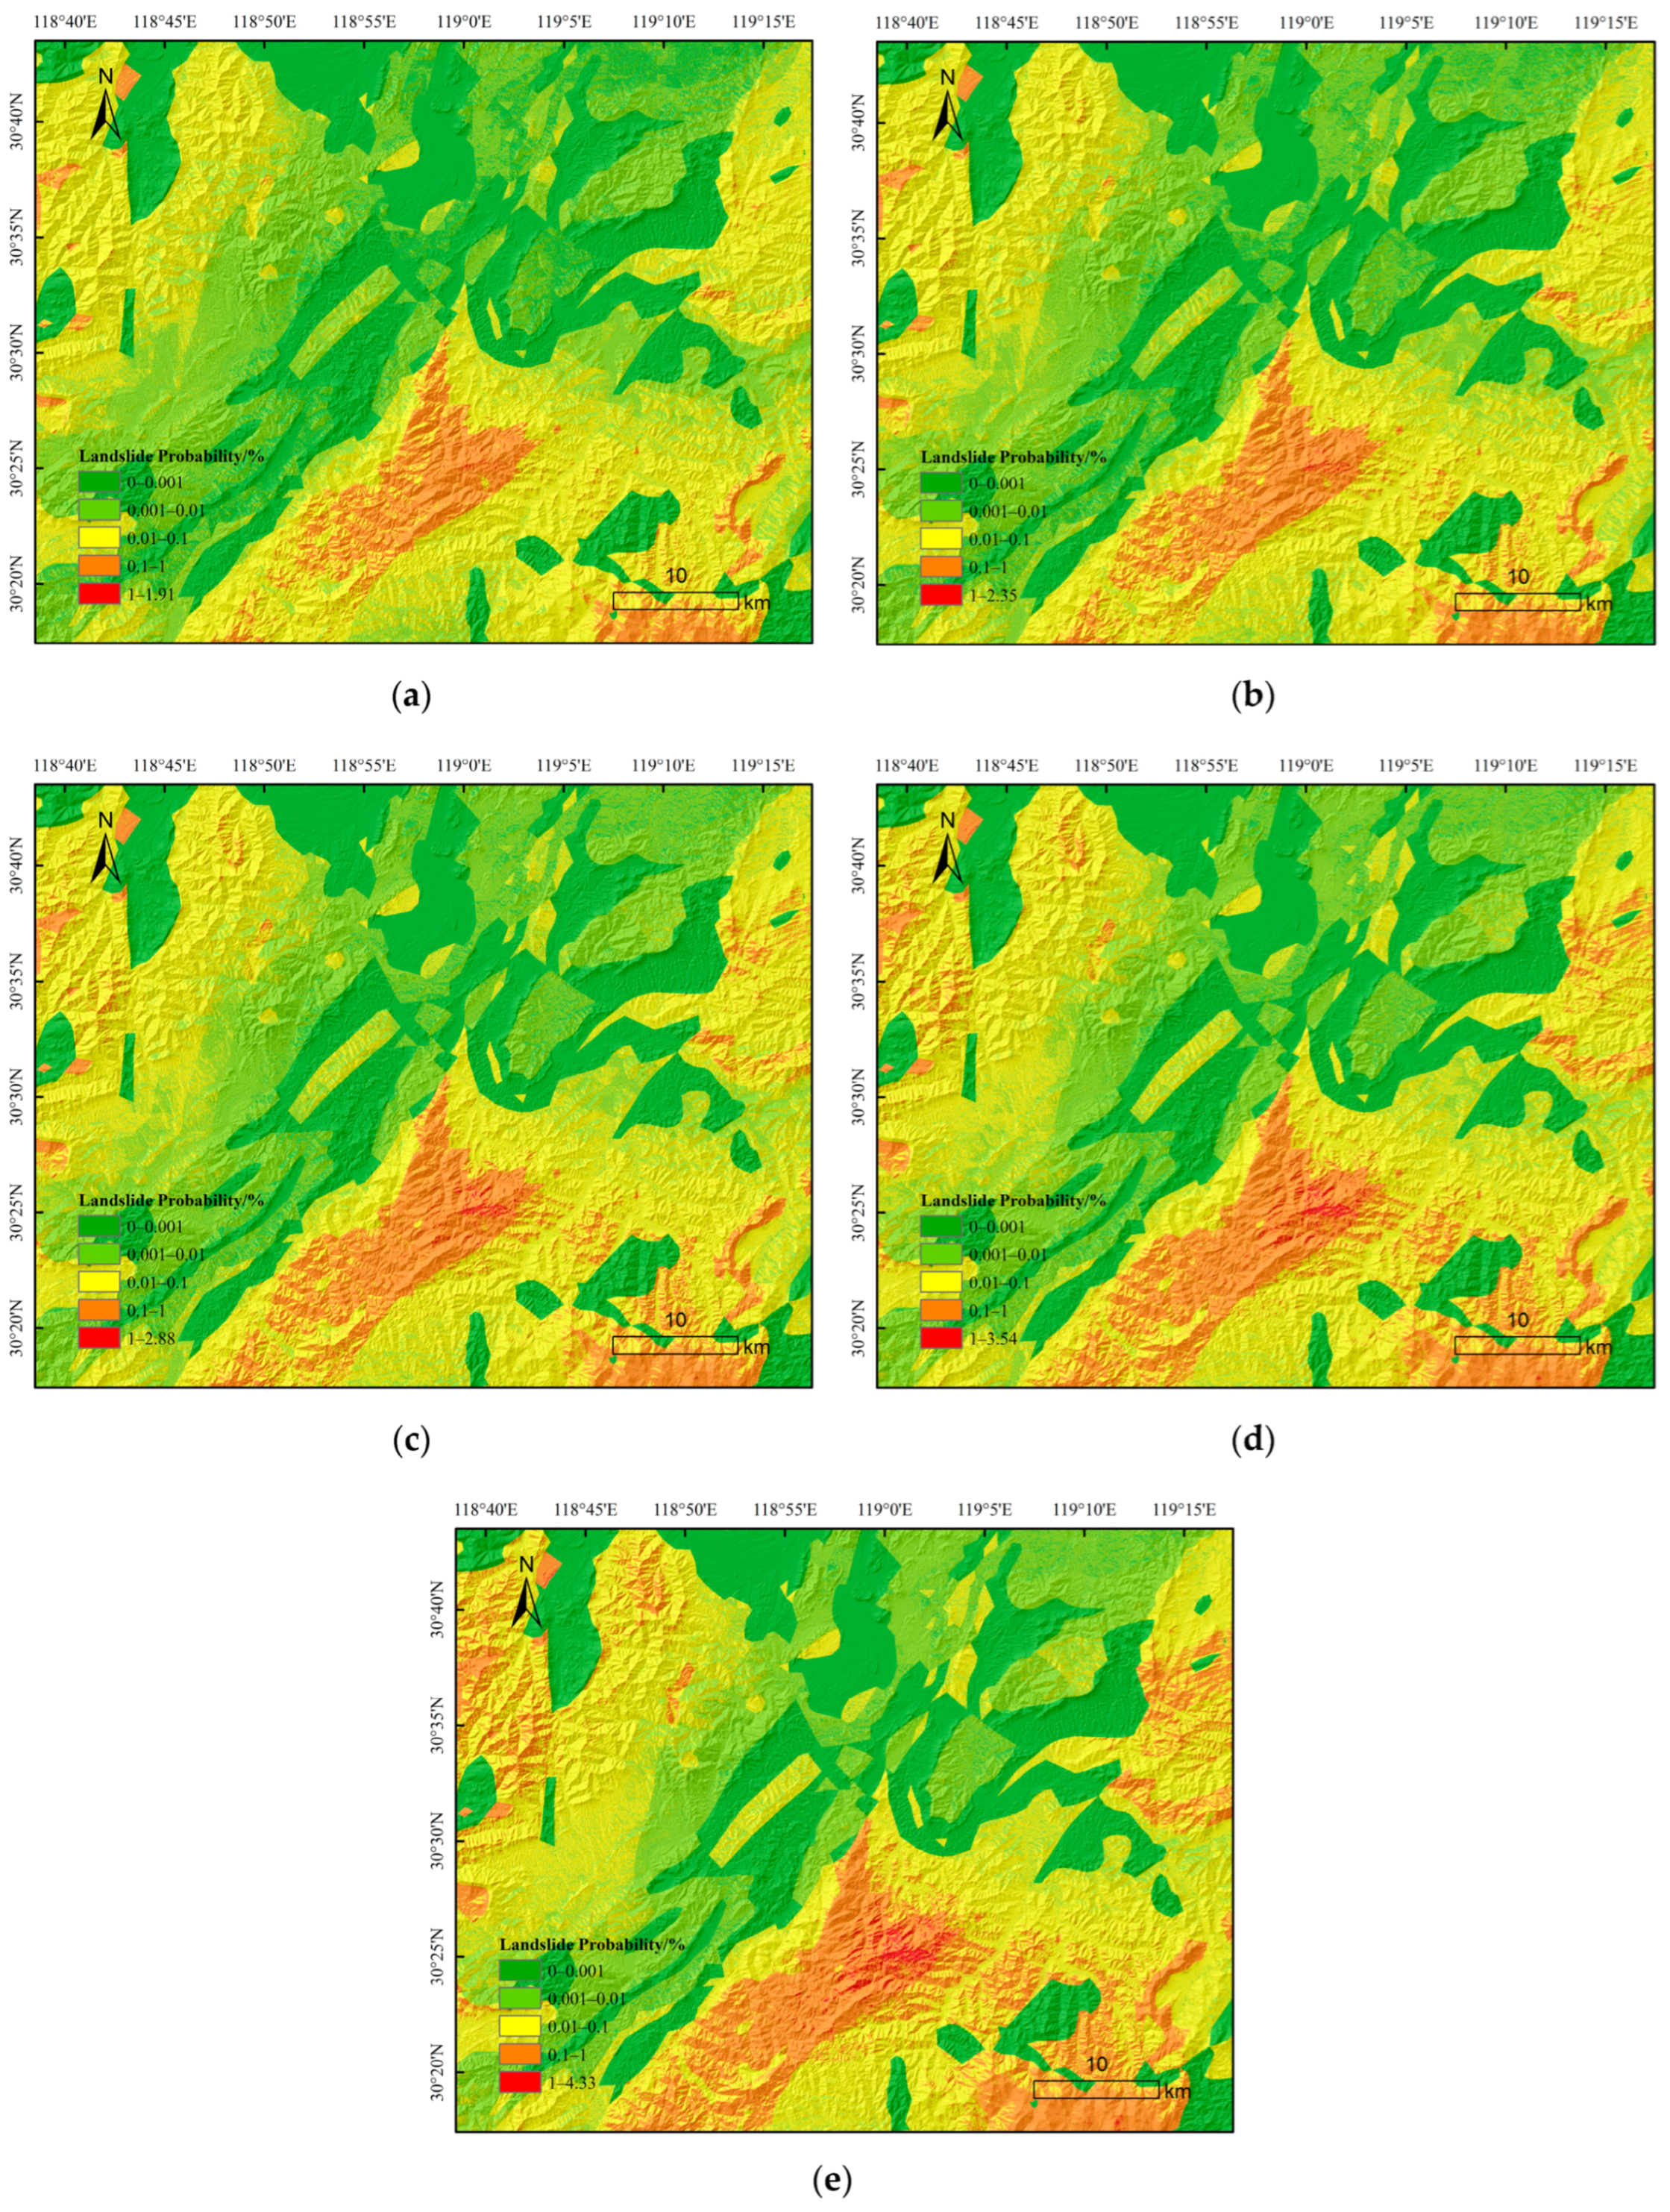
4.4. Probability of Landslides under Different Rainfall Conditions

Based on the constructed model, the real probabilities of landslide occurrence in the study area under five different rainfall conditions of 175–200 mm, 200–250 mm, 250–300 mm, 300–350 mm, and 350–402 mm were predicted to be 0.001%, 0.01%, 0.1%, and 1%, which are discontinuous values that divide the study area into five grades (Figure 8). The prediction results can be used to quickly assess the risk of landslide occurrence in the region according to the real rainfall, and they provide a reference for subsequent disaster prevention and mitigation and post-disaster reconstruction. Under different rainfall conditions, the areas with different probabilities of landslide occurrence in the study area are shown in Figure 9. It can be seen in Figure 9 that as the rainfall increases, the areas with a high probability of landslide occurrence become larger, and the areas with a low probability of landslide occurrence become smaller. This demonstrates that rainfall is positively correlated with the occurrence of landslides and landslides are more likely to occur under higher rainfall.

5. Discussion

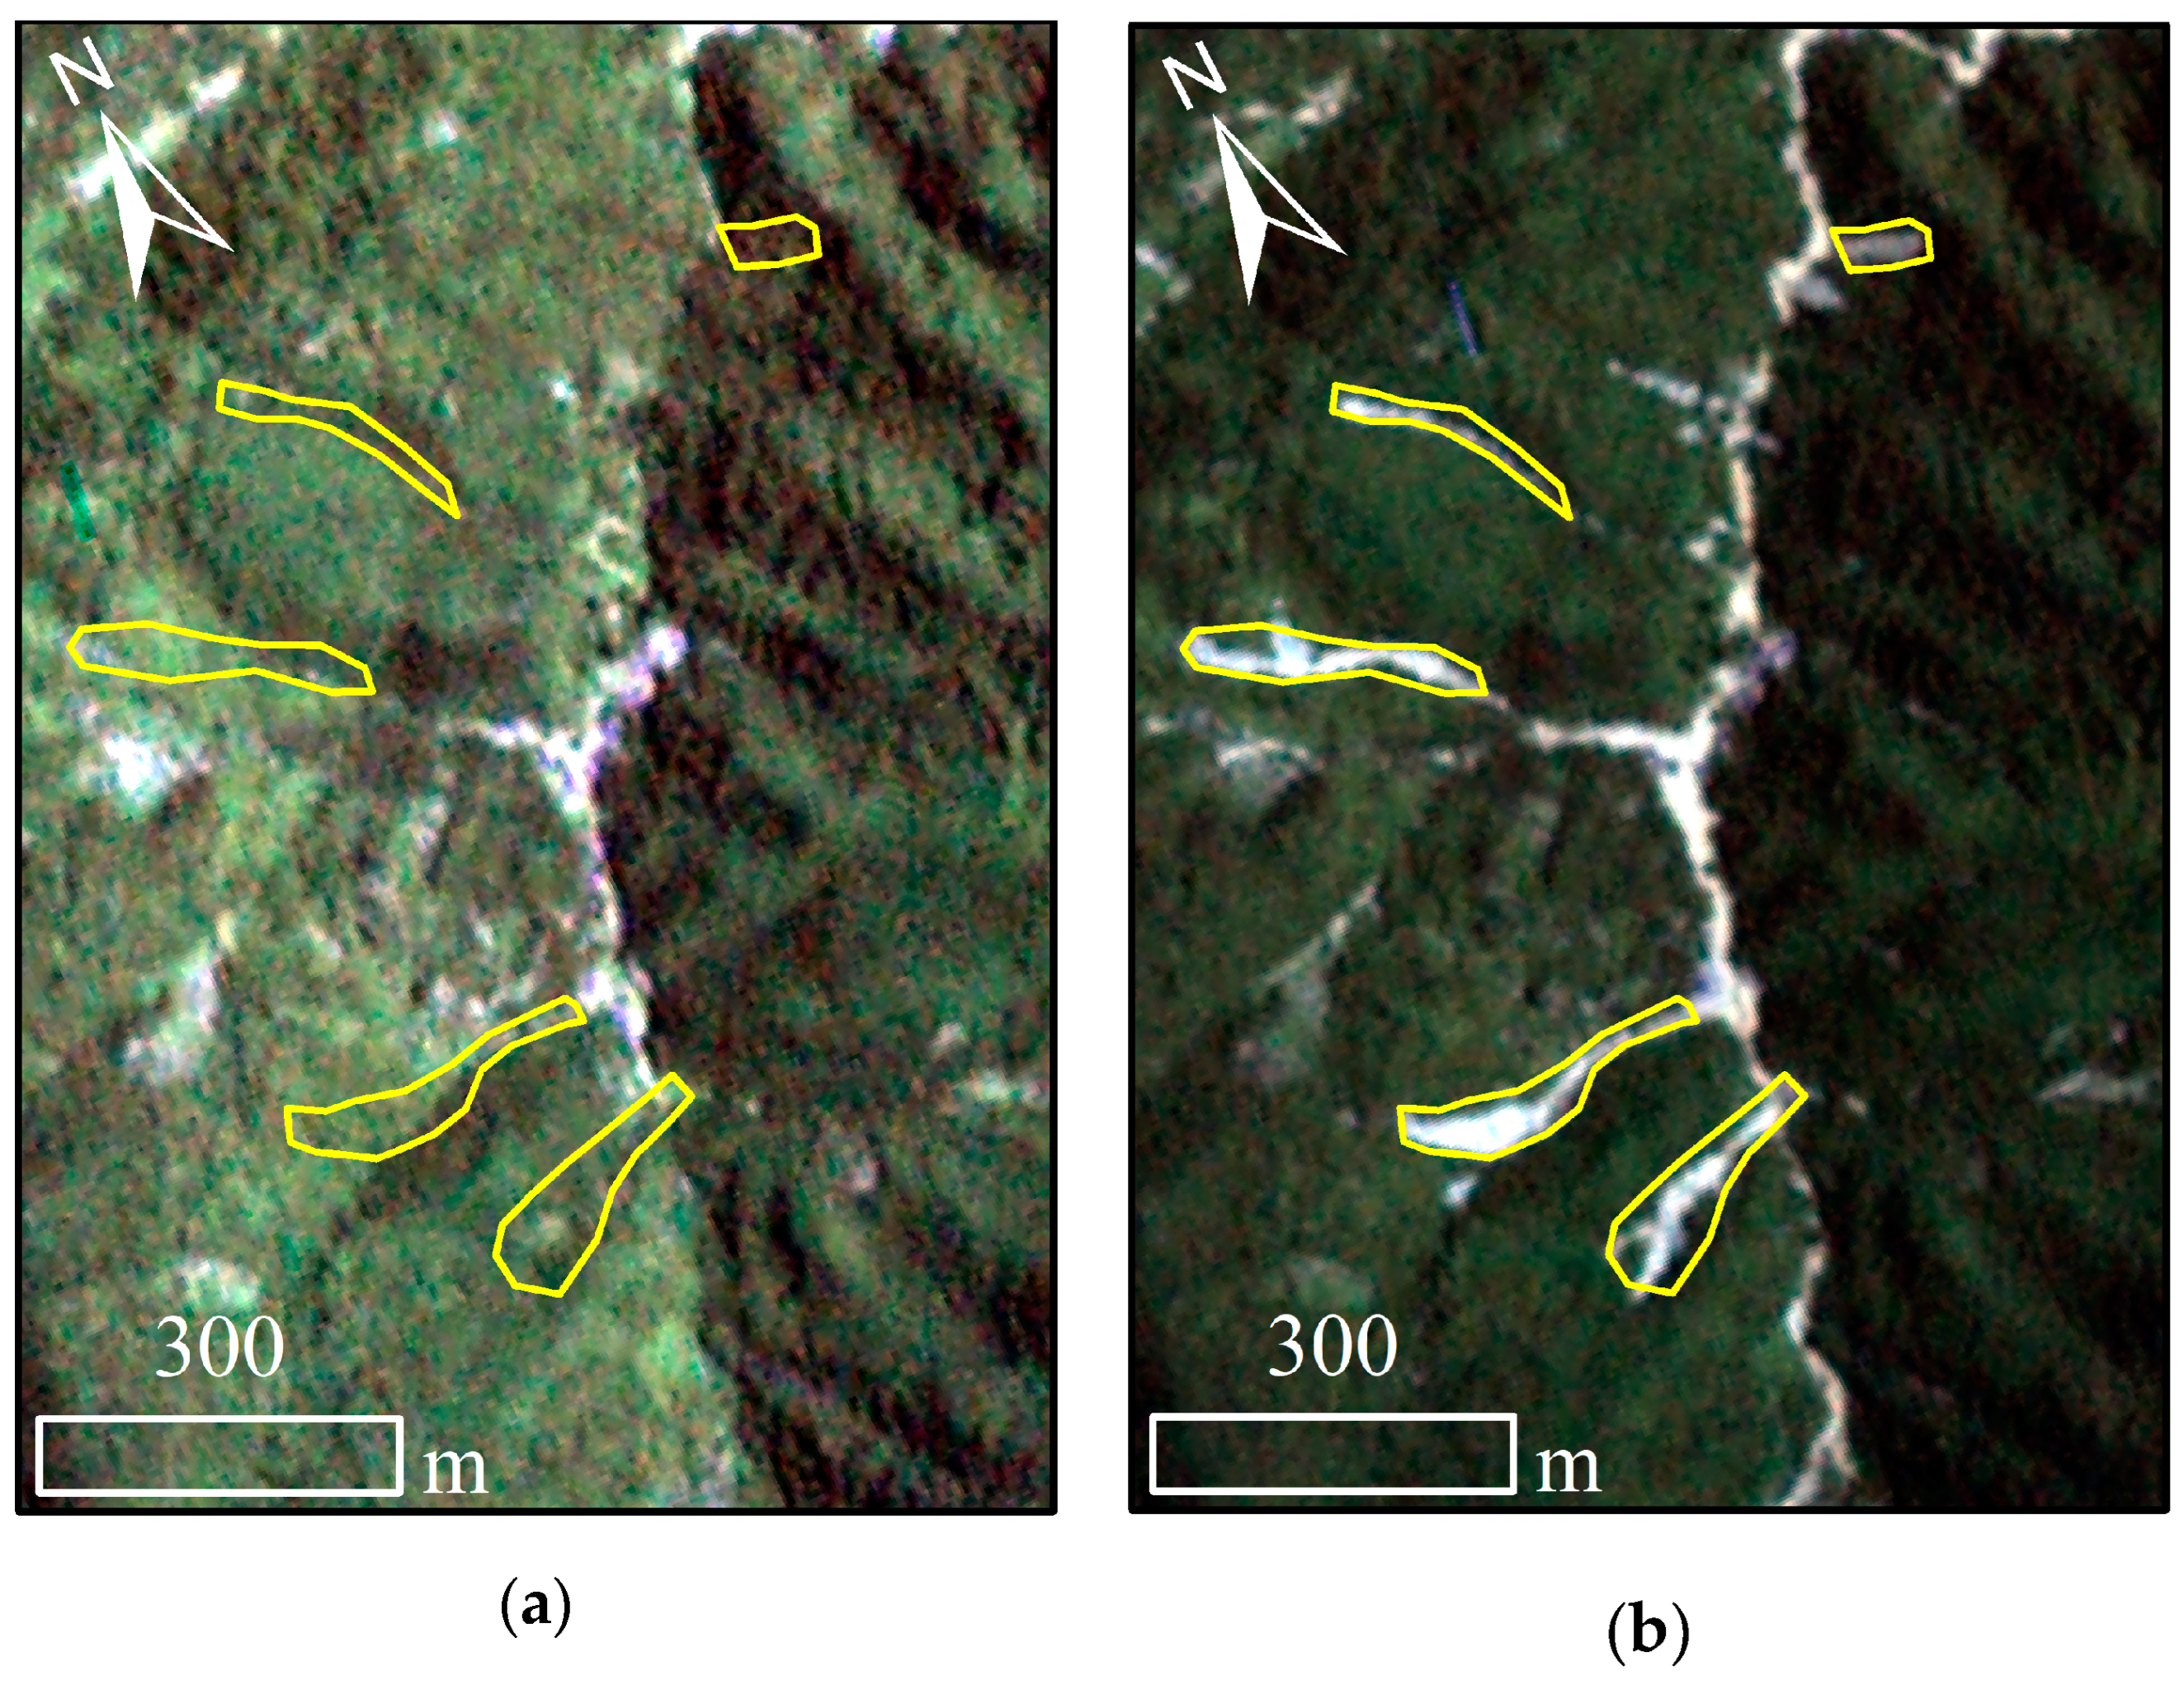
5.1. Landslide Interpretation

In this study, a complete database of shallow landslides in Ningguo City caused by Typhoon Lekima was obtained using visual interpretation of remote sensing images. Then, the Bayesian probability method was combined with a logistic regression model to establish a landslide probability map for the study area. The rationality test using ROC curve shows that the accuracy of the prediction model is very high and the results are reliable. Based on the above results, the real probabilities of landslide occurrence in the study area under five different rainfall conditions of 175–200 mm, 200–250 mm, 250–300 mm, 300–350 mm, and 350–402 mm were predicted.
In recent years, with the popularization of high-precision images and the development of remote sensing technology, new progress has been made in the interpretation and research of landslides caused by extreme rainfall. For example: from 19 to 20 October 2004, Shikoku experienced extreme events of Typhoon Tokage rainfall and 201 small-scale slides in the Moriyuki catchment and 142 in the Monnyu catchment were noticed [27]; from 14 to 16 July 2006, Typhoon Bilis swept over Southern China and, in analyzing the pre- and post-event images of QuickBird and CBERS, a total of 2407 landslide sites in the area around the Dongjiang Reservoir in Hunan Province were inventoried [28]; on 16 October 2013, Typhoon Wipha struck the Izuo-Oshima Volcanic Island, causing torrential rainfall there in a short time, and 44 landslides based on aerial images were interpreted [17]. In this study, satellite images were acquired before and after the rainfall and identified 414 shallow landslides in Ningguo City. Compared with other rainfall landslide sites, Ningguo City is a mountainous and hilly area in southeastern Anhui with complex topography and landforms. Heavy rains have caused floods and triggered massive landslides. In addition, the local lack of adequate defense measures and lack of rescue experience are important reasons for the severe disaster.

5.2. Research on Real Probability Based on the Bayesian Method

Due to the influence of the sampling ratio, the landslide probability obtained using a logistic regression model deviates greatly from the actual landslide probability. In the past, the ratio of landslide sample to non-landslide sample was 1:1 [15,29] and the results obtained by this sampling method are often much larger than the actual landslide probability. In this study, the Bayesian probability method was combined with a logistic regression model. The sample points were selected to be uniformly distributed throughout the entire study area. The size of the study area was 3002.3 km2, and the total landslide area was 1.42 km2. A total of 150,100 points were selected. The obtained random points within a landslide area were defined as landslide samples, and those within non-landslide areas were defined as non-landslide samples. Finally, 72 landslide samples and 15,028 non-landslide samples were obtained.
Based on the Bayesian method, the predicted landslide area A P using the logistic regression model is:
A P = i = 1 m j = 1 n P i , j A
where P i , j is the landslide probability of row i and column j of the grid, m is the number of rows, n is the number of columns, and A is the area of the unit grid (900 m2).
According to the results, the predicted landslide area A P is 1.45 km2.
The relative difference between the predicted landslide area A P and the actual landslide area A a (1.42 km2) is expressed as:
D i f f e r e n t = | A p A a   A a × 100 % |
The relative difference between the predicted landslide area and the actual landslide area is 2.1%, the error is small, the predicted landslide area is close to the actual landslide area, and the prediction result is reliable.
The landslide prediction probability is not only affected by the sampling ratio, but also by various aspects such as grid resolution. The spatial distribution of predicted probability at different resolutions is different [29]. Ways to improve the accuracy of landslide prediction should be further discussed in future research.

6. Conclusions

Based on the landslides in Ningguo City induced by Typhoon Lekima, in this study, 414 landslides were identified via artificial visual interpretation and a rainfall landslide database was established. To analyze the relationships between the factors and the landslide distribution, nine influencing factors were selected: elevation, slope, aspect, distance to faults, strata, distance to rivers, distance to roads, NDVI, and rainfall. The Bayesian probability method and a logistic regression model were used to establish a landslide occurrence probability model for the study area and to predict the probabilities of landslide occurrence under five different rainfall conditions, i.e., 175–200 mm, 200–250 mm, 250–300 mm, 300–350 mm, and 350–402 mm. The results show that elevation, slope, rainfall, distance to faults, distance to rivers, and distance to roads positively correlate with the occurrence of rainfall-induced landslides, and the NDVI negatively correlates with the occurrence of rainfall-induced landslides.
Landslides were caused by Typhoon Lekima’s rainstorm, and many geological disasters were induced by the typhoon’s landfall. Ningguo City was only one of the areas that experienced serious geological disasters. If images of the entire typhoon transit area were collected and a large-scale landslide interpretation was performed, a complete database of landslides caused by Typhoon Lekima’s rainstorm in the southeast coastal area could be constructed; in addition, similar analysis and landslide prediction could be conducted, which would be of great significance to the disaster prevention and reduction of typhoon rainstorm-induced landslides in the southeast coastal area. This work will be carried out in a future study.

Author Contributions

Conceptualization, Q.H.; methodology, Y.C.; software, J.J.; validation, K.Y.; investigation, C.X.; writing—original draft preparation, Y.C.; writing—review and editing, C.X.; funding acquisition, Y.C. All authors have read and agreed to the published version of the manuscript.

Funding

This research was funded by the Fundamental Research Funds for the Central Universities, CHD, grant number 300102261503, the Natural Science Research Project of the Colleges and Universities in Anhui Province, grant number KJ2020ZD34, and the Postdoctoral Fund in Anhui Province, grant number 2021B545.

Data Availability Statement

The data used to support the findings of this study are included within the article.

Acknowledgments

We thank LetPub (www.letpub.com, accessed on 20 February 2022) for its linguistic assistance during the preparation of this manuscript.

Conflicts of Interest

The authors declare no conflict of interest.

References

  1. Jiao, F. Analysis of Energy Evolution Characteristics and Transformation Mechanism of Typhoon “Mujigae” (2015) in the Process of Offshore and Landing. Ph.D. Thesis, Nanjing University of Information Science & Technology, Nanjing, China, 2021. [Google Scholar]
  2. Wang, L.; Luo, Y.; Xu, L.Y.; Zhang, Q.; Chen, Y.; Ye, D.X. Review of Typhoon and Its Related Natural Disasters over the Past 35 Years in China. Sci. Technol. Rev. 2006, 24, 23–25. (In Chinese) [Google Scholar]
  3. Liu, D.; Liang, P.; Xie, B. Typhoon disaster in China: Prediction, prevention, and mitigation. Nat. Hazards 2009, 49, 421–436. [Google Scholar] [CrossRef]
  4. Borghuis, A.; Chang, K.; Lee, H. Comparison between automated and manual mapping of typhoon-triggered landslides from SPOT-5 imagery. Int. J. Remote Sens. 2007, 28, 1843–1856. [Google Scholar] [CrossRef]
  5. Yin, K.; Chen, L.C.; Zhang, G. Regional landslide hazard warning and risk assessment. Earth Sci. Front. 2007, 14, 85–93. [Google Scholar] [CrossRef]
  6. Xu, J.; Li, W. Characteristics of Rainfall for Typhoon Rainstorm Induced Geological Hazards. Meteorol. Mon. 2009, 35, 42–48. (In Chinese) [Google Scholar]
  7. Cui, Y.; Hu, J.; Xu, C.; Zheng, J.; Wei, J. A catastrophic natural disaster chain of typhoon-rainstorm-landslide-barrier lake-flooding in Zhejiang Province, China. J. Mt. Sci. 2021, 18, 2108–2119. [Google Scholar] [CrossRef]
  8. Xiang, C.; Zhao, H.; Liu, Q.; Dong, L. The distribution of torrential rain after landfalling of Typhoon “Lekima” (1909). J. Meteorol. Sci. 2020, 40, 294–302. (In Chinese) [Google Scholar]
  9. Dahal, R.K.; Hasegawa, S.; Nonomura, A.; Yamanaka, M.; Masuda, T.; Nishino, K. Failure characteristics of rainfall-induced shallow landslides in granitic terrains of Shikoku Island of Japan. Environ. Geol. 2009, 56, 1295–1310. [Google Scholar] [CrossRef]
  10. Greco, R.; Giorgio, G.; Capparelli, G.; Versace, P. Early warning of rainfall-induced landslides based on empirical mobility function predictor. Eng. Geol. 2013, 153, 68–79. [Google Scholar] [CrossRef]
  11. Gutierrez-Martin, A. A GIS-physically-based emergency methodology for predicting rainfall-induced shallow landslide zonation. Geomorphology 2020, 359, 107121. [Google Scholar] [CrossRef]
  12. Althuwaynee, O.F.; Pradhan, B.; Ahmad, N. Estimation of rainfall threshold and its use in landslide hazard mapping of Kuala Lumpur metropolitan and surrounding areas. Landslides 2015, 12, 861–875. [Google Scholar] [CrossRef]
  13. Segoni, S.; Piciullo, L.; Gariano, S.L. A review of the recent literature on rainfall thresholds for landslide occurrence. Landslides 2018, 15, 1483–1501. [Google Scholar] [CrossRef]
  14. Teja, T.S.; Dikshit, A.; Satyam, N. Determination of rainfall thresholds for landslide prediction using an algorithm-based approach: Case study in the Darjeeling Himalayas, India. Geosciences 2019, 9, 302. [Google Scholar] [CrossRef] [Green Version]
  15. Cui, Y.; Bao, P.; Xu, C.; Ma, S.; Zheng, J.; Fu, G. Landslides triggered by the 6 September 2018 Mw 6.6 Hokkaido, Japan: An updated inventory and retrospective hazard assessment. Earth Sci. Inform. 2020, 14, 247–258. [Google Scholar] [CrossRef]
  16. Cui, Y.; Hu, J.; Zheng, J.; Fu, G.; Xu, C. Susceptibility assessment of landslides caused by snowmelt in a typical loess area in the Yining County, Xinjiang, China. Q. J. Eng. Geol. Hydrogeol. 2022, 55, 1–10. [Google Scholar] [CrossRef]
  17. Dou, J.; Yunus, A.P.; Tien Bui, D.; Sahana, M.; Chen, C.W.; Zhu, Z.; Wang, W.; Thai Pham, B. Evaluating GIS-based multiple statistical models and data mining for earthquake and rainfall-induced landslide susceptibility using the LiDAR DEM. Remote Sens. 2019, 11, 638. [Google Scholar] [CrossRef] [Green Version]
  18. Raia, S.; Alvioli, M.; Rossi, M.; Baum, R.; Godt, J.; Guzzetti, F. Improving predictive power of physically based rainfall-induced shallow landslide models: A probabilistic approach. Geosci. Model Dev. 2014, 7, 495–514. [Google Scholar] [CrossRef] [Green Version]
  19. Capparelli, G.; Versace, P. FLaIR and SUSHI: Two mathematical models for early warning of landslides induced by rainfall. Landslides 2011, 8, 67–79. [Google Scholar] [CrossRef]
  20. Dou, J.; Yunus, A.P.; Bui, D.T.; Merghadi, A.; Sahana, M.; Zhu, Z.; Chen, C.W.; Khosravi, K.; Yang, Y.; Pham, B.T. Assessment of advanced random forest and decision tree algorithms for modeling rainfall-induced landslide susceptibility in the Izu-Oshima Volcanic Island, Japan. Sci. Total Environ. 2019, 662, 332–346. [Google Scholar] [CrossRef]
  21. Vasu, N.N.; Lee, S.R.; Pradhan, A.M.S.; Kim, Y.T.; Kang, S.H.; Lee, D.H. A new approach to temporal modelling for landslide hazard assessment using an extreme rainfall induced-landslide index. Eng. Geol. 2016, 215, 36–49. [Google Scholar] [CrossRef]
  22. Zheng, J.; Zou, Z. Environmental geological characteristics of the mountainarea of southern Anhui Province and treatment of geological disasters due to landslide. J. Hefei Univ. Technol. 2006, 29, 102–105. (In Chinese) [Google Scholar]
  23. Shao, X.; Xu, C.; Ma, S.; Xu, X.; Shyu, J.B.H.; Zhou, Q. Calculation of landslide occurrence probability in Taiwan region under different ground motion conditions. J. Mt. Sci. 2021, 18, 1003–1012. [Google Scholar] [CrossRef]
  24. Dai, F.; Xu, C.; Yao, X.; Xu, L.; Tu, X.; Gong, Q. Spatial distribution of landslides triggered by the 2008 Ms 8.0 Wenchuan earthquake, China. J. Asian Earth Sci. 2011, 40, 883–895. [Google Scholar] [CrossRef]
  25. Shao, X.; Ma, S.; Xu, C.; Zhou, Q. Effects of sampling intensity and non-slide/slide sample ratio on the occurrence probability of coseismic landslides. Geomorphology 2020, 363, 107222. [Google Scholar] [CrossRef]
  26. Xu, C.; Shen, L.; Wang, G. Soft computing in assesment of earthquake-triggered landslide susceptibility. Environ. Earth Sci. 2016, 75, 767. [Google Scholar] [CrossRef]
  27. Dhakal, A.S.; Sidle, R.C. Distributed simulations of landslides for different rainfall conditions. Hydrol. Processes 2004, 18, 757–776. [Google Scholar] [CrossRef]
  28. Dou, J.; Yamagishi, H.; Xu, Y.; Zhu, Z.; Yunus, A.P. Characteristics of the torrential rainfall-induced shallow landslides by Typhoon Bilis, in July 2006, using remote sensing and GIS. In GIS Landslide; Springer: Tokyo, Japan, 2017; pp. 221–230. [Google Scholar]
  29. Shao, X.; Ma, S.; Xu, C.; Xu, X. Effects of raster resolution on real probability of landslides. Remote Sens. Appl. Soc. Environ. 2020, 19, 100364. [Google Scholar] [CrossRef]
Figure 1. Location of the study area.
Forests 13 00732 g001
Figure 2. Topography and geomorphology. F1: Zhufengpu fault; F2: Zhangcun fault; F3: Xiyusucun-Pawandian fault; F4: Longzhishan thrust; F5: Jixi-Houkengwu thrust; F6: Jikengkou-Hulesi thrust; F7: Tangjiawan fault; F8: Taohuayuan fault.
Forests 13 00732 g002
Figure 3. Average rainfall in Ningguo City from 1989 to 2018.
Forests 13 00732 g003
Figure 4. Typical landslide examples. (a) Image acquired before the landslides occurred and (b) image acquired after the landslides occurred.
Forests 13 00732 g004
Figure 5. Influencing factor layers. (a) Elevation; (b) Slope; (c) Aspect; (d) Distance to faults; (e) Strata; (f) Distance to rivers; (g) Distance to roads; (h) NDVI; (i) 3 days rainfall.
Forests 13 00732 g005aForests 13 00732 g005b
Figure 6. Relationships between landslide distribution and influencing factors. CA: classification area; LND: landslide number density; LAP: landslide area percentage. (a) Elevation; (b) Slope; (c) Aspect; (d) Distance to faults; (e) Strata; (f) Distance to rivers; (g) Distance to roads; (h) NDVI; (i) 3 days rainfall.
Forests 13 00732 g006aForests 13 00732 g006b
Figure 7. Landslide occurrence probability model. (a) Landslide occurrence probability distribution and (b) ROC curve of the model.
Forests 13 00732 g007
Figure 8. Landslide probability distribution map for different amounts of 3 days of rainfall: (a) 175–200 mm; (b) 200–250 mm; (c) 250–300 mm; (d) 300–350 mm; (e) 350–402 mm.
Forests 13 00732 g008
Figure 9. Areas of different probabilities.
Forests 13 00732 g009
Table 1. Number of landslides and proportion of landslide area.
Landslide Area Zones (m2)0–20002000–50005000–10,00010,000–20,00020,000–50,000
Number of landslides19714950117
Proportion of landslides (%)47.63612.12.61.7
Landslide area (km2)0.250.450.340.140.24
Proportion of landslide area (%)17.631.723.99.916.9
Table 2. Classification of influencing factors.
Influencing FactorsClassification StandardType
Elevation (m)1. 12–250; 2. 250–500; 3. 500–750; 4. 750–1000; 5. 1000–1250; 6. 1250–1444Continuous
Slope (°)1. 0–10; 2. 10–20; 3. 20–30; 4. 30–40; 5. 40–50; 6. 50–80Continuous
Aspect1. N (0–22.5, 337.5–360); 2. NE (22.5–67.5); 3. E (67.5–112.5); 4.SE (112.5–157.5); 5. S (157.5–202.5); 6. SW (202.5–247.5); 7. W (247.5–292.5); 8. NW (292.5–337.5); 9. Flat (−1)Classification
Distance to faults (m)1. 0–1000; 2. 1000–2000; 3. 2000–3000; 4. 3000–4000; 5. 4000–5000; 6. 5000–10,000Continuous
Strata1. unknown strata; 2. Ordovician (O); 3. Cambrian (∈); 4. Triassic (T); 5. Sinian (Z); 6. Silurian (S); 7. Jurassic (J); 8. Cretaceous (K); 9. Quaternary (Qp); 10. Permian (P); 11. Devonian (D); 12. Carboniferous (C); 13. granite porphyry (γπ)Classification
Distance to rivers (m)1. 0–1500; 2. 1500–3000; 3. 3000–4500; 4. 4500–6000; 5. 6000–7500; 6. 7500–9000; 7. 9000–31,000Continuous
Distance to roads (m)1. 0–2500; 2. 2500–5000; 3. 5000–7500; 4. 7500–10,000; 5. 10,000–12,500; 6. 12,500–15,000; 7. 15,000–36,000Continuous
NDVI1. 0.35–0.5; 2. 0.5–0.6; 3. 0.6–0.7; 4. 0.7–0.8; 5. 0.8–0.9; 6. 0.9–0.98Continuous
3 days rainfall (mm)1. 175–200; 2. 200–250; 3. 250–300; 4. 300–350; 5. 350–402Continuous
Table 3. Weights of each factor.
FactorsTypeClassificationWeights
ElevationContinuous 0.166
SlopeContinuous 0.195
RainfallContinuous 0.211
NDVIContinuous −0.274
Distance to faultsContinuous 0.134
Distance to riversContinuous 0.05
Distance to roadsContinuous 0.486
AspectClassification10
20.931
31.004
41.402
51.014
61.201
70.926
80.186
9−11.167
StrataClassification10
2−13.156
3−0.141
4−0.232
51.448
6−2.043
70.41
8−13.589
9−13.821
10−14.688
11−14.631
12−14.861
13−14.328
Publisher’s Note: MDPI stays neutral with regard to jurisdictional claims in published maps and institutional affiliations.

