1. Introduction
There are currently ever-increasing efforts in CTL (cut to length) machines to reduce all aspects of soil damage due to their deployment [
1]. One of the possible solutions is to reduce the pressure on the soil [
2]. This can be achieved by increasing the machine’s contact area with the ground surface. Many conventional solutions are known nowadays such as the fastening of tracks to wheels or the addition of more wheels in combination with tracks [
3,
4]. Nevertheless, there are also new concepts of tracked undercarriages on the standard two-piece frame [
5,
6,
7,
8,
9] or new axles [
10,
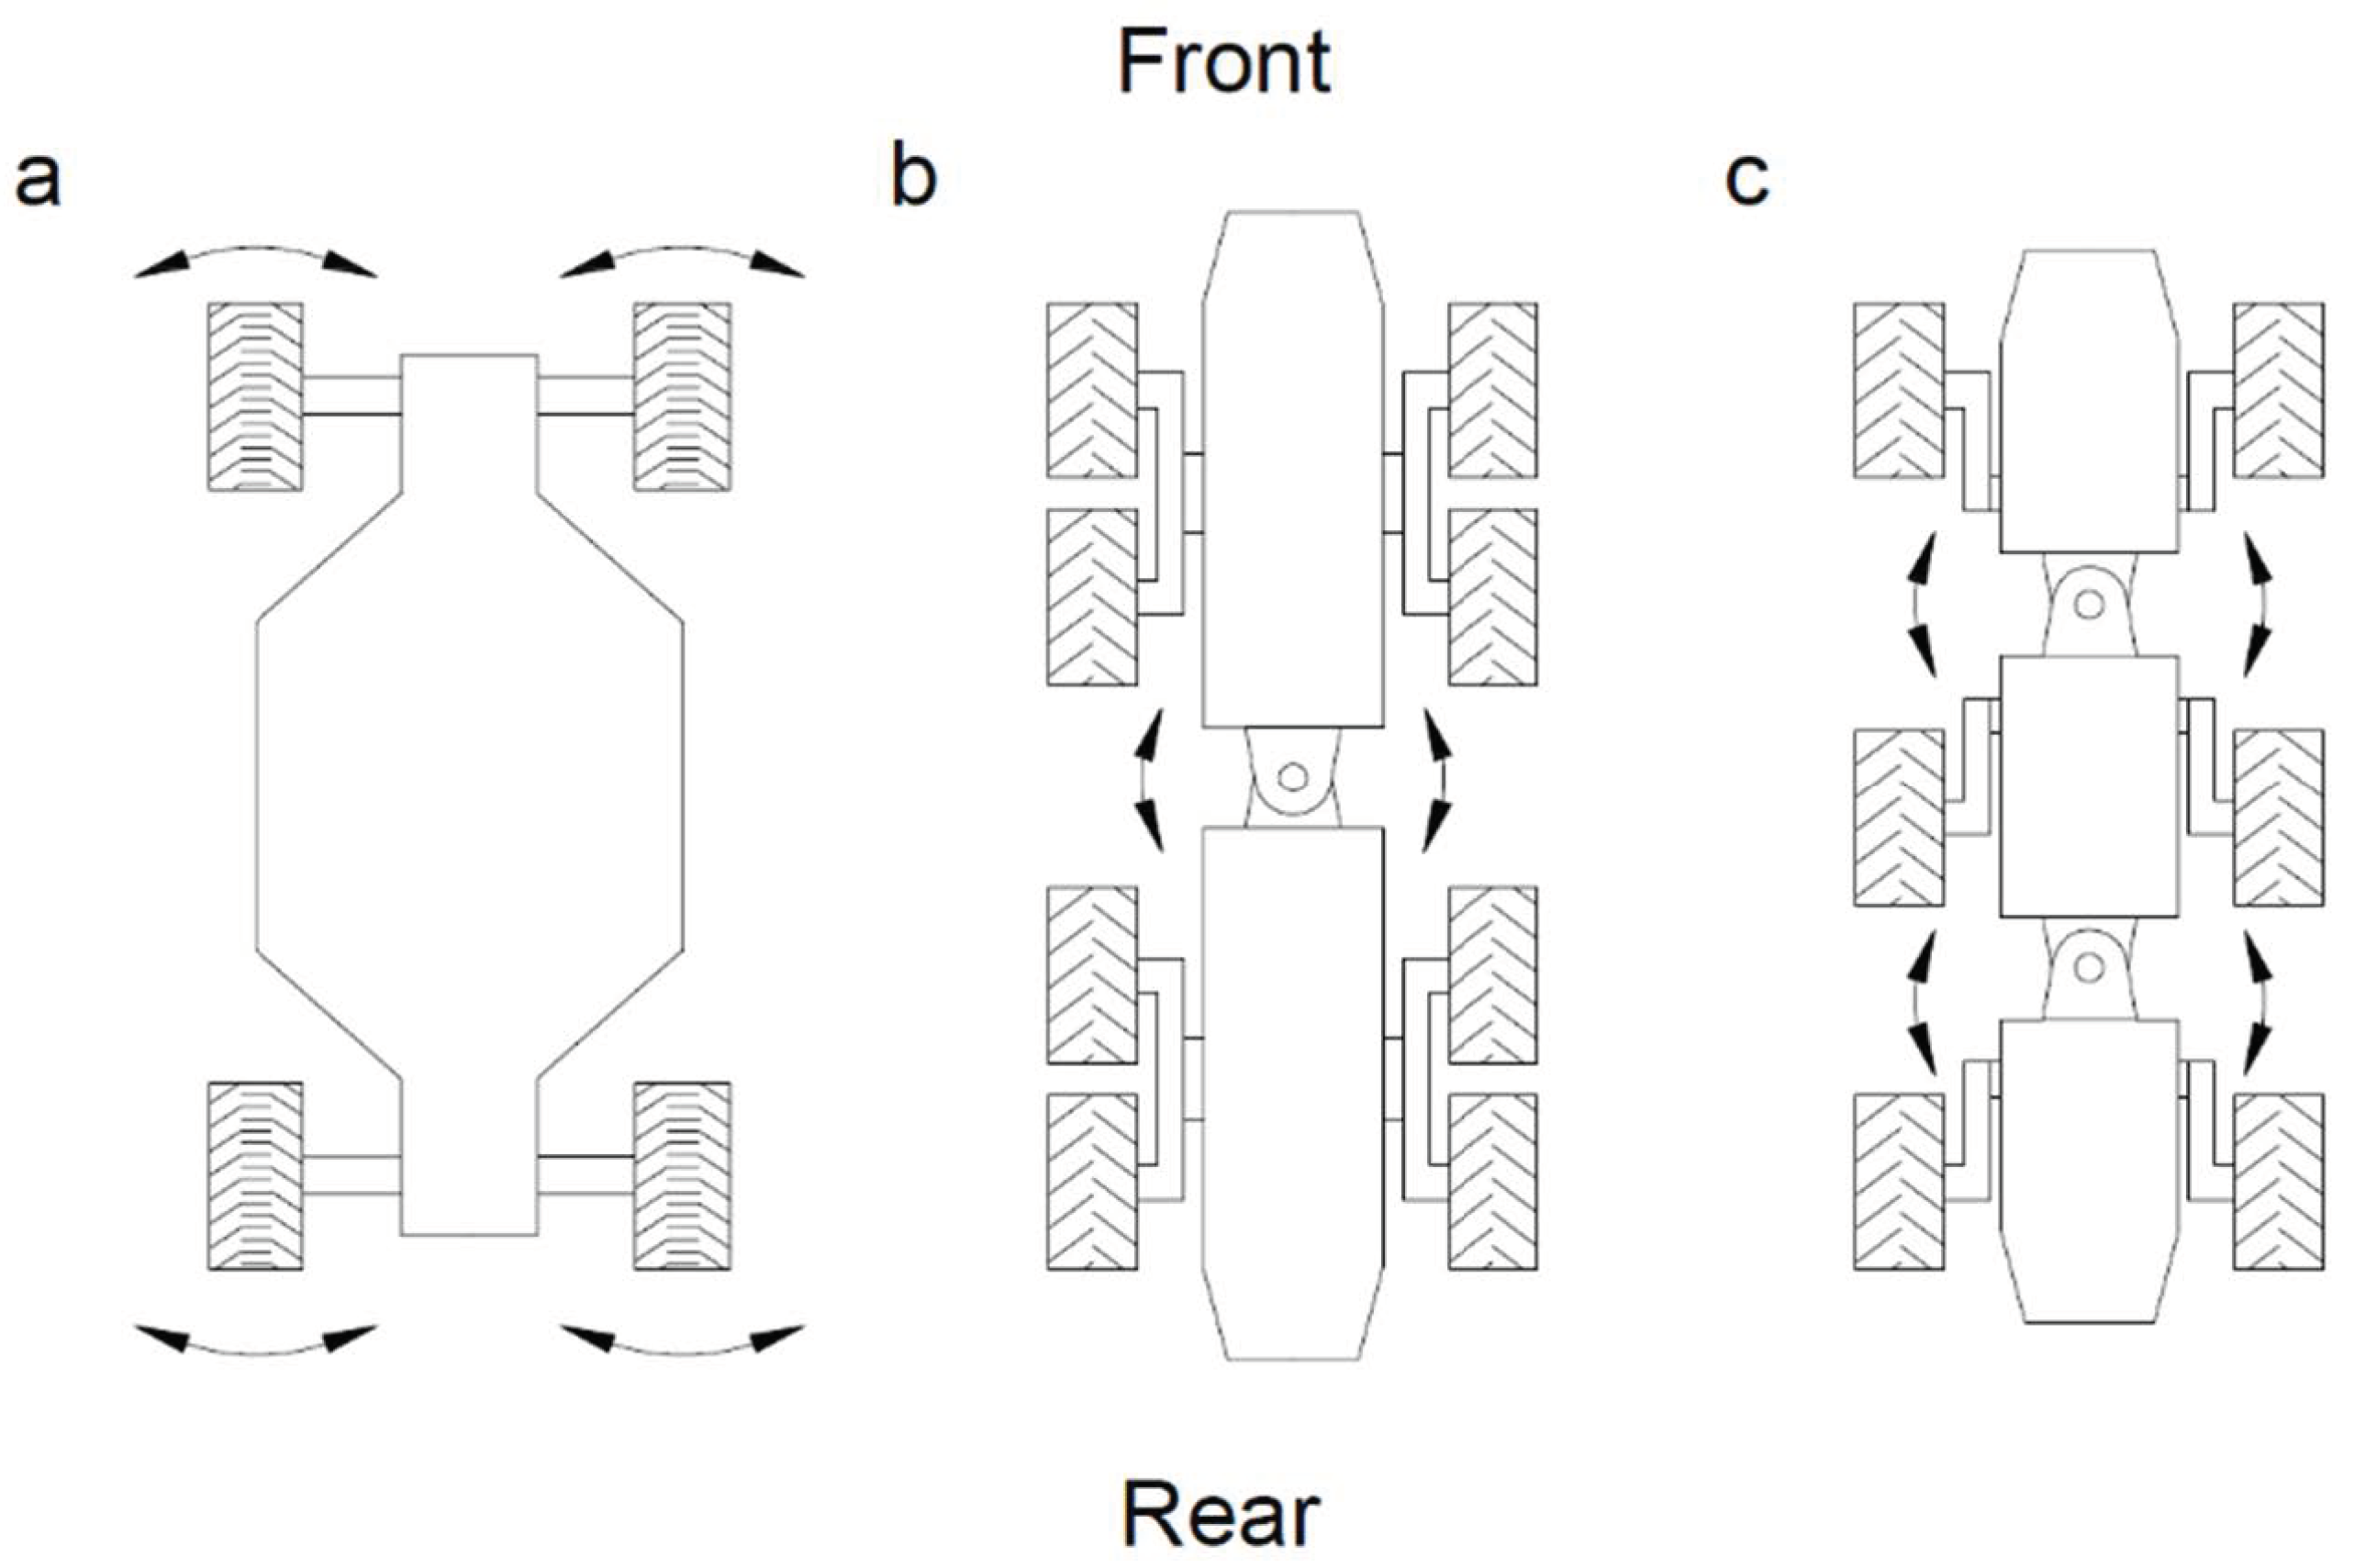
11]. Such a frame consists of the front and rear parts which turn by means of articulated steering [
12] (
Figure 1b). Frames consisting of three parts exist, too. A typical harvester with three frame parts is the Scorpion King made by Ponsse Plc. Thanks to this division, the machine is capable of effective leveling of the cab with the boom [
13].
Another machine produced in the CTL technology with three parts of the frame is the newly designed forwarder XT28 with pendulum axles [
14,
15,
16] (
Figure 1c). Its frame parts are connected and fitted with linear hydraulic cylinders thanks to which articulated steering is made possible among all the connected parts. In their hybrid F15 forwarder, El-forest AB chose a similar solution but with electric motors in the wheels. Research works [
17] indicate that smaller wheel ruts are achieved when turning with this frame. In their prototype of a hybrid harvester, Agama a.s. chose a new approach in creating the machine frame as well. It consists of two fixed axles and a rigid frame (
Figure 1). Fixed axles reduce production costs [
18]. This design exploits the turning of the front and rear axles. (
Figure 1).
All the above-mentioned concepts of undercarriages or new frames of machines in CTL technology affect the safety of machine operators. Operator safety and machine operability can be guaranteed only if the machine stability is known [
19]. Localization of the machine gravity center is one of the main factors for its determination [
20]. In practice, this can be found by tilting the machine on adapted platforms or portable vehicle scales, with the coordinates of the gravity center being additionally calculated from the recorded data [
19,
21,
22]. The calculation can make use e.g., of the energy stability range [
23] or the model calculation according to McGee and Frank [
24]. The current development of CAD-type (Computer-Aided Design) computer design software makes it possible to obtain the center of gravity without gauging ramps or portable vehicle scales [
25,
26]. Machine prototypes are solved virtually using various software, which is less demanding than building a functional test stand. Testing would take a lot of time and money with uncertain results due to the safety of the machine operator and possible destruction when stability values are exceeded. Numerical simulations of CAD software can predict the behavior of the machine already in the phase of the 3D model prototype if all the mass effects of the machine are taken into account. The method is particularly convenient for machines with booms, i.e., for harvesters, too. However, their degree of difference from the previous method with the gauging ramps and portable vehicle scales is not known yet. The goal of this research was to establish the difference between physical prototype verification and 3D CAD simulation and to verify at the same time the stability of a new frame design as well as the stability of the machine manufactured by Agama a.s. Compared to other CTL machine chassis available on the market, this chassis has some potential for design. Vidoni et al. [
27], in their research on an agricultural vehicle, found higher lateral stability of the chassis when compared to the breaking frame when turning uphill and downhill. The difference between the frames was 8°. However, this frame has not been used in the harvester until now and therefore it is necessary to verify its safety for the operator.
2. Materials and Methods
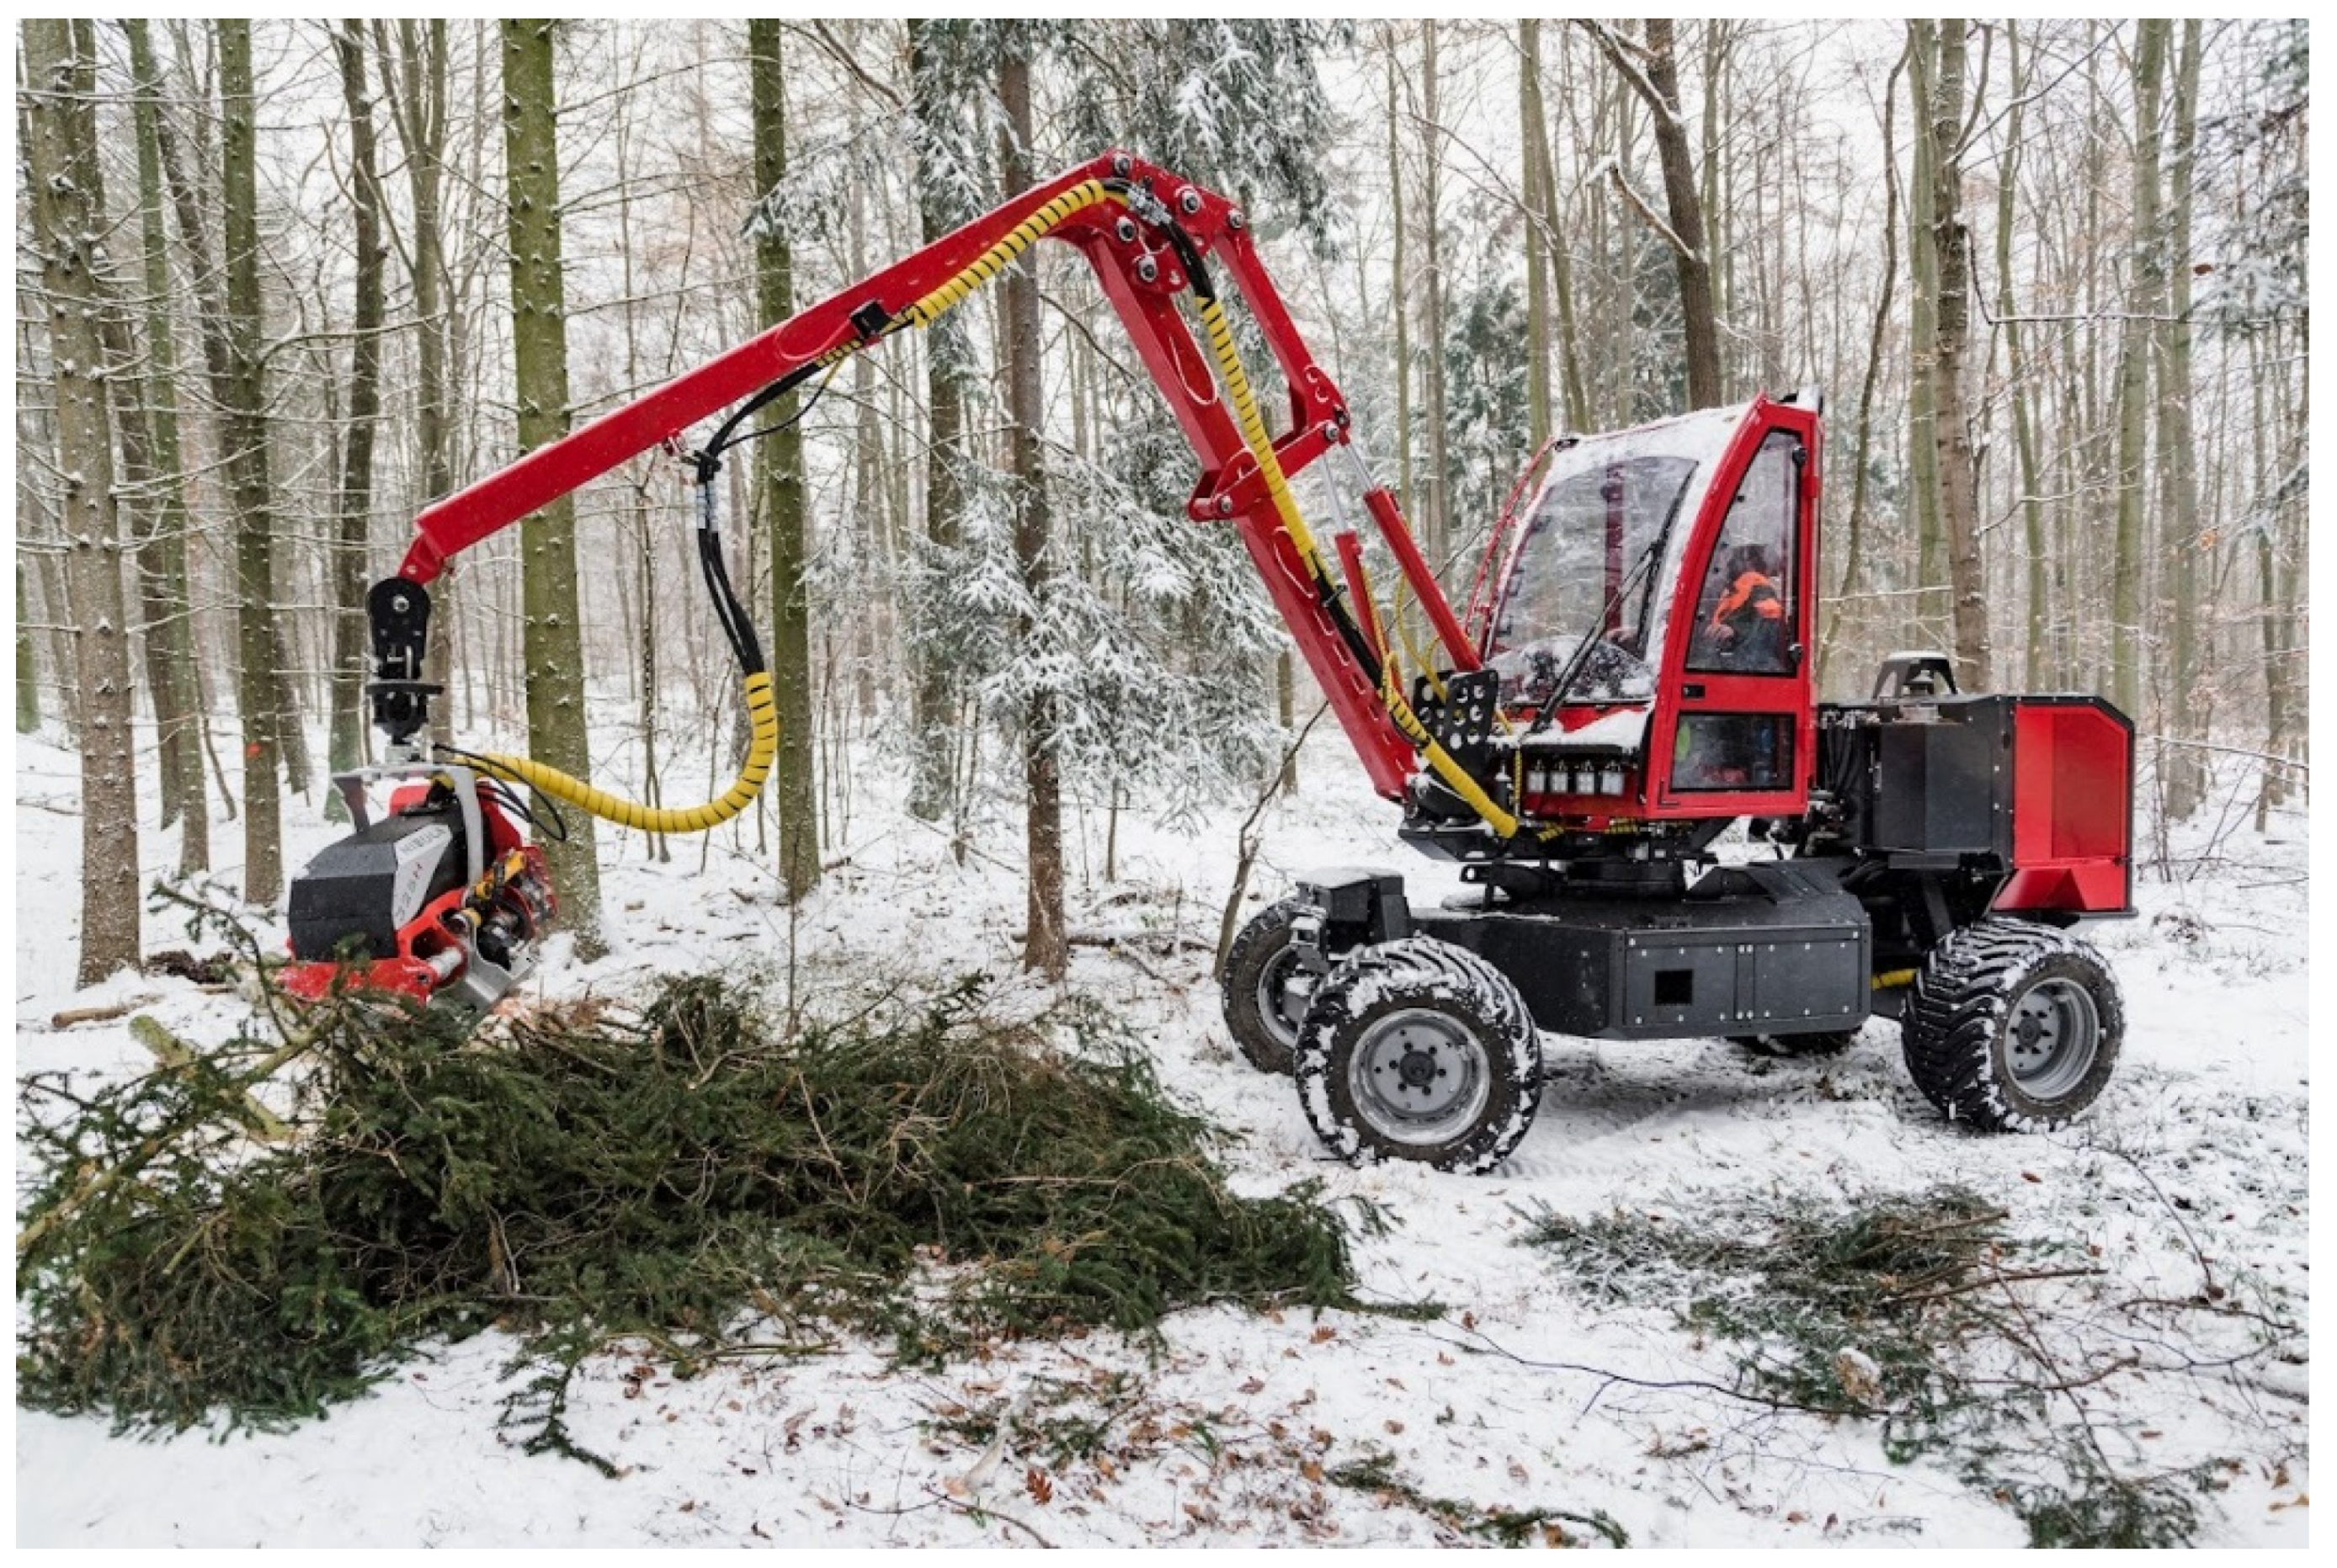
2.1. Machine
A new electric hybrid thinning harvester Model AH6 made by Agama a.s. (
Figure 2) was measured in the research. This newly designed harvester type with an electric hybrid drive is intended for thinning, and its weight is 7640 kg (
Table 1) including fillings and harvester head without the operator. With the operator, the total weight is 7740 kg. The machine is a small wheeled harvester with a newly designed solid frame with fixed axles fitted altogether with 4 wheels (
Figure 1a). Turning of the machine is achieved by turning the wheels on the front and rear axles, which are provided with tires sized at 500 × 45 R22.5. The machine can also turn all wheels in the same direction (a so-called “crab walk”) or turn only by means of the front axle. Driving force transmission is hydrostatic-mechanical with hydraulic motors in the wheels. The frame is leveled by means of the above-mentioned fixed axles, with each axle being leveled by two double-acting linear hydraulic motors. The front axle itself can tilt by up to ±10° and the rear axle by 5° more and has a function of the frame brake of conventional machines. The front axle is continually leveling the machine while driving.
The harvester is equipped with a parallel hydraulic boom in front of the cab on its platform. The swinging cab is located on the ring of the swing bearing which is leveled in two directions only—forward and back (
Table 1). The swing bearing rotation is ±105°. The hydraulic boom and its attachment on the supporting platform of the cab allow vertical boom deflection by ±20° to the left or to the right by means of two double-acting linear hydraulic motors. Together with the cab, the system allows boom leveling and turning in all directions. The machine is equipped with a harvester head Model 325H made by Nisula Forest Oy with a cutting diameter of 340 mm and a weight of 285 kg. The basic parameters of the harvester are presented in
Table 1.
2.2. Simulation
To create virtual 3D models in the computer simulation of the machine gravity center, the SolidWorks software was used, developed by Dassault Systems. This program falls in the group often referred to as CAD (Computer-Aided Design). A standard function of the program is the calculation of the mechanical properties of models that are most important for the construction of machines: volume, weight, the position of gravity center, and moments of inertia to coordinate axes [
28]. To achieve that, the program takes into account the shape and spatial layout of models and allocated material characteristics (namely density). The calculated values are shown in the table and the center of gravity is highlighted in the model.
High accuracy of calculations requires completeness of the model, i.e., modeling of all parts that are then manufactured according to production prototype documentation and complementation with the models of parts purchased from suppliers. Although the willingness of manufacturers to provide models of their products was not negligible, some purchased parts had to be gauged, weighed, and modeled. The resulting overall model of the harvester consists of several thousand partial models which are sequentially associated with basic sub-assemblies, higher assemblies, and assembly groups, which represent a final model of the harvester. On each level of the sequence, kinematic bonds were created, taking off an appropriate degree of freedom among the models or their assemblies to allow an imitation of their mutual movement which they make in a real product.
A con of the high model completeness in terms of both the range of parts and kinematic bonds is the considerable sophistication of both the calculation performance and the working time. This is why some parts were not included in the models because their weight contribution was not essential and their modeling and incorporation into the model assembly would have required inadequate time. This particularly concerns electric cable lines, fuses, electric relays and terminals, hydraulic hoses including fittings, some small fasteners, possibly coolants and oil of the combustion engine. On the other hand, the harvester model includes bulky operating fluids in tanks—fuels and hydraulic oil—as well as the driver, which altogether contribute to the mechanical properties of the harvester model.
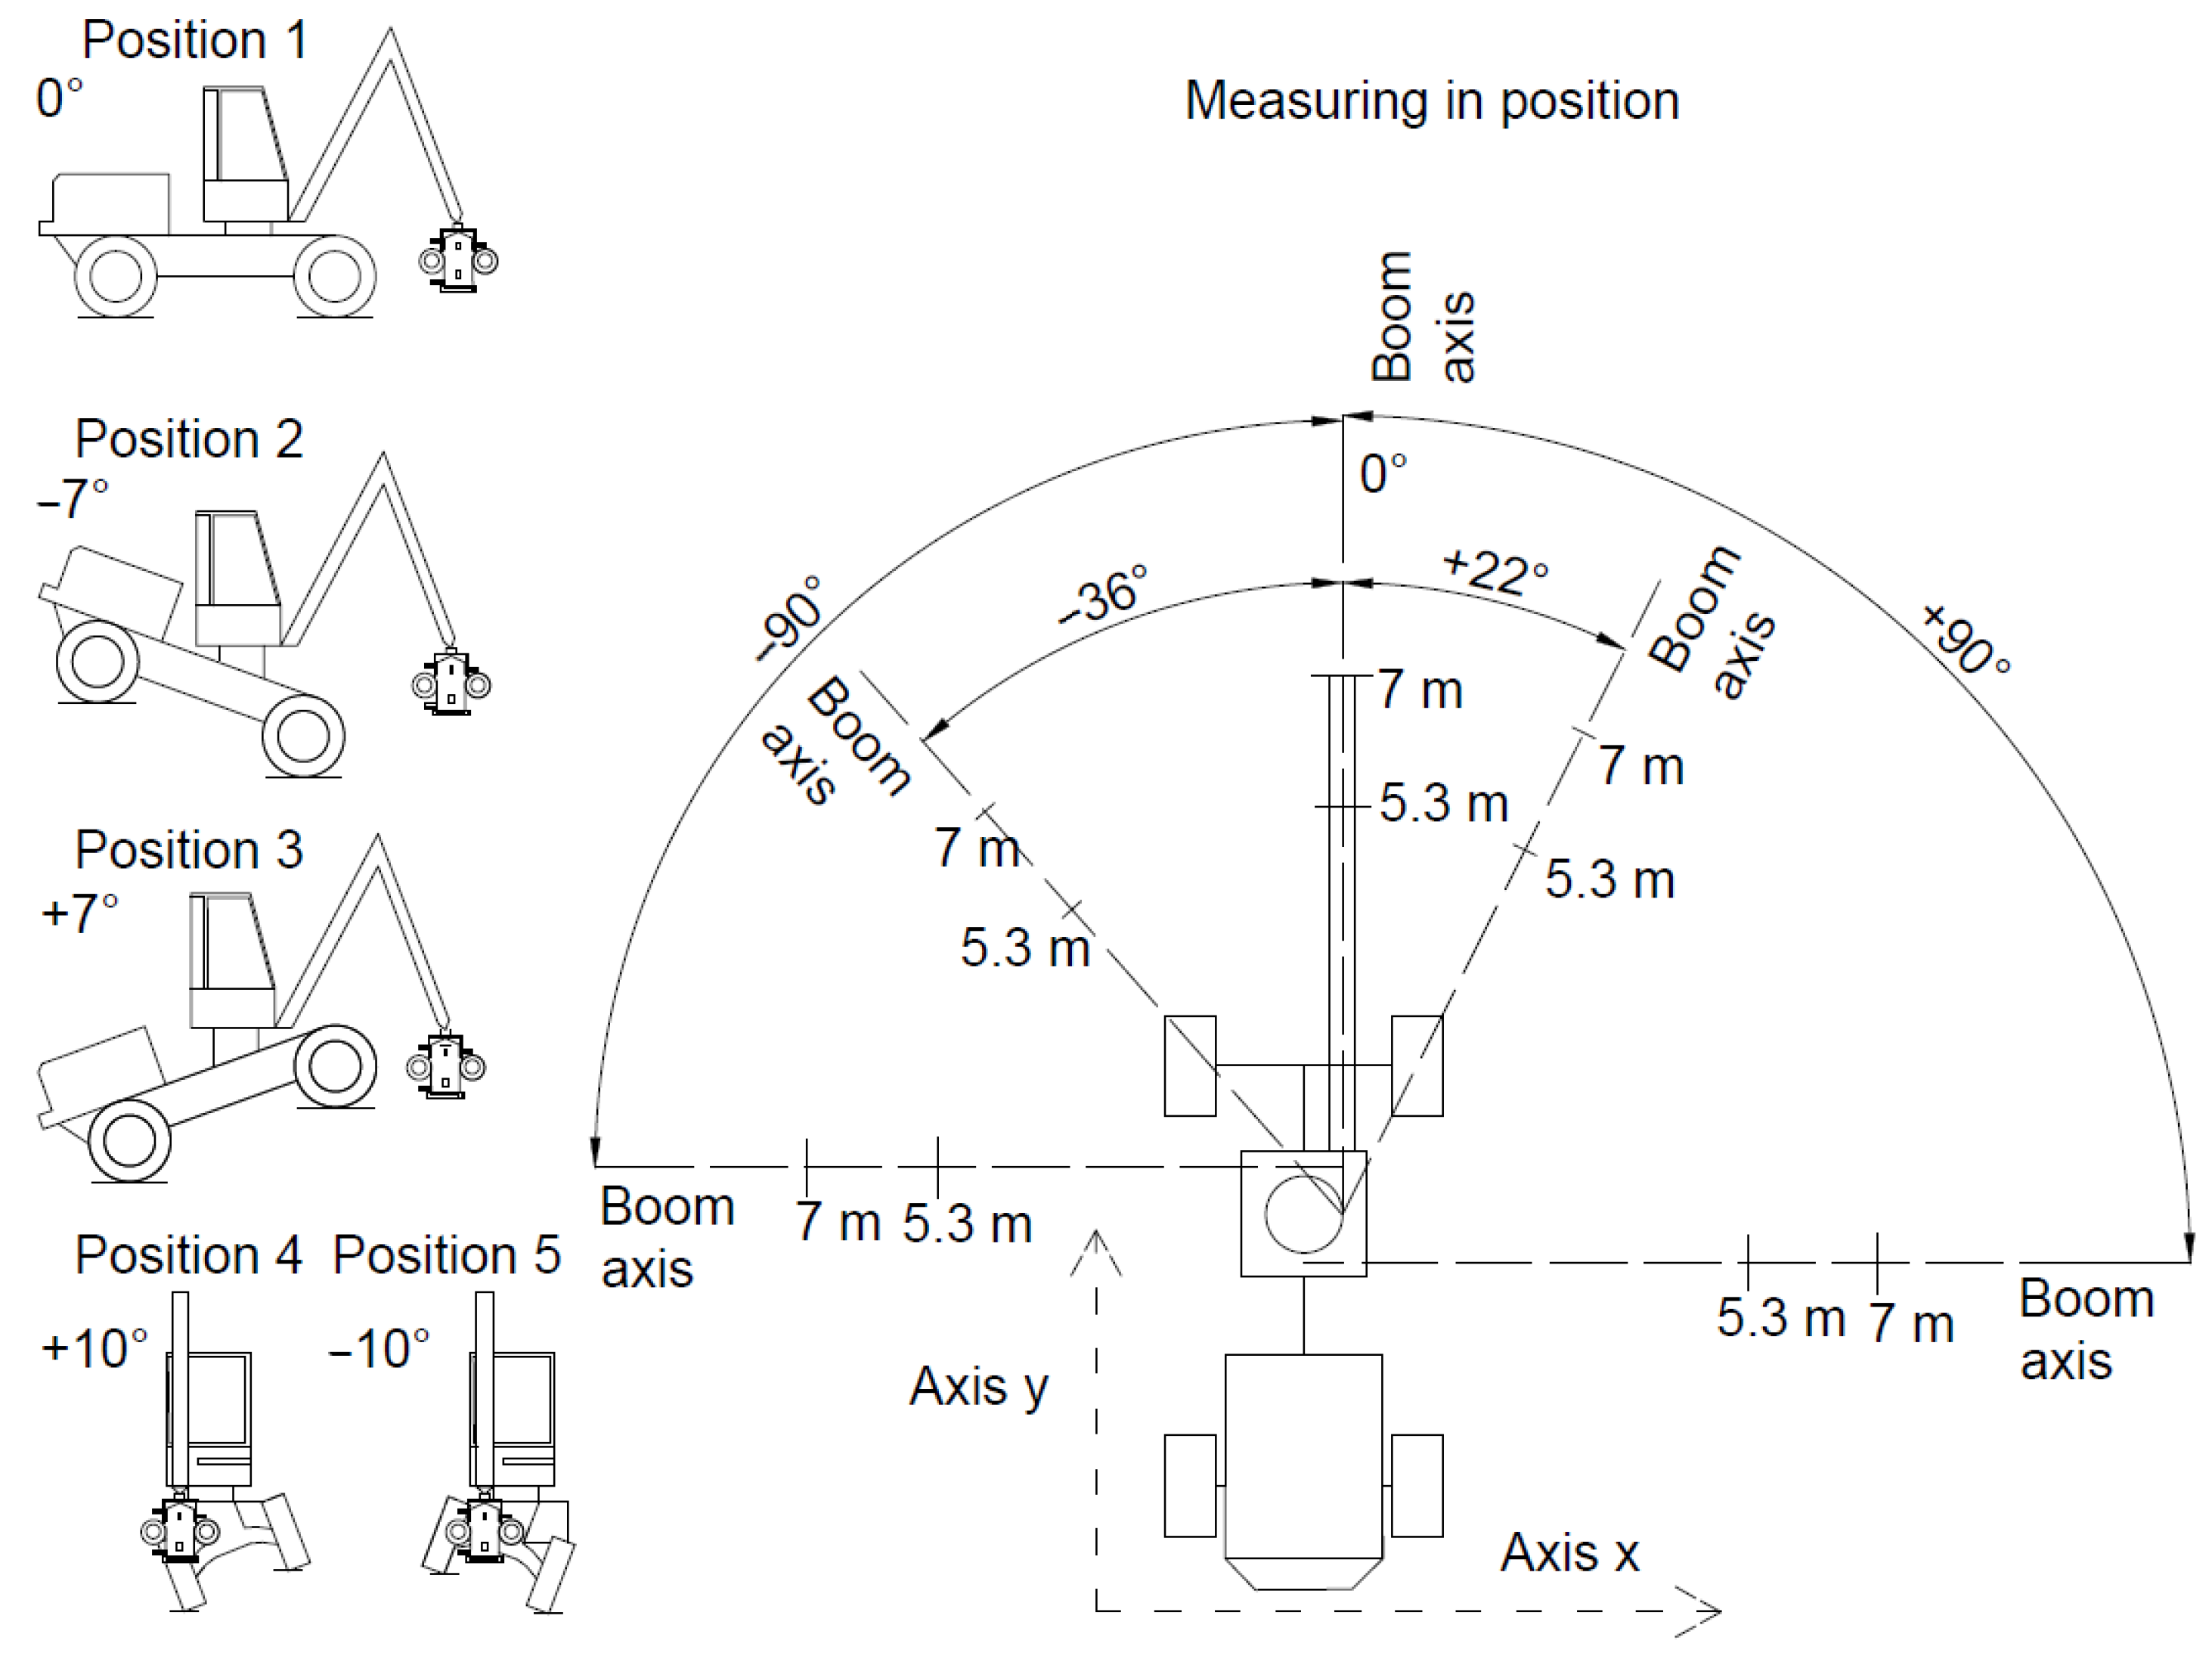
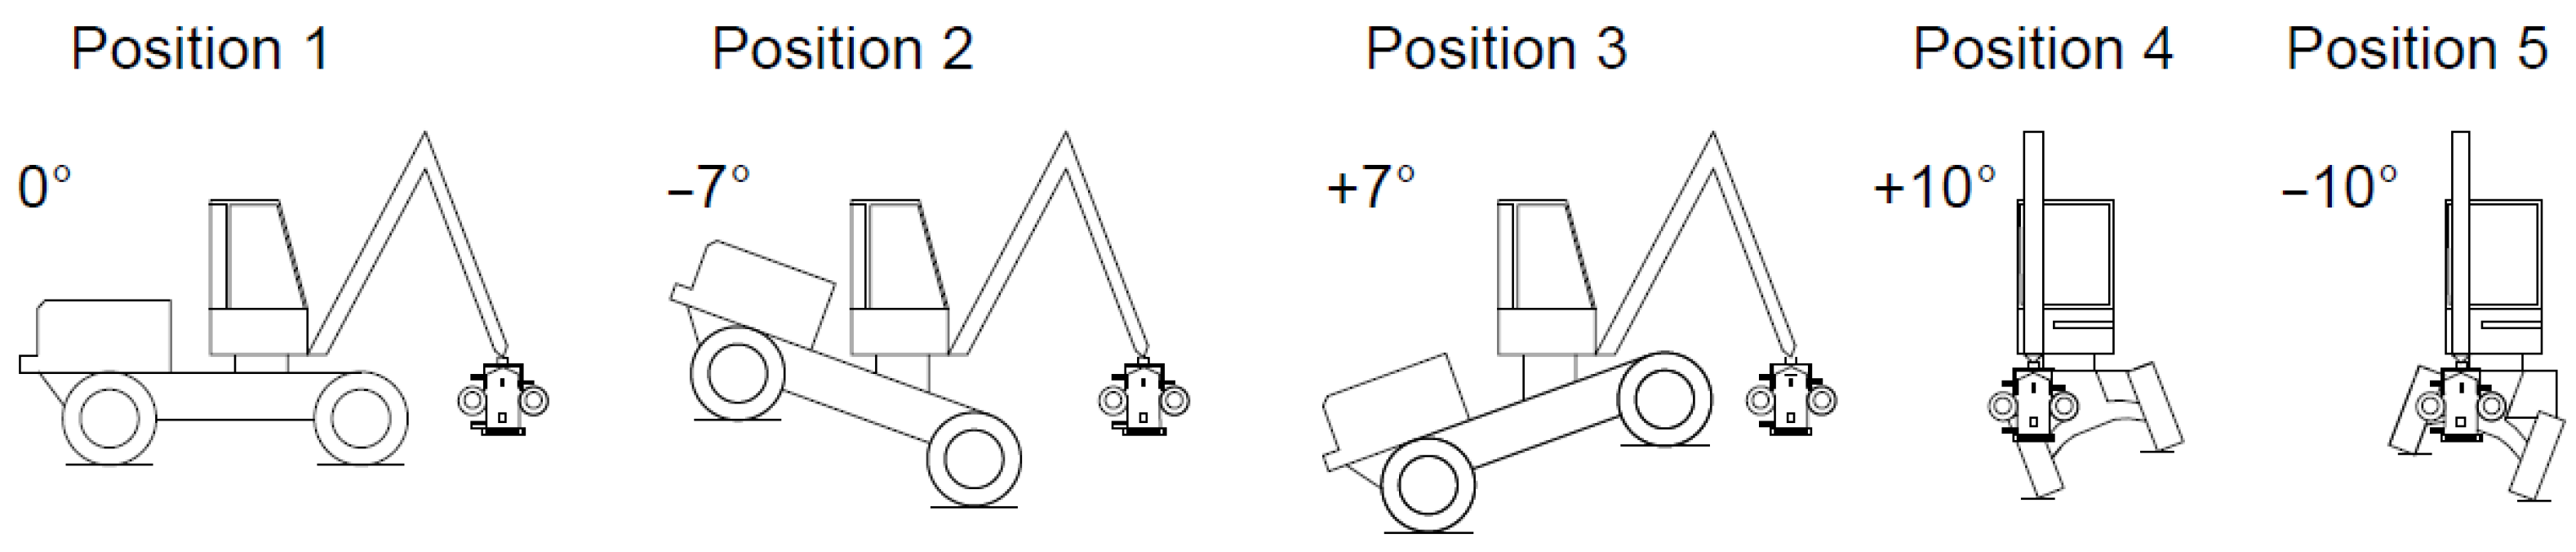
The machine’s center of gravity was simulated in five different positions. For the reason of high demands on computing and labor intensity, the center of gravity was modeled in each position in the final reach of the hydraulic boom (7 m) without the added burden, which, due to the subsequent initial operational investigation of the stability of the prototype and especially the safety of its operator, could not proceed. The burden of these parameters (slim and vertically upright) would cause a large scatter of the measured values during the measurement in order to ensure the correct position during the measurement. If a load of maximum or other weight size were used, the load could not be considered representative due to the variety of wood types harvested. Position 1 was on the flat terrain, in Position 2, the machine was tilted by 7° in the travel direction. In Position 3, the gradient was 7° again but in the opposite direction of travel. The two last positions were in a maximum transverse tilt of the front axle relative to the longitudinal machine axis (10° to both sides). The respective positions are shown in
Figure 3. In each of them, the machine’s center of gravity was determined by different positions of the hydraulic boom. The system of simulation is presented in
Figure 3. In case results from the simulation that could not be verified in real conditions because of the great danger of the machine overturning, the machine’s center of gravity was modeled within the boom reach of 5.3 m from the machine swing bearing. During the simulation, the position of the boom eye hook was at all times at a level of the upper edge of the swing bearing with a zero (initial) point being established on the left rear wheel. The harvester head was considered in the model, too. In Positions 2 and 3, the wheelbase was modified by calculation (see Formula (1)). Similarly, in Positions 4 and 5, the same Formula 1 was used to modify the wheel gauge.
where:
Rh—Modified dimension of harvester (mm)
x—Wheelbase or wheel gauge of harvester (mm)
αu—Angle of machine undercarriage (°)
2.3. Procedure
Modification of bond parameters so that the model is shaped according to real machine position during the measurement, namely the mutual angle between the axes of axles and the machine frame, and the angle of boom turning from the longitudinal machine axis. As to the height position of the boom, it was assumed that the felling head would be above the base plane at a height approximately corresponding to the height of cutting diameter above the ground, i.e., ca. 0.3 m. The base plane is determined by the centers of the tire contact surfaces and replaces the ground surface in the model.
Addition of the weight of the operator into the model.
Calculation of model center of gravity.
Plotting of projection line running through the center of gravity, its direction relative to the base plane is the same as that of gravitational acceleration vector in the given machine position relative to the ground surface when measured on the real machine.
Plotting of horizontal plane perpendicular to the projection line replacing the vector of gravitational acceleration.
Projection of gravity center and centers of the tire contact surfaces into the horizontal plane in the direction of the projection line.
Plotting of an auxiliary system of coordinates lying in the horizontal plane, and with the beginning located in the projection of the center of the contact area of the left rear tire. The x-axis is oriented towards the projection of the center of the contact area of the right rear tire. The y-axis is oriented towards the projection of the center of the contact area of the left front tire.
Focusing the positions of projected points in the auxiliary system of coordinates and entering the values in a table.
As the model behavior is parametric, it is enough when the model bonds and elements such as projection line, horizontal plane, and auxiliary system of coordinates are plotted just once. Then, only the parameters for each other position are modified in the model.
Despite considerable progress in computing, efforts focused on CAD programs to exploit the currently available performance of multicore processors at full are failing. This results in the fact that working with the extensive harvester model is rather time-consuming in spite of the simplicity of the above-mentioned procedure. A certain acceleration can be achieved by loading an incomplete model from storage. However, the goal of this research was the calculation of the gravity center and such a procedure is therefore not possible.
2.4. Gravity Center Verification on the Machine Prototype
Field measurements were taken on paved spaces of Mendel University in Brno. The measurements respected the chosen inclinations in the given machine positions, and even some other measuring points were added to the selected position. Specifically, apart from the point situated 7 m from the axis of the swing bearing of the boom (max. reach), a point was added at a distance of 5.3 m from the axis (
Figure 3). The reason for adding this measuring point was prevention against a possible machine overturning at boom outreach indicated by simulation. This was why the measurement always started at a distance of 5.3 m. In order to speed up the measurement, boom axes and measuring points were always marked on the base with reflective spray. The measurement is shown in
Figure 3. It should be added that the crane was fitted with the given harvester head during the measurement, but without the load as in the simulation, which was performed in order to guarantee the safety of the machine operator during the initial operational tests.
Field measurement results were verified using certified scales according to EN 45501:2015 Dini Argeo DFWKR made by Dini Argeo with a load capacity of up to 8000 kg and 4 platforms with scales. The manufacturer claims a weighing accuracy of up to 5 kg, with the control software of the scales being able to calculate coordinates of the machine’s center of gravity when an appropriate mode is adjusted. The facility was calibrated prior to the measurements. Then a zero (initial) point was entered into the above-mentioned computer software, which was established on the left rear wheel similarly as in the simulation. Wheelbase and wheel gauge were entered as well, which had been modified in the given positions using the same Formula (1) as in the simulation. Subsequently, the platforms of portable scales were placed under individual machine wheels and the calculated coordinates were compared with the simulation.
3. Results
A partial goal of this research study was SW simulation of gravity center in different machine positions (
Figure 4). The resulting coordinates can then be verified also on the research site. The individual positions are shown in
Figure 3 and measurement details are presented in the Simulation sub-chapter.
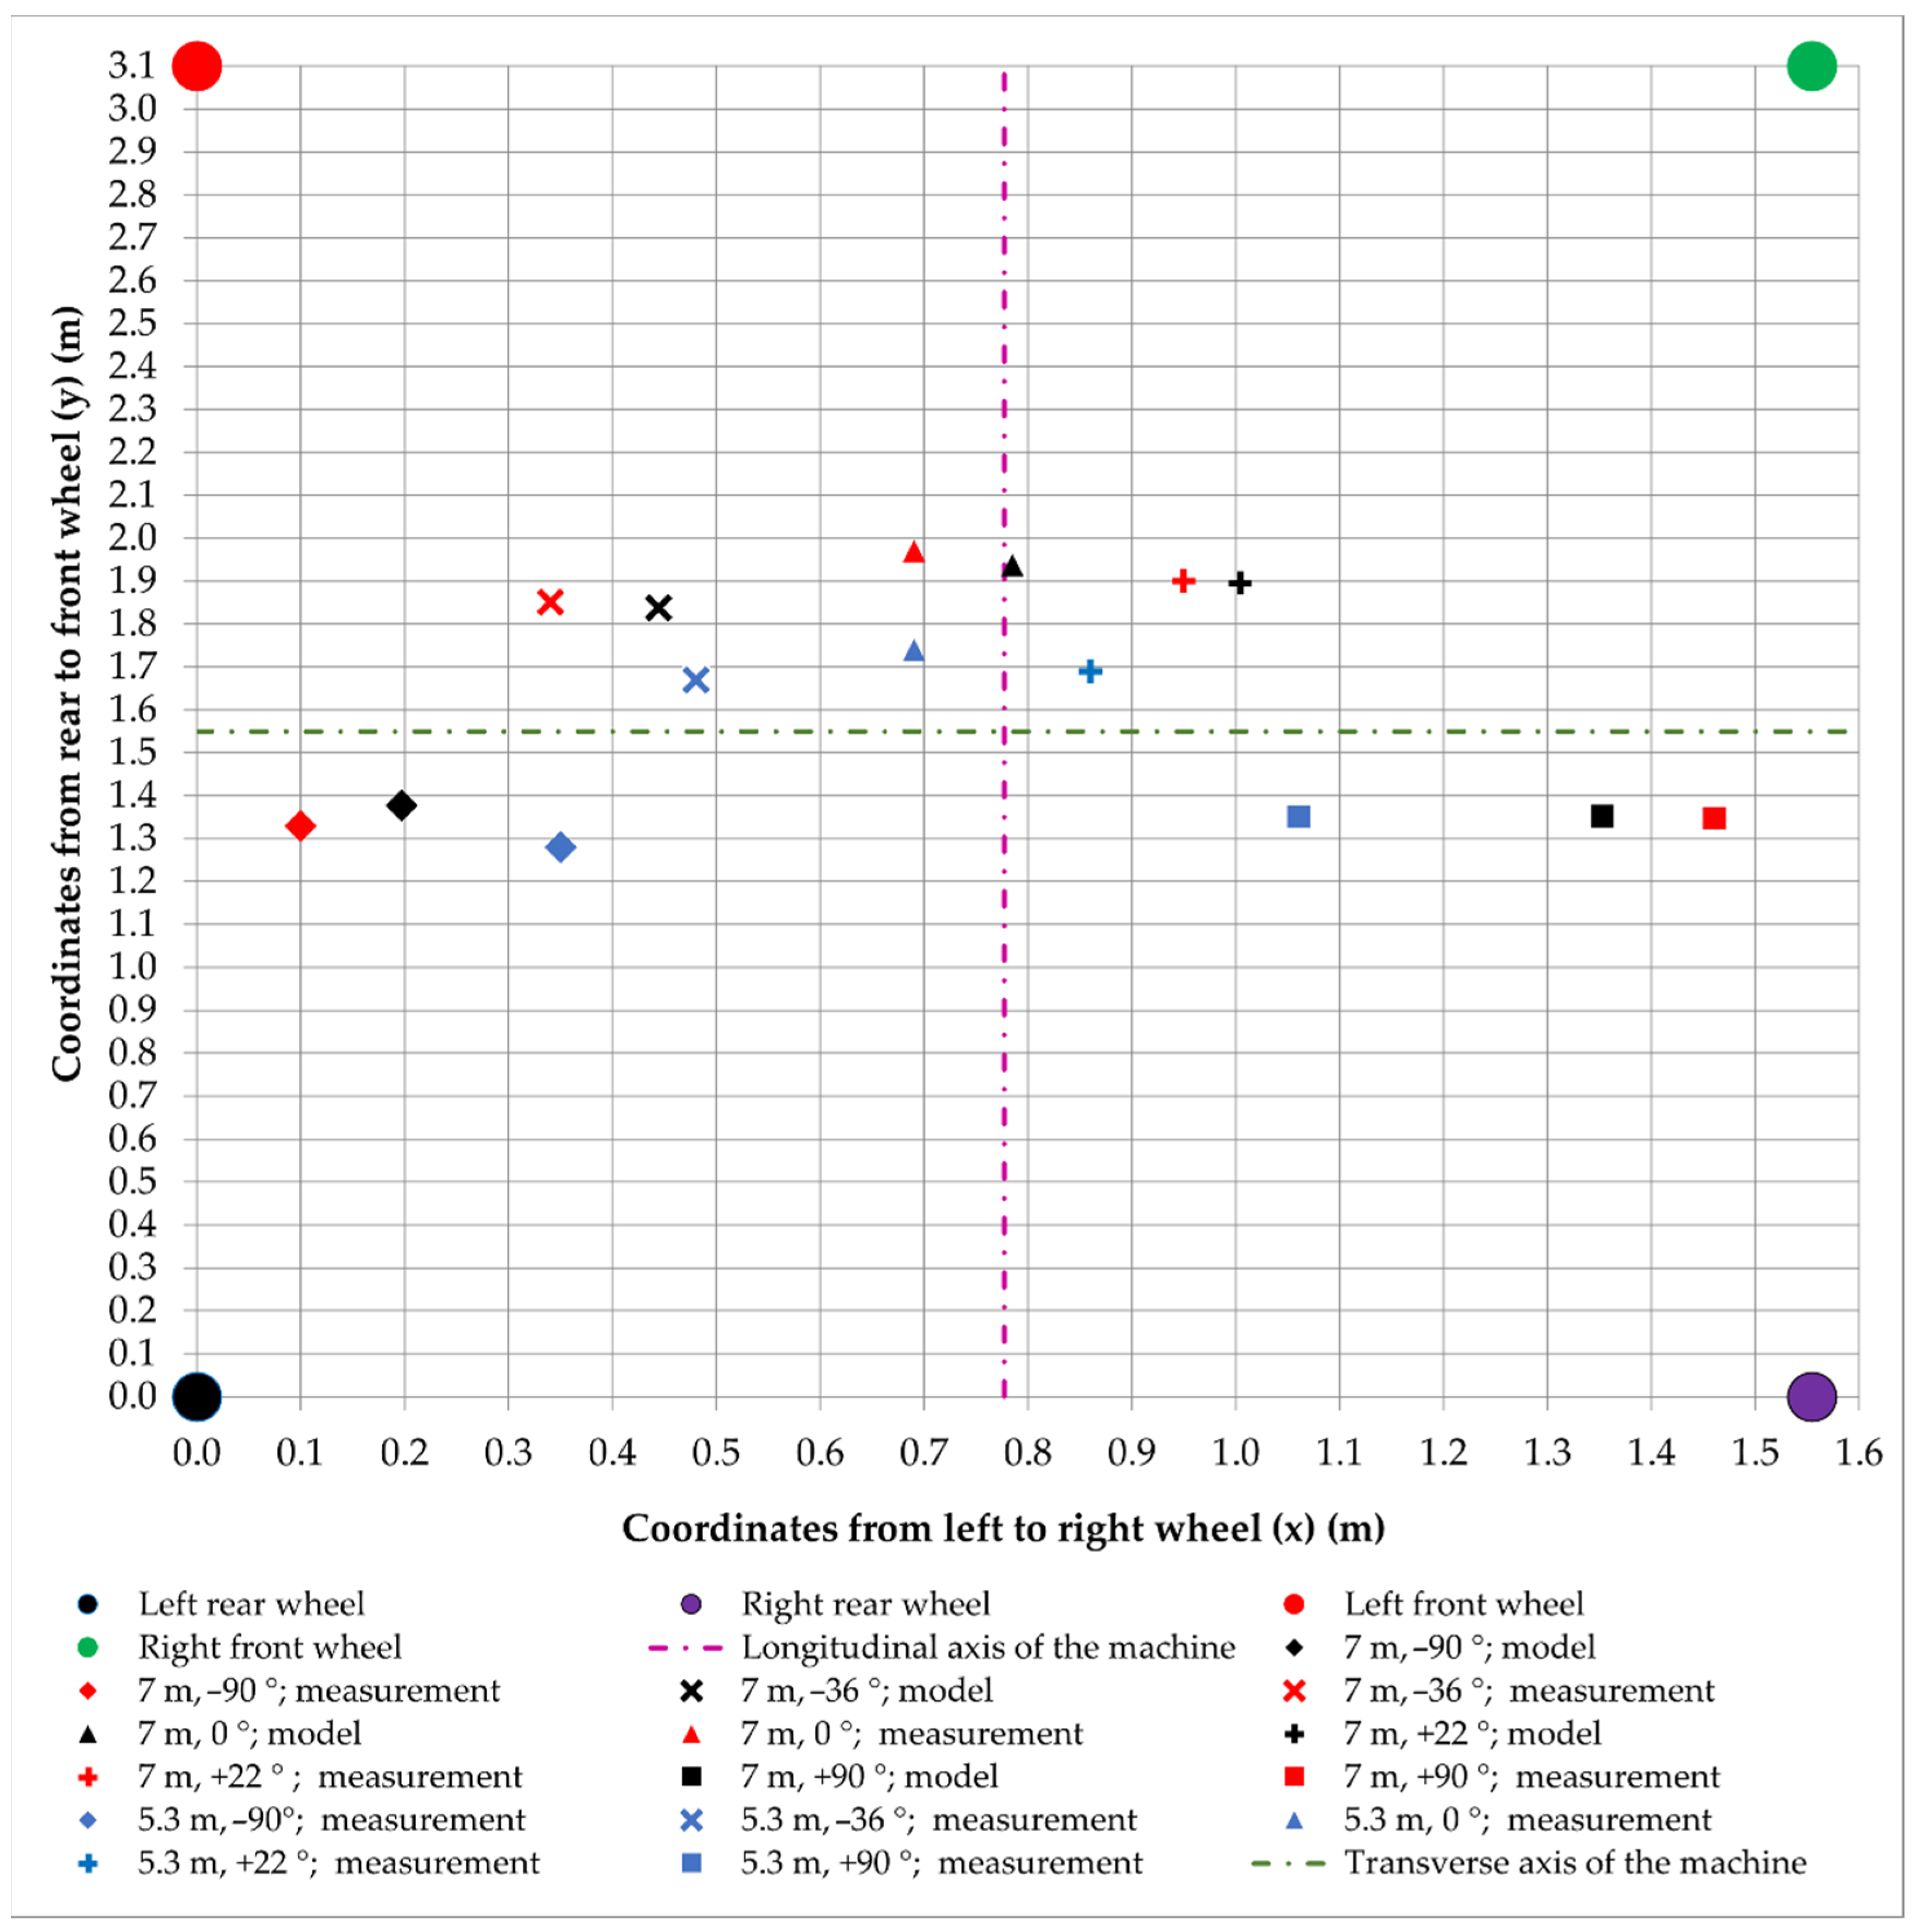
3.1. Position 1
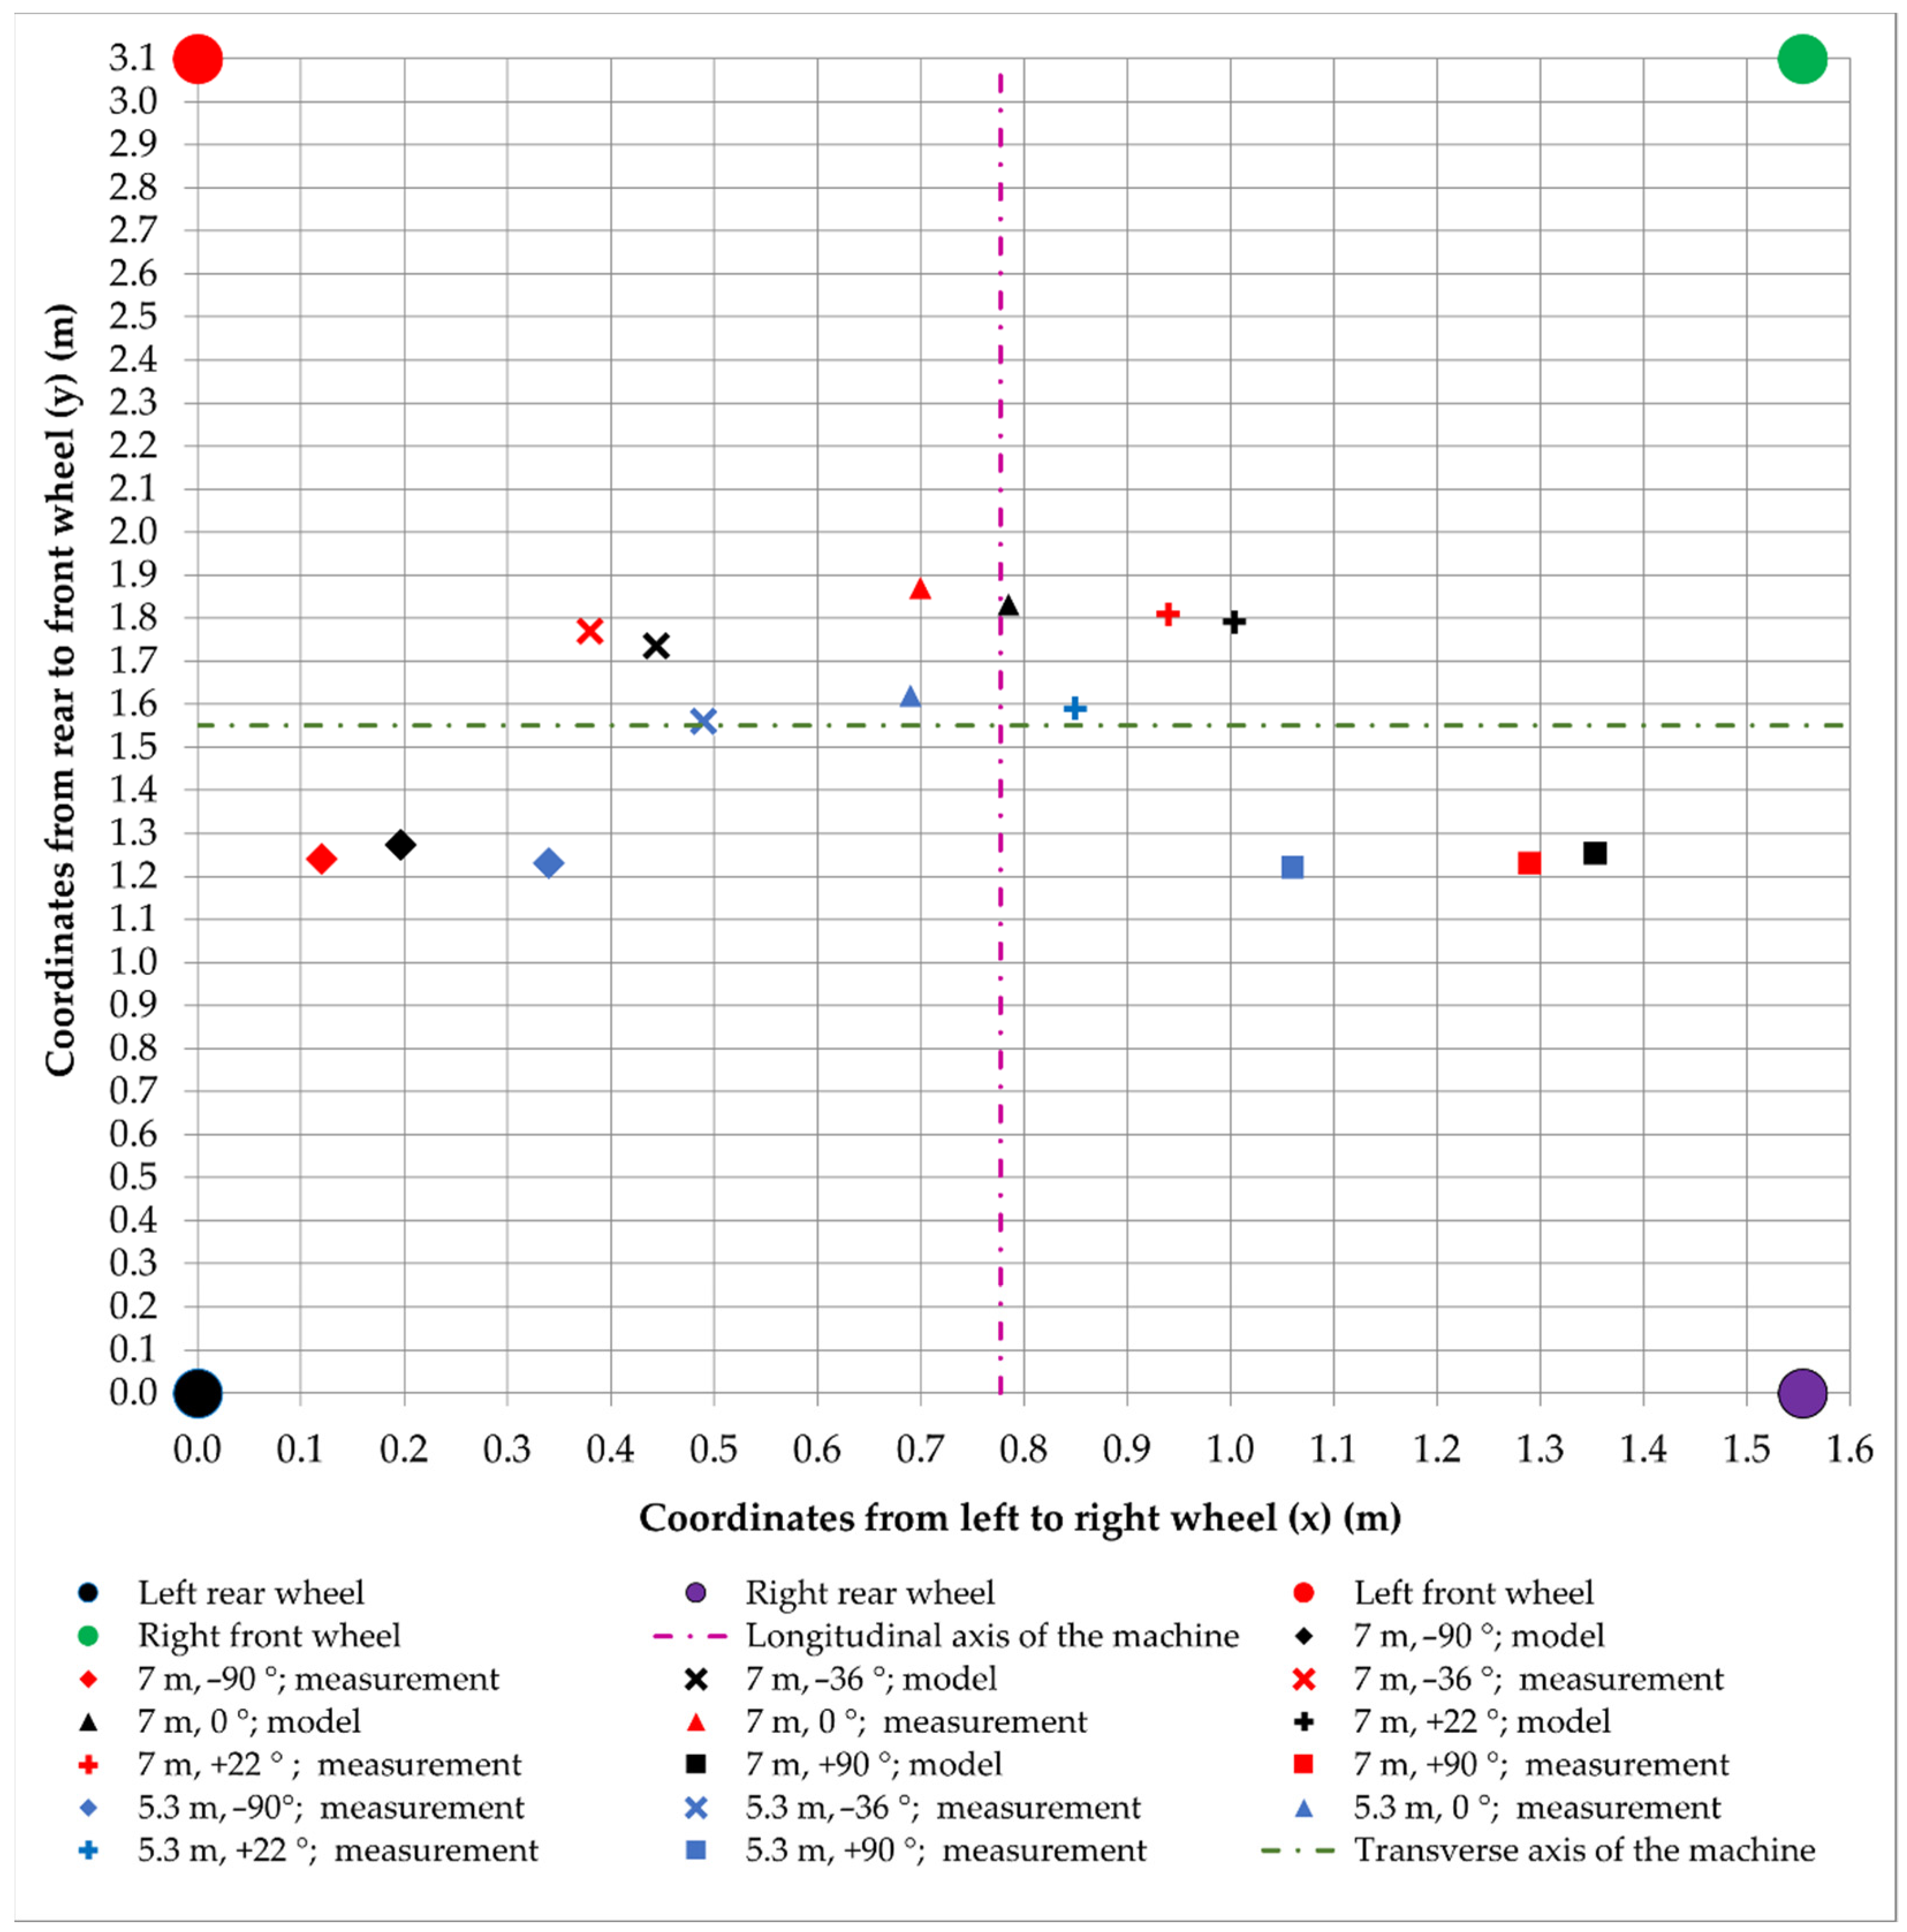
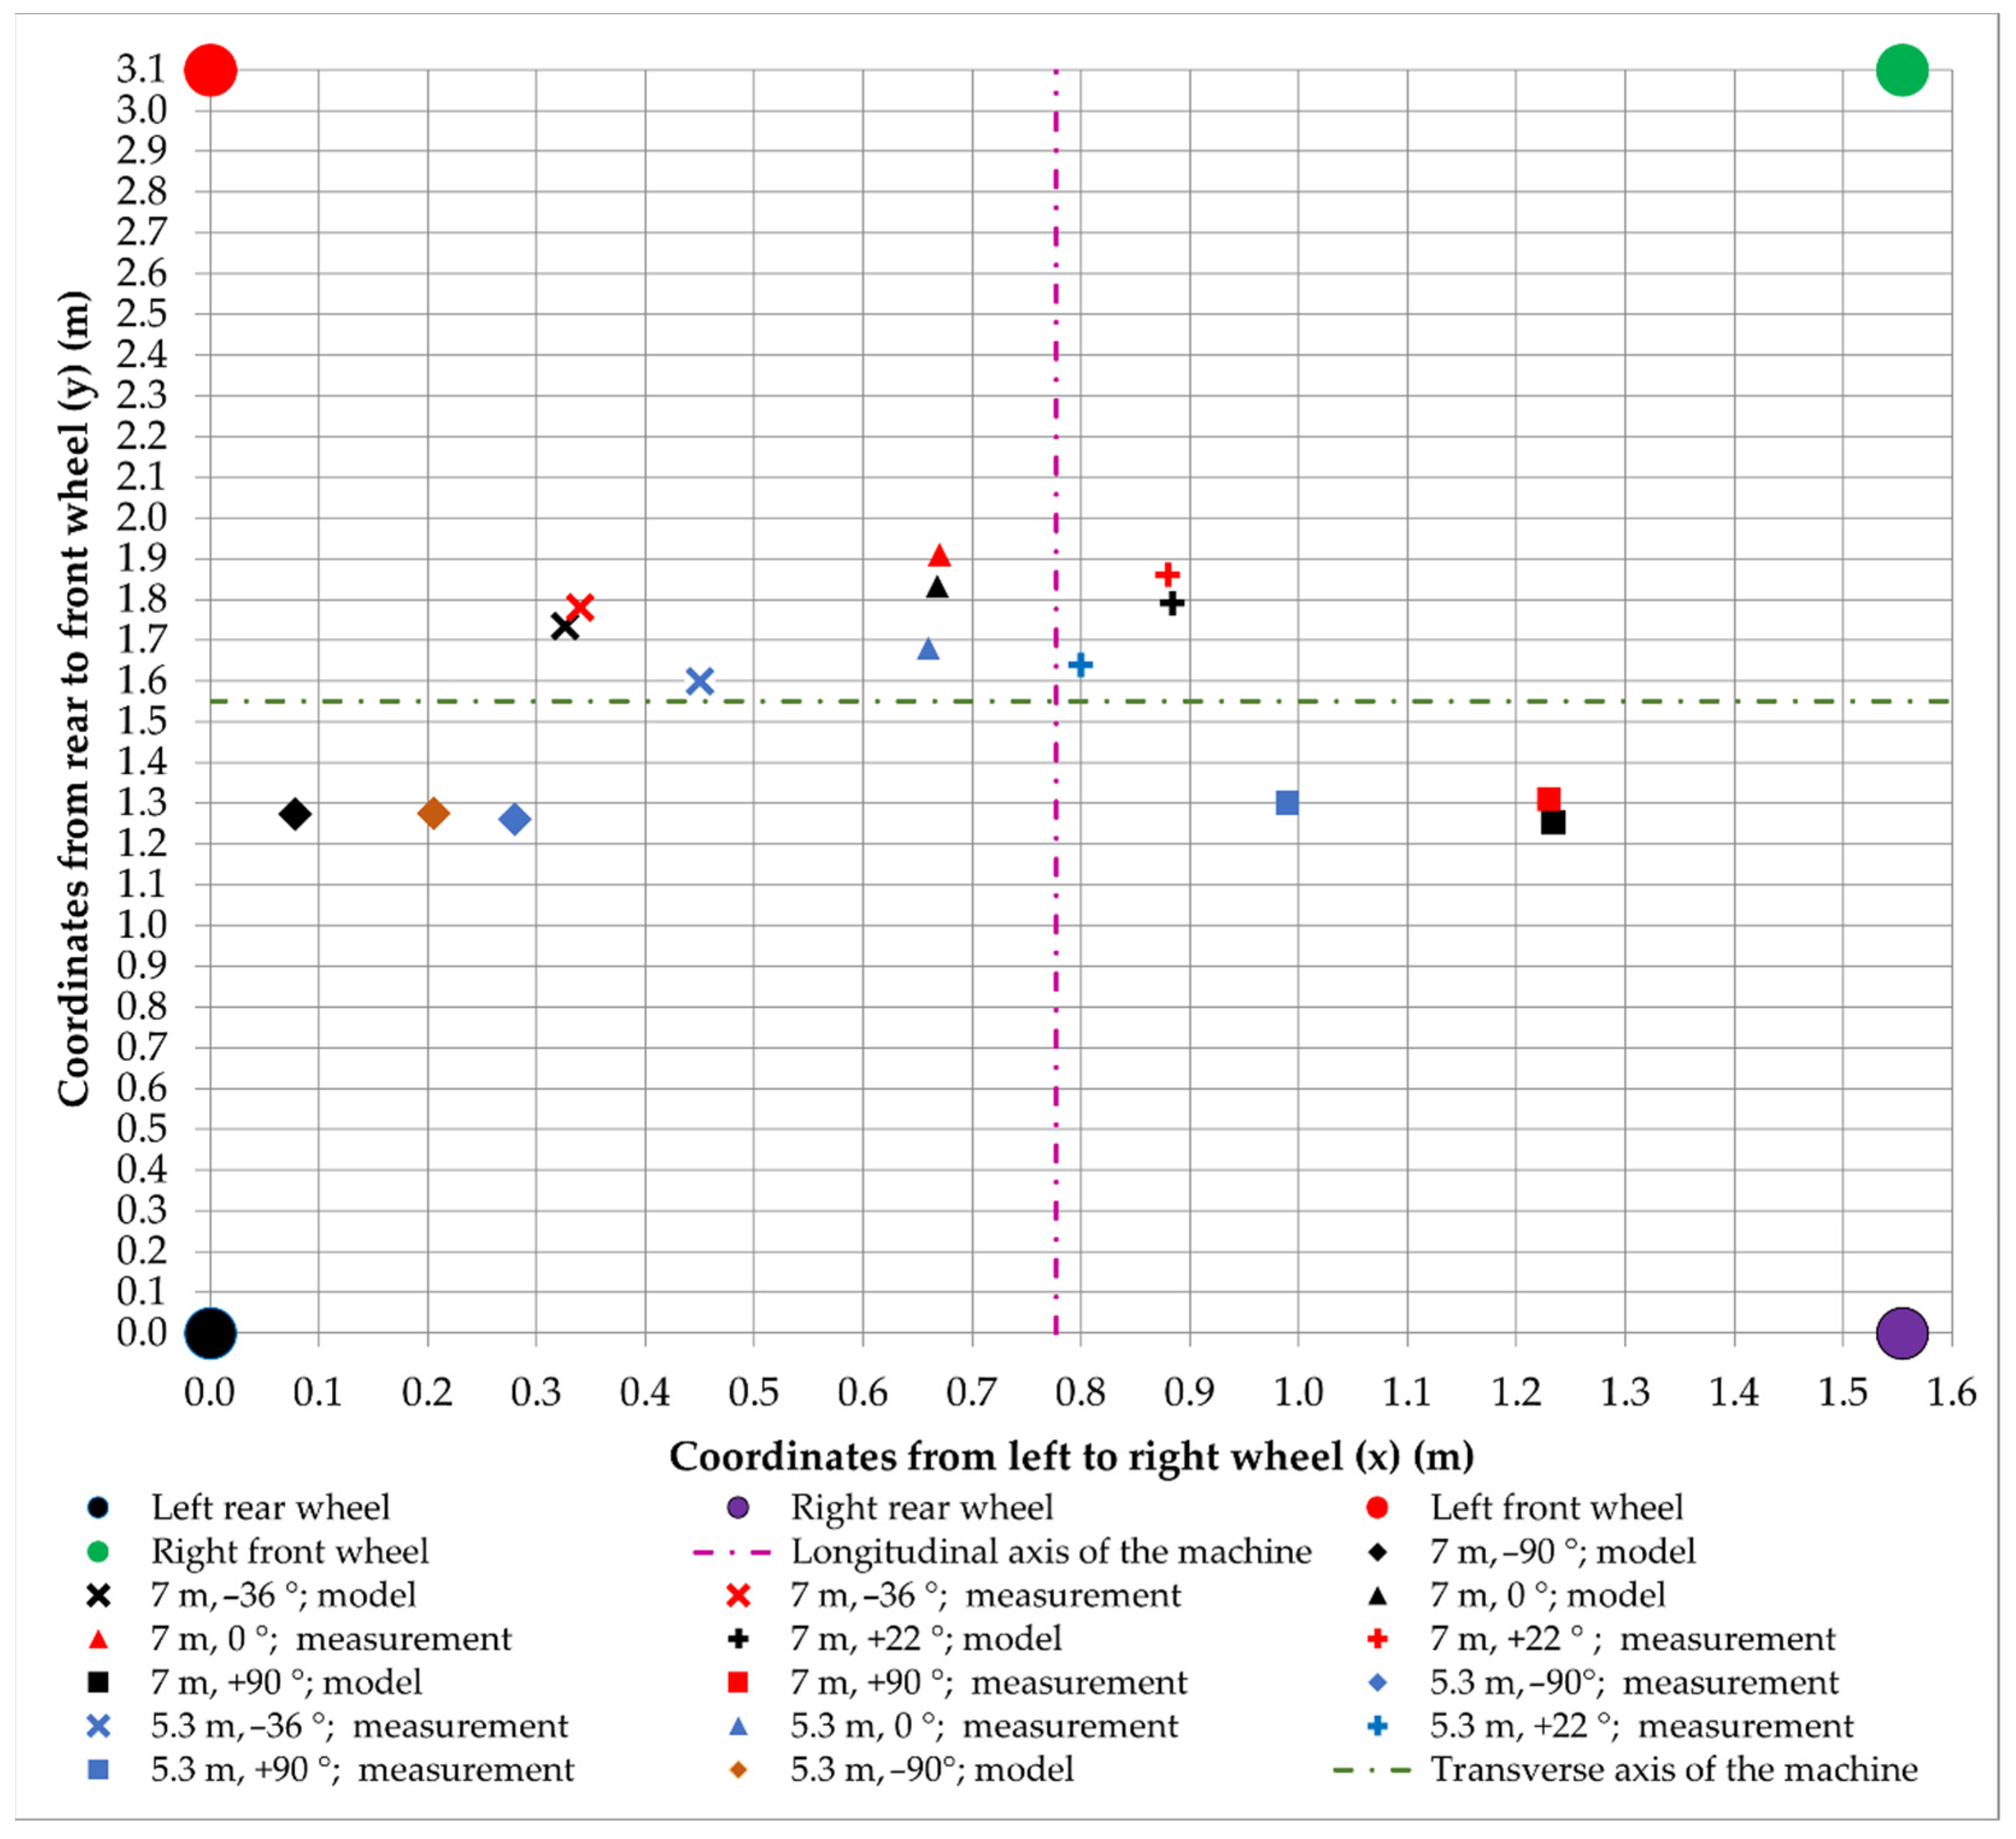
In Position 1, the machine was situated in a horizontal place. If the hydraulic boom was on the—90° axis (left from the harvester longitudinal axis) at full reach, differences found in this position in coordinates for the x and y axes were Δx = 0.077 m and Δy = 0.033 m, respectively. The x-axis is a transverse axis of the machine; it is, therefore, apparent that the y-axis corresponds to the longitudinal axis. The coordinates are plotted in
Figure 5. In this measuring point, deviations in the determination of coordinates to the model were 39.09% for x and 2.59% for y. At a full boom reach, the machine had a zero loading of the right front wheel. Thus, it can be stated that this was the harvester limit because the mentioned wheel was not sitting on the scale platform anymore. The other front wheel (left) was loaded with 3100 kg. With the boom reach of 5.3 m, the right front wheel was already loaded with 390 kg.
At a full boom reach (7 m) on the axis −36° (left from the longitudinal axis), differences recorded between the model and practical measurements in the x and y coordinates were Δx = 0.064 m and Δy = −0.035 m, respectively. This means that y verified in practice was higher than its model value (
Figure 5). During this comparison, the deviation in the determination of coordinates for the model was 14.41% for x and 2.02% for y. Unlike in the previous position, the extreme load reduction on the front right wheel did not occur, however, the most loaded wheel was the left front wheel, the load of which was 3360 kg, i.e., 43.41% of total machine weight (7740 kg). In the boom reach of 5.3 m on this axis, the wheel load was reduced to 2670 kg.
At a boom reach of 7 m on the axis 0° which is parallel to the longitudinal machine axis, differences in the x and y coordinates were Δx = 0.085 m and Δy = −0.038 m, respectively (
Figure 5), which shows again that the value of y measured in practice was higher than the value in the model. Deviations of measurements recorded in the comparison for the coordinates of x and y relative to the model were 10.83% (x) and 2.07%, respectively. The loading of wheels did not exhibit any anomalies. On the axis +22° to the right (from the longitudinal axis) at a full boom reach (7 m), deviations in the determination of coordinates from the model were Δx = 0.064 m and Δy = −0.018 m. The minus y value indicates again that the real value of the coordinate is higher than in the model situation. The accuracy of determining these coordinates relative to the model for x and y was 6.37% and 1.0%, respectively. However, a similar phenomenon was observed with the loading of wheels on the axis −36°, with the left side being changed for the right one.
The last axis on which the measurements were made in this position and which has not been mentioned so far made an angle of +90° (right) with the longitudinal machine axis. The verification of gravity center coordinates on the research site revealed differences in the determination of coordinates on the axes x and y as compared with the simulation values to be Δx = 0.063 m and Δy = 0.024 m, respectively. Deviations were 4.66% for x and 1.91% for y. In this position, the weight moves from the left wheel to the right wheel. Specifically, the left front wheel was not loaded at all, similarly as in the axis −90° (left). A return of tire contact weight was observed at a reach of 5.3 m. In sum, the average deviations reached during the measurements in Position 1 were 15.07% (x) and 1.92% (y).
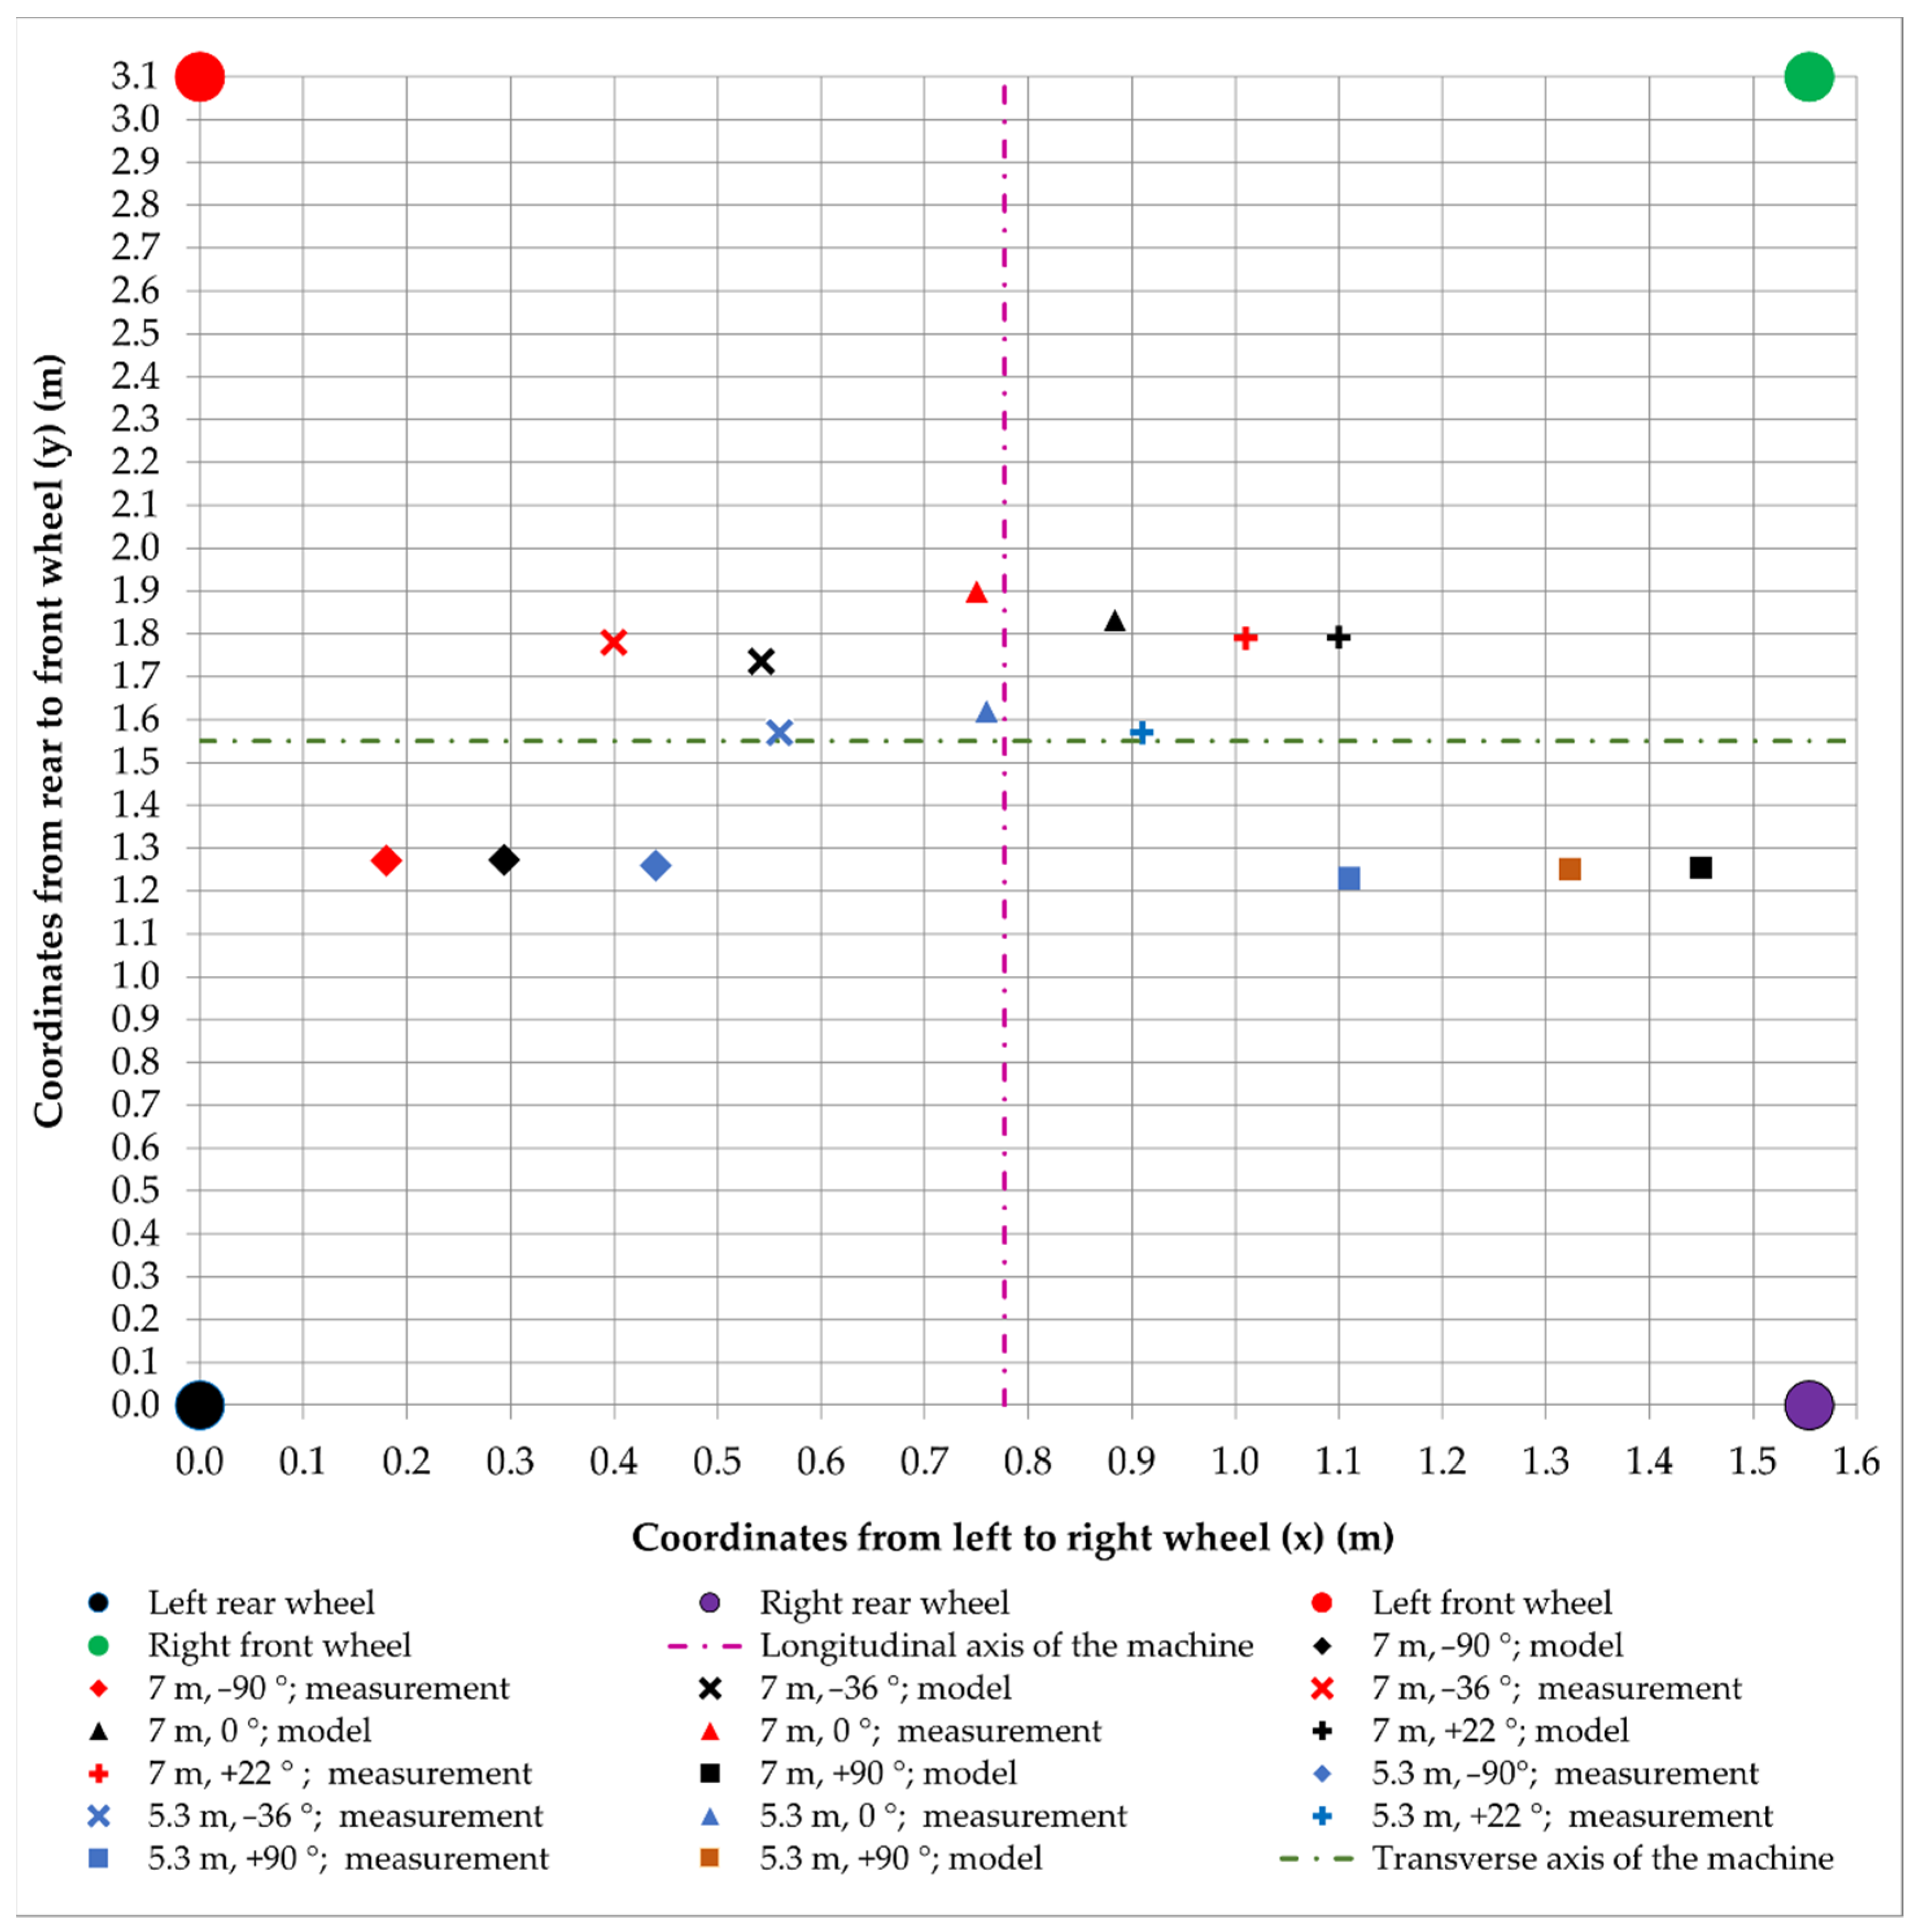
3.2. Position 2
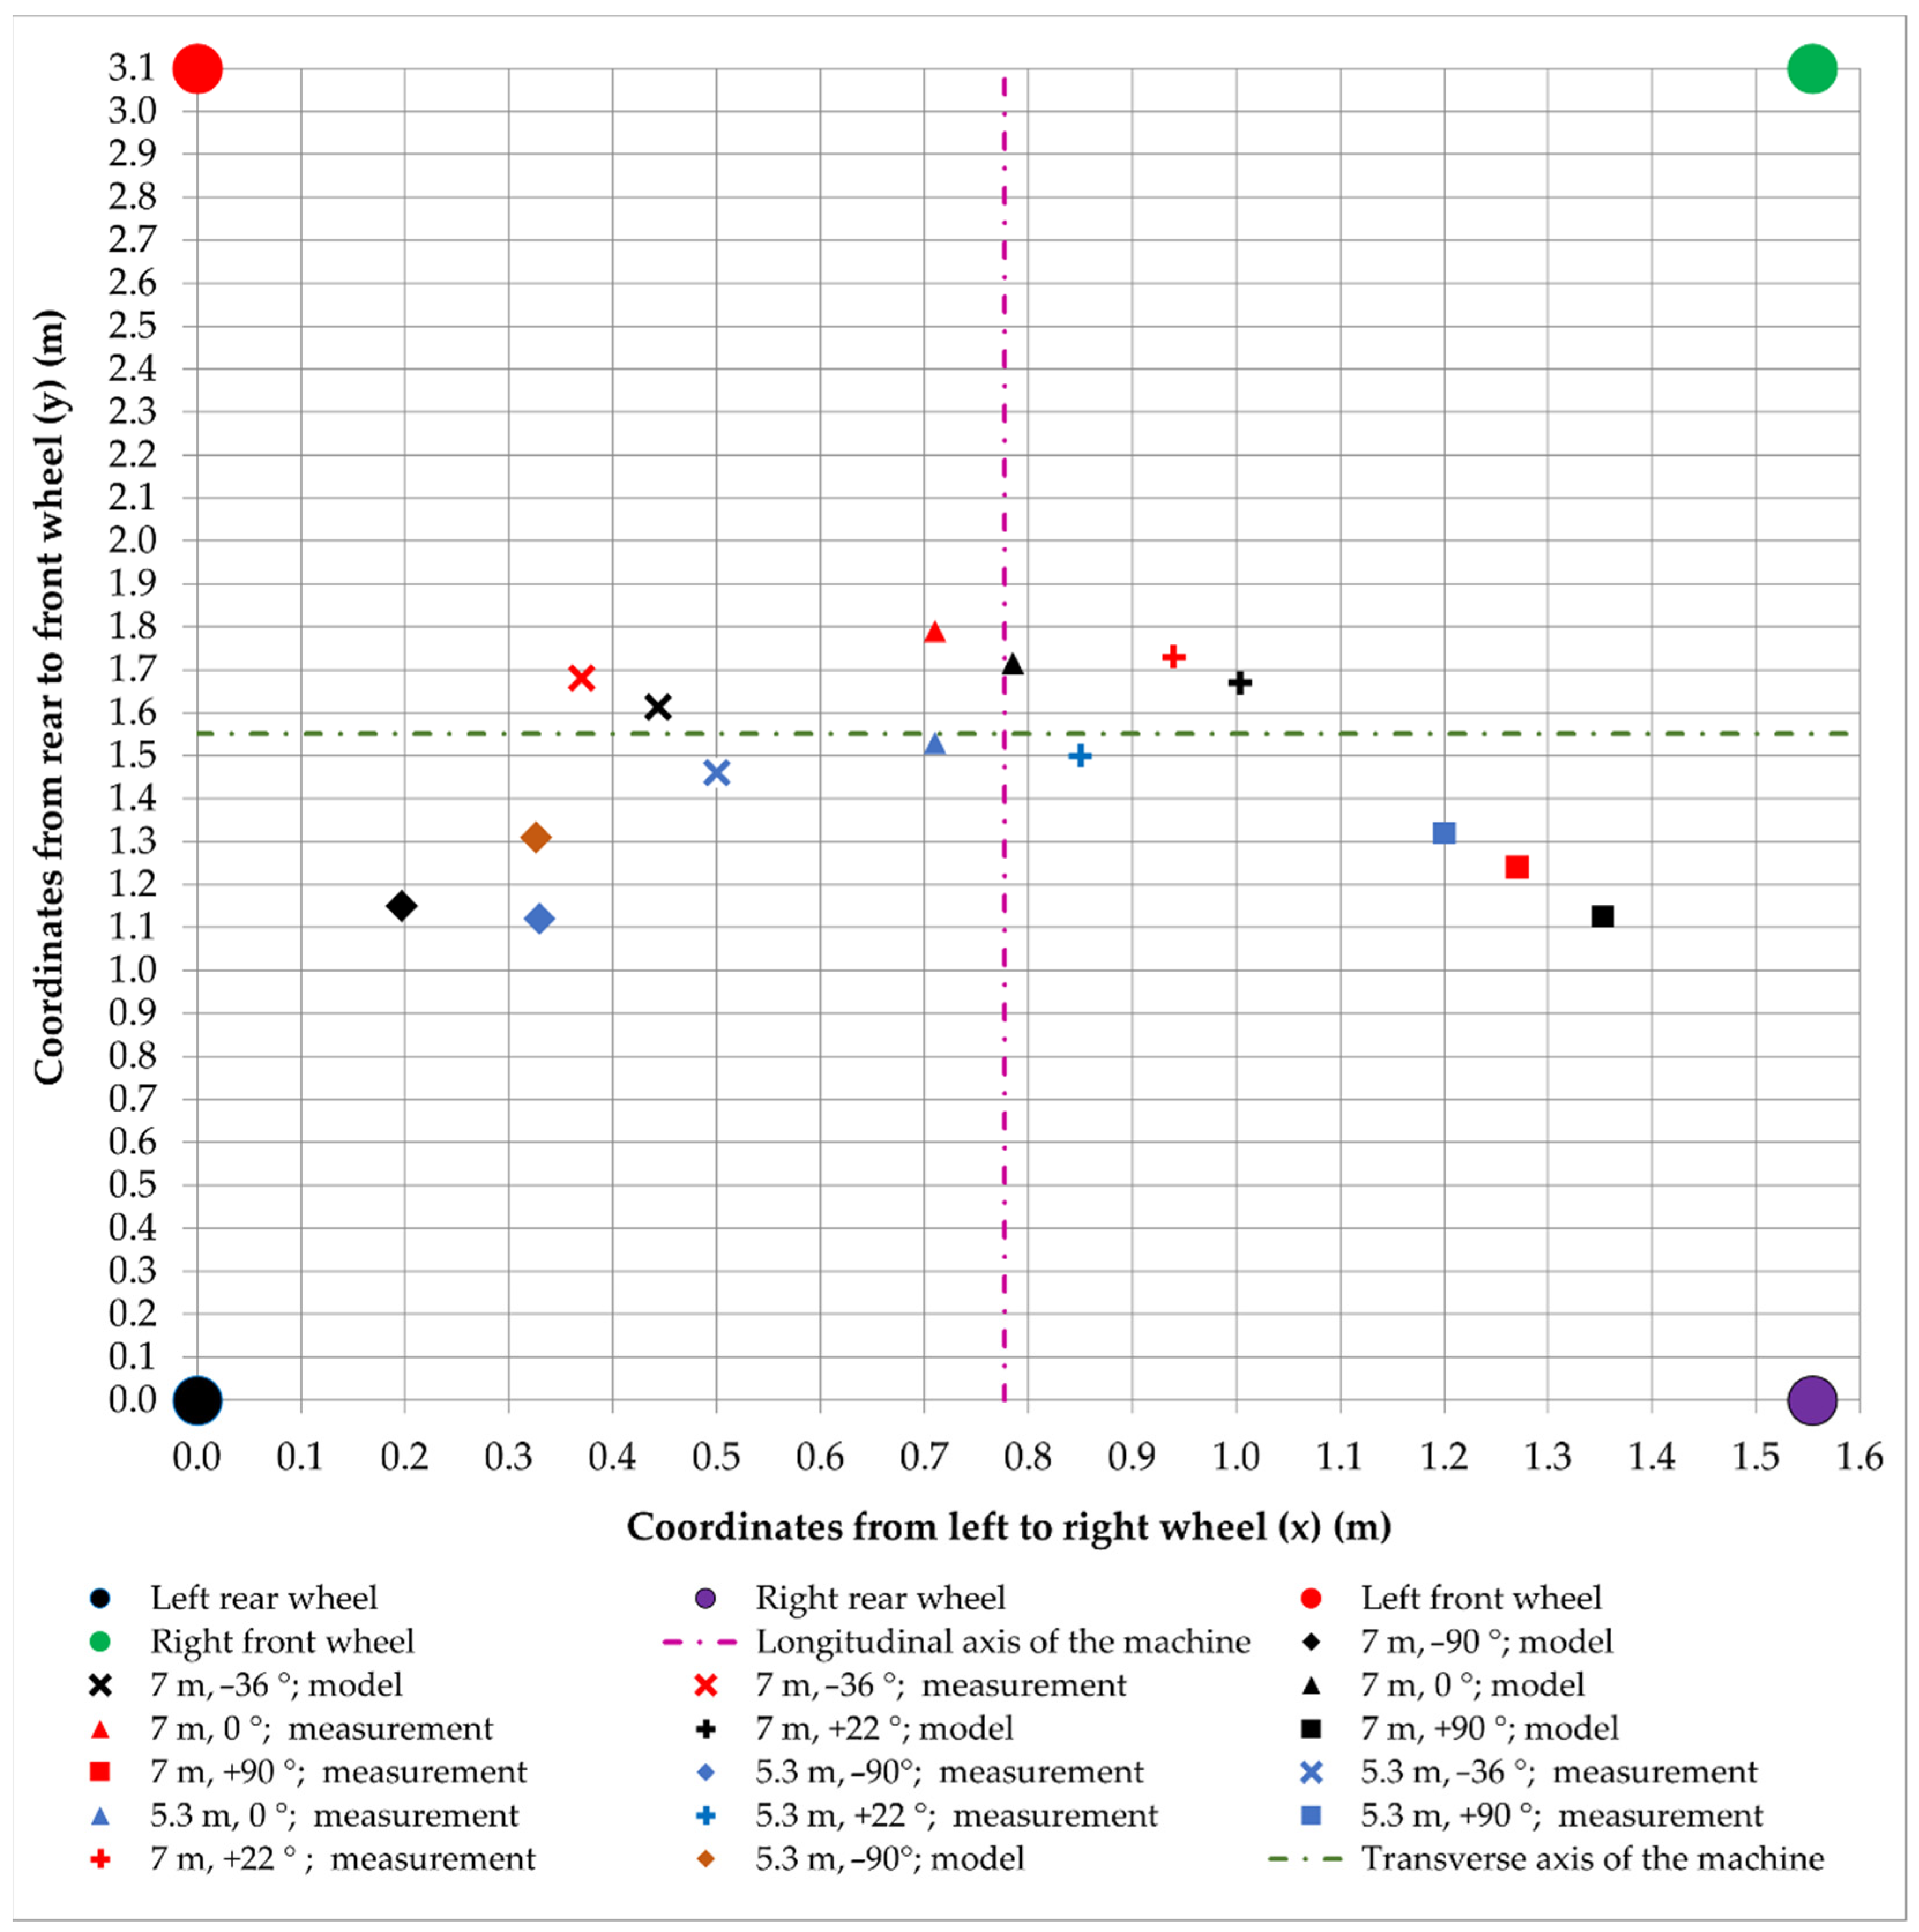
Figure 6 presents the harvester centers of gravity in Position 2. A comparison of the coordinates of the model center of gravity and measurement on the axis −90° at a maximum possible reach of hydraulic boom revealed differences Δx = 0.097 m (x) and Δy = 0.047 m (y). Deviations from the model were 49.24 % for x and 3.41 % for y. In the maximum boom reach, the loading of the front right wheel was zero. This means that the wheel was in not in contact with the platform of scales, and the machine was unstable in the given position, which was corroborated also by the loading of the rear right wheel which amounted to a mere 558 kg. A similar problem was also recorded when measuring in the reach of 5.3 m, where the loading of the right front wheel was zero as well, but the right rear wheel was loaded with 1908 kg. For this reason, the boom reach of 5.3 m can be considered relatively safe.
The same picture (
Figure 6) shows the machine’s center of gravity at a maximum reach on the axis making an angle of −36° with the longitudinal axis. Here, the difference between the simulation and measurement was Δx = 0.104 m in the x coordinate and Δy = −0.013 m in the y coordinate. This indicates that the y value was higher in the measurement than in the model. The deviation between the model and the measurement was 23.42% (x) and only 0.71% (y). Interesting during the measurement was the loading of the front left wheel, which was 4211 kg (54.41% of total harvester weight). The other wheel on the front axle was loaded with 406 kg only. It should be pointed out, however, that the machine weight was distributed onto the front axle more than in Position 1 due to the undercarriage inclination.
When measuring on the axis 0°, i.e., parallel to the machine axis, differences in the determination of coordinates in the boom reach of 7 m were Δx = 0.095 m (x) and Δy = −0.033 m (y). Thus, it can be stated that the y value from the measurements surmounted the simulation value. The model and the measurement were differentiated by 12.1% in x and by 1.7% in y. With respect to the loading of wheels, a shift can be stated of machine weight onto the front axle where 63.58% of total machine weight occurs, which is nearly the same as in Position 1 (60.36%). Another axis that was measured and simulated was the axis making an angle of +22° with the longitudinal axis of the machine. At a maximum reach of the boom, differences recorded between the model and the measurement were Δx = 0.054 m (x) and Δy = −0.005 m (y). Thanks to the minus value, it can be concluded again that the value of y from the measurement was higher than from the simulation. Deviations between the measurement and the model were 5.38% (x) and 0.26% (y). As to the loading of wheels, a shift of weight was observed onto the right front wheel, with the load on the rear left wheel being reduced most. A similar situation occurred also at a boom reach of 5.3 m.
The last axis measured in this position made an angle of +90 ° with the longitudinal axis of the machine. A comparison of gravity center coordinates on this axis with the model resulted in a difference of—Δx = 0.107 m; this indicates that the value of x in the measurement was higher than in the simulation. When determining y, the difference was Δy = 0.005 m. Deviations between the measurement and the simulation were 7.91% for x and 0.37% for y. In this position, the loading of the front left wheel was zero (the wheel was not in touch with the scales platform again) and the total machine weight shifted to the right side. A return of tire contact weight was recorded at a reach of 5.3 m. In sum, the average deviations of x and y axes of the center of gravity reached during the measurement relative to the simulation in Position 2 were 19.61% (x) and 1.29% (y).
3.3. Position 3
Figure 7 shows the coordinates of the gravity center in Position 3. No data were obtained in the measuring points at a full boom reach and it’s turning up to −90°, the reason being a danger of machine overturning, which was confirmed by the loading of wheels at a distance of 5.3 m, where a zero load was recorded on the front right wheel. In order to verify the accuracy, coordinates in the boom reach of 5.3 m were recorded in the model simulation. A difference in determining the x coordinate was Δx = −0.004 m; this shows that the coordinate had a higher value in the measurement than in the model. A difference in determining the y coordinate was Δy = 0.189 m. Deviations recorded for this axis in Position 3 at establishing the gravity center coordinates were 1.23% for x and 14.44% for y.
Another measured axis was −36°. The name of this axis includes the axis position and the size of the angle it makes with the longitudinal machine axis. At a maximum reach of the boom (7 m), a difference between the measurement and the model was Δx = 0.074 m and Δy = −0.067 m. The deviation of measurement and simulation for x and y was established as 16.67% and 4.15%, respectively. As to the loading of wheels, a return of mass was observed on the right front wheel, but it was only 340 kg. The left front wheel which carried 49.81% of total machine weight was loaded the most.
On the 0° axis, which is parallel to the machine axis, differences recorded between the model and the reality at a maximum boom reach were Δx = 0.075 m (x) and Δy = −0.067 m (y). The minus value indicates once again a higher y value from the measurement as compared with the model. Deviations between the simulation and measurement in determining x and y coordinates were respectively 9.55% and 4.31%. At a maximum boom reach, the most loaded in this position was the front axle (57.65% of total machine weight was distributed evenly on both wheels). Another axis that was measured and simulated was the axis making an angle of +22° with the longitudinal machine axis. Differences in the determination of Δx and Δy at a hydraulic boom reach of 7 m were 0.064 m and −0.060 m, respectively. The minus value of the difference indicates again the already mentioned size of given values. Deviations to the model were 6.37% (x) and 3.59% (y). The respective wheel loads show that the machine mass is localized on the right side of the axles.
The last axis measured in Position 3 was perpendicular right to the machine’s longitudinal axis (+90°). At a maximum boom reach, differences recorded between the coordinates determined by measurement and simulation were Δx = 0.083 m (x) and Δy = −0.114 m (y). This shows once again that the value of y from the measurement is higher than from the model. Deviations to the model were 6.13% (for x) and 10.12% (for y). Nearly all mass was on the right side of the machine during this measurement. Specifically, the left front wheel exhibited a zero load, and the rear left wheel was loaded only by 816 kg, which testifies to a limit of the harvester. At a reach of 5.3 m, a return of mass was recorded back to the left side so that the machine work could be safe again. Measurements in this position revealed that the deviation to the model in the determination of x and y was 7.99% and 7.32%, respectively, which is the worst result for y and the best result for x in the measurement.
3.4. Position 4
Figure 8 shows the coordinates of the harvester gravity center in Position 4. The first axis measured in this position was the left axis perpendicular to the longitudinal axis of the machine (−90°). Differences recorded at a maximum boom reach were Δx = 0.114 m (x) and only Δy = 0.003 m (y). Deviations from the model were 37.78% for x and only 0.24% for y. At this measuring point, a zero load was not recorded on any of the wheels. The right front wheel showed a minimum load (225 kg) while the right rear wheel was loaded with 765 kg. The remaining weight was distributed on the left side of the machine. When the boom reach was reduced to 5.3 m, the loading on the right side increased at the expense of the left side. The front right wheel was for example loaded with 959 kg at 5.3 m.
The following axis in this position made an angle of −36° with the longitudinal machine axle. At a maximum boom reach on the axis, differences recorded were Δx = 0.142 m (x) and only Δy = −0.045 m (y). The minus difference value of the y coordinate indicates that the value of y in the measurement was higher than in the simulation. Deviations from the model in determining the coordinates were 26.20% for x and 2.59% for y. The front left wheel was loaded the most (3051 kg) and the rear right wheel showed the least load (816 kg). When the boom reach was reduced to 5.3 m, the weight moved back to the lightened wheel. On the 0° axis, i.e., on the axis parallel with the machine axis, differences in determining the coordinates were Δx = 0.134 m (x) and Δy = −0.068 m (y). Deviations from the model were 15.16% for x and 3.71% for y. As to the machine weight distribution onto the wheels, a relatively well-balanced relation was observed between the left and right sides of the machine. More precisely, the left wheel was loaded by 46.56% of the total machine weight while the remaining percentage of weight was on the right wheels.
The following axis measured in Position 4 was the axis making an angle of +22° with the longitudinal machine axis. Differences between the measurement and the simulation were Δx = 0.090 m (x) and Δy = 0.002 m (y). Deviations from the model were 0.45% for x and 3.79% for y. In this position, the front right wheel was the most loaded one (3671 kg). The last axis measured in this position was situated on the right, perpendicular to the machine’s longitudinal axis. With respect to possible stability problems, the center of gravity on the research plot was measured only at a boom reach of 5.3 m. Differences in the determination of coordinates were then established following the data processing; they were Δx = 0.213 m (x) and Δy = 0.020 m (y). Deviations from the model were 16.10% for x and 1.6% for y. During the measurement, a zero load was observed on the left front wheel which was above the scale platform; this was why the measurement at a boom reach of 7 m was given up. In summary, the mean deviations of measurement in Position 4 were 20.88% for x and 1.65% for y.
3.5. Position 5
A similar danger of machine overturning at a maximum boom reach on the axis perpendicular to the longitudinal machine axis was recorded also in Position 5 (
Figure 9) but on the other side, i.e., on the −90° axis. This is confirmed by results from the measurement in the point at 5.3 m from the swing bearing axis with only 38 kg on the right front wheel. For this reason, the coordinates were compared to the point of 5.3 m. Differences between the measurement and the model were Δx = −0.074 m (x) and Δy = 0.014 m (y). The minus x value indicates the same as in y, i.e., that the x value in the measurement was higher than the x value in the simulation. Differences from the model were 35.92% for x and 1.10% for y. At this point, the harvester was very heavily loaded along the entire left side (79.86% of total machine weight).
Another measured axis was situated left from the longitudinal machine axis and the angle was −36°. Differences recorded on this axis when determining the coordinates at a maximum boom reach were Δx = −0.014 m (x) and Δy = 0.045 m. The rule about the minus value applies again here. Deviations from the model were 4.29% for x and 2.59% for y. It was found during the measurement that the most loaded wheel was the front left one, which is logical regarding the boom position.
On the 0° axis which is parallel to the longitudinal machine axis, differences recorded were Δx = −0.002 m (x) and Δy = −0.078 m (y). Deviations from the model were 0.30% for x and 4.26% for y. Regarding the height position of individual wheels, the weight distribution can be considered nearly balanced (52.71% of total machine weight on the left side of the machine). When the boom reach is reduced, a certain part of weight moves onto the rear axle, thus discontinuing the weight balance of the machine sides. The following measured axis was situated left from the machine longitudinal axis and their angle was +22°. At a maximum boom reach, only a negligible difference was recorded in determining the x coordinate Δx = 0.004 m while in the y coordinate it was Δy = −0.068 m. The minus value indicates a higher value from the measurement than from the model. Deviations from the simulation in this position and boom reach were mere 0.45% for x and 3.79% for y. The most loaded wheel was again the wheel situated closest to the point of measurement, and the least loaded wheel was the wheel situated farthest from that point. This shows that the maximum weight dwelled on the right front wheel (2908 kg), which was corroborated also by the measurement at 5.3 m.
The last axis measured in this position and in the experiment was situated right and was perpendicular to the longitudinal axis of the machine (+90 °). Differences recorded in the measurement at a maximum boom reach were Δx = 0.004 m (x) and Δy = −0.056 m (y), the minus value of the latter indicating that it was higher when measured on the research plot than in the simulation. Deviations from the model were 0.32% for x and 4.47% for y. As to the loading of individual wheels of the machine, it can be stated there was no danger of the machine overturning in this position as all four wheels were loaded (some of them relatively little). Although 87.14% of the total machine weight was localized on the right side of the machine, the wheels were in contact with the base. In summary, mean deviations in measurements taken in Position 5 were 8.26% for x and 3.24% for y.
3.6. Summary—Accuracy
All measurements and measured positions show that the accuracy of establishing x and y coordinates to determine the harvester’s center of gravity differs from software model simulations. The mean deviation for x was 14.36% and only 3.08% for y. The results indicate a very high accuracy in determining the y coordinate which is parallel with the longitudinal machine axis. Nevertheless, the x value was not bad either, and although a certain inaccuracy has to be taken into account, the accuracy appears sufficient. In summary, a deviation of reality from the model was 8.41%, which can be considered a very small difference overall.
4. Discussion
It was found that at a hydraulic boom reach up to 5.3 m with the undercarriage in the horizontal plane, the ratio of weights between the front and rear axles was 52.33% to 47.67%. When the boom was at a maximum reach (7 m), the share of the front axle increased to 60.36%. It follows that in case the boom is folded as close to the swing bearing axis as possible and the total machine length shortened, the weight will move onto the rear axle (see Position 3). This shift of weight will destabilize the front axle, which corresponds with the statement that stability is affected by weight and its distribution [
29]. If the machine continued to rise, a phenomenon would occur described by Visser and Stampfer [
13] when the gravity center overcomes the marginal point and the machine would overturn. In this case, the point can be localized on the axis running through the centers of contact areas of the rear axle wheels. If the crane is then loaded with a burden, the machine will overturn.
An interesting phenomenon was observed in Position 2 (down the hill) when the wheels were lifted from the platform of portable scales on the axes −90° and +90°at a maximum boom reach of 7 m, which should theoretically be impossible with respect to the fact that a part of the weight was moved onto the front axle. This behavior can be explained by a slight overload on linear hydraulic motors by the blocked movement of the rear axle (verified from the image record). At a boom distance of 5.3 m, the elevation of the front axle wheels was observed only in the −90° axis, and a similar situation was on the same axis in Position3. An explanation is provided by viewing the machine (
Figure 2), namely the boom location, which elevates the opposite wheel due to its misalignment when the boom is placed on the right side.
Figure 3,
Figure 4,
Figure 5,
Figure 6,
Figure 7,
Figure 8 and
Figure 9 show the gravity center in different positions. The figures show clearly an apparent problem with the transverse machine stability if the boom finds itself on the −90° and +90° axis, particularly at a maximum reach of the boom. If a zero load of the boom with load is taken into account, it can be stated that the machine is unstable because, at a boom loading, its gravity center would overcome the marginal point defined by Visser and Stampfer [
13] that can be localized in this case on the axis running through the centers of the wheel contact areas situated on the left or right side according to the boom position. According to Gibson et al. [
30], in Positions 4 and 5 (
Figure 8 and
Figure 9), the load would cause a lateral deformation of the tire, which would be more destabilizing for the machine. However, the machine stability can be also affected by boom kinematics and the smoothness of movement [
31,
32]. The stability problem could be resolved, for example, by loading the tires of the front wheels with the solution of CaCl
2 or MgCl
2. It should be pointed out that the research did not deal with the calculation of the height position of the gravity center (z coordinate) because the machine shape at tilts would have to be the same, which would be rather difficult with respect to the boom positions. In summary, it can be stated that the machine and its undercarriage were unstable in the first stages of testing the prototype at a maximum boom reach. However, the potential of this solution is great, which is confirmed by the research of Vidoni et al. [
27] who demonstrated the transverse stability of this frame to be higher by 8° with the turning of axles as compared to the conventional articulated frame.
In this research, data on the position of the gravity center in the field measurements were compared with data of model simulation in the software SolidWorks made by Dassault Systems. Deviations recorded for coordinates x and y were 14.36% (x) and 3.08% (y). In summary, the deviation between the measurement and the model was 8.41%, which can be considered a very small difference. The model could have been affected by several aspects, in reality, namely the model imperfectness in the given software, more precisely the hydraulic and electric lines that are hard to plot in the model and determine their physical behavior, which was studied by Musa et al. [
33]. Machine operating fluids and their behavior that were studied in relation to the center of gravity by Wang et al. [
34] might have been another reason.
5. Conclusions
The first goal of the research was to verify the stability of the newly designed hybrid harvester intended for thinning. The second goal was to establish a deviation between two methods of measuring the machine’s center of gravity. In one of them, the machine’s gravity center was determined by means of SolidWorks software made by Dassault Systems, in the other one, it was determined using portable vehicle scales with the function of gravity center calculation. The machine was measured in five different positions.
The new prototype of a harvester with the non-conventional frame was found unstable at a maximum reach of hydraulic boom if this is perpendicular (±90°) to the longitudinal machine axis. The stability problem could be resolved, for example, by loading the tires of the front wheels with the solution of CaCl2 or MgCl2. In the event of tire deformation, a higher inflation pressure can be applied. The issue of the stability of a structurally new harvester in an operational deployment needs to be addressed in other parts of the ongoing research. A comparison of the two methods resulted in a total deviation of 8.41% with the mean deviation for x being 14.36% and for y only 3.08%.
Favorable small deviations of the center of gravity from both axes are given by the choice of a stable chassis design and its control. This rigid frame with both steered axles has the same stabilizing edge position in all positions. This fact gives us the certainty of predicting the stability of the machine and the ability to design safety devices for the machine operator in future research. In addition, there are assumptions that the maneuverability of the machine with knowledge of the center of gravity will be better than with competing machines with a conventional articulated frame.


