
Does Classification-Based Forest Management Promote Forest Restoration? Evidence from China’s Ecological Welfare Forestland Certification Program


Abstract
:1. Introduction
2. Materials and Methods
2.1. Data
2.2. Methods
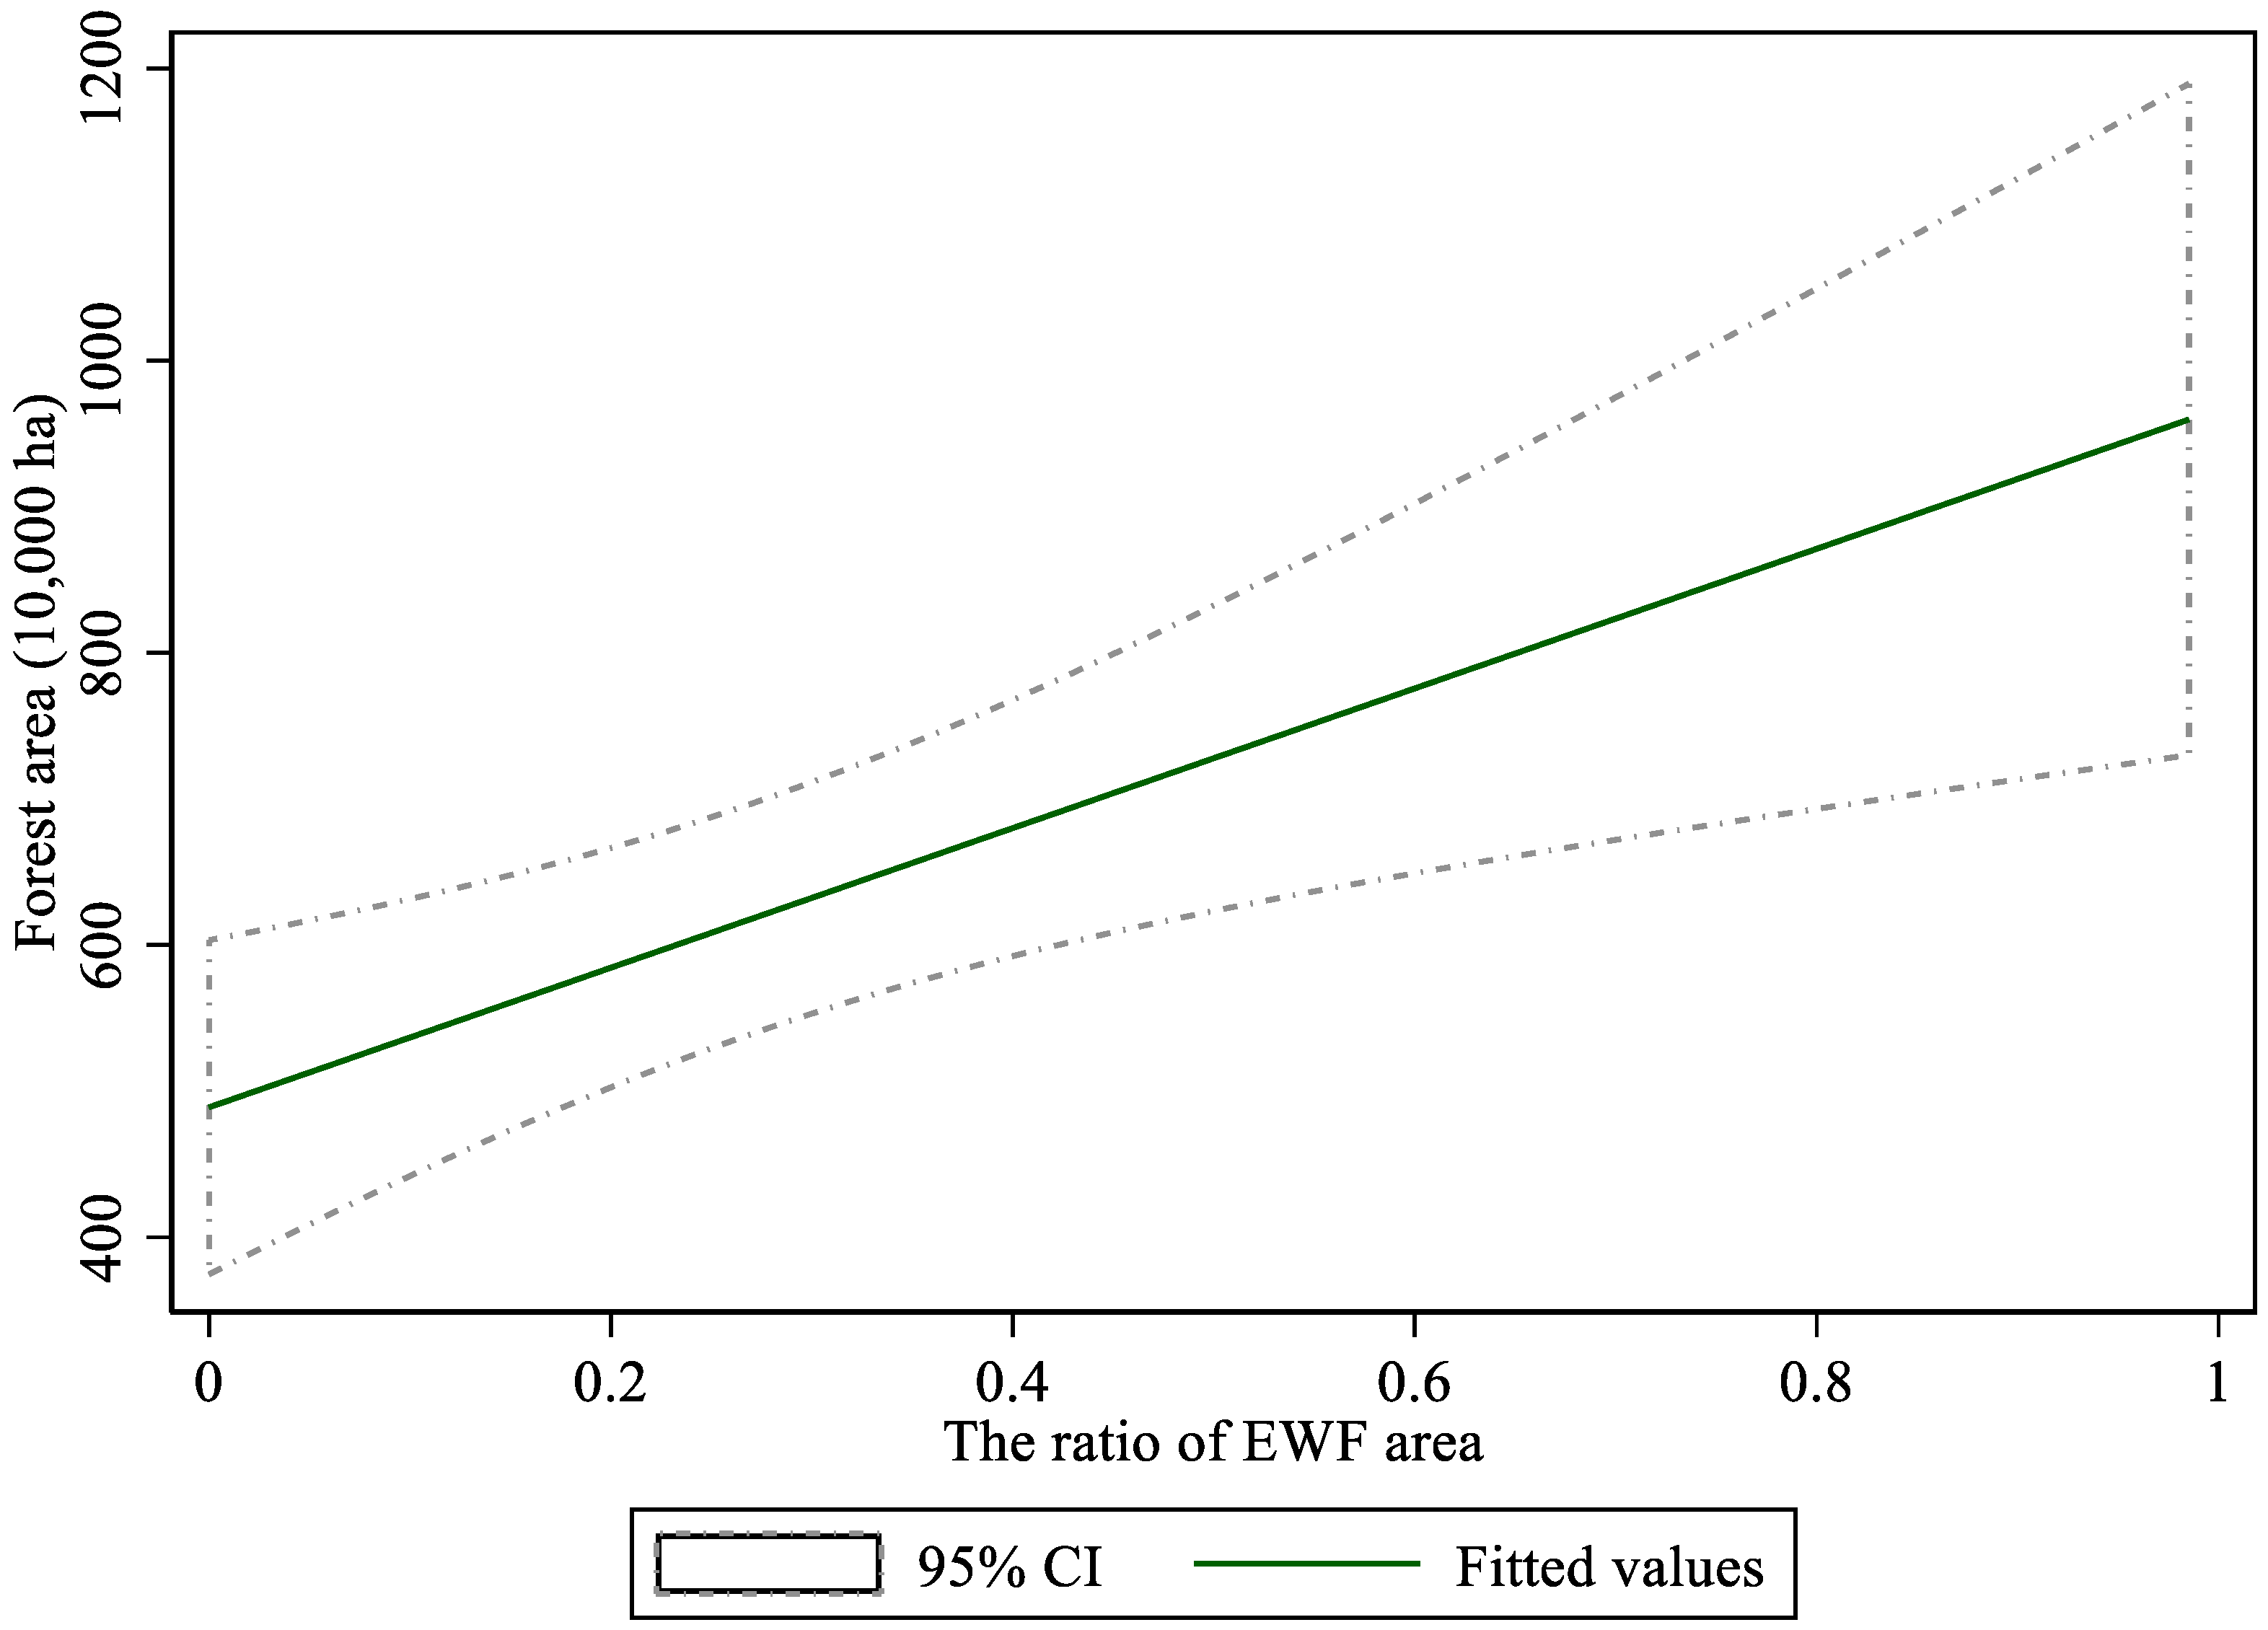
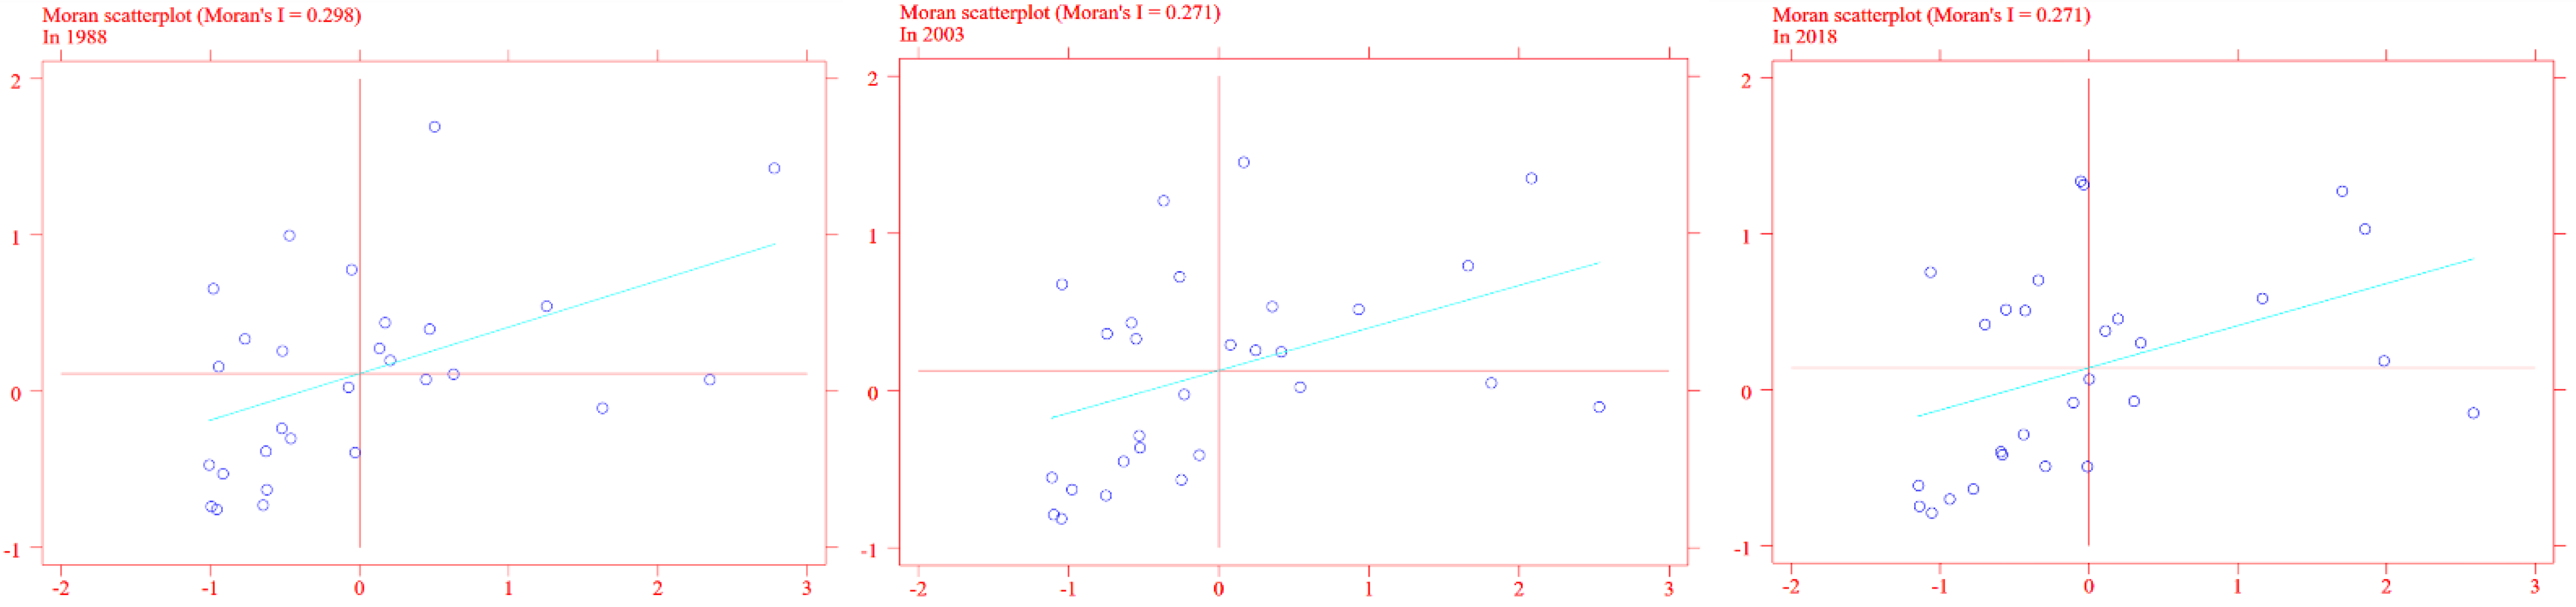
3. Results
3.1. Correlation Test
3.2. Benchmark Regression Results
3.3. Heterogeneity Analysis of Different Forest Regions
3.4. Endogeneity and Empirical Robustness Tests
4. Discussion
5. Conclusions
Author Contributions
Funding
Data Availability Statement
Conflicts of Interest
References
- Blackman, A.; Bluffstone, R. Decentralized forest management: Experimental and quasi-experimental evidence. World Dev. 2021, 145, 105509. [Google Scholar] [CrossRef]
- Xu, C.; Cheng, B.; Zhang, M. Classification-based forest management program and farmers’ income: Evidence from collective forest area in southern China. China Agric. Econ. Rev. 2022. [Google Scholar] [CrossRef]
- Dai, L.M.; Wang, Y.; Su, D.; Zhou, L.; Yu, D.; Lewis, B.J.; Qi, L. Major forest types and the evolution of sustainable forestry in China. Environ. Manag. 2011, 48, 1066–1078. [Google Scholar] [CrossRef] [PubMed]
- Serrano-Ramírez, E.; Valdez-Lazalde, J.R.; de los Santos-Posadas, H.M.; Mora-Gutiérrez, R.A.; Ángeles-Pérez, G. A forest management optimization model based on functional zoning: A comparative analysis of six heuristic techniques. Ecol. Inform. 2021, 61, 101234. [Google Scholar] [CrossRef]
- Manna, C.; Loft, L.; Hernández-Morcilloc, M. Assessing forest governance innovations in Europe: Needs, challenges and ways forward for sustainable forest ecosystem service provision. Ecosyst. Serv. 2021, 52, 101384. [Google Scholar] [CrossRef]
- Yin, R.S. Forestry and the environment in China: The current situation and strategic choices. World Dev. 1998, 26, 2153–2167. [Google Scholar] [CrossRef]
- Hou, J.; Yin, R.; Wu, W. Intensifying forest management in China: What does it mean, why, and how? For. Policy Econ. 2017, 98, 82–89. [Google Scholar] [CrossRef]
- Chatterjee, S.; Pal, D. Is there political elite capture in access to energy sources? Evidence from Indian households. World Dev. 2021, 140, 105288. [Google Scholar] [CrossRef]
- Liu, P.; Yin, R.; Li, H. China’s forest tenure reform and institutional change at a crossroads. For. Policy Econ. 2016, 72, 92–98. [Google Scholar] [CrossRef]
- Dai, L.; Zhao, F.; Shao, G.; Zhou, L.; Tang, L. China’s classification-based forest management: Procedures, problems, and prospects. Environ. Manag. 2009, 43, 1162–1173. [Google Scholar] [CrossRef]
- Galstyan, S. Prerequisites and obstacles for application of the concept of high conservation value forests in Armenia. Ann. Agrar. Sci. 2017, 15, 295–299. [Google Scholar] [CrossRef]
- State Forestry and Grassland Administration. China Forest Resources Report; China Forestry Publishing House: Beijing, China, 2019. (In Chinese) [Google Scholar]
- Gregorio, N.; Herbohn, J.; Tripoli, R.; Pasa, A. A local initiative to achieve global forest and landscape restoration challenge—Lessons learned from a community-based forest restoration project in Biliran province, Philippines. Forests 2020, 11, 475. [Google Scholar] [CrossRef] [Green Version]
- Wunder, S. Payments for environmental services and the poor: Concepts and preliminary evidence. Environ. Dev. Econ. 2008, 13, 279–297. [Google Scholar] [CrossRef]
- Pattanayak, S.K.; Wunder, S.; Ferraro, P.J. Show me the money: Do payments supply environmental services in developing countries? Rev. Environ. Econ. Policy 2010, 4, 254–274. [Google Scholar] [CrossRef]
- Gordillo, F.; Eguiguren, P.; Köthke, M.; Ferrer Velasco, R.; Elsasser, P. Additionality and leakage resulting from PES implementation? Evidence from the Ecuadorian Amazonia. Forests 2021, 12, 906. [Google Scholar] [CrossRef]
- Uchida, E.; Rozelle, S.; Xu, J. Conservation payments, liquidity constraints, and off-farm labor: Impact of the grain-for-green program on rural households in China. Am. J. Agric. Econ. 2009, 91, 70–86. [Google Scholar] [CrossRef] [Green Version]
- Liu, S.; Xia, J. Forest harvesting restriction and forest restoration in China. For. Policy Econ. 2021, 129, 102516. [Google Scholar] [CrossRef]
- Liu, C.; Mullan, K.; Liu, H.; Zhu, W.; Rong, Q. The estimation of long term impacts of China’s key priority forestry programs on rural household incomes. J. For. Econ. 2014, 20, 267–285. [Google Scholar] [CrossRef]
- Yan, Z.; Wei, F.; Deng, X.; Li, C.; He, Q.; Qi, Y. Does the policy of Ecological Forest Rangers (EFRs) for the impoverished populations reduce forest disasters? Empirical evidence from China. Forests 2022, 13, 80. [Google Scholar] [CrossRef]
- Li, L.; Liu, C.; Liu, J.; Cheng, B. Has the Sloping Land Conversion Program in China impacted the income and employment of rural households? Land Use Policy 2021, 109, 105648. [Google Scholar] [CrossRef]
- Hyde, W.F.; Yin, R. 40 years of China’s forest reforms: Summary and outlook. For. Policy Econ. 2019, 98, 90–95. [Google Scholar] [CrossRef]
- Xu, C.; Li, L.; Cheng, B. The impact of institutions on forestland transfer rents: The case of Zhejiang province in China. For. Policy Econ. 2021, 123, 102354. [Google Scholar] [CrossRef]
- Yin, R.; Liu, H.; Liu, C.; Lu, G. Households’ decisions to participate in China’s Sloping Land Conversion Program and reallocate their labour times: Is there endogeneity bias? Ecol. Econ. 2018, 145, 380–390. [Google Scholar] [CrossRef]
- Yiwen, Z.; Kant, S. Secure tenure or equal access? Farmers’ preferences for reallocating the property rights of collective farmland and forestland in Southeast China. Land Use Policy 2022, 112, 105814. [Google Scholar] [CrossRef]
- Kowler, L.F.; Kumar Pratihast, A.; Pérez Ojeda del Arco, A.; Larson, A.M.; Braun, C.; Herold, M. Aiming for sustainability and scalability: Community engagement in forest payment schemes. Forests 2020, 11, 444. [Google Scholar] [CrossRef] [Green Version]
- Xu, C.; Dong, L.; Yu, C.; Zhang, Y.; Cheng, B. Can forest city construction affect urban air quality? The evidence from the BTH urban agglomeration of China. J. Clean. Prod. 2020, 264, 121607. [Google Scholar]
- Purwestri, R.C.; Hájek, M.; Šodková, M.; Sane, M.; Kašpar, J. Bioeconomy in the National Forest Strategy: A comparison study in Germany and the Czech Republic. Forests 2020, 11, 608. [Google Scholar] [CrossRef]
- Belotti, F.; Hughes, G.; Mortari, A.P. Spatial panel data models using Stata. Stata J. 2016, 17, 139–180. [Google Scholar] [CrossRef] [Green Version]
- Lesage, J.P.; Pace, R.K. Spatial econometric modeling of origin-destination flows. J. Reg. Sci. 2010, 48, 941–967. [Google Scholar] [CrossRef]
- White, H. Maximum likelihood estimation of misspecified models. Econometrica 1982, 50, 1–25. [Google Scholar] [CrossRef]
- Drukker, D.M.; Prucha, I.R.; Raciborski, R. Maximum likelihood and generalized spatial two-stage least-squares estimators for a spatial-autoregressive model with spatial-autoregressive disturbances. Stata J. 2013, 13, 221–241. [Google Scholar] [CrossRef] [Green Version]
- Mather, A.S. Recent Asian forest transitions in relation to forest transition theory. Int. For. Rev. 2007, 9, 491–502. [Google Scholar]
- Kaya, A.; Bettinger, P.; Boston, K.; Akbulut, R.; Ucar, Z.; Siry, J.; Merry, K.; Cieszewski, C. Optimisation in forest management. Curr. For. Rep. 2016, 2, 1–17. [Google Scholar] [CrossRef] [Green Version]
- Lorenzen, M.; Orozco-Ramírez, Q.; Ramírez-Santiago, R.; Garza, G.G. Migration, socioeconomic transformation, and land-use change in Mexico’s Mixteca Alta: Lessons for forest transition theory. Land Use Policy 2020, 95, 104580. [Google Scholar] [CrossRef]
- Wang, G.; Innes, J.L.; Lei, J.; Dai, S.; Wu, S.W. China’s forestry reforms. Science 2007, 318, 1556–1557. [Google Scholar] [CrossRef] [Green Version]
- Pan, X.; Xu, L.; Yang, Z.; Bing, Y. Payments for ecosystem services in China: Policy, practice, and progress Triad forest management: Scenario analysis of forest zoning effects on timber and non-timber values in New Brunswick, Canada. Ecosyst. Serv. 2017, 21, 109–119. [Google Scholar]
- Jara-Rojas, R.; Russy, S.; Roco, L.; Fleming-Muñoz, D.; Engler, A. Factors affecting the adoption of agroforestry practices: Insights from silvopastoral systems of Colombia. Forests 2020, 11, 648. [Google Scholar] [CrossRef]
- Timms, B.F.; Hayes, J.; McCracken, M. From deforestation to reforestation: Applying the forest transition to the Cockpit country of Jamaica. Area 2013, 45, 77–87. [Google Scholar] [CrossRef]
- Wang, Y.; Zhang, Q.; Bilsborrow, R.; Tao, S.; Chen, X.; Kira, S.W.; Huang, Q.; Li, J.; Song, C. Effects of payments for ecosystem services programs in China on rural household labor allocation and land use: Identifying complex pathways. Land Use Policy 2020, 99, 105024. [Google Scholar] [CrossRef]
- Rahmani, T.A.; Nurrochmat, D.R.; Hero, Y.; Park, M.S.; Boer, R.; Satria, A. Evaluating the feasibility of oil palm agroforestry in Harapan Rainforest, Jambi, Indonesia. For. Soc. 2021, 5, 458–477. [Google Scholar] [CrossRef]
- Rossita, A.; Nurrochmat, D.R.; Boer, R.; Hein, L.; Riqqi, A. Assessing the monetary value of ecosystem services provided by Gaung—Batang Tuaka Peat Hydrological Unit (KHG), Riau Province. Heliyon 2021, 7, e08208. [Google Scholar] [CrossRef] [PubMed]
- Agúndez, D.; Lawali, S.; Mahamane, A.; Alía, R.; Soliño, M. Farmers’ preferences for conservation and breeding programs of forestry food resources in Niger. Forests 2020, 11, 697. [Google Scholar] [CrossRef]
- Nurrochmat, D.R.; Dharmawan, A.H.; Obidzinski, K.; Dermawan, A.; Erbaugh, J.T. Contesting national and international forest regimes: Case of timber legality certification for community forests in Central Java, Indonesia. For. Policy Econ. 2016, 68, 54–64. [Google Scholar] [CrossRef]
- Liu, C.; Wang, S.; Liu, H.; Zhu, W. Why did the 1980s reform of collective-forestland tenure in southern China fail? For. Policy Econ. 2017, 83, 131–141. [Google Scholar] [CrossRef]
- Anselin, L. Spatial econometrics: Methods and models. Econ. Geogr. 1988, 65, 160–162. [Google Scholar]
- Tollefson, C.; Reaves, N.D. The wealth of forests: Markets, regulation and sustainable forestry. Electron. Green J. 2001, 1, 2–3. [Google Scholar]
- Ciancio, O.; Nocentini, S. Biodiversity conservation and systemic silviculture: Concepts and applications. Plant Biosyst. 2011, 145, 411–418. [Google Scholar] [CrossRef]
- Yamada, Y. Can a regional-level forest management policy achieve sustainable forest management? For. Policy Econ. 2018, 90, 82–89. [Google Scholar] [CrossRef]
- Pazos-Almada, B.; Bray, D.B. Community-based land sparing: Territorial land-use zoning and forest management in the Sierra Norte of Oaxaca, Mexico. Land Use Policy 2018, 78, 219–226. [Google Scholar] [CrossRef]
- Dragicevic, A.Z. Comparing forest governance models against invasive biological threats. J. Theor. Biol. 2019, 462, 270–282. [Google Scholar] [CrossRef]
- Maier, C.; Hebermehl, W.; Grossmann, C.M. Innovations for securing forest ecosystem service provision in Europe—A systematic literature review. Ecosyst. Serv. 2021, 52, 101374. [Google Scholar] [CrossRef]
- Colas, C.; Costedoat, S. Heterogeneous impact of a collective payment for environmental services scheme on reducing deforestation in Cambodia. World Dev. 2017, 98, 148–159. [Google Scholar]
- Ferraro, P.J.; Hanauer, M.M. Quantifying causal mechanisms to determine how protected areas affect poverty through changes in ecosystem services and infrastructure. Proc. Natl. Acad. Sci. USA 2014, 111, 4332. [Google Scholar] [CrossRef] [PubMed] [Green Version]
- Xu, X.; Zhang, Y.; Li, L.; Yang, S. Markets for forestland use rights: A case study in southern China. Land Use Policy 2013, 30, 560–569. [Google Scholar] [CrossRef]
- Zhu, Z.; Xu, Z.; Shen, Y.; Huang, C.; Zhang, Y. How off-farm work drives the intensity of rural households’ investment in forest management: The case from Zhejiang, China. For. Policy Econ. 2019, 98, 30–43. [Google Scholar] [CrossRef]
- Xu, J.; Hyde, W.F. China’s second round of forest reforms: Observations for China and implications globally. For. Policy Econ. 2019, 98, 19–29. [Google Scholar] [CrossRef]
- Nurfatriani, F.; Darusman, D.; Nurrochmat, D.R.; Yustika, A.E.; Muttaqin, M.Z. Redesigning indonesian forest fiscal policy to support forest conservation. For. Policy Econ. 2015, 1, 39–50. [Google Scholar] [CrossRef]
- Sheriffdeen, M.; Nurrochmat, D.R.; Gregorio, M.D. Indicators to Evaluate the Institutional Effectiveness of National Climate Financing Mechanisms. For. Soc. 2020, 4, 358–378. [Google Scholar] [CrossRef]
- Harbi, J.; Erbaugh, J.T.; Sidiq, M.; Haasler, B.; Nurrochmat, D.R. Making a bridge between livelihoods and forest conservation: Lessons from non timber forest products’ utilization in South Sumatera, Indonesia. For. Policy Econ. 2018, 94, 1–10. [Google Scholar] [CrossRef]
- Nurrochmat, D.R.R.; Pribadi, R.; Siregar, H.; Justianto, A.; Park, M.S. Transformation of Agro-Forest Management Policy under the Dynamic Circumstances of a Two-Decade Regional Autonomy in Indonesia. Forests 2021, 12, 419. [Google Scholar] [CrossRef]
- Zhu, Z.; Xu, Z.; Shen, Y.; Huang, C. How forestland size affects household profits from timber harvests: A case-study in China’s southern collective forest area. Land Use Policy 2020, 97, 103380. [Google Scholar] [CrossRef]
- Giessen, L. Fragmentation as analytical key characteristic of the international forestregime: From a mono- to a multi-disciplinary methodological framework for a deepened forest policy analysis. Allg. Forst Und Jagdztg. 2013, 184, 48–58. [Google Scholar]
- Sahide, M.A.K.; Nurrochmat, D.R.; Giessen, L. The regime complex for tropical rainforest transformation: Analysing the relevance of multiple global and regional land use regimes in Indonesia. Land Use Policy 2015, 47, 408–425. [Google Scholar] [CrossRef]
- Erbaugh, J.T.; Nurrochmat, D.R. Paradigm shift and business as usual through policy layering: Forest-related policy change in Indonesia (1999–2016). Land Use Policy 2019, 86, 136–146. [Google Scholar] [CrossRef]

| Variable Category | Variable Name | Calculation Method | Mean | Std. Dev. |
|---|---|---|---|---|
| Explained variable | Forest area | The logarithm of forest area | 5.74 | 1.56 |
| Core explanatory variable | Proportion of EWF | EWF area/total forest area | 0.27 | 0.26 |
| Other control variables | Economic development | The logarithm of GDP per capita | 2.79 | 0.79 |
| Population size | The logarithm of population density | 5.30 | 1.31 | |
| Forestry support services | The logarithm of the output value of forestry production services, professional technical services, public management, and other services was taken after summing | 4.67 | 2.36 | |
| Livelihood | The logarithm of wood yield | 3.76 | 3.65 | |
| Demand for wood products | The output of wood-based panels was logarithmic | 3.43 | 2.45 | |
| Policy support | The afforestation area of key projects was logarithmic | 5.08 | 17.60 | |
| Forest products trade | The logarithm of sawlog and veneer imports was taken after summing | 7.68 | 1.09 |
| Variable | SAR | Dynamic SAR | SDM | Dynamic SDM |
|---|---|---|---|---|
| Proportion of EWF | 0.5811 *** | −0.0268 | 0.2704 * | −0.0299 |
| (0.0942) | (0.0818) | (0.1511) | (0.0820) | |
| Economic development | 0.0472 | 0.0395 | ||
| (0.0403) | (0.0423) | |||
| Population size | 0.2144 | 0.1717 | ||
| (0.1446) | (0.1602) | |||
| Livelihood | −0.0159 ** | −0.0174 ** | ||
| (0.0078) | (0.0082) | |||
| Demand for wood products | −0.0275 ** | −0.0269 ** | ||
| (0.0110) | (0.0110) | |||
| Policy support | 0.0752 *** | 0.0738 *** | ||
| (0.0226) | (0.0227) | |||
| Forestry support services | 0.2915 *** | 0.2810 *** | ||
| (0.1001) | (0.1015) | |||
| Forest products trade | 0.1381 ** | 0.1378 ** | ||
| (0.0672) | (0.0672) | |||
| L. Forest area | 0.9049 *** | 0.9068 *** | ||
| (0.0550) | (0.0550) | |||
| L. W * Forest area | −0.2071 | −0.2144 * | ||
| (0.1294) | (0.1295) | |||
| rho | 0.5450 *** | 0.2368 ** | 0.4509 *** | 0.2380 ** |
| (0.0699) | (0.0983) | (0.0833) | (0.0983) | |
| sigma2_e | 0.0419 *** | 0.0177 *** | 0.0417 *** | 0.0176 *** |
| (0.0044) | (0.0017) | (0.0043) | (0.0017) | |
| Regional fixed effects | control | control | control | control |
| Time fixed effects | control | control | control | control |
| BIC | −32.81088 | −158.2225 | −34.34823 | −153.3117 |
| Variable | State Forest Province | Southern Collective Forest Province | ||
|---|---|---|---|---|
| SAR | Dynamic SAR | SAR | Dynamic SAR | |
| Proportion of EWF | 0.4604 *** | −0.0436 | 0.4596 *** | −0.2577 * |
| (0.1285) | (0.1104) | (0.1078) | (0.1362) | |
| Economic development | 0.0048 | 0.4734 *** | ||
| (0.0620) | (0.1217) | |||
| Population size | 0.9333 ** | 0.5297 *** | ||
| (0.3814) | (0.1640) | |||
| Livelihood | 0.3490* | 0.0397 | ||
| (0.1783) | (0.1269) | |||
| Demand for wood products | −0.1083 *** | −0.0298 *** | ||
| (0.0377) | (0.0071) | |||
| Policy support | −0.0090 | −0.0360 ** | ||
| (0.0232) | (0.0169) | |||
| Forestry support services | 0.2273 *** | 0.1302 *** | ||
| (0.0594) | (0.0232) | |||
| Forest products trade | 0.1513 | 0.1242 | ||
| (0.1285) | (0.0757) | |||
| L. Forest area | 0.7268 *** | 1.0938 *** | ||
| (0.1017) | (0.0663) | |||
| L. W. * Forest area | −0.6651 *** | 2.3189 *** | ||
| (0.2308) | (0.1982) | |||
| rho | 0.4575 *** | −0.0147 | 0.6931 *** | 0.3576 ** |
| (0.1164) | (0.1542) | (0.0781) | (0.1433) | |
| sigma2_e | 0.0423 *** | 0.0140 *** | 0.0084 *** | 0.0115 *** |
| (0.0078) | (0.0023) | (0.0015) | (0.0013) | |
| Regional fixed effects | control | control | control | control |
| Time fixed effects | control | control | control | control |
| Variable | (1) | (2) | (3) | (4) |
|---|---|---|---|---|
| Proportion of EWF | −0.0370 | −0.0160 | 0.1166 | 0.1125 |
| (0.0373) | (0.0761) | (0.0861) | (0.0816) | |
| L. Forest area | 0.4568 *** | 1.2465 *** | ||
| (0.0823) | (0.0568) | |||
| L. W. * Forest area | 7.1177 *** | |||
| (0.6573) | ||||
| L. Forest accumulation | 0.5176 *** | 0.6965 *** | ||
| (0.0509) | (0.2178) | |||
| L. W. * Forest accumulation | 0.4435 *** | |||
| (0.1020) | ||||
| rho | −0.5280 | 0.3295 *** | ||
| (0.4295) | (0.0906) | |||
| sigma2_e | 0.0140 *** | 0.0260 *** | ||
| (0.0013) | (0.0024) | |||
| AR (1) | −2.0489 ** | −2.0330 ** | ||
| AR (2) | 0.2441 | 0.5992 | ||
| Sargan | 12.9575 | 8.9253 | ||
| Control variables | control | control | control | control |
| R-squared | - | 0.4784 | 0.8439 | - |
Publisher’s Note: MDPI stays neutral with regard to jurisdictional claims in published maps and institutional affiliations. |
© 2022 by the authors. Licensee MDPI, Basel, Switzerland. This article is an open access article distributed under the terms and conditions of the Creative Commons Attribution (CC BY) license (https://creativecommons.org/licenses/by/4.0/).
Share and Cite
Xu, C.; Lin, F.; Zhu, C.; Li, C.; Cheng, B. Does Classification-Based Forest Management Promote Forest Restoration? Evidence from China’s Ecological Welfare Forestland Certification Program. Forests 2022, 13, 573. https://doi.org/10.3390/f13040573
Xu C, Lin F, Zhu C, Li C, Cheng B. Does Classification-Based Forest Management Promote Forest Restoration? Evidence from China’s Ecological Welfare Forestland Certification Program. Forests. 2022; 13(4):573. https://doi.org/10.3390/f13040573
Chicago/Turabian StyleXu, Chang, Fanli Lin, Chenghao Zhu, Chaozhu Li, and Baodong Cheng. 2022. "Does Classification-Based Forest Management Promote Forest Restoration? Evidence from China’s Ecological Welfare Forestland Certification Program" Forests 13, no. 4: 573. https://doi.org/10.3390/f13040573
APA StyleXu, C., Lin, F., Zhu, C., Li, C., & Cheng, B. (2022). Does Classification-Based Forest Management Promote Forest Restoration? Evidence from China’s Ecological Welfare Forestland Certification Program. Forests, 13(4), 573. https://doi.org/10.3390/f13040573