Abstract
Tree ring analyses can assist in revealing the effect of gradual change in climatic variables on tree growth. Dendroclimatic analyses are of particular importance in evaluating the climate variables that affect growth significantly and in determining the relative strength of different climatic factors. In this study, we investigated the growth performance of Pinus sylvestris, Picea abies, and Pseudotsuga menziesii in northern Germany using standard dendrochronological methods. The study further analyzed tree growth responses to different climatic variables over a period of a hundred years. Both response function analysis and moving correlation analysis confirmed that the climate and growth relationship is species-specific and variable and inconsistent over time. Scots pine and Douglas fir growth were stimulated mainly by the increase in winter temperatures, particularly the January, February, and March temperatures of the current year. In contrast, Norway spruce growth was stimulated mainly by the increase in precipitation in May, June, and July and the increase in temperature in March of the current year. Climate projections for central Europe foresee an increase in temperature and a decrease in the amount of summer precipitation. In a future, warmer climate with drier summers, the growth of Norway spruce might be negatively affected.
1. Introduction
Changes in the global surface temperature and precipitation regime have been significantly driving species responses including plant development processes and growth [1,2,3]. Global surface temperature will continue to increase until at least the mid-century, and continued global warming is projected to further intensify the global water cycle, including its variability, global monsoon precipitation, and the severity of wet and dry events [4]. Several studies have suggested that the combination of increasing temperatures, extended growing seasons, and reduced or intra-annually redistributed precipitation can either increase or decrease tree growth [5,6,7]. For central Europe, a relatively rapid temperature increase accompanied by an overall decrease in summer precipitation are projected until the end of the 21st century [8]. Such changes in temperature and precipitation contribute to increased variability with a greater risk of extreme impact events, such as prolonged drought, storms, and floods, which may have a detrimental impact on forest ecosystems. Studies have shown ongoing changes in climate parameters may result in vegetation shifts leading to significant changes in species composition [9,10,11] and biomass production [12,13] including tree decline [14,15]. A complicating factor for the consideration of future development is that future climate scenarios are subject to uncertainties [16].
Knowledge of the resilience and resistance of tree species is crucial in understanding the adaptation potential of a species in a changing climate. Temporal variability of temperature and water regimes results in site-specific and species-specific variations in tree-ring width [17], offering the opportunity to assess the growth behavior of tree species under a changing climate [18].
On the other hand, the tree rings tell a story: a story about the life of the tree and the environment in which it grew [19]. Tree rings are natural archives that preserve evidence of past climate changes and, therefore, permit paleoclimate reconstructions. With these avenues, tree rings as proxy-based information have been used to indicate how the climate has changed in the past, and specifically, for the reconstruction of temperature and precipitation variability, tree-ring-based drought reconstructions, and several other purposes since the early 20th century.
The potential of tree ring analyses in revealing the climatic response of the tree species has been frequently discussed [20,21,22]. Dendroclimatic analyses are of particular importance in assessing the climate variables that affect the growth variability significantly and determining the relative strength of different climatic factors [23]. As the climate signal is confounded by many other factors that are not related to climates such as tree species, tree age, management, concurrence, soil nutrient characteristics, pests, or exposure to sunlight, the climate signal needs to be separated from the remaining “background noise” [23]. This is commonly achieved by deriving a tree-ring chronology from available individual tree ring series, which allows identifying climate signals that affect the growth pattern of trees. Compilation of tree core data [24] and advances in the statistical application of tree ring data result in more robust and long-term reconstructions of key indices such as temperature [25] and precipitation.
The impact of climate change on some of the dominant tree species in Europe such as Norway spruce (Picea abies), and Scots pine (Pinus sylvestris) has been discussed extensively [26], though results are controversial. While there is an agreement that Norway spruce is one of the most vulnerable tree species in Europe to climate change as the species is not drought tolerant [27,28,29], studies have found mixed results on the impact of climate change especially precipitation and temperature on other tree species like Scots pine [30,31] and European beech (Fagus sylvatica) [32]. This has increased interest in introduced tree species like Douglas fir (Pseudotsuga menziesii), as they are thought to be more resilient to water deficit [33,34], however, a more recent study suggests the contrasting result [35], thus suggesting further research are needed in the given area.
The study investigates the growth performance of three tree species, Scots pine (Pinus sylvestris), Norway spruce (Picea abies), and Douglas fir (Pseudotsuga menziesii), in northern Germany (Schleswig-Holstein) and determines the relationship between tree growth, physical changes in key indices of climate change (i.e., temperature and precipitation) and impact events (i.e., drought). The study uses tree ring information of the three different species and provides a better understanding of the long-term impact of climate change on forest productivity and carbon sequestration.
2. Materials and Methods
2.1. Selected Tree Species
For the study, three tree species, i.e., Scots pine (Pinus sylvestris), Norway spruce (Picea abies), and Douglas fir (Pseudotsuga menziesii) were selected. The species are widely planted species in Germany and across Europe. Scots pine and Norway spruce are native tree species, and Douglas fir is an introduced species.
2.2. Study Sites
The samples for this study were collected from a forest located in Scharbeutz, Schleswig Holstein, Germany. Due to its site characteristics, the forest area is representative of the forests in the northern German federal state of Schleswig-Holstein. The forest is dominated by Abies grandis, Fagus sylvatica, Pinus sylvatica, Picea abies, and Pseudotsuga menziesii. The mean annual air temperature recorded for the study site is 8.6 °C (~24 m a.s.l.) based on climate data for the period from 1900 to 2020. The mean annual precipitation is about 665 mm (Figure 1). The study was conducted in mixed, even-aged stands planted 119 to 144 years ago. The tree species mixture consisted of different blocks with European beech and Douglas fir, Norway spruce, Douglas fir and Scots pine, Norway spruce and Scots pine, and Norway spruce, Scots pine and Douglas fir. The soils were moderately fresh low-loamy soils with a moderate nutrient supply
2.3. Sample Collection and Preparation
Samples were collected from 60 dominant trees, comprising 20 randomly chosen trees from each of the three species. Dominant trees were selected as they were less affected by other micro-environmental factors: for example, competition for light, moisture, or nutrients that may distort climate signals. Trees were cored at breast height (1.3 m above ground) in two directions with an angle of 90° using a 5 mm increment borer. Information on the location of cored trees, site information (altitude, slope gradient, aspect), and several tree attributes (species, total tree height, crown base height) were recorded during the sampling. The collected samples were labeled (Tree code, Tree ID, Core codes) and transported to the dendrology laboratory of the World Forestry, University of Hamburg. The cores were air-dried before proceeding to the examination.
2.4. Climate Data
Monthly climate data were obtained from Germany’s National Meteorological Service [36]. Climate data for Scharbeutz were available for the period from January 1900 until December 2020. DWD provides grid files (i.e., raster maps) of monthly weather data over Germany at 1 km × 1 km spatial resolution. Data are available for different climate variables (e.g., monthly mean air temperature, monthly precipitation). Availability of historical (gridded) climate data depends on the variable. A grid file of each climate variable included in DWD was downloaded for each month (e.g., 140 years × 12 months = 1680 grid files for mean air temperature). At each tree location, the value of the climate variable was extracted from the grid and attached to the tree record. Climate data at each tree location were then aggregated to obtain the value at stand level. Figure 1 shows the Walter–Lieth climate diagram for Scharbeutz based on the precipitation and temperature data measured from 1900 to 2020.
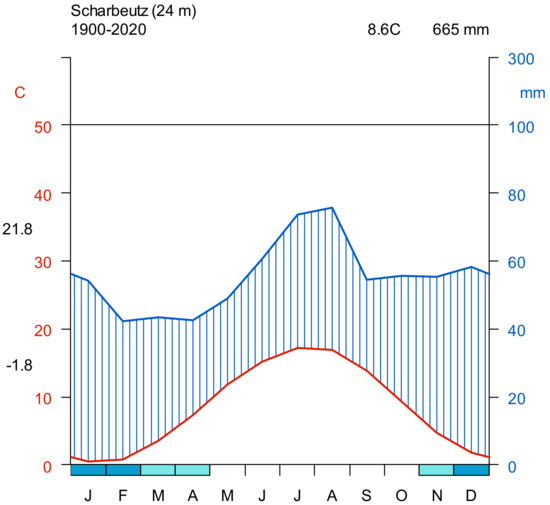
Figure 1.
Walter–Lieth climate diagram for Scharbeutz, Schleswig-Holstein. Precipitation and temperature data were measured from 1900 to 2020. The left y-axis shows temperature (°C), and the right y-axis shows precipitation (mm). The x-axis shows the months. The red curve shows the temperature, and the blue curve shows the precipitation.
2.5. Climate Data Trend Analysis
Trends in climate variables, temperature, and precipitation were explored using the free software environment R [37]. Climate variables were plotted using the code as outlined in Tang [38]. A smooth line was obtained using local polynomial regression fitting.
2.6. Tree Ring Measurement and Analysis
After air drying, the tree cores were sanded and polished to improve the visibility of the growth ring for further analysis. Individual tree rings were marked and their width was measured and digitized using a moving table, LINTAB (linear positioning table) measuring system connected to a PC with the TSAP-win (time series analysis package for windows) software package [39]. For each tree, two tree cores were measured and cross-examined using TSAP-win software to detect apparent measurement errors such as missing measurements. Cross-dating results were further verified using COFECHA software [40]. Flagged increment cores were re-examined for measurement errors, so COEFECHA was used iteratively as needed.
2.7. Standardization and Chronology Building
Tree ring standardization was performed using the dplR package [41] based on R software [37]. All tree ring series were indexed using a double detrending process. Modified negative exponential curves were applied followed by a smoothing cubic spline with a 50% wavelength cutoff to 67% of the series length, in order to remove long-term trends and to preserve high-frequency variations for climate growth analysis [42]. The ring-width chronology was then developed by averaging the ensemble of detrended tree-ring indices across the series for each year using the arithmetic mean. Furthermore, for chronology building, the autocorrelation of every individual series was removed using autoregressive models with a maximum order of three. This procedure ensured that the obtained chronology contained only tree ring variability related to the climate variability (i.e., climatic information stored by the series) and averaged out all long-term growth trends and other noises. Sub sample strength (SSS) of each data set was calculated following [43], using notations from Buras [44]. Only years with values of SSS above 0.85 were used for further data analysis [44,45]. The numbers of samples per tree species included in the further analysis are presented in Table 1. The strength of the common signal in the chronologies was examined using expressed population signal (EPS) statistics. As often practiced, the EPS value should exceed the threshold of 0.85, indicating an adequate strength of the common signal in the time series. When the EPS value drops below this level, the chronology starts to be dominated by individual tree level signals [46]. Other chronological statistics, namely mean index, standard deviation, mean sensitivity, series intercorrelation, autocorrelation, and mean inter-series correlation (Rbar), were also computed. Mean sensitivity is a measure of the year-to-year variability in the master chronology. Mean sensitivity of around 0.2 is generally accepted as indicative of series that are sensitive enough for climate reconstruction [46]. Series intercorrelation is a measure of the site/stand level signal. In general, average inter-series correlation values above 0.50 are considered desirable [40], but the value depends on the species, geographic location, and regional climate. So, the critical value is considered as 0.32 [40]. The Rbar statistic is the average correlation between all possible series windows with a 50-year overlap. Hence, it acts as a running measure of percent common variance, or common signal strength [47].
2.8. Climate Growth Relationship
The relationships between tree-ring chronologies of each species and climate variables (monthly mean temperature, and monthly precipitation sums) were assessed using response function analysis [48]. The temporal stability of the climate growth relationship was explored with progressive year-to-year moving correlations with a base length of 30 years. The calculation results in time-series of correlation coefficients that reflect changes in the climate growth relationship over time. The analysis was performed using the R package treeclim [41,49].
2.9. Drought Event Impact Analysis
Superposed epoch analysis (SEA) was applied to test the significance of the tree growth response to drought years, if any. SEA was performed using the R package dplR [41].
The standardized precipitation evapotranspiration index (SPEI) was used as a drought index. The SPEI is based on precipitation and temperature data, and thus has the advantage of combining multi-scalar character with the capacity to include the effects of temperature variability on drought assessment [50]. The SPEI was calculated with R software [37] using the SPEI package [51]. Potential evapotranspiration (PET) was calculated with the Thornthwaite method [52] using monthly mean temperature and a correlation coefficient derived from latitude to calculate day length. SPEI was calculated from 1900 to 2020 by averaging the monthly index values of the growing season from April to September (Figure 2). Years with an SPEI smaller than −1.5 were classified as moderate drought years, and the years with an SPEI value of more than −1.5 were classified as severe drought years [53].
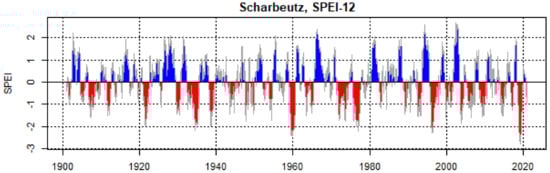
Figure 2.
Calculated standardized precipitation evapotranspiration index (SPEI) for Scharbeutz from the year 1900 to 2020 with 12-month time scale. The blue-colored series represents positive SPEI values (>0) of years with a positive climatic water balance, and the red-colored series represents negative SPEI (<0) values of years with a negative climatic water balance.
3. Results
3.1. Climate Data
There is an increasing trend of temperature and precipitation in Scharbeutz (Figure 3). The mean temperature has increased by nearly 2 °C since 1900. Annual precipitation totals also increased by over 50 mm over the period, and most of this has occurred since about 1975.
The monthly mean temperature is also indicative of the increase in mean annual temperature. As evident in Figure 4, each calendar month has experienced an increase in mean temperature over the 120-year period (1900–2020). The monthly development of precipitation between 1900 and 2000 is variable. While February showed the highest increase in precipitation, March, April, and August showed declining trends.
3.2. Tree Ring Chronology
A total of 19 Pinus sylvestris trees (39 cores) with 3943 measurements were successfully cross-dated and utilized for building site chronology. The chronology spanned 121 years (1900–2020). For Picea abies, a total of 17 trees (32 cores) with 2831 measurements were successfully cross-dated and utilized for building site chronology. The chronology spanned 101 years (1920–2020). For Pseudotsuga menziesii, a total of 19 trees (38 cores) with 3097 measurements were successfully cross-dated and utilized for building site chronology. The chronology spanned 99 years (1922–2020). The chronology of each species is presented in Figure 5.

Figure 3.
Plot of annual mean temperature (left) and annual precipitation (right) for Scharbeutz (northern Germany).

Figure 4.
Plot of individual month summary of the monthly mean temperature (left) and monthly mean of precipitation (right) for the study area (Scharbeutz, northern Germany). Months are represented as a number (for instance; January is represented as 1, and December as 12).
The statistical parameters of the site chronology are presented in Table 1. The mean tree ring width of Douglas fir was the highest (2.78 mm) among the studied species, closely followed by Norway spruce (2.71 mm) and Scots pine (2.06 mm). Mean sensitivity in all of the three species was in the accepted range. Series intercorrelation, which is a measure of the site/stand level signal, for the three species was well above the critical value of 0.32. The mean EPS of Scots pine, Norway spruce, and Douglas fir were 0.865, 0.872, and 0.861, respectively, all well above the threshold value of 0.85 required to produce a statistically robust chronology. The degree of synchronicity, Gleichläufigkeit, for all of the species was 0.634, 0.643, and 0.608, all above the general threshold of 60%.

Table 1.
Statistical characteristics of tree ring width index chronology of Scots pine (Pinus sylvestris), Norway spruce (Picea abies), and Douglas fir (Pseudotsuga menziesii) Scharbeutz (northern Germany).
Table 1.
Statistical characteristics of tree ring width index chronology of Scots pine (Pinus sylvestris), Norway spruce (Picea abies), and Douglas fir (Pseudotsuga menziesii) Scharbeutz (northern Germany).
| Parameters | Scots Pine | Norway Spruce | Douglas Fir |
|---|---|---|---|
| No. of trees | 19 | 17 | 19 |
| Overall period | 1900–2020 | 1920–2020 | 1922–2020 |
| Age range (years) | 81–121 | 75–101 | 60–99 |
| Mean tree ring width (mm) | 2.06 | 2.71 | 2.78 |
| Standard deviation (mm) | 1.037 | 1.272 | 1.38 |
| Mean sensitivity | 0.24 | 0.28 | 0.27 |
| Series intercorrelation | 0.541 | 0.565 | 0.477 |
| Autocorrelation | 0.497 | 0.440 | 0.484 |
| Expressed population signal (EPS) | 0.885 | 0.897 | 0.861 |
| Rbar | 0.241 | 0.271 | 0.204 |
| The degree of synchronicity Mean Gleichläufigkeit | 0.634 | 0.643 | 0.608 |
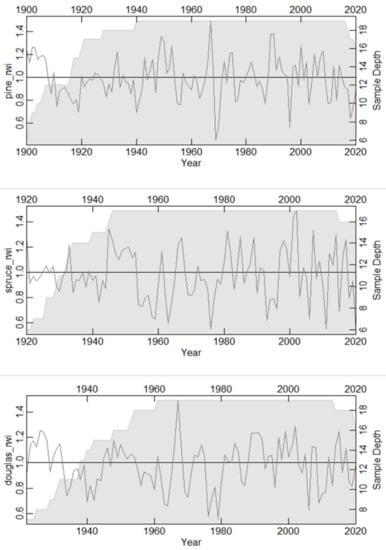
Figure 5.
Ring width chronology of (a) Scots pine (Pinus sylvestris), (b) Norway spruce (Picea abies), and (c) Douglas fir (Pseudotsuga menziesii), Scharbeutz (northern Germany). Gray shaded area indicates sample depth with the scale on the right Y-axis.
3.3. Climate–Growth Relationships
Climate–growth relationships of the three species were different over time. The response function analysis between the tree ring chronologies and climate variables (mean monthly temperature and monthly precipitation sums) showed that the tree ring growth of the Scots pine was strongly positively correlated (p < 0.05) with the winter months, i.e., current January, February, and March temperatures (Figure 6). A similar pattern was observed in Douglas fir. In addition, the current year’s June temperature influenced tree growth negatively. However, the influence of temperature was observed to be slightly different in Norway spruce, where only March temperature had a significant positive impact.
Similarly, precipitation played a varied role in the growth of the species. While precipitation had no correlation with tree ring growth in the Scots pine, May, June, and July precipitation had a strong positive correlation with Norway spruce growth (Figure 6). In Douglas fir, precipitation in June of the previous year and in July of the current year had a significant impact on tree ring growth (Figure 6).
The moving correlation analysis also showed an increasing trend in tree ring growth sensitivity to temperature (Figure 7). As with the above analysis, January, February, and March temperatures were the most influential climate variables for tree growth in Scots pine. Tree growth had responded positively to January, February and March mean temperatures since 1911, and the trend was stronger in recent years. Though the effect of April temperature on tree growth was significant in many years (1916 to 1980), its effect diminished over time. Furthermore, the effect of precipitation on Scots pine growth was not consistent over the years.
In the case of Norway spruce, the moving correlation analysis showed that tree ring growth responded positively to February and March mean temperatures for many years, though the impact was not consistent (Figure 7). April mean temperature also showed a significant positive impact on tree growth through the period 1921–1975; however, the effect diminished in more recent decades. In the early years (1920 to around 1970), February, May, and June precipitation had a significant positive impact on the tree growth of Norway spruce. However, in later years, there was a clear shift. June and July precipitation had a stronger positive relation to tree growth with the decreased influence of May precipitation.
In Douglas fir, the moving correlation analysis showed a more consistent positive influence of January, February, and March temperatures on tree growth from 1936 onwards (Figure 7). During the period of 1921 to 1985, May precipitation had a positive impact on tree growth; however, that trend declined over the years.
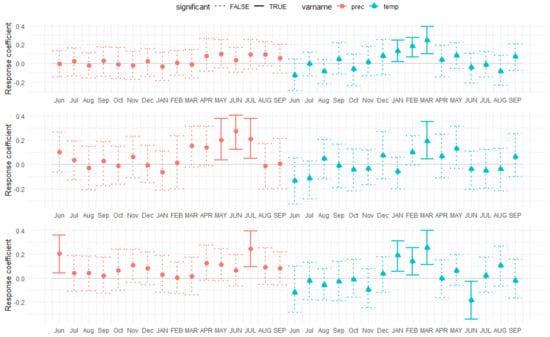
Figure 6.
Plot of bootstrapped response function analysis relating tree ring growth in Scots pine (Pinus sylvestris) (upper), Norway spruce (Picea abies) (Centre), and Douglas fir (Pseudotsuga menziesii) (lower) to sums of precipitation and mean monthly temperature from previous June to current September, Scharbeutz (northern Germany). Abbreviated previous-year months are given in lowercase letters, and current year months are given in uppercase letters.

Figure 7.
Plot of moving correlation function with 30-year window relating to tree ring growth of Scots pine (Pinus sylvestris) (left), Norway spruce (Picea abies) (middle), and Douglas fir (Pseudotsuga menziesii) (right) to sums of precipitation and mean monthly temperature. Significant correlations (p < 0.05) are indicated by white asterisks.
3.4. Drought Event Impact Analysis
Calculation of the standardized precipitation evapotranspiration index (SPEI) showed that 1907, 1912, 1921, 1934, 1938, 1947, 1954, 1960, 1972, 1974, 1976, 1996, 2003, 2009, and 2019 were severe drought years. Superposed epoch analysis (SEA) based on given drought years showed a significant decline in tree ring growth of all three species (Figure 8). However, the impact in following years was observed only in Douglas fir.

Figure 8.
Superposed epoch analysis (SEA) results showing the significant influence of drought events on Scots pine (Pinus sylvestris) (upper), Norway spruce (Picea abies) (central), and Douglas fir (Pseudotsuga menziesii) (lower) growth. In the figure, 0 indicates the event year, −1 and −2, and +1 and +2 indicate one year and two years before and following the drought events, respectively. The dark-colored bar indicates significant growth reduction (p < 0.05).
4. Discussion
4.1. Chronology Characteristics
The mean tree ring width of Douglas fir is larger than that of Norway spruce and Scots pine. This is in line with similarly studied trees [33,35]. The mean sensitivity, EPS, and series intercorrelation of all three studied species suggested a strong common environmental signal [45]. Age structure differed only slightly among the species, allowing us to compare growth parameters. All trees were growing within the same forest, either mixed or in stands nearby, with similar microclimatic conditions, altitude, soil, and aspect.
4.2. Climate–Growth Relationship
Both response function analysis and moving correlation analysis confirmed that the climate–growth relationship was species-specific, but variable and inconsistent over time. The growth of Scots pine and Douglas fir were mainly stimulated by high temperatures in January, February, and March of the current year. This points out that Scots pine and Douglas fir thrive better the mild winters. Such a positive correlation between growth and winter temperature in Douglas fir has been reported in several other studies (e.g., [35,54,55]. During harsh winters, the freezing temperatures may result in deep-frozen soil. Under such conditions, winter desiccation threatens Douglas fir trees [35,56]. Increases in winter temperature reduce such threats. Contrarily, high temperatures in June of the current year impeded growth in Douglas fir, which seemed to be countered by the high precipitation in June of the previous year and July of the current year. However, the moving correlation highlighted decreasing sensitivity of Douglas fir growth to precipitation. The lower impact of drought on Douglas fir has often been mentioned [33,34].
In contrast, high variability and volatility of precipitation had a higher impact on Norway spruce growth. Norway spruce growth was stimulated mainly by high precipitation in May, June, and July and high temperature in March of the current year.
4.3. Tree Growth Sensitivity to Climate Change
In Scharbeutz, there has been a clear increase in temperature. The mean temperature has increased by nearly 2 °C since 1900. The changing pattern is consistent with observed and predicted climate models for central Europe [8]. The average temperature changes have been positive, and winter has warmed more than summer. On average, annual precipitation has increased by over 50 mm since 1900; most of this increase has occurred since about 1975. However, the monthly development of precipitation is more complicated. While there has been a clear increase in winter precipitation, summer precipitation has been more or less constant. This is also consistent with projected changes in precipitation, which vary substantially across regions and seasons. Studies have shown a significant increase in winter precipitation in central Europe [8,57,58,59] but a decrease in summer precipitation [8,60].
In general, rising winter month temperatures seem to have favored the growth of Scots pine and Douglas fir. An increase in summer precipitation showed a positive impact on Norway spruce growth, indicating that drier summers might have an adverse impact on the species. From the plot of the moving correlation function, it is obvious that the impact of May precipitation has already diminished, and the impact of June and July precipitation is also fading. This might have been contributed by soil moisture and temperature coupling [61,62]. Changes in monthly precipitation can easily be buffered by storage capacity, but changes in temperature cannot be buffered, as they impact both evapotranspiration and soil moisture. Increased temperature leads to more evaporative demand, and in turn, further drying of the soil.
An increase in the length of the growing season due to warming temperature contributes to environmentally induced incremental changes. Henttonen et al. [63] observed that climate warming has increased the forest productivity of Swedish forests. Similarly, forest areas located in higher altitudes, for example, forests with less drought risk in the Black Forest, Germany, may benefit from the increasing length of the growing season [64]. Our finding of an increment in tree growth in the mild-winter season corroborates with these findings.
However, climate change will likely increase the risk of deficient precipitation over an extended period of drought in some areas, while the risk of flooding due to extreme precipitation affects other parts of the world. Our study indicated a significant decline in tree ring growth of all three species in the severe drought years suggested by the SPEI calculation. Central Europe has experienced extreme events such as intensive droughts, heat spells, and devastating flash floods in recent years. The 2003 millennial drought, unprecedented 2018 drought, and drought in 2019 are a few to mention [65]. As a result of extreme drought stress in 2018 and 2019, unprecedented drought-induced tree mortality was observed in many tree species throughout central Europe [65,66].
Moreover, climate change could alter the frequency and intensity of forest disturbances, and these disturbances can interact with one another and increase the risks to forests. Drought conditions contribute to an increase in the extent, intensity, and severity of forest fires, and lower water tables to the point where the trees’ roots are unable to draw moisture. Such dry conditions weaken the natural defenses of trees that protect them against pests and pathogens. In Germany, hot and dry summers in the past few years have increasingly affected the forests. Pests such as bark beetles have proliferated in particular in already-weakened trees [67]. The unfavorable combination of drought, wildfires, and bark beetle infestation particularly in Norway spruce trees massively ravaged German forests in 2018 and 2019. The Federal Statistical Office [68] reports that timber infested by insects accounted for 53.8% of the total amount of timber logged in 2020 (80.4 million cubic meters). Strong drought legacy effects, such as detected in 2019 [65], would further worsen the situation. These events do not only disrupt the ecology of forests and the economics of forest management but also pose major existential threats to the private forest owners who own half of the total forested land in Germany. Beyond Germany, the intensive droughts in 2018 and 2019 caused a widespread bark beetle outbreak affecting Norway spruce forests in central Europe [69,70]. The impacts of severe droughts, widespread wildfires, windstorms, bark beetle infestations, and several other pest and disease outbreaks on European forests are expected to intensify in the coming years [71]. Such deleterious impacts will directly affect the success of national, regional, and global policies, strategies, and targets related to climate change mitigation and adaptation, management of all types of forests, and biodiversity conservation.
The findings of this study show a positive relationship between rising mean temperature and tree growth. Contextualizing the results of this study requires an understanding that the influence of warming on above-ground biomass tends to alter the interpretation of change in temperature—for example, changes in mean surface air temperature, changes in minimum mean surface air temperature, and changes in winter temperature or the effects of changes within a particular temperature range, e.g., 5–20 °C. Moreover, impacts of climate-induced warming on forest biomass gain and loss vary between geographical regions. Recent literature reported a temperature-driven decrease in biomass in the tropics [72,73]. Hubau et al. [72] suggested that the carbon sink of intact tropical forests peaked in the 1990s and started to decline thereafter. Larjavaara et al. [73] found that the above-ground biomass of old-growth forests is expected to decrease in all humid lowland areas except the boreal regions. Disentangling the impacts of rising CO2 concentrations and increasing temperature was not within the scope of this study; such an effort would be difficult without experimental studies. Our study was based on the fact that both growth and reproduction are controlled by temperature [74]. Temperature limits growth more severely than it limits photosynthesis over the temperature range 5–20 °C [ibid.].
5. Conclusions
In light of future climate change, forests must both adapt to a changing climate and make an important contribution to mitigation as natural sinks for atmospheric CO2. Tree growth responses to changing climate are complex, and the understanding we have is still limited. Despite that limitation, our study underlines that the climate–growth relationship is species-specific.
Uncertainties about future climate change pose a particular problem for safeguarding the sustainability of forests. Small changes in warming at the global level can be amplified at the regional level. For example, a 2 °C increase in global surface temperature can be expected to increase European summer temperatures by 3 °C [16]. Large uncertainties also exist in the development of future precipitation patterns. The strong variability of regional temperatures and precipitation poses a substantial problem for the development of adaptation strategies for forests. Drier summers would result in a preference for Scots pine and Douglas fir over spruce, and colder winters would result in a preference for spruce over Scots pine and Douglas fir. Apart from extreme events associated with higher mortality, climate change will affect forest biomass production. This may affect not only timber production but also carbon sequestration.
The question of how forests can be adapted to climate change will thus be primarily a question of risk minimization. As in our study, a retrospective view through dendroclimatological studies could make an important contribution to our understanding of the climate-dependent nature of growth. In further studies, additional attention should be paid to local site conditions, especially the water storage capacity of the soil.
Author Contributions
A.G., P.R.N. and M.K. conceived and designed the study. P.R.N. and M.K. collected samples from the field. A.G. conducted lab work. P.M. retrieved climatic data. A.G., P.R.N., M.K. and P.M. analyzed data, interpreted results, and wrote the manuscript. All authors have read and agreed to the published version of the manuscript.
Funding
The project was partially funded by the Deutsche Forschungsgemeinschaft (DFG, German Research Foundation) under Germany‘s Excellence Strategy—EXC 2037 ‘CLICCS—Climate, Climatic Change, and Society’—Project Number: 390683824.
Institutional Review Board Statement
Not applicable.
Informed Consent Statement
Not applicable.
Data Availability Statement
All data relevant to the study are included in the article.
Acknowledgments
We would like to thank Sabine Kruse and Anna Klemmer for their technical assistance in the lab. We would also like to thank Konstantin Olschofsky for assistance during sampling. We are grateful to the Landesforsten Schleswig Holstein for their support in providing data for the study. Our special thanks go to Karsten Tybussek and Jens-Birger Bosse.
Conflicts of Interest
The authors declare no conflict of Interest.
References
- Gray, S.B.; Brady, S.M. Plant developmental responses to climate change. Dev. Biol. 2016, 419, 64–77. [Google Scholar] [CrossRef] [PubMed] [Green Version]
- Román-Palacios, C. Recent responses to climate change reveal the drivers of species extinction and survival. Proc. Natl. Acad. Sci. USA 2020, 117, 4211–4217. [Google Scholar] [CrossRef]
- Weiskopf, S.R.; Rubenstein, M.A.; Crozier, L.G.; Gaichas, S.; Griffis, R.; Halofsky, J.E.; Hyde, K.J.W.; Morelli, T.L.; Morisette, J.T.; Muñoz, R.C.; et al. Climate change effects on biodiversity, ecosystems, ecosystem services, and natural resource management in the United States. Sci. Total Environ. 2020, 733, 137782. [Google Scholar] [CrossRef] [PubMed]
- Masson-Delmotte, V.; Zhai, P.; Pirani, A.; Connors, S.L.; Péan, C.; Berger, S.; Caud, N.; Chen, Y.; Goldfarb, L.; Gomis, M.I.; et al. (Eds.) Summary for policymakers. In Climate Change 2021: The Physical Science Basis; Contribution of Working Group I to the Sixth Assessment Report of the Intergovernmental Panel on Climate Change; Cambridge University Press: Cambridge, UK, 2021. [Google Scholar]
- Boisvenue, C.; Running, S. Impacts of climate change on natural forest productivity—Evidence since the middle of the 20th century. Glob. Change Biol. 2006, 12, 862–882. [Google Scholar] [CrossRef]
- Reyer, C.; Lasch, P.; Suckow, F.; Gutsch, M.; Murawski, A.; Pilz, T. Projections of regional changes in forest net primary productivity for different tree species in Europe driven by climate change and carbon dioxide. Ann. For. Sci. 2014, 71, 211–225. [Google Scholar] [CrossRef]
- Farrell, C.; Szota, C.; Arndt, S. Urban Plantings: ‘Living Laboratories’ for Climate Change Response. Trends Plant Sci. 2015, 20, 597–599. [Google Scholar] [CrossRef]
- Christensen, J.; Hewitson, B.; Busuioc, A.; Chen, A.; Gao, X.; Held, I.; Jones, R.; Kolli, R.K.; Kwon, W.-T.; Laprise, R.; et al. Regional climate projections, climate change, 2007: The physical science basis. In Contribution of Working Group I to the Fourth Assessment Report of the Intergovernmental Panel on Climate Change; University Press: Cambridge, UK, 2007; pp. 847–940. [Google Scholar]
- Bugmann, H. Sensitivity of forests in the European Alps to future climatic change. Clim. Res. 1997, 8, 35–44. [Google Scholar] [CrossRef] [Green Version]
- Lindner, M.; Maroschek, M.; Netherer, S.; Kremer, A.; Barbati, A.; Garcia-Gonzalo, J.; Seidl, R.; Delzon, S.; Corona, P.; Kolström, M.; et al. Climate change impacts, adaptive capacity, and vulnerability of European forest ecosystems. For. Ecol. Manag. 2010, 259, 698–709. [Google Scholar] [CrossRef]
- Gonzalez, P.; Neilson, R.; Lenihan, J.; Drapek, R. Global patterns in the vulnerability of ecosystems to vegetation shifts due to climate change. Glob. Ecol. Biogeogr. 2010, 19, 755–768. [Google Scholar] [CrossRef]
- Speed, J.; Martinsen, V.; Hester, A.; Holand, O.; Mulder, J.; Mysterud, A.; Austrheim, G. Continuous and discontinuous variation in ecosystem carbon stocks with elevation across a treeline ecotone. Biogeosciences 2015, 12, 1615–1627. [Google Scholar] [CrossRef] [Green Version]
- Paulsen, J.; Körner, C. A climate-based model to predict potential treeline position around the globe. Alp. Bot. 2014, 124, 1–12. [Google Scholar] [CrossRef] [Green Version]
- Matskovsky, V.; Venegas-González, A.; Garreaud, R.; Roig, F.A.; Gutiérrez, A.G.; Muñoz, A.A.; Le Quesne, C.; Klock, K.; Canales, C. Tree growth decline as a response to projected climate change in the 21st century in Mediterranean mountain forests of Chile. Glob. Planet. Change 2021, 198, 103406. [Google Scholar] [CrossRef]
- Helama, S.; Sohar, K.; Läänelaid, A.; Mäkelä, H.M.; Raisio, J. Oak decline as illustrated through plant–climate interactions near the northern edge of species range. Bot. Rev. 2016, 82, 1–23. [Google Scholar] [CrossRef]
- Marotzke, J.; Hedemann, C.; Milinski, S.; Suarez-Gutierrez, L. Regional temperature trends and their uncertainty. In Hamburg Climate Futures Outlook, Assessing the Plausibility of Deep Carbonization by 2050; Stammer, D., Engels, A., Marotzke, J., Gresse, E., Hedemann, C., Petzolf, J., Eds.; Cluster of Excellence Climate, Climate Change and Society (CLICCS): Hamburg, Germany, 2021. [Google Scholar]
- Schweingruber, F.H. Tree Rings and Environment: Dendroecology; Swiss Federal Institute for Forest, Snow and Landscape Research: Birmensdorf, Switzerland, 1996; p. 609. [Google Scholar]
- Eckstein, D.; Krause, C. Dendroecologlcal Studies on Spruce Trefs to Monitor Environmental Changes Around Hamburg. Iawa J. 1989, 10, 175–182. [Google Scholar] [CrossRef]
- Forman, C.; Asher, C. Brave Green World: How Science Can Save Our Planet; The MIT Press: Cambridge, MA, USA, 2021. [Google Scholar]
- Bigler, C.; Bräker, O.U.; Bugmann, H.; Dobbertin, M.; Rigling, A. Drought as an inciting mortality Factor in Scots Pine Stands of the Valais, Switzerland. Ecosystems 2006, 9, 330–343. [Google Scholar] [CrossRef] [Green Version]
- Gillner, S.; Bräuning, A.; Roloff, A. Dendrochronological analysis of urban trees: Climatic response and impact of drought on frequently used tree species. Trees 2014, 28, 1079–1093. [Google Scholar] [CrossRef]
- Bednarz, Z.; Ptak, J. The Influence of temperature and precipitation on ring widths of Oak (Quercus robur L.) in the Niepolomice forest near Cracow, Southern Poland. Tree Ring Bull. 1990, 50, 1–10. [Google Scholar]
- Fritts, H.C. Tree Rings and Climate; Academic Press: London, UK, 1976; pp. 434–505. [Google Scholar]
- Cuesta-Valero, F.J.; García-García, A.; Beltrami, H.; Zorita, E.; Jaume-Santero, F. Long-term Surface Temperature (LoST) database as a complement for GCM preindustrial simulations. Clim. Past 2019, 15, 1099–1111. [Google Scholar] [CrossRef]
- Wilson, R.; Glasser, N.F.; Reynolds, J.M.; Harrison, S.; Anacona, P.I.; Schaefer, M.; Shannon, S. Glacial lakes of the Central and Patagonian Andes. Glob. Planet. Change 2018, 162, 275–291. [Google Scholar] [CrossRef]
- Dyderski, M.K.; Paź, S.; Frelich, L.E.; Jagodziński, A.M. How much does climate change threaten European forest tree species distributions? Glob. Change Biol. 2018, 24, 1150–1163. [Google Scholar] [CrossRef] [PubMed]
- Hentschel, R.; Rosner, S.; Kayler, Z.E.; Andreassen, K.; Børja, I.; Solberg, S.; Tveito, O.E.; Priesack, E.; Gessler, A. Norway spruce physiological and anatomical predisposition to dieback. For. Ecol. Manag. 2014, 322, 27–36. [Google Scholar] [CrossRef]
- Pretzsch, H.; Schütze, G.; Uhl, E. Resistance of European tree species to drought stress in mixed versus pure forests: Evidence of stress release by inter-specific facilitation. Plant Biol. 2013, 15, 483–495. [Google Scholar] [CrossRef] [PubMed]
- Hanewinkel, M.; Cullmann, D.A.; Schelhaas, M.-J.; Nabuurs, G.-J.; Zimmermann, N.E. Climate change may cause severe loss in the economic value of European forest land. Nat. Clim. Change 2013, 3, 203–207. [Google Scholar] [CrossRef]
- Eilmann, B.; Weber, P.; Rigling, A.; Eckstein, D. Growth reactions of Pinus sylvestris L. and Quercus pubescens Willd. to drought years at a xeric site in Valais, Switzerland. Dendrochronologia 2006, 23, 121–132. [Google Scholar] [CrossRef]
- Bouriaud, O.; Popa, I. Comparative dendroclimatic study of Scots pine, Norway spruce, and silver fir in the Vrancea Range, Eastern Carpathian Mountains. Trees 2009, 23, 95–106. [Google Scholar] [CrossRef]
- Cavin, L.; Mountford, E.P.; Peterken, G.F.; Jump, A.S. Extreme drought alters competitive dominance within and between tree species in a mixed forest stand. Funct. Ecol. 2013, 27, 1424–1435. [Google Scholar] [CrossRef]
- Eilmann, B.; Rigling, A. Tree-growth analyses to estimate tree species’ drought tolerance. Tree Physiol. 2012, 32, 178–187. [Google Scholar] [CrossRef] [Green Version]
- Nadezhdina, N.; Urban, J.; Čermák, J.; Nadezhdin, V.; Kantor, P. Comparative study of long-term water uptake of Norway spruce and Douglas-fir in Moravian upland. J. Hydrol. Hydromech. 2014, 62, 1–6. [Google Scholar] [CrossRef]
- Vejpustková, M.; Čihák, T. Climate response of Douglas fir reveals recently increased sensitivity to drought stress in Central Europe. Forests 2019, 10, 97. [Google Scholar] [CrossRef] [Green Version]
- DWD. Deutscher Wetterdienst. Available online: https://www.dwd.de/DE/Home/home_node.html (accessed on 25 August 2021).
- R Core Team. R: A Language and Environment for Statistical Computing; R Foundation for Statistical Computing: Vienna, Austria, 2016; Available online: https://www.R-project.org/ (accessed on 1 February 2022).
- Tang, D. Plotting Weather Data Using R. [Blog Post]. Available online: https://davetang.org/muse/2020/01/08/plotting-weather-data-using-r/ (accessed on 28 November 2020).
- Rinn, F. Products and Services for Tree and Wood Analysis. 2003. Available online: http://www.rinntech.com/ (accessed on 14 September 2020).
- Grissino-Mayer, H. Evaluating crossdating accuracy: A manual and tutorial for the computer program COFECHA. Tree Ring Res. 2001, 57, 205–221. [Google Scholar]
- Bunn, A.G. A dendrochronology program library in R (dplR). Dendrochronologia 2008, 26, 115–124. [Google Scholar] [CrossRef]
- Cook, E.R.; Peters, K. The Smoothing Spline: A New Approach to Standardizing Forest Interior Tree-Ring Width Series for Dendroclimatic Studies. Tree Ring Bull. 1981, 41, 45–53. [Google Scholar]
- Cook, E.R.; Kairiukstis, L.A. Methods of Dendrochronology: Applications in the Environmental Sciences; Springer: Dordrecht, The Netherlands, 1990. [Google Scholar]
- Buras, A.G. A comment on the expressed population signal. Dendrochronologia 2017, 44, 130–132. [Google Scholar] [CrossRef]
- Wigley, T.M.L.; Briffa, K.R.; Jones, P.D. On the average value of correlated time series, with applications in dendroclimatology and hydrometeorology. J. Appl. Meteorol. Climatol. 1984, 23, 201–213. [Google Scholar] [CrossRef]
- Speer, J. The Fundamentals of Tree-Ring Research; University of Arizona Press: Tucson, AZ, USA, 2012. [Google Scholar]
- Cook, E.R.; Buckley, B.M.; D’Arrigo, R.D.; Peterson, M.J. Warm-season temperatures since 1600 BC reconstructed from Tasmanian tree rings and their relationship to large-scale sea surface temperature anomalies. Clim. Dyn. 2000, 16, 79–91. [Google Scholar] [CrossRef]
- Christiansen, B. Reconstructing the NH Mean Temperature: Can Underestimation of Trends and Variability Be Avoided? J. Clim. 2011, 24, 674–692. [Google Scholar] [CrossRef]
- Zang, C.; Biondi, F. Treeclim: An R package for the numerical calibration of proxy-climate relationships. Ecography 2015, 38, 431–436. [Google Scholar] [CrossRef]
- Vicente-Serrano, S.M.; Begueria, S.; Lopez-Moreno, J.I. A multiscalar drought index sensitive to global warming: The standardized precipitation evapotranspiration index. J. Clim. 2010, 23, 1696–1718. [Google Scholar] [CrossRef] [Green Version]
- Beguería, S.; Vicente-Serrano, S.M.; Reig, F.; Latorre, B. Standardized precipitation evapotranspiration index (SPEI) revisited: Parameter fitting, evapotranspiration models, tools, datasets and drought monitoring. Int. J. Climatol. 2014, 34, 3001–3023. [Google Scholar] [CrossRef] [Green Version]
- Thornthwaite, C.W. An Approach Toward a Rational Classification of Climate. Geogr. Rev. 1948, 38, 55–94. [Google Scholar] [CrossRef]
- Perkins, D.; Uhl, E.; Biber, P.; Du Toit, B.; Carraro, V.; Rötzer, T.; Pretzsch, H. Impact of climate trends and drought events on the growth of oaks (Quercus robur L. and Quercus petraea (Matt.) Liebl.) within and beyond their natural range. Forests 2018, 9, 108. [Google Scholar] [CrossRef] [Green Version]
- Castaldi, C.; Marchi, M.; Vacchiano, G.; Corona, P. Douglas-fir climate sensitivity at two contrasting sites along the southern limit of the European planting range. J. For. Res. 2020, 31, 2193–2204. [Google Scholar] [CrossRef] [Green Version]
- Thurm, E.; Uhl, E.; Pretzsch, H. Mixture reduces climate sensitivity of Douglas-fir stem growth. For. Ecol. Manag. 2016, 376, 205–220. [Google Scholar] [CrossRef]
- Malmqvist, C.; Wallertz, K.; Johansson, U. Survival, early growth and impact of damage by late-spring frost and winter desiccation on Douglas-fir seedlings in southern Sweden. New For. 2018, 49, 723–736. [Google Scholar] [CrossRef] [PubMed] [Green Version]
- Moberg, A.; Jones, P.; Lister, D.; Walther, A.; Brunet, M.; Jacobeit, J.; Alexander, L.; Della-Marta, P.; Luterbacher, J.; Yiou, P.; et al. Indices for daily temperature and precipitation extremes in Europe analyzed for the period 1901–2000. J. Geophys. Res. 2006, 111, D22106. [Google Scholar] [CrossRef] [Green Version]
- Van den Besselaar, E.J.M.; Klein Tank, A.M.G.; Buishand, T.A. Trends in European precipitation extremes over 1951–2010. Int. J. Climatol. 2013, 33, 2682–2689. [Google Scholar] [CrossRef]
- Łupikasza, E.B.; Hänsel, S.; Matschullat, J. Regional and seasonal variability of extreme precipitation trends in southern Poland and central-eastern Germany 1951–2006. Int. J. Climatol. 2011, 31, 2249–2271. [Google Scholar] [CrossRef]
- Maracchi, G.; Sirotenko, O.; Bindi, M. Impacts of Present and Future Climate Variability on Agriculture and Forestry in the Temperate Regions: Europe. Clim. Change 2005, 70, 117–135. [Google Scholar] [CrossRef]
- Seneviratne, S.I.; Corti, T.; Davin, E.L.; Hirschi, M.; Jaeger, E.B.; Lehner, I.; Orlowsky, B.; Teuling, A.J. Investigating soil moisture–climate interactions in a changing climate: A review. Earth Sci. Rev. 2010, 99, 125–161. [Google Scholar] [CrossRef]
- Hirschi, M.; Seneviratne, S.; Alexandrov, V.; Boberg, F.; Boroneant, C.; Christensen, O.; Formayer, H.; Orlowsky, B.; Stepanek, P. Observational evidence for soil-moisture impact on hot extremes in southeastern Europe. Nat. Geosci. 2010, 4, 17–21. [Google Scholar] [CrossRef]
- Henttonen, H.M.; Nöjd, P.; Mäkinen, H. Environment-induced growth changes in the Finnish forests during 1971–2010–An analysis based on National Forest Inventory. For. Ecol. Manag. 2017, 386, 22–36. [Google Scholar] [CrossRef] [Green Version]
- Sperlich, D.; Nadal-Sala, D.; Gracia, C.; Kreuzwieser, J.; Hanewinkel, M.; Yousefpour, R. Gains or losses in forest productivity under climate change? The uncertainty of CO2 fertilization and climate effects. Climate 2020, 8, 141. [Google Scholar] [CrossRef]
- Buras, A.; Rammig, A.; Zang, C.S. Quantifying impacts of the 2018 drought on European ecosystems in comparison to 2003. Biogeosciences 2020, 17, 1655–1672. [Google Scholar] [CrossRef] [Green Version]
- Schuldt, B.; Buras, A.; Arend, M.; Vitasse, Y.; Beierkuhnlein, C.; Damm, A.; Gharun, M.; Grams, T.E.E.; Hauck, M.; Hajek, P.; et al. A first assessment of the impact of the extreme 2018 summer drought on Central European forests. Basic Appl. Ecol. 2020, 45, 86–103. [Google Scholar] [CrossRef]
- Destatis Statistisches Bundesamt. Forest Damage: Logging of Timber Damaged by Insect Infestation Grew More than Tenfold within Five Years. Available online: https://www.destatis.de/EN/Press/2021/08/PE21_N050_41.html (accessed on 1 February 2022).
- Destatis Statistisches Bundesamt. Amount of Timber Logged at New Record High in 2020 Due to Forest Damage. Available online: https://www.destatis.de/EN/Press/2021/04/PE21_192_413.html (accessed on 1 February 2022).
- Jakoby, O.; Lischke, H.; Wermelinger, B. Climate change alters elevational phenology patterns of the European spruce bark beetle (Ips typographus). Glob. Change Biol. 2019, 25, 4048–4063. [Google Scholar] [CrossRef] [PubMed]
- Netherer, S.; Panassiti, B.; Pennerstorfer, J.; Matthews, B. Acute drought is an important driver of bark beetle infestation in Austrian Norway Spruce stands. Front. For. Glob. Change 2019, 2, 39. [Google Scholar] [CrossRef] [Green Version]
- Mauser, H. Key Questions on Forests in the EU; Knowledge to Action 4; European Forest Institute: Joensuu, Finland, 2021. [Google Scholar]
- Hubau, W.; Lewis, S.L.; Phillips, O.L.; Affum-Baffoe, K.; Beeckman, H.; Cuní-Sanchez, A.; Daniels, A.K.; Ewango, C.E.N.; Fauset, S.; Mukinzi, J.M.; et al. Asynchronous carbon sink saturation in African and Amazonian tropical forests. Nature 2020, 579, 80–87. [Google Scholar] [CrossRef] [Green Version]
- Larjavaara, M.; Lu, X.; Chen, X.; Vastaranta, M. Impact of rising temperatures on the biomass of humid old-growth forests of the world. Carbon Balance Manag. 2021, 16, 31. [Google Scholar] [CrossRef]
- Grace, J.; Berninger, F.; Nagy, L. Impacts of climate change on the tree line. Ann. Bot. 2002, 90, 537–544. [Google Scholar] [CrossRef] [Green Version]
Publisher’s Note: MDPI stays neutral with regard to jurisdictional claims in published maps and institutional affiliations. |
© 2022 by the authors. Licensee MDPI, Basel, Switzerland. This article is an open access article distributed under the terms and conditions of the Creative Commons Attribution (CC BY) license (https://creativecommons.org/licenses/by/4.0/).