
Steep Slope Harvest System Models for Small to Large Trees


Abstract
:1. Introduction
2. Materials and Methods
2.1. Harvest Equipment Productivity Models
2.2. Equipment Operating Cost and Harvest Contracting Business Models
2.3. Harvest System Modeling and Uncertainty Estimation
2.4. Growth and Yield Modeling, Taper Equation Interactions, and Thinning Intensities
3. Results
4. Discussions
5. Conclusions
Supplementary Materials
Author Contributions
Funding
Data Availability Statement
Acknowledgments
Conflicts of Interest
References
- Parkatti, V.-P.; Tahvonen, O. Optimizing continuous cover and rotation forestry in mixed-species boreal forests. Can. J. For. Res. 2020, 50, 1138–1151. [Google Scholar] [CrossRef]
- Fransson, P.; Franklin, O.; Lindroos, O.; Nilsson, U.; Brännström, Å. A simulation-based approach to a near-optimal thinning strategy: Allowing harvesting times to be determined for individual trees. Can. J. For. Res. 2019, 320–331. [Google Scholar] [CrossRef]
- Visser, R.; Harrill, H. Cable Yarding in North America and New Zealand: A Review of Developments and Practices. Croat. J. For. Eng. 2017, 38, 209–217. [Google Scholar]
- Lindroos, O.; Cavalli, R. Cable yarding productivity models: A systematic review over the period 2000–2011. Int. J. For. Eng. 2016, 27, 79–94. [Google Scholar] [CrossRef]
- Hartley, D.S.; Han, H.-S. Effects of Alternative Silvicultural Treatments on Cable Harvesting Productivity and Cost in Western Washington. West. J. Appl. For. 2007, 22, 204–212. [Google Scholar] [CrossRef] [Green Version]
- Visser, R.; Stampfer, K. Expanding Ground-based Harvesting onto Steep Terrain: A Review. Croat. J. For. Eng. 2015, 36, 321–331. [Google Scholar]
- Holzleitner, F.; Kastner, M.; Stampfer, K.; Höller, N.; Kanzian, C. Monitoring Cable Tensile Forces of Winch-Assist Harvester and Forwarder Operations in Steep Terrain. Forests 2018, 9, 53. [Google Scholar] [CrossRef] [Green Version]
- Amishev, D.; Hunt, J.; Boswell, B. Best Management Practices for Winch-Assist Equipment, version 2.0.; FPInnovations: Pointe-Claire, QC, Canada, 2019; Available online: https://www2.bcforestsafe.org/node/3452 (accessed on 10 February 2022).
- Ponsse Solutions for Steep Slope Harvesting. Available online: https://www.youtube.com/watch?v=jz5nOIA-aSQ (accessed on 26 August 2021).
- ClimbMAX Steep Slope Harvester. Available online: http://www.climbmax.co.nz/ (accessed on 27 September 2021).
- Remote Operated Bulldozer for Steep Slope Felling. Available online: https://remotebulldozer.com/ (accessed on 27 September 2021).
- OR-OSHA Administrative Order 5-2003. OAR 437-007–0935. 2003. Available online: https://osha.oregon.gov/rules/final/Pages/division-7.aspx (accessed on 27 September 2021).
- Naillon, T.; Rappin, C. Best Management and Operating Practices for Steep Slope Machine Logging. Safety and Health Assessment and Research for Prevention (SHARP) Program; Washington State Department of Labor & Industries: Olympia, WA, USA, 2019. Available online: https://www.lni.wa.gov/safety-health/safety-research/ongoing-projects/logging (accessed on 10 February 2022).
- Bell, D.M.; Acker, S.A.; Gregory, M.J.; Davis, R.J.; Garcia, B.A. Quantifying regional trends in large live tree and snag availability in support of forest management. For. Ecol. Manag. 2021, 479, 118554. [Google Scholar] [CrossRef]
- Puettmann, K.; Ares, A.; Burton, J.; Dodson, E. Forest Restoration Using Variable Density Thinning: Lessons from Douglas-Fir Stands in Western Oregon. Forests 2016, 7, 310. [Google Scholar] [CrossRef] [Green Version]
- Barbour, R.J.; Parry, D.L. Log and Lumber Grades as Indicators of Wood Quality in 20- to 100-Year-old Douglas-Fir Trees from Thinned and Unthinned Stands; U.S. Department of Agriculture, Forest Service, Pacific Northwest Research Station: Portland, OR, USA, 2001. Available online: https://www.fs.usda.gov/treesearch/pubs/2921 (accessed on 10 February 2022).
- Ekholm, T. Optimal forest rotation under carbon pricing and forest damage risk. For. Policy Econ. 2020, 115, 102131. [Google Scholar] [CrossRef] [Green Version]
- Malcolm Knapp Research Forest. Influence of Spacing on Growth of Douglas-Fir, Western hemlock, and Western Red Cedar in Plantations, [dataset] RP 1957-05; University of British Columbia: Vancouver, BC, Canada, 2021; Available online: https://www.mkrf.forestry.ubc.ca/research/research-projects-database/ (accessed on 10 February 2022).
- Kline, J.D.; Harmon, M.E.; Spies, T.A.; Morzillo, A.T.; Pabst, R.J.; McComb, B.C.; Schnekenburger, F.; Olsen, K.A.; Csuti, B.; Vogeler, J.C. Evaluating carbon storage, timber harvest, and habitat possibilities for a Western Cascades (USA) forest landscape. Ecol. Appl. 2016, 26, 2044–2059. [Google Scholar] [CrossRef]
- Diaz, D.; Loreno, S.; Ettl, G.; Davies, B. Tradeoffs in Timber, Carbon, and Cash Flow under Alternative Management Systems for Douglas-Fir in the Pacific Northwest. Forests 2018, 9, 447. [Google Scholar] [CrossRef] [Green Version]
- Oregon State University College of Forestry. OSU Elliott State Research Forest Proposal; Oregon State University College of Forestry: Corvallis, OR, USA, 2021; Available online: https://www.forestry.oregonstate.edu/elliott-state-forest/ (accessed on 27 September 2021).
- Acuna, M.; Skinnell, J.; Evanson, T.; Mitchell, R. Bunching with a Self-levelling Feller-Buncher on Steep Terrain for Efficient Yarder Extraction. Croat. J. For. Eng. 2011, 23, 521–531. [Google Scholar]
- Amishev, D.; Evanson, T. Innovative methods for steep terrain harvesting. In Proceedings of the 43th International Symposium on Forestry Mechanisation: “Forest Engineering: Meeting the Needs of the Society and the Environment”, Padova, Italy, 11–14 July 2010. [Google Scholar]
- Dyson, P.; Boswell, B. Winch-Assisted Feller-Buncher Equipped with a Continuous-Rotation Disc Saw: Short-Term Productivity Assessment; FPInnovations: Pointe-Claire, QC, Canada, 2016; Available online: https://library.fpinnovations.ca/en/permalink/fpipub40268 (accessed on 27 September 2021).
- Wang, J.; Long, C.; McNeel, J. Production and cost analysis of a feller-buncher and grapple skidder in central Appalachian hardwood forests. For. Prod. J. Madison 2004, 54, 159–167. [Google Scholar]
- Eriksson, M.; Lindroos, O. Productivity of harvesters and forwarders in CTL operations in northern Sweden based on large follow-up datasets. Int. J. For. Eng. 2014, 25, 179–200. [Google Scholar] [CrossRef]
- Heisl, P. Productivity Standards for Whole-Tree and Cut-To-Length Harvesting Systems in Maine. Master’s Thesis, University of Maine, Orono, ME, USA, 2013. [Google Scholar]
- Kärhä, K.; Rönkkö, E.; Gumse, S.-I. Productivity and Cutting Costs of Thinning Harvesters. Int. J. For. Eng. 2004, 15, 43–56. [Google Scholar] [CrossRef]
- Nurminen, T.; Korpunen, H.; Uusitalo, J. Time consumption analysis of the mechanized cut-to-length harvesting system. Silva Fenn. 2006, 40, 346. [Google Scholar] [CrossRef] [Green Version]
- Visser, R.; Spinelli, R. Determining the shape of the productivity function for mechanized felling and felling-processing. J. For. Res. 2012, 17, 397–402. [Google Scholar] [CrossRef]
- Donald, K.; Boswell, B.; Amishev, D.; Hunt, J. Winch-Assist Harvester: Best Practices; FPInnovations: Pointe-Claire, QC, Canada, 2018; Available online: https://library.fpinnovations.ca/en/permalink/fpipub52594 (accessed on 27 September 2021).
- Drews, E.S.; Hartsough, B.R.; Doyal, J.A.; Kellogg, L.D. Harvester-Forwarder and Harvester-Yarder Systems for Fuel Reduction Treatments. J. For. Eng. 2001, 12, 81–91. [Google Scholar] [CrossRef]
- Dyson, P.; Strimbu, V. Assessments of a Winch-Assisted John Deere Harvester and Forwarder; FPInnovations: Pointe-Claire, QC, Canada, 2017; Available online: https://library.fpinnovations.ca/en/permalink/fpipub49568 (accessed on 27 September 2021).
- Green, P.Q.; Chung, W.; Leshchinsky, B.; Belart, F.; Sessions, J.; Fitzgerald, S.A.; Wimer, J.A.; Cushing, T.; Garland, J.J. Insight into the Productivity, Cost and Soil Impacts of Cable-assisted Harvester-forwarder Thinning in Western Oregon. For. Sci. 2020, 66, 82–96. [Google Scholar] [CrossRef]
- Holzleitner, F.; Stampfer, K.; Visser, R. Utilization Rates and Cost Factors in Timber Harvesting Based on Long-term Machine Data. Croat. J. For. Eng. 2011, 32, 501–508. Available online: https://hrcak.srce.hr/72653 (accessed on 10 February 2022).
- Petitmermet, J.; Sessions, J.; Bailey, J.; Zamora-Cristales, R. Cost and Productivity of Tethered Cut-to-Length Systems in a Dry-Forest Fuel-Reduction Treatment: A Case Study. For. Sci. 2019, 65, 581–592. [Google Scholar] [CrossRef]
- Strandgard, M.; Alam, M.; Mitchell, R. Impact of Slope on Productivity of a Self-levelling Processor. Croat. J. For. Eng. 2014, 32, 193–200. [Google Scholar]
- Ghaffariyan, M.R.; Acuna, M.; Brown, M.W. Machine productivity evaluation for harvesters and forwarders in thinning operations in Australia. Silva Balc. 2019, 20, 13–25. [Google Scholar] [CrossRef]
- Mattioda, M. CTL Cable-assisted Harvesting. In Proceedings of the 2020 Spring Conference and Workshop; California Licensed Foresters Association, Anderson, CA, USA, 6–7 March 2020. [Google Scholar]
- Uffelman, S. The Impact of Understory Vegetation on the Productivity and Costs of Cut-to-length Thinning Harvest Systems in the Pacific Northwest. Master’s Thesis, Oregon State University, Corvallis, OR, USA, 2019. [Google Scholar]
- Renzie, C.; Han, H.-S. Harvesting Productivity and Cost of Clearcut and Partial Cut in Interior British Columbia, Canada. J. For. Environ. Sci. 2008, 24, 1–14. Available online: https://www.koreascience.or.kr/article/JAKO200822350101567.page (accessed on 27 September 2021).
- Jourgholami, M.; Majnounian, B.; Zargham, N. Performance, Capability and Costs of Motor-Manual Tree Felling in Hyrcanian Hardwood Forest. Croat. J. For. Eng. 2013, 34, 283–293. Available online: https://hrcak.srce.hr/116784 (accessed on 27 September 2021).
- Jukes, W.D. Estimating Harvesting Productivity and Cost on Second-Growth Coastal Sites in British Columbia. Master’s Thesis, University of British Columbia, Vancouver, BC, Canada, 1995. [Google Scholar]
- Gagliardi, K.; Ackerman, S.; Ackerman, P. Multi-Product Forwarder-Based Timber Extraction: Time Consumption and Productivity Analysis of Two Forwarder Models Over Multiple Products and Extraction Distances. Croat. J. For. Eng. 2020, 41, 231–242. [Google Scholar] [CrossRef] [Green Version]
- Adebayo, A.B.; Han, H.-S.; Johnson, L. Productivity and cost of cut-to-length and whole-tree harvesting in a mixed-conifer stand. For. Prod. J. 2007, 57, 59–69. [Google Scholar]
- Ghaffariyan, M.R.; Sessions, J.; Brown, M. Machine productivity and residual harvesting residues associated with a cut-to-length harvest system in southern Tasmania. South. For. J. For. Sci. 2012, 74, 229–235. [Google Scholar] [CrossRef]
- Hildt, E.; Leszczuk, A.; Mac Donagh, P.; Schlichter, T. Time Consumption Analysis of Forwarder Activities in Thinning. Croat. J. For. Eng. 2020, 41, 13–24. [Google Scholar] [CrossRef]
- Strandgard, M.; Mitchell, R.; Acuna, M. Time consumption and productivity of a forwarder operating on a slope in a cut-to-length harvest system in a Pinus radiata D. Don pine plantation. J. For. Sci. 2017, 63, 324–330. [Google Scholar] [CrossRef] [Green Version]
- Akay, A.E.; Erdas, O.; Sessions, J. Determining Productivity of Mechanized Harvesting Machines. J. Appl. Sci. 2003, 4, 100–105. [Google Scholar] [CrossRef]
- Donald, K.; Boswell, B.; Amishev, D.; Hunt, J. Winch-Assist Forwarder: Best Practices; FPInnovations: Pointe-Claire, QC, Canada, 2018; Available online: https://library.fpinnovations.ca/en/permalink/fpipub52697 (accessed on 27 September 2021).
- Engelbrecht, R.; McEwan, A.; Spinelli, R. A Robust Productivity Model for Grapple Yarding in Fast-Growing Tree Plantations. Forests 2017, 8, 396. [Google Scholar] [CrossRef] [Green Version]
- Howard, A.F.; Rutherford, D.; Young, G.G. The Productivity and Cost of Partial and Clear Cutting with Two Cable Yarding Systems in Second-Growth Forests of Coastal British Columbia; Natural Resources Canada: Victoria, BC, Canada, 1996. Available online: https://scf.rncan.gc.ca/publications?id=4331 (accessed on 27 September 2021).
- Spinelli, R.; Marchi, E.; Visser, R.; Harrill, H.; Gallo, R.; Cambi, M.; Neri, F.; Lombardini, C.; Magagnotti, N. The effect of carriage type on yarding productivity and cost. Int. J. For. Eng. 2017, 28, 34–41. [Google Scholar] [CrossRef]
- Medved, M.; Olgris, N.; Klun, J.; Košir, B.; Vončina, R. Koledarski čas in učinki dela z žičnimi napravami Syncrofalke na Tolminskem. Zb. Gozdarstva Lesar. 2005, 77, 113–142. Available online: https://www.forestry.bf.uni-lj.si/kazalo77.htm (accessed on 8 August 2021).
- Stampfer, K.; Visser, R.; Kanzian, C. Cable Corridor Installation Times for European Yarders. Int. J. For. Eng. 2006, 17, 71–77. [Google Scholar] [CrossRef]
- Kellogg, L.D.; Miller, M.; Olsen, E. Skyline Thinning Production and Costs: Experience from the Willamette Young Stand Projects; Oregon State University: Corvallis, OR, USA, 1999; Available online: https://ir.library.oregonstate.edu/concern/technical_reports/6q182q69g (accessed on 23 August 2021).
- Tolan, A.; Visser, R. The effect of the number of log sorts on mechanized log processing productivity and value recovery. Int. J. For. Eng. 2015, 26, 36–47. [Google Scholar] [CrossRef]
- Mousavi, R.; Naghdi, R. Time consumption and productivity analysis of timber trucking using two kinds of trucks in northern Iran. J. For. Sci. 2013, 59, 211–221. [Google Scholar] [CrossRef] [Green Version]
- Mason, C.L.; Casavant, K.L.; Lippke, B.R.; Nguyen, D.K.; Jessup, E. The Washington Log Trucking Industry: Costs and Safety Analysis; The Rural Technology Initiative and the Transportation Research Group, Washington State University: Seattle, WA, USA, 2008; Available online: https://www.ruraltech.org/pubs/reports/2008/log_trucks/ (accessed on 30 August 2021).
- Han, S.-K.; Murphy, G. Trucking Productivity and Costing Model for Transportation of Recovered Wood Waste in Oregon. For. Prod. J. 2011, 61, 552–560. [Google Scholar] [CrossRef]
- Ghaffariyan, M.R. Reviewing productivity studies of skidders working in coniferous forests and plantations. Silva Balc. 2020, 21, 83–98. [Google Scholar] [CrossRef]
- Strimbu, V.; Boswell, B. Adverse Skidding Using a Tigercat 635E Assisted by a T-Winch 10.1; FPInnovations: Pointe-Claire, QC, Canada, 2018; Available online: https://library.fpinnovations.ca/en/permalink/fpipub49844 (accessed on 27 September 2021).
- Proto, A.R.; Macrì, G.; Visser, R.; Harrill, H.; Russo, D.; Zimbalatti, G. Factors affecting forwarder productivity. Eur. J. For. Res. 2018, 137, 143–151. [Google Scholar] [CrossRef]
- Miles, P.D.; Smith, B.W. Specific Gravity and Other Properties of Wood and Bark for 156 Tree Species Found in North America; U.S. Department of Agriculture, Forest Service, Northern Research Station: Newtown Square, PA, USA, 2009. Available online: https://www.fs.usda.gov/treesearch/pubs/34185 (accessed on 30 August 2021).
- Murphy, G.; Acuna, M. Effect of harvesting season, system and equipment on in-forest Pinus radiata bark removal in Australia and New Zealand. Int. J. For. Eng. 2017, 28, 10–17. [Google Scholar] [CrossRef]
- Miyata, E.S. Determining Fixed and Operating Costs of Logging Equipment; U.S. Department of Agriculture, Forest Service, North Central Forest Experiment Station: St. Paul, MN, USA, 1980. Available online: https://www.fs.usda.gov/treesearch/pubs/10120 (accessed on 27 September 2021).
- Uusitalo, L.; Lehikoinen, A.; Helle, I.; Myrberg, K. An overview of methods to evaluate uncertainty of deterministic models in decision support. Environ. Model. Softw. 2015, 63, 24–31. [Google Scholar] [CrossRef] [Green Version]
- Puy, A.; Lo Piano, S.; Saltelli, A.; Levin, S.A. Sensobol: Computation of Variance-Based Sensitivity Indices. arXiv 2021, arXiv:2101.10103. [Google Scholar]
- Puy, A.; Becker, W.; Lo Piano, S.; Saltelli, A. A comprehensive comparison of total-order estimators for global sensitivity analysis. Int. J. Uncertainity 2021, 12, 1–18. [Google Scholar] [CrossRef]
- Hann, D.W.; Marshall, D.D.; Hanus, M.L. Equations for Predicting Height-to-Crown-Base, 5-Year Diameter-Growth Rate, 5-Year Height-Growth Rate, 5-Year Mortality Rate, and Maximum Size-Density Trajectory for Douglas-fir and Western Hemlock in the Coastal Region of the Pacific Northwest; Research Contribution 40, Forest Research Laboratory Oregon State University: Corvallis, OR, USA, 2003; Available online: https://ir.library.oregonstate.edu/concern/technical_reports/jd472 × 893 (accessed on 22 December 2021).
- Weiskittel, A.R.; Hann, D.W.; Kershaw, J.A.; Vanclay, J.K. Forest Growth and Yield Modeling; Wiley-Blackwell: Chichester, UK, 2011; ISBN 978-0-470-66500-8. [Google Scholar]
- Poudel, K.P.; Temesgen, H.; Gray, A.N. Estimating upper stem diameters and volume of Douglas-fir and Western hemlock trees in the Pacific northwest. For. Ecosyst. 2018, 5, 16. [Google Scholar] [CrossRef] [Green Version]
- Maguire, D.A.; Hann, D.W. Bark Thickness and Bark Volume in Southwestern Oregon Douglas-Fir. West. J. Appl. For. 1990, 5, 5–8. [Google Scholar] [CrossRef]
- Murphy, G.; Pilkerton, S.J. Seasonal Impacts on Bark Loss for Douglas-fir and Ponderosa Pine Harvested on the Pacific Northwest Coast of the USA. Int. J. For. Eng. 2011, 22, 35–41. [Google Scholar] [CrossRef]
- Chang, S.J. Twenty one years after the publication of the generalized Faustmann formula. For. Policy Econ. 2020, 118, 102238. [Google Scholar] [CrossRef]
- Department of Natural Resources. WA DNR Log Prices; Washington Department of Natural Resources: Washington, DC, USA, 2021. Available online: https://www.dnr.wa.gov/programs-and-services/product-sales-and-leasing/timber-sales/timber-sale-querylog-prices (accessed on 13 January 2022).
- Nalle, D.J.; Montgomery, C.A.; Arthur, J.L.; Polasky, S.; Schumaker, N.H. Modeling joint production of wildlife and timber. J. Environ. Econ. Manag. 2004, 48, 997–1017. [Google Scholar] [CrossRef]
- Baek, K. Productivity and Cost of a Cut-to-Length Commercial Thinning Operation in a Northern California Redwood Forest. Master’s Thesis, Humboldt State University, Arcata, CA, USA, 2018. [Google Scholar]
- Fonseca, M. Measurement of Roundwood: Methodologies and Conversion Ratios; United Nations Economic Commission for Europe, Trade and Timber Branch: Geneva, Switzerland, 2005; ISBN 978-0-85199-079-8. [Google Scholar]
- EIA. Weekly Retail Gasoline and Diesel Prices and Refiner Petroleum Product Prices by Sales Type; [dataset]; United States Energy Information Administration: Washington, DC, USA, 2021. Available online: https://www.eia.gov/petroleum/ (accessed on 27 September 2021).
- BLS. PPI Commodity Data for Final Demand, Not Seasonally Adjusted; Bureau of Labor Statistics: Washington, DC, USA, 2021. Available online: https://data.bls.gov/cgi-bin/surveymost?bls (accessed on 8 November 2021).
- Spinelli, R.; Magagnotti, N.; Picchi, G. Annual use, economic life and residual value of cut-to-length harvesting machines. J. For. Econ. 2011, 17, 378–387. [Google Scholar] [CrossRef]
- Spinelli, R.; Visser, R. Analyzing and Estimating Delays in Harvester Operations. Int. J. For. Eng. 2008, 19, 36–41. [Google Scholar] [CrossRef]
- Sessions, J.; Berry, M.; Sup-Han, H. Machine Rate Estimates and Equipment Utilization: A Modified Approach. Croat. J. For. Eng. 2021, 42, 437–443. [Google Scholar] [CrossRef]


| Machine Type | Cycle Type | Winch-Assist | Cycle Description(s) | Model Sources | Slopes Considered (%) | Additional Sources |
|---|---|---|---|---|---|---|
| feller-buncher | stemwise | yes | move to, fell, and bunch one tree | [22] | 32–47 | [23,24,25] |
| harvester | stemwise | yes | move to tree, fell, buck, and bunch all logs | [26,27,28,29,30] | likely <30 | [31,32,33,34,35,36,37,38,39,40] |
| chainsaw | stemwise | no | move to tree, variable cutting from bucking only first log to felling and bucking all logs | [41,42] | 0–130 | [43] |
| forwarder | roundtrip | yes | load one bunkload of logs in unit and unload the bunk to roadside sort piles or to a truck, potentially also loading piled logs onto truck | [26,29,44,45,46,47,48] | very likely ≤45 | [32,33,34,35,36,38,39,40,49,50] |
| yarder | roundtrip | no | outhaul carriage, grapple or choke payload of trees and logs, inhaul carriage, drop payload on road or landing chute | [4,5,51,52,53] | typically <80 | [35,54,55,56] |
| processor | stemwise | no | (1) buck one tree and bunch logs (2) swing yarded log to bunch | [46] | <10 | [57] |
| loader | stemwise | no | (1) pile one bunch of logs from processor (2) load one grapple onto truck | none identified | [45,49] | |
| log truck | roundtrip | no | drive to unit, load logs into one or more bunks, drive to mill, unload logs | [58] | unclear but >11 | [59,60] |
| Summary Statistic | Douglas-Fir | Western Hemlock | Hemlock Increase in Mean (%) |
|---|---|---|---|
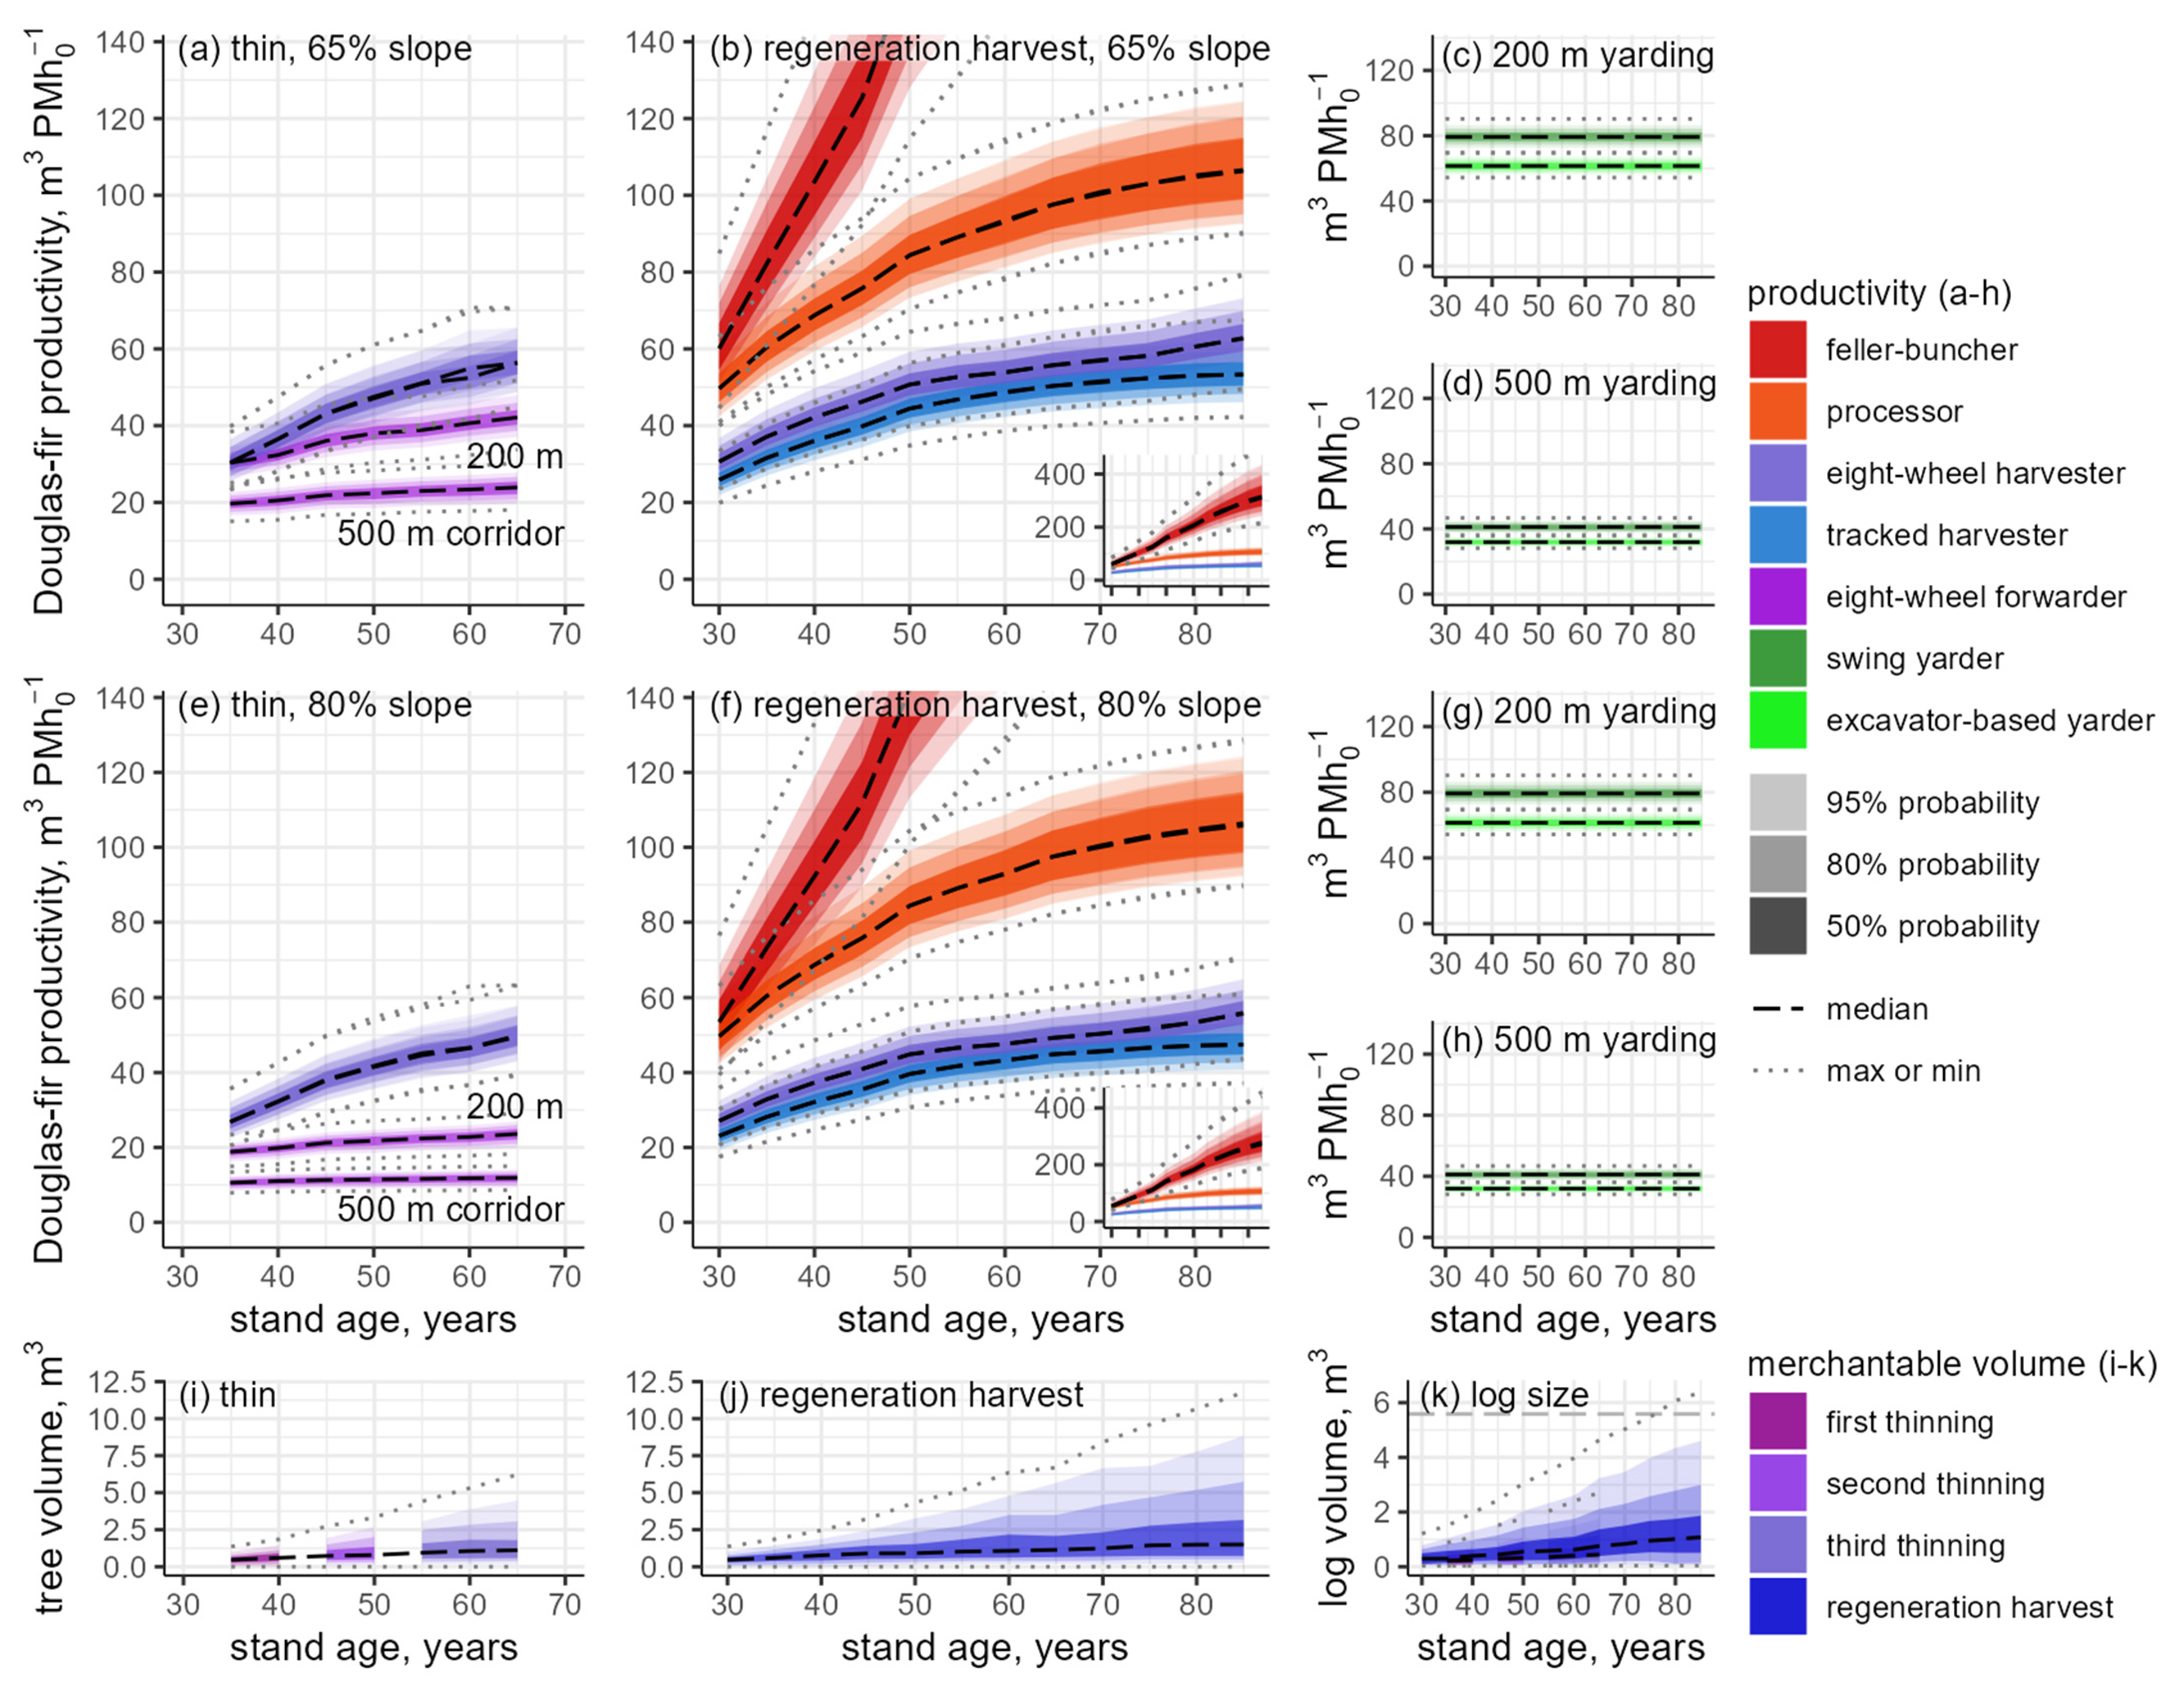
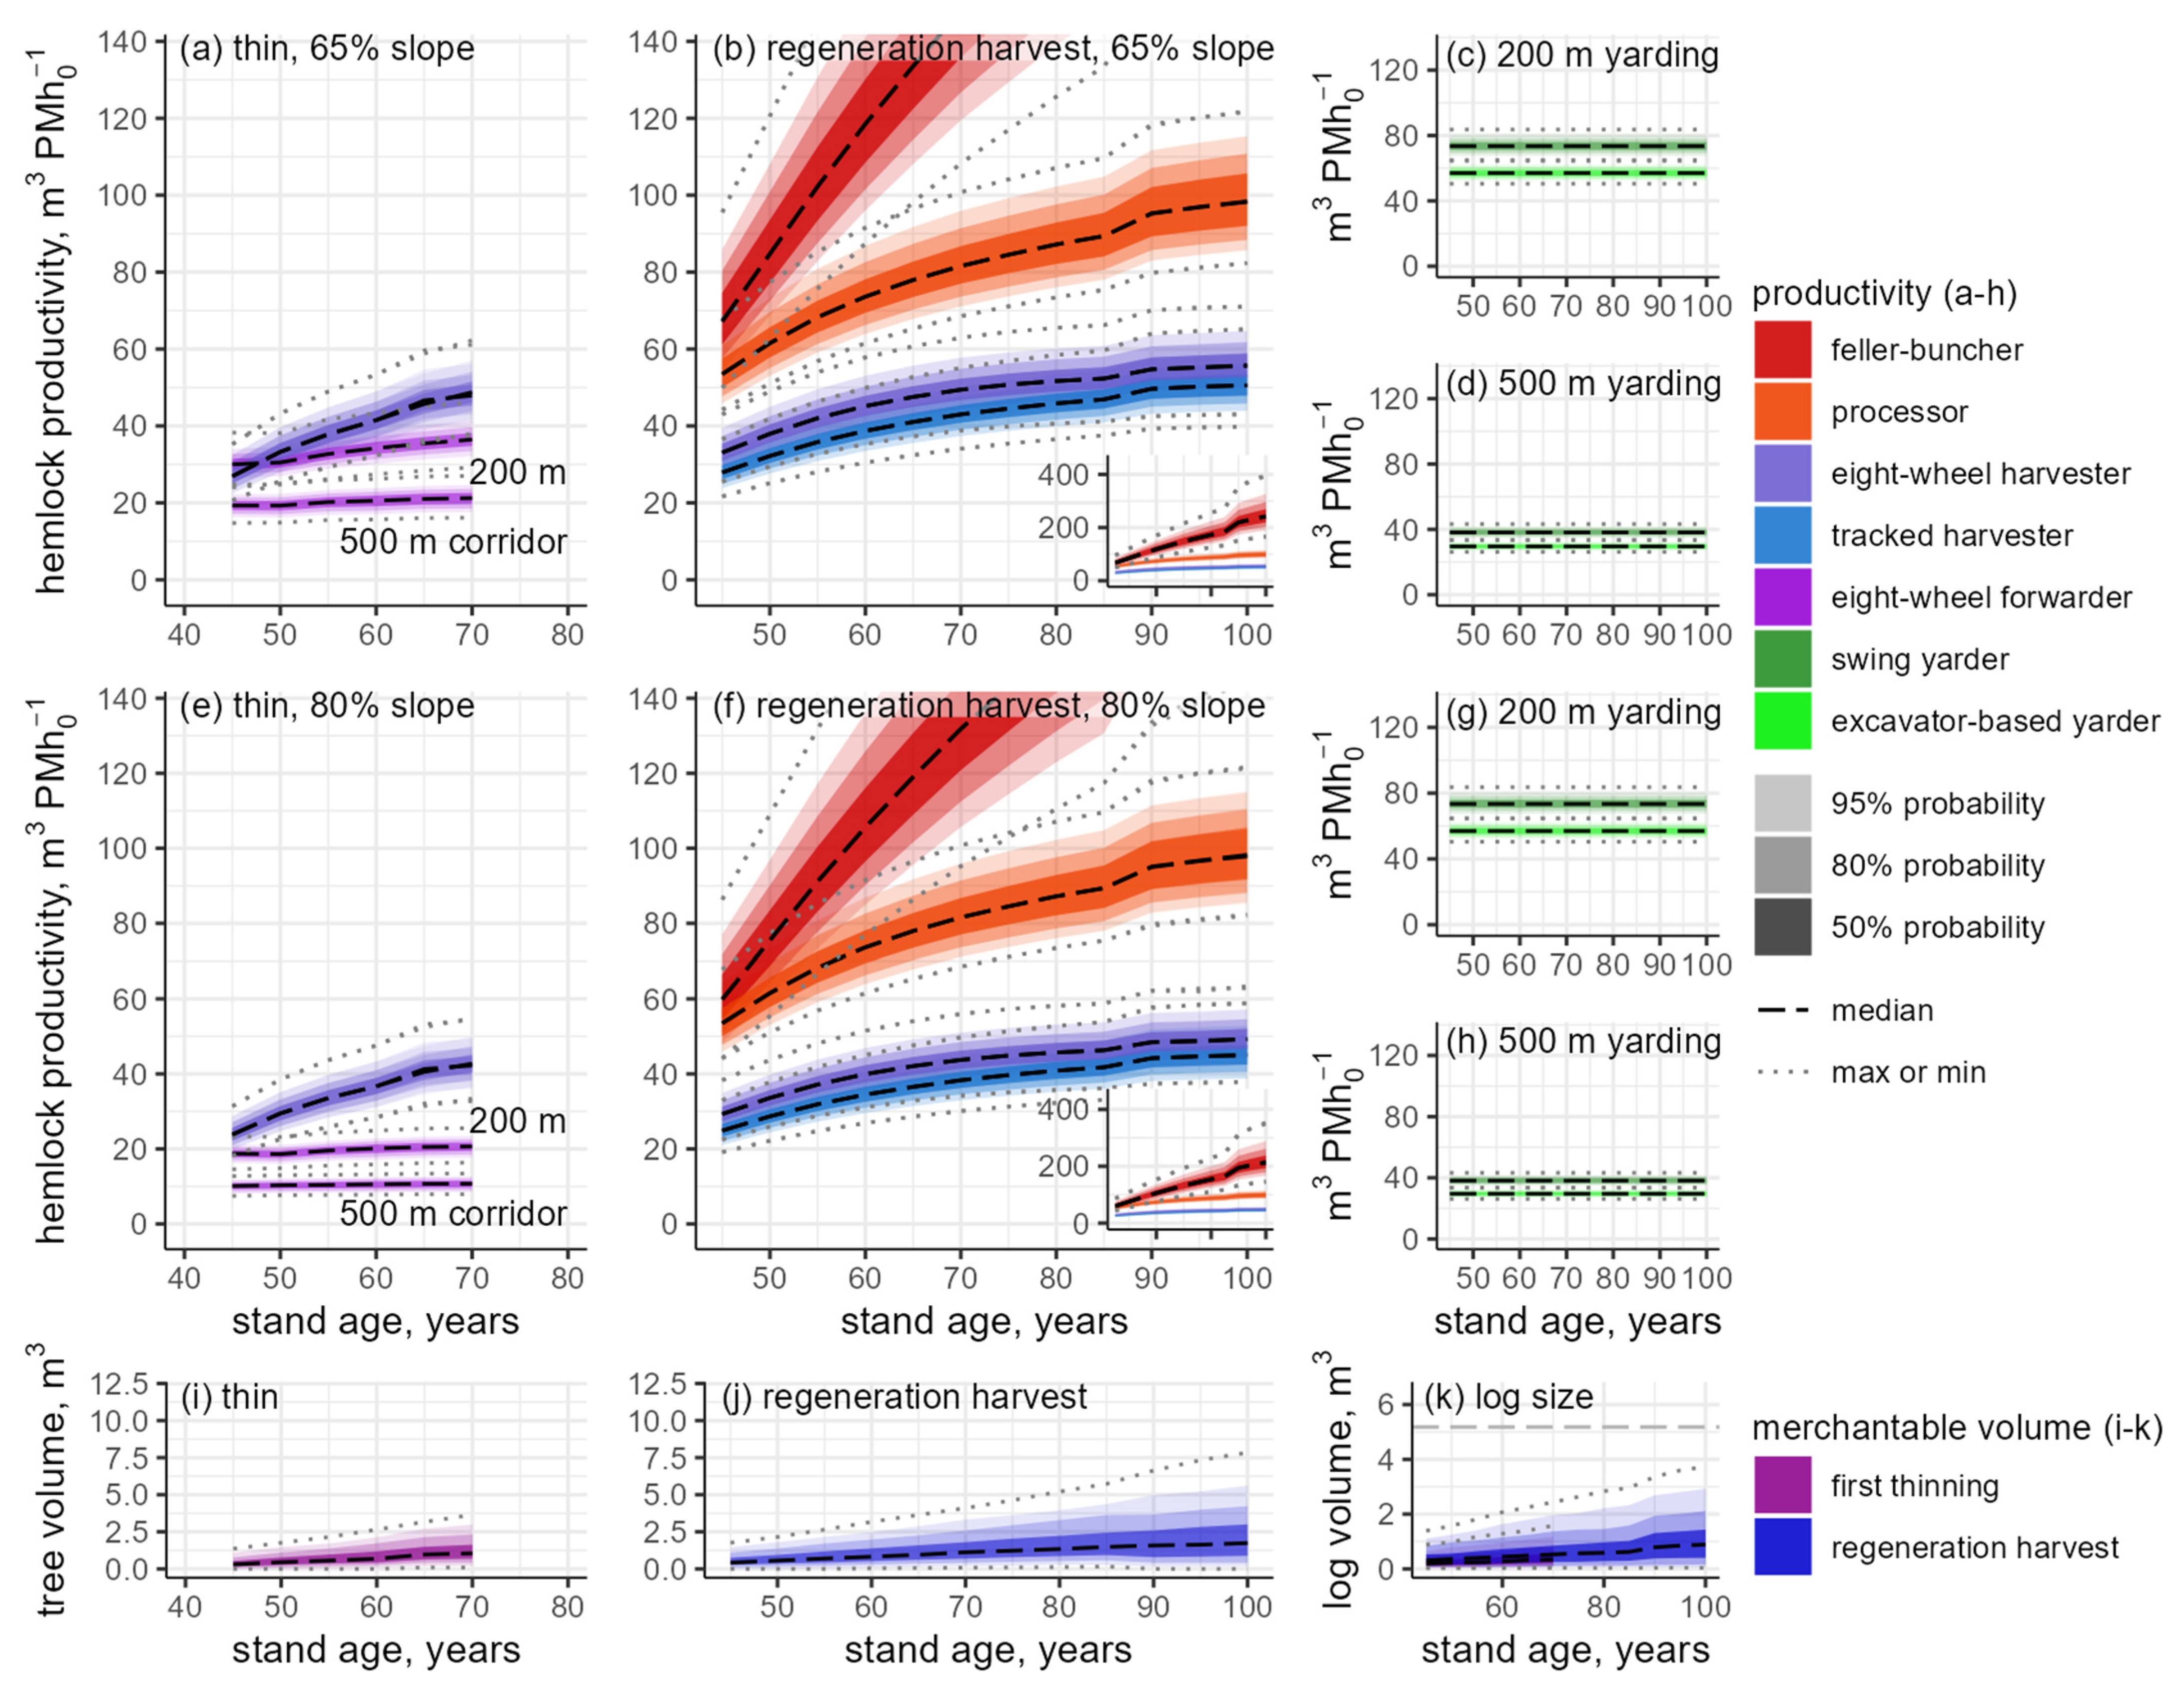
| thinning time (total PMh0 ha −1) | 36 (26–53) | 38 (21–55) | 5.1 |
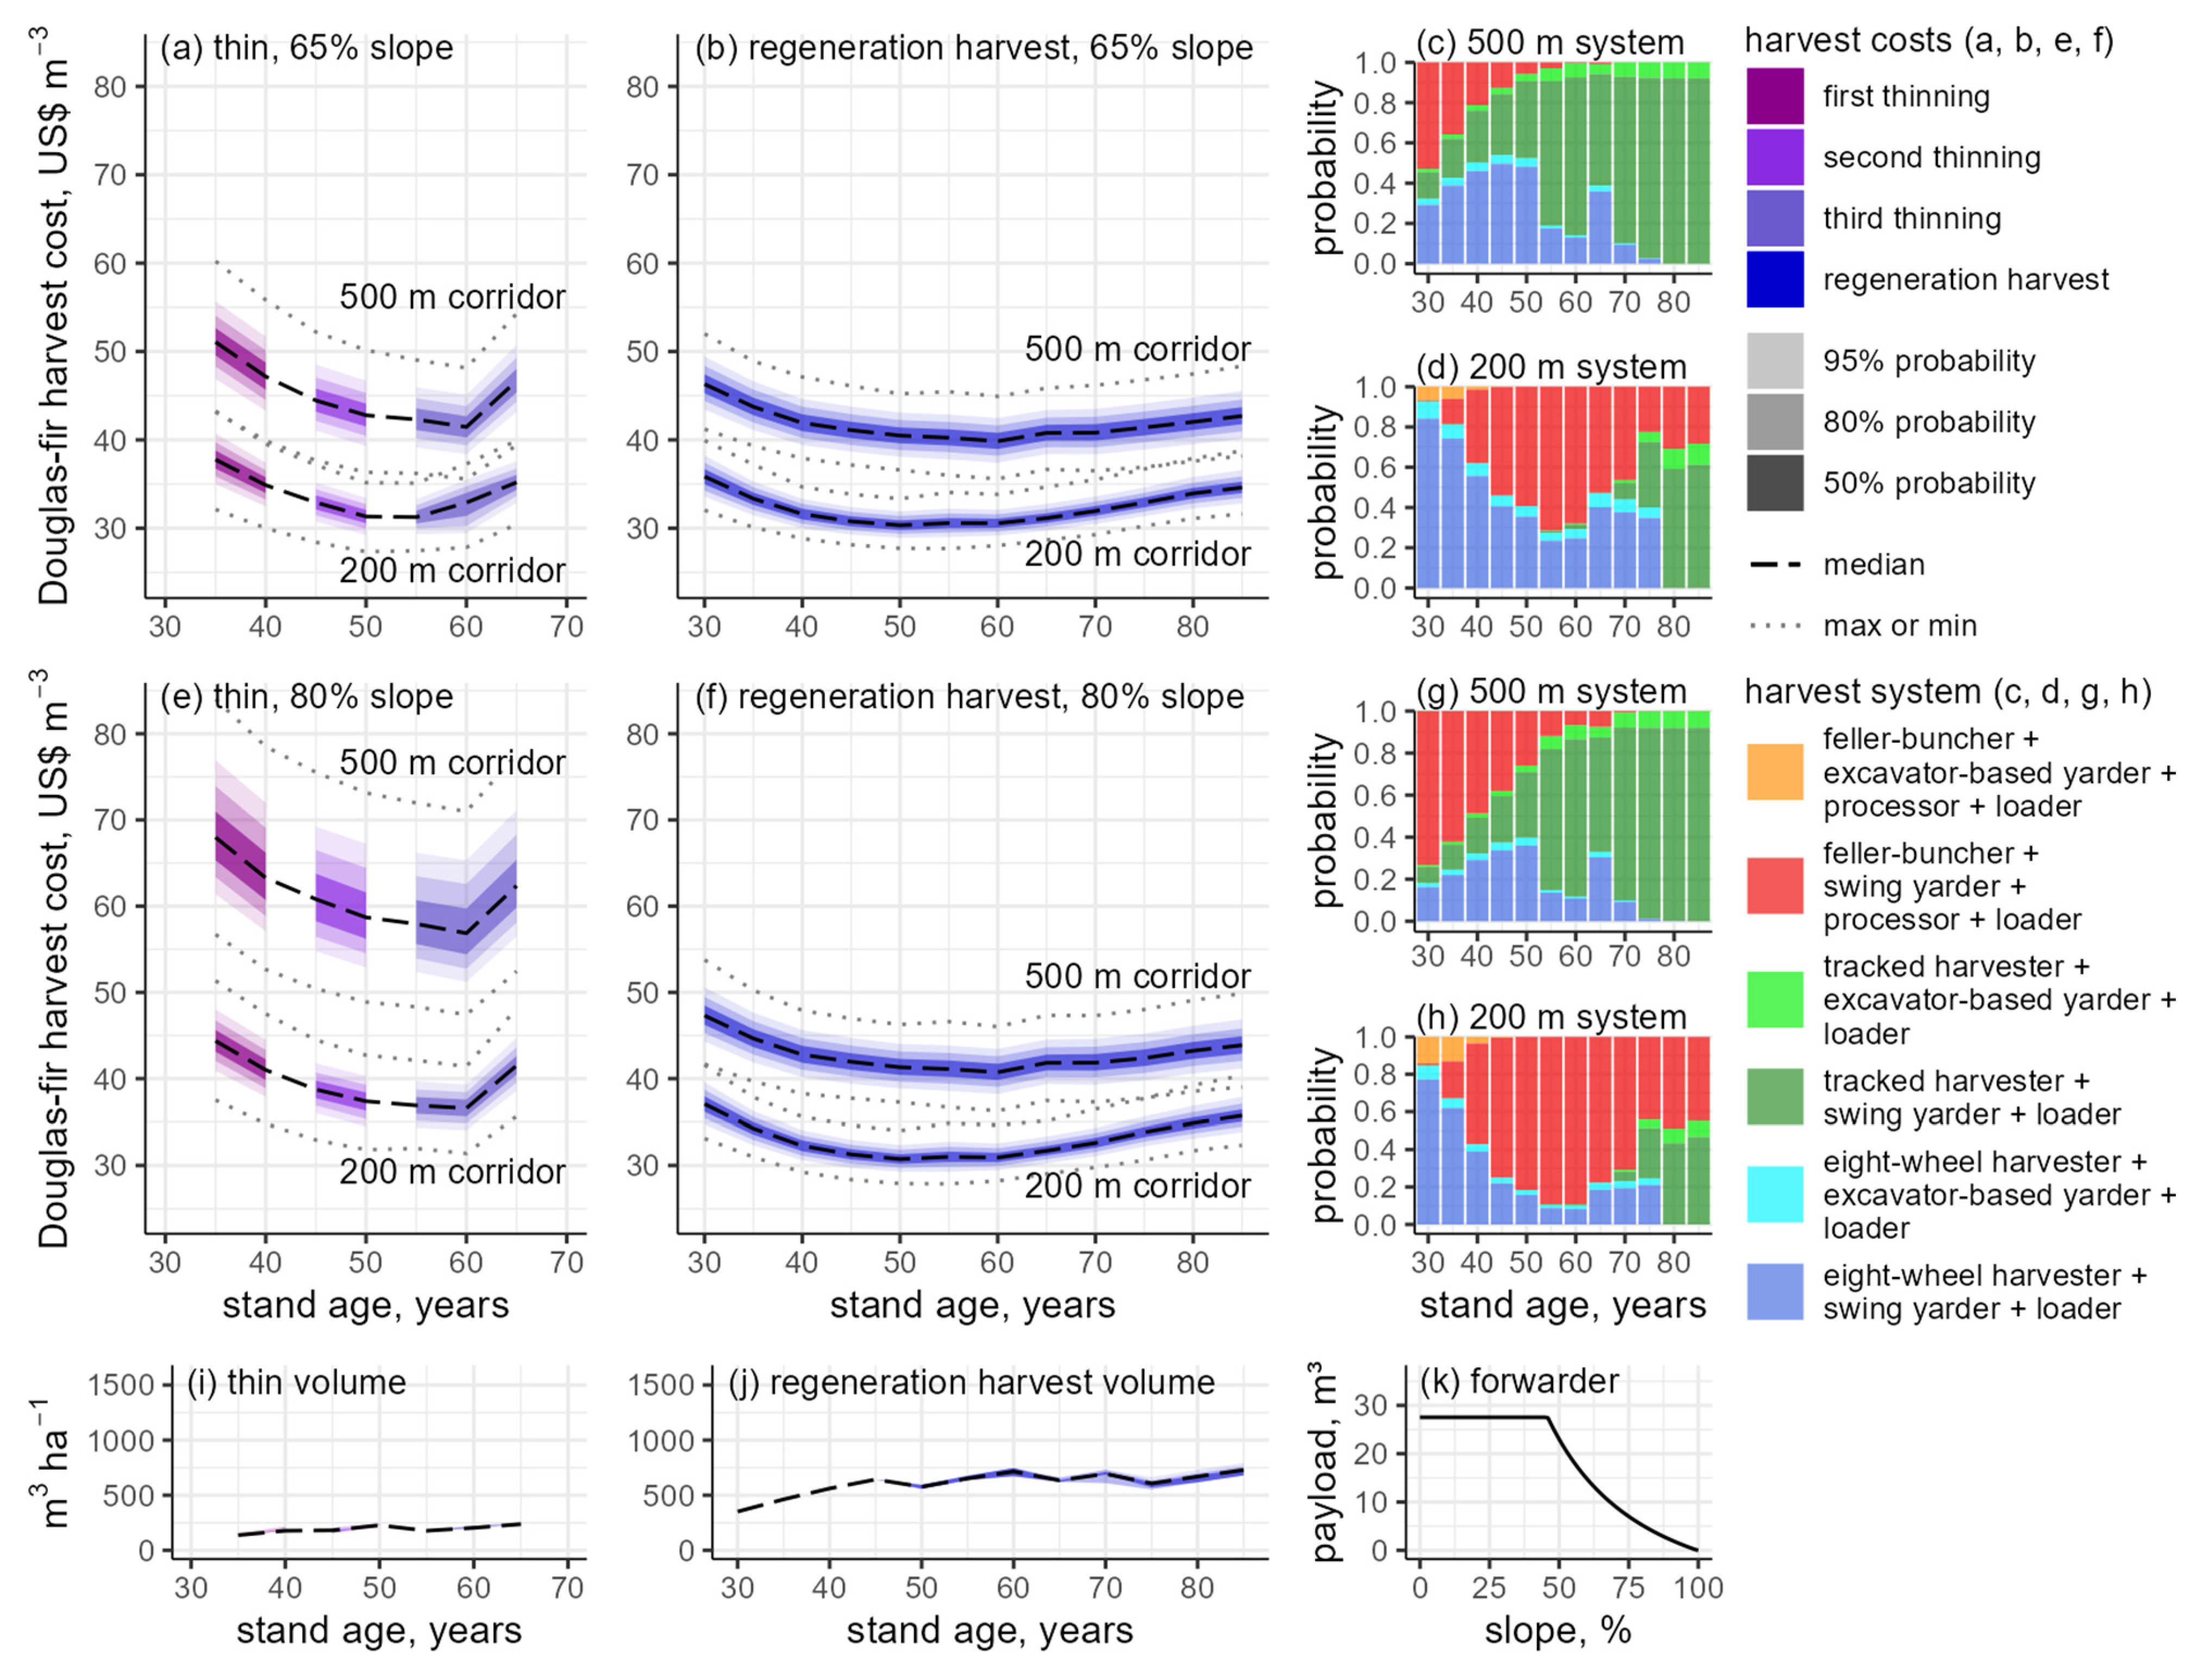
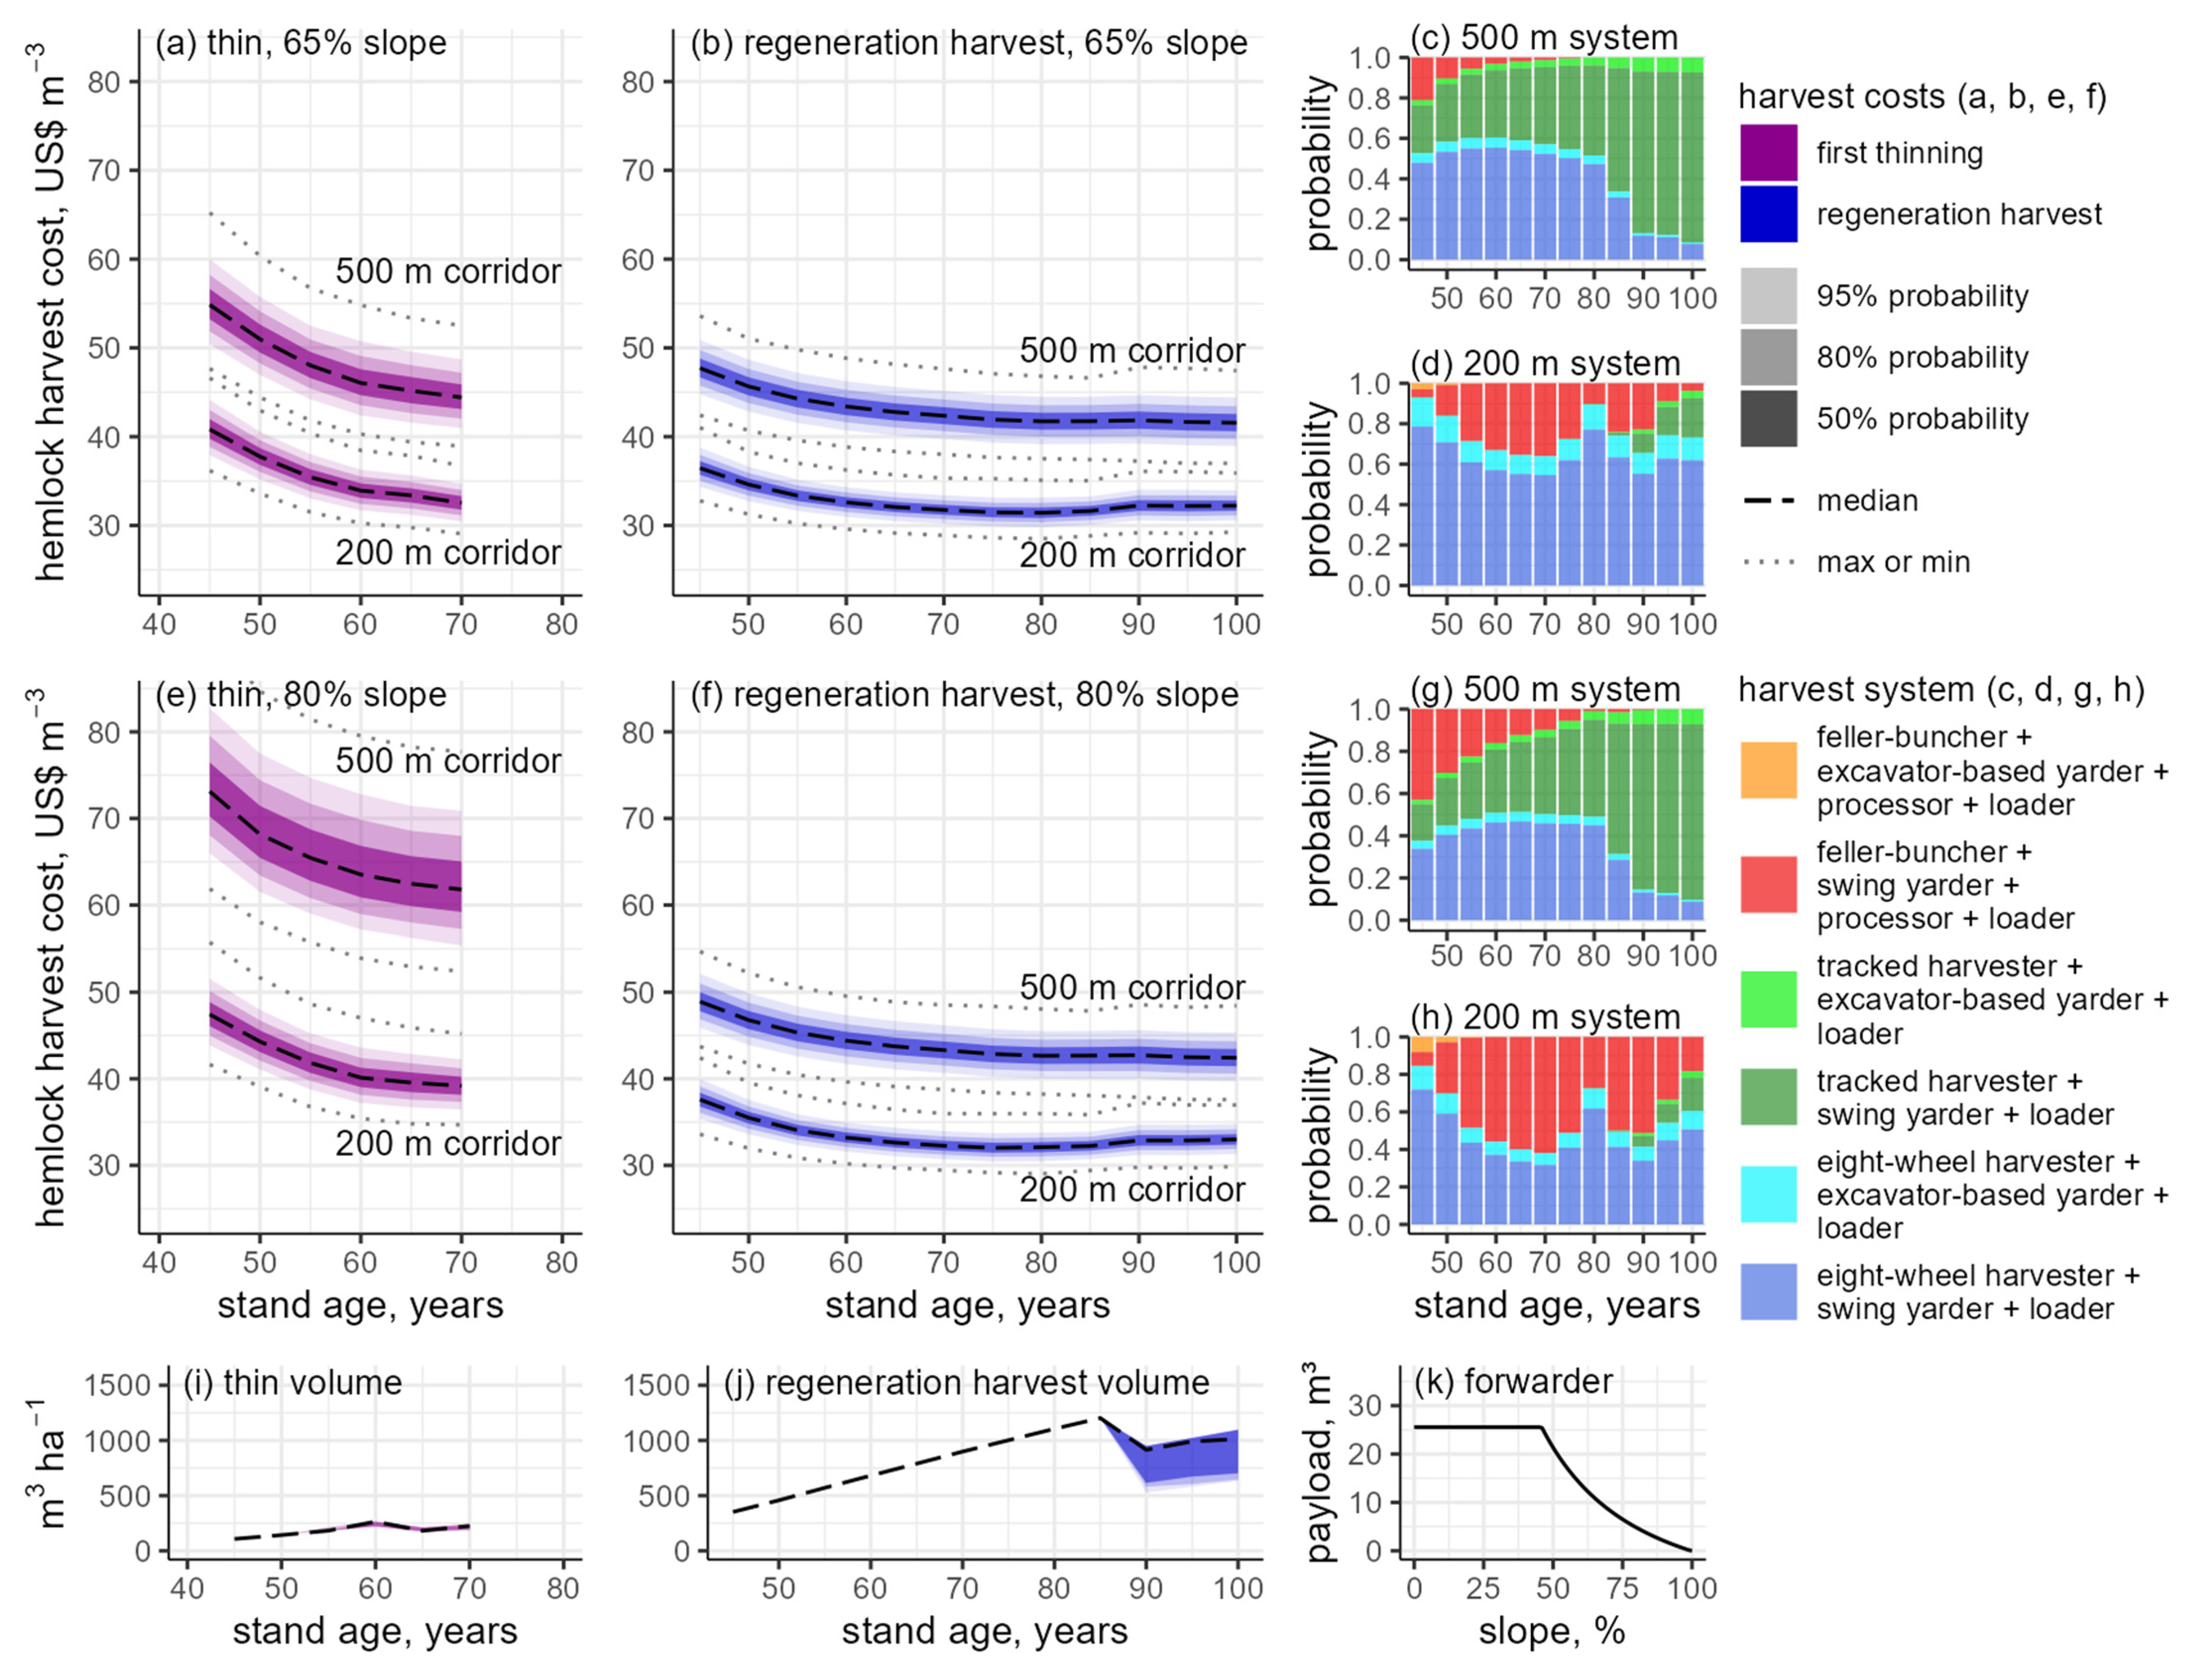
| thinning cost (US$ m −3) | 45 (31–68) | 48 (31–74) | 7.1 |
| regeneration harvest time (total PMh0 ha −1) | 115 (64–163) | 153 (69–220) | 33.6 |
| regeneration harvest cost (US$ m −3) | 37 (30–46) | 38 (31–47) | 0.9 |
Publisher’s Note: MDPI stays neutral with regard to jurisdictional claims in published maps and institutional affiliations. |
© 2022 by the authors. Licensee MDPI, Basel, Switzerland. This article is an open access article distributed under the terms and conditions of the Creative Commons Attribution (CC BY) license (https://creativecommons.org/licenses/by/4.0/).
Share and Cite
West, T.; Sessions, J.; Strimbu, B.M. Steep Slope Harvest System Models for Small to Large Trees. Forests 2022, 13, 305. https://doi.org/10.3390/f13020305
West T, Sessions J, Strimbu BM. Steep Slope Harvest System Models for Small to Large Trees. Forests. 2022; 13(2):305. https://doi.org/10.3390/f13020305
Chicago/Turabian StyleWest, Todd, John Sessions, and Bogdan M. Strimbu. 2022. "Steep Slope Harvest System Models for Small to Large Trees" Forests 13, no. 2: 305. https://doi.org/10.3390/f13020305
APA StyleWest, T., Sessions, J., & Strimbu, B. M. (2022). Steep Slope Harvest System Models for Small to Large Trees. Forests, 13(2), 305. https://doi.org/10.3390/f13020305