Abstract
This study aimed to investigate the effects of long-term nitrogen fertilization on non-structural carbohydrates (NSC) and nitrogen (N) status and their interaction in mature trees at the whole-tree scale. Ten g N m−2 yr−1 of ammonium nitrate fertilizer were applied to 26-year-old Larix gmelinii Rupr. (larch) and Fraxinus mandschurica Rupr. (ash) trees in Northeastern China from 2002 to 2012. NSC, total carbon (C) and total N concentrations in different compartments were examined. For both species, concentrations of NSC and their components (soluble sugars and starch) tended to increase in aboveground organs but decrease in fine roots following N fertilization, with significant (p < 0.05) changes only observed in ash stems and larch roots. N fertilization increased N concentrations and decreased the C:N ratio in all organs, especially in foliage and roots, while the effects of fertilization on total C concentrations varied with tree species and organs. Concentrations of NSC (mainly reflected in soluble sugar) were generally negatively correlated with N concentration in fine roots but positively related to N concentration in aboveground woody organs in both control and fertilized treatments. However, fertilization strengthened this correlation in fine roots and weakened this relationship in aboveground organs. This study provides a decade-long insight into the effect of currently increasing N deposition on tree growth and function.
1. Introduction
Carbon (C) storage in trees is key for biogeochemical processes of terrestrial ecosystems [1,2]. At the tree level, C allocation is mediated by non-structural carbohydrates (NSC), which are the sum of starch and low-molecular soluble sugars (e.g., glucose, fructose and sucrose) [1,3]. NSC are the most important components in C storage in quantitative terms, because they are not only building blocks for the synthesis of important compounds (such as proteins and amino acids), but they can also serve as the energy source for metabolic activities such as growth, nutrient assimilation and other life maintaining processes [1,4,5]. In addition, NSC play a central role in tree resistance to environmental changes [6,7] because starch, the temporarily immobile forms of NSC, can be mobilized and re-allocated to metabolic processes when plants encounter C deficits (C demand exceeds concurrent C acquisition by photosynthesis) [4,8,9,10].
Given the increased input of anthropogenic nitrogen (N), N deposition has dramatically increased in terrestrial ecosystems, changing ecosystem structure and function [11,12,13]. For example, N deposition affects tree growth and mortality [14,15], and changes terrestrial plant diversity [16,17]. As the key substance in tree growth and physiology, the dynamics of NSC storage in trees associated with soil N availability have been extensively reported [18,19,20,21]. Most of the previous research focused on NSC concentrations in a single organ, such as roots or foliage, in response to N fertilization. These studies found that N fertilization induced an increase in NSC concentration in the foliage of trees such as Quercus suber [22], but a decline in NSC concentration in roots from Populus tremuloides [23], Betula pendula [24] and seven northern hardwood tree species [21]. There were also a few studies examining NSC response to N fertilization at the whole-tree level, but they showed largely divergent results [25,26]. Recently, a meta-analysis of 12 studies covering 22 tree species showed that NSC concentrations in response to N fertilization can differ among tree taxonomic groups, leaf habits and fertilization intensities, but the average concentrations across tree species generally increased in aboveground woody tissues but decreased in roots with N fertilization [27]. Collectively, there is currently substantial knowledge about N fertilization effects on NSC dynamics in young trees but less is known about such effects in mature trees, especially at the whole-tree scale. Given that NSC allocation is different during tree maturation due to differences in photosynthetic capacity and growth [10], extrapolating results from seedlings or saplings to mature trees is questionable [10,28]. By analyzing long-term N fertilization treatments on mature trees, we can better understand how NSC pools in forests will react to improved soil N availability, especially in view of the globally increasing atmospheric N deposition.
In addition to NSC pools, long term N fertilization also directly alters N storage in trees [29,30]. It has been widely recognized that NSC and N are functionally tightly linked [31,32,33,34]. This is not only because carbohydrates can be mobilized to support N-related metabolic processes [1,10,18], but also because there is a direct relation between N-supply and photosynthetic capacity, since a lot of N goes into the production of Rubisco and other enzymes that are involved in photosynthesis [35]. However, responses of N concentrations to long-term N fertilization in mature trees were different to those of NSC among several experimental studies since they generally revealed increasing tissue concentrations of N with fertilization. For example, in temperate forests, more than 10 years of N fertilization increased N concentrations in foliage in a mixed-oak forest [30] and increased N concentrations in roots in a northern hardwood forest [36]. Higher N concentrations were also observed in needles and roots of subtropical Chinese fir (Cunninghamia Ianceolata) after eight years of N fertilization [37]. However, Kaakinen et al. [38] have shown that the response of NSC concentration in secondary xylem of stem wood to long-term N fertilization in mature trees of Norway spruce (Picea abies L. Karst.) varied between boreal and temperate sites in Finland. Few studies have examined the response of the relationship between carbohydrate and N allocations to N fertilization, but the inconsistent response patterns of NSC and N concentrations may imply that their linkage should be influenced not only by tree taxonomic groups (e.g., gymnosperm and angiosperm) and geographic regions (e.g., temperate and boreal zones) but also by the investigated tree organs. The small number of observations on NSC and N responses in mature trees to N fertilization limits our understanding of the linkage between NSC and N storage in trees, especially at the whole-tree scale.
The present study was conducted in northeastern China on two commercially important tree species from different tree taxonomic groups: Dahurian larch (Larix gmelinii Rupr.) and Manchurian ash (Fraxinus mandschurica Rupr.). After 10 years of N fertilization, we sampled the foliage, current-year and one-year-old twigs, different stem samples (e.g., bark, pith and the 10 most recent annual growth rings) and coarse and fine roots from 26-year-old monoculture plantations of both species. For each sampled tissue, concentrations of NSC (and its components, i.e., soluble sugars and starch), total C and total N were measured. The aim of this study was to reveal how NSC and N and their interrelation in mature trees respond to long-term N fertilization at the whole-tree level. We hypothesized that (1) NSC concentration should increase in aboveground organs but decrease in roots in mature ash and larch in response to long-term N fertilization; (2) N concentration should increase at the whole-tree scale for both species following N fertilization; (3) based on the variation patterns of NSC and N concentrations, for a given tree organ, N concentrations should be positively related to NSC concentrations in the aboveground organs but negatively related to NSC concentrations in roots in either control or fertilized treatments.
2. Materials and Methods
2.1. Study Site
The study was conducted at the Maoershan Experimental Station (127°30′–127°34′ E, 45°21′–45°25′ N) of Northeast Forestry University, Heilongjiang, China. This region is characterized by a cold temperate and a continental monsoon climate. Annual mean temperature is 2.8 °C and the mean daily air temperatures for January (coldest month) and July (warmest month), respectively, range from −23 °C to 20.9 °C. Annual average precipitation in this region is 600–800 mm, 80% of which occurs during the peak seasons from June to August [39]. The plantation is on a southwest-facing slope with an altitudinal range from 280 to 330 m and 20 degrees of slope from bottom to top. Soil is Hap-Boric Luvisol [40]. More details about the soil are given by Wang et al. [41].
2.2. Experimental Design
This experiment is a subset of a larger experiment designed to test the effects of long-term N fertilization on stand and tree performance [42,43]. The experiment was carried out on two monoculture plantations of Dahurian larch (Larix gmelinii Rupr.) and Manchurian ash (Fraxinus mandschurica Rupr.). Both plantations were established in 1986 by planting two-year-old seedlings using a 1.5 × 2.0 m planting grid. The area of each plantation was over five hectares. In 2002, larch and ash trees had average trunk diameters at breast height of 11.7 and 9.1 cm, respectively (mean values across all trees at the plots). For each species, six plots (20 m × 30 m) were established in May 2002 in a randomized complete block design. From the six plots in each species’ plantation, three were randomly chosen as N fertilization plots, and the residual plots were considered as unfertilized controls. From 2002 to 2012, each N-fertilized plot received 10 g N m−2 yr−1 of ammonium nitrate (NH4+-NO3−) fertilizer. The determination of fertilizer quantity is based on the natural temporal patterns of N mineralization in the study site (see Jia et al. [43] for details). From May to September, 15%, 21%, 28%, 21% and 15% of the fertilizer was applied monthly, respectively. Details of stand and soil characteristics for each plantation are shown in Table 1.

Table 1.
Stand and soil characteristics for 0–20 cm soil depth in Fraxinus mandschurica and Larix gmelinii (mean ± 1 standard error).
2.3. Aboveground and Belowground Tissue Sampling
Previous studies showed that NSC pools of trees at the end of the growing season might serve as a good indicator of C surplus condition in the current year [44]. In 2012, at the end of September, about one week before leaf fall, six trees with average diameter, i.e., one tree per plot, were selected for sampling for each species. Tree density in ash and larch stands at the time of sampling was 3187 and 2267 plants/ha, respectively. For each selected individual tree, three branches (with leaves or needles) from the lower, middle and upper parts of the crown, respectively, were cut using a pruner and then combined together into a mixed sample [20]. Each branch was separated into foliage and current-year and one-year-old twigs, identified by stem scars. For each individual tree, stems were cored to the pith at breast height with an increment borer (5.15-mm diameter, Haglöf Sweden AB, Sweden) from four directions (North, South, East and West). Bark and pith in the stem cores were cut off, respectively. The 10 outermost rings (formed since N fertilization initiation) were divided, with every two adjoining rings cut off as an independent sample under a compound microscope. For each individually sampled tree, these independent stem samples from the four directions were merged according to their horizontal positions in a stem core. Hence, seven groups of stem samples per tree were ultimately obtained, including bark, pith and growth rings formed in the last 1–2, 3–4, 5–6, 7–8 and 9–10 years. Additionally, large roots (diameter > 3 cm) and all their attached intact root segments from the individual tree were very carefully harvested from 0–20 cm soil depth. Three soil samples from the same plot were randomly sampled to the depth of 20 cm and combined into a Ziploc bag as a composite sample for subsequent chemical analyses. After the collection, all plant and soil samples were put into a cooler filled with ice bags and taken to the laboratory within 2 h.
2.4. Chemical Analyses of Plant and Soil Materials
In the lab, root samples were washed with de-ionized water to free them from adhering soil particles. Living and dead root segments were distinguished depending on their morphology, color and elasticity. Based on the root order system used in Pregitzer et al. [45], the first five root orders from the living root segments (with root tips assigned the first order root) were separated in culture dishes filled with de-ionized water and ice. All separated tissues were pulse-heated in a microwave oven (5 min at 800 W, with a glass of water inside to avoid overheating) [5] to de-nature enzymes. Afterwards, all samples were oven-dried at 65 °C until mass constancy.
The dried plant samples were ground to fine powder for chemical analyses. Total soluble sugar and starch concentrations were measured by the modified phenol-sulfuric acid method [46]. In detail, dried sample powder (40 mg) was extracted in 10 mL of 80% ethanol overnight. Then the mixed solutions were centrifuged at 2200–5000 rpm for 15 min, and supernatants were collected for soluble sugar concentration analysis. The residue was prepared for the analysis of starch concentrations by drying at 100 °C for 3 h, then hydrolyzing with 3 mL 3% solutions of hydrochloric acid in a boiling water bath for 0.5 h and finally filtering of the supernatant. For each of these two processes, 2 mL of the fixed volume supernatant was placed in a 25 mL colorimetric tube, then 1 mL of 5% phenol reagent and 5 mL of concentrated sulfuric acid were added quickly. After being shaken well, the mixed solution was left for 30 min at room temperature before absorbance measurement. The soluble sugar and starch concentrations were measured by reading the absorbance at 490 nm using a UV-VIS spectrophotometer (model UV-PC01, Shimadzu Corp., Kyoto, Japan). Total NSC concentrations were calculated as the sum of soluble sugars and starch concentrations on a dry matter basis. A sample of 20 mg plant powder was used to determine the total N and total C concentrations with a Macro Elemental Analyzer (vario MACRO, Frankfurt, Germany). All tissue N and C concentrations were expressed on a dry mass basis. C:N ratio was calculated as the total C concentration divided by total N concentration for each tissue [45].
Soil samples were naturally dried in a cool, ventilated place, and then all impurities such as fine root segments and stone were removed by hand. Soil samples were ground to powder and passed through a 2 mm sieve. Total soil N and C concentrations were determined by an elemental analyzer (Vario Macro, Frankfurt, Germany). Total soil phosphorus concentration, ammonium and nitrate concentrations were analyzed with a flow-injection autoanalyzer (AA3, Norderstedt, Germany). Soil pH was measured with an acidometer (MT-5000, Shanghai, China) [41]. The soil characteristics for each single species plantation on control and fertilized plots are given in Table 1.
2.5. Statistical Analyses
Total available inorganic N concentrations in the soil were calculated as the sum of NH4+-N and NO3−-N. For each treatment per tree species, each tree per plot was considered as a sample unit, thus data of three trees from three plots were used as replications. For each species, mean NSC, soluble sugar, starch, total C, total N concentrations and C:N ratio of branch, stem and root were calculated across the involved compartments. One-way factorial analyses of variance (ANOVA) (p = 0.05) were conducted to test the influence of N fertilization on NSC, soluble sugar, starch, total C and total N concentrations as well as the C:N ratio at the species level. For each species, the influence of fertilization and species and their interaction on chemical traits were tested by a two-way ANOVA for each organ (foliage, branch, stem and root). Pearson’s correlation was used to determine the relationships between N concentration and each of NSC, soluble sugar and starch concentrations for each species, treatments and tissues. A preliminary analysis showed that the relationships between N and NSC (or components) were not significant in foliage and lateral roots due to the limited replication per species and treatment (n = 3). Using the data of the samples as described above, we only present these relationships in aboveground woody organs (n = 24), including current-year and one-year-old twigs, pith and five groups of growth rings, and the first five orders of fine roots (n = 15). Variations of NSC, soluble sugars, starch, total C and total N concentrations in tissues induced by N fertilization are expressed in % increase or decrease relative to the corresponding tissues from trees at the control plots. All statistical analyses were performed using SPSS software (2010, V. 19.0, SPSS Inc., Cary, NC, USA).
3. Results
3.1. NSC, Soluble Sugars and Starch
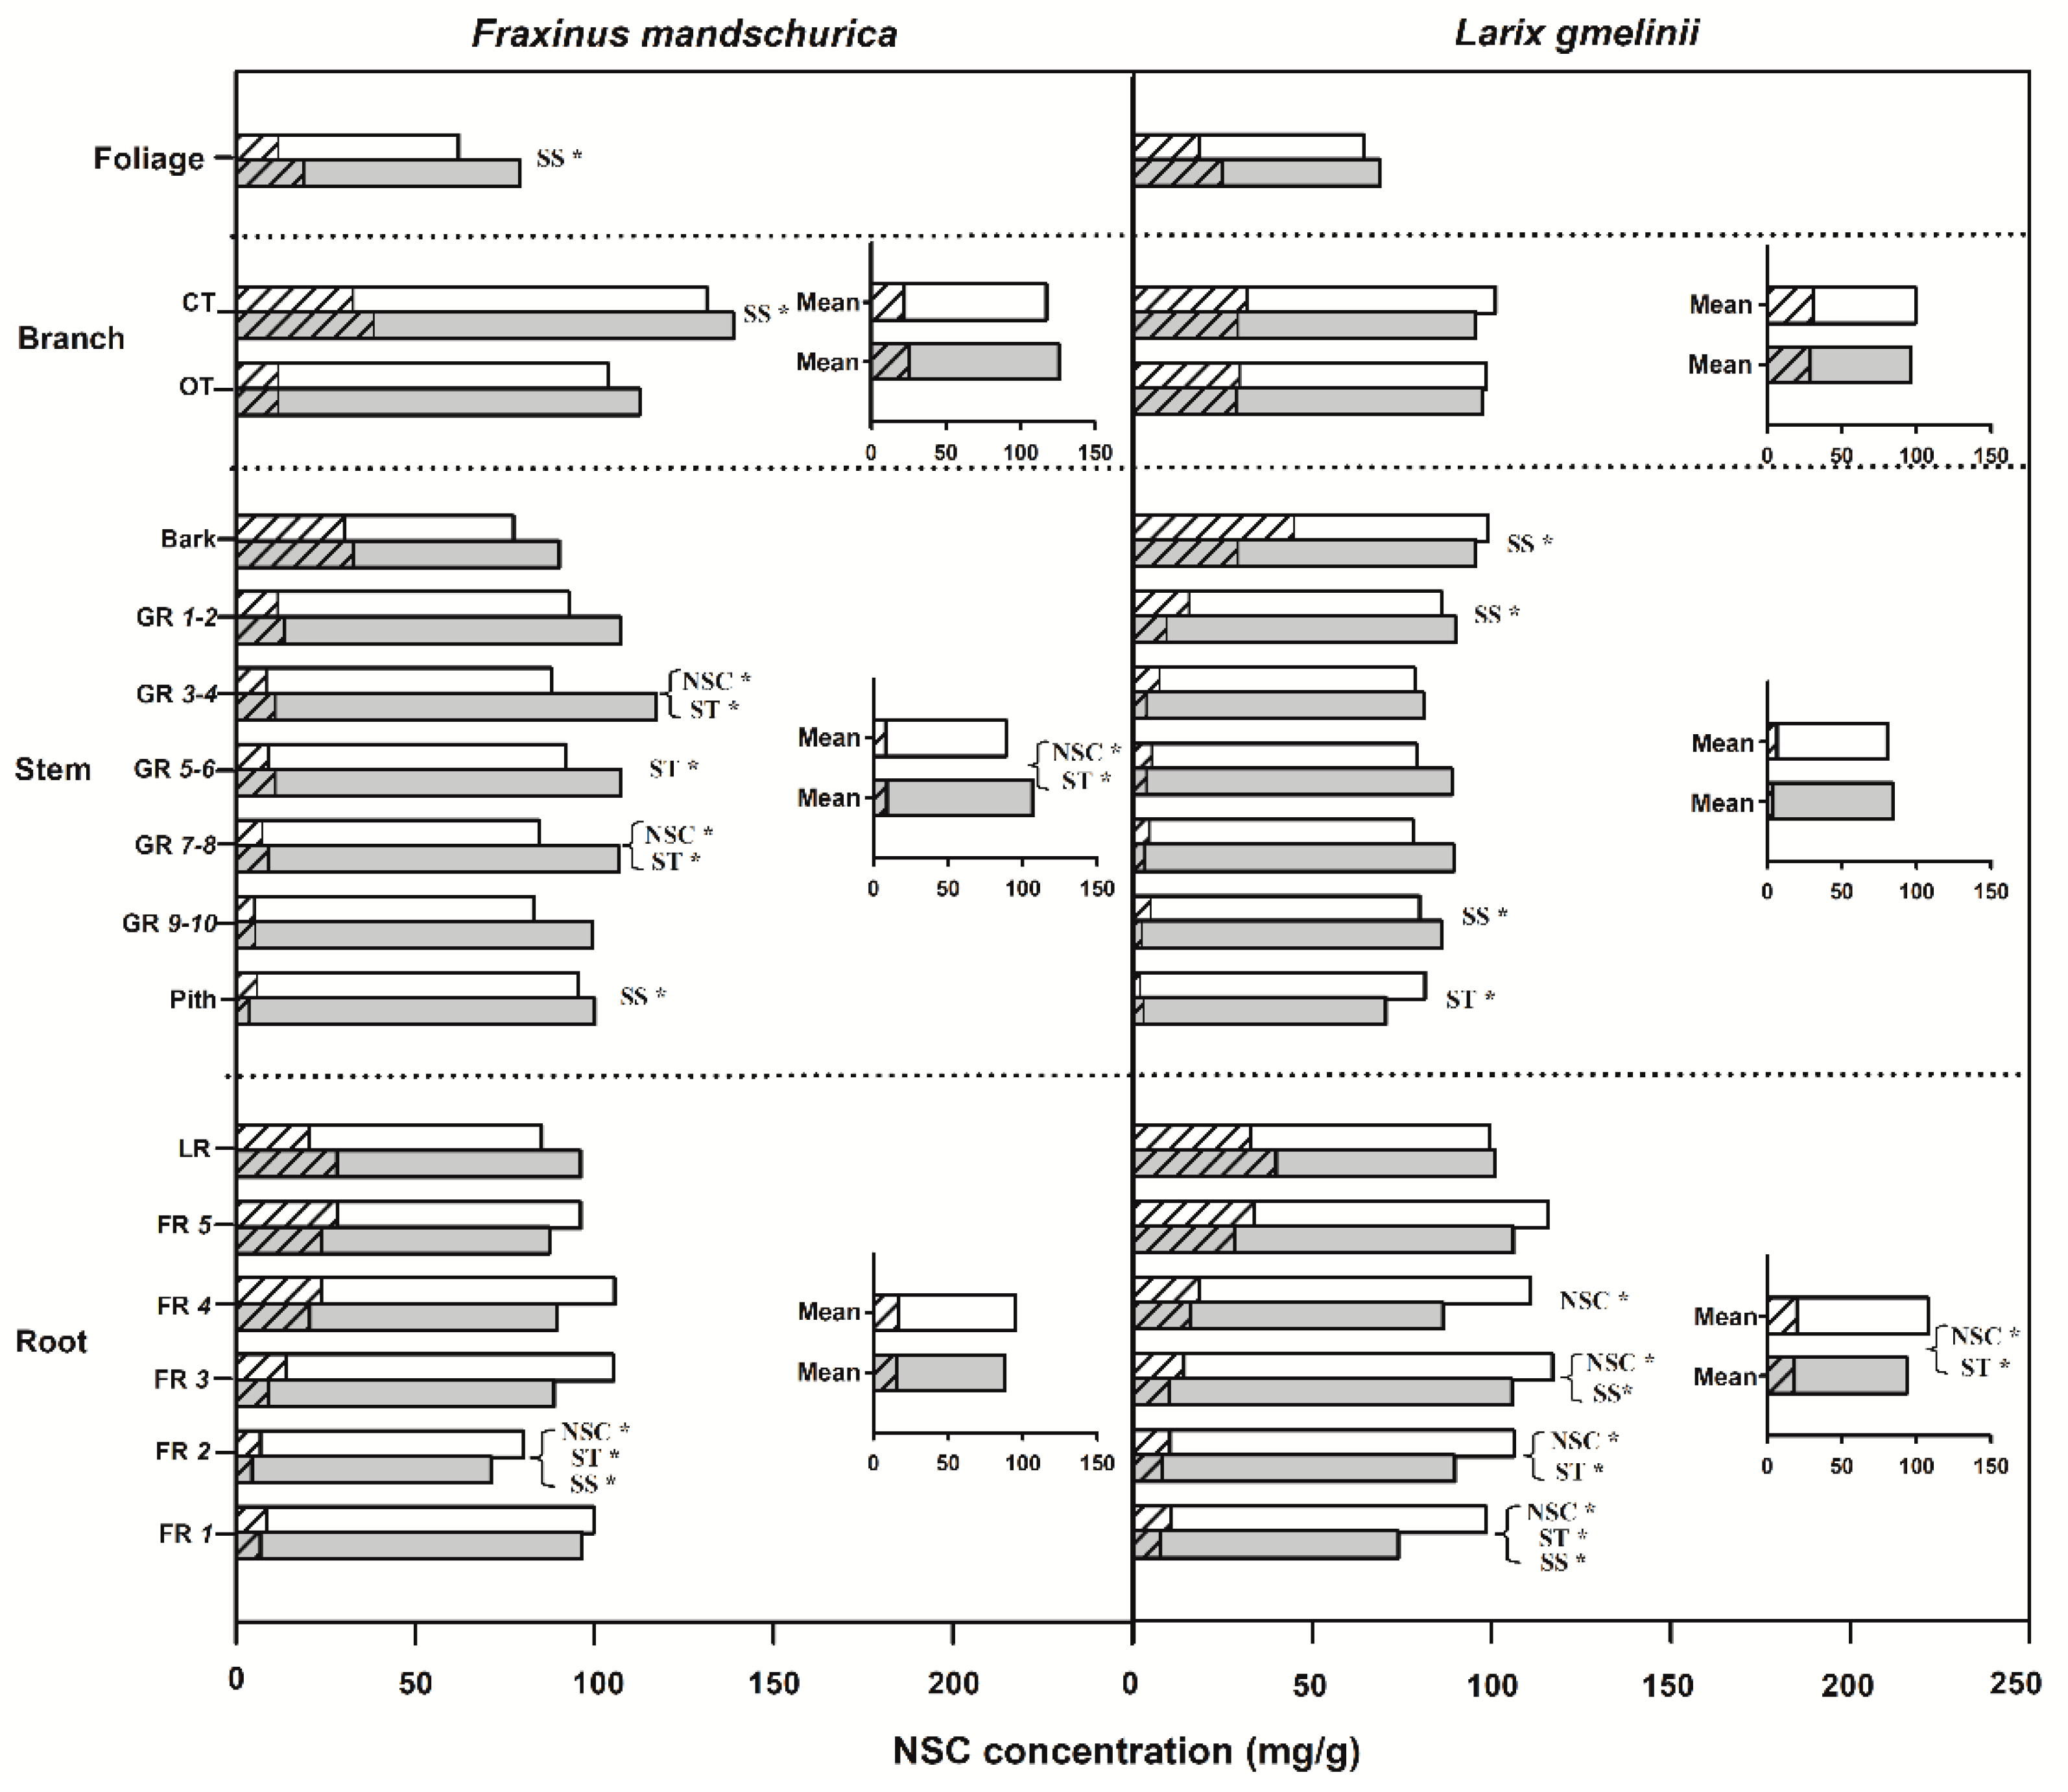
Significant differences in NSC concentrations between ash and larch were found in roots, branches and stems (Table 2). Independent of the fertilization treatment, larch had significantly higher NSC concentrations in roots but lower NSC concentrations in branches and stems than ash (Figure 1). By comparison, NSC concentrations in foliage were similar between ash and larch. Soluble sugars and starch also varied between species and among organs (Figure 1, Table 2). Following N fertilization, NSC, starch and sugar concentrations were generally reduced in roots and increased in branches (except larch) and stems averaged within each compartment (stem, roots etc.), with significant responses of NSC and starch concentrations only in ash stem and larch root (see inserted plots in Figure 1). For aboveground compartments, except for significant decreases of soluble sugar concentration in the bark and starch concentration in the pith for larch, NSC concentrations in other compartments generally increased in both species in response to N fertilization. Significant increases of NSC (and sugars and starch separately) were found in some of the analyzed growth rings in both species, as well as in foliage and current-year twigs for ash (Figure 1). In root compartments, except for increase of NSC concentrations in large roots, fine root NSC concentrations generally decreased following N fertilization, with significant responses occurring only in the first four root orders of larch and the second root order of ash (Figure 1). Although NSC, soluble sugar and starch concentrations responded differently between ash and larch following fertilization, there were no highly significant interactions between species and fertilization for these traits (Table 2).
Table 2.
ANOVA results of tree species and N fertilization on non-structural carbohydrate (NSC), starch, soluble sugar, total carbon (C), total nitrogen (N) concentrations and C:N ratio in organs of foliage, branch, stem and root.
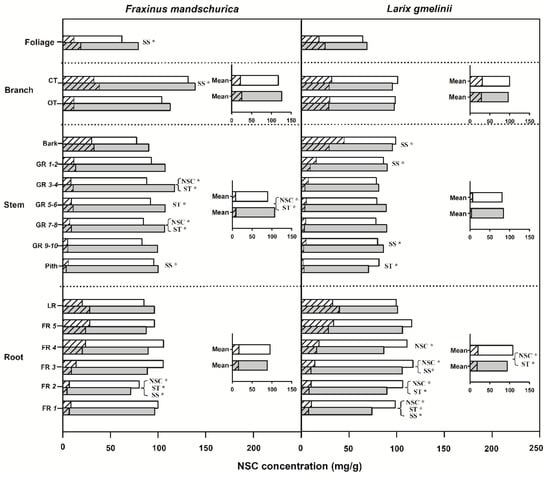
Figure 1.
Non-structural carbohydrates (NSC), soluble sugar (SS) and starch (ST) concentrations for compartments from organs (foliage, branch, stem and roots) of Fraxinus mandschurica and Larix gmelinii plantations in control and N fertilization plots. Inset: Mean values of NSC, SS and ST concentrations within an organ across compartments in control and N fertilization treatments. Bars in white and in grey represent the control and N fertilization, respectively. For the same bar, the left shading part and the right blank part represent SS and ST concentrations, respectively. CT, current-year twig; OT, one-year-old twig; GR, growth ring; LR, large root; FR, fine root branching order. “*” behind “NSC”, “SS” or “ST” within a compartment indicates significant (p < 0.05) differences of this chemical trait between control and N fertilization treatments.
3.2. Total Carbon, Total Nitrogen and C:N Ratio
There were significant interspecific differences in C and N concentrations and C:N ratios for most organs, except for N concentrations in foliage and C concentrations in roots (Table 2). Larch foliage, branches, stems and roots generally had higher C concentrations and C:N ratios but lower N concentrations than ash, regardless of the N-treatment (Figure 2, Figure 3 and Figure 4). N fertilization showed significant influence on C (except for larch) and N concentrations and C:N ratio in foliage for both species, but had no effect on branch, stem and root when averaged across individual tissues (see inserted plots in Figure 2, Figure 3 and Figure 4, Table 2). There were also no significant interactions between species and fertilization for any of these traits (Table 2). The influence of N fertilization on C concentrations varied with organs for each species (Figure 2). In the aboveground organs, a significant increase of the total C concentration was only found in ash foliage and the last 3 to 10-year-old growth rings. C concentrations in the belowground organs also responded differently between ash and larch since they significantly decreased in coarse roots (lateral and fifth order roots) and increased in the first four fine root orders in larch. In ash, C concentrations decreased significantly in lateral roots and the third to fifth fine root orders but remained unchanged in the first two fine root orders (Figure 2). By comparison, N concentrations consistently increased with N fertilization in all organs of ash and larch (Figure 3), with increments ranging from 7% (foliage) to 13% (roots) in ash and from 6% (branch) to 24% (foliage) in larch. For the branches, stems and root compartments, strong increases of N concentrations were found in fine and lateral roots for both species, as well as in the bark of larch and current-year twigs and 9–10-year-old growth rings of ash (Figure 3). Following N fertilization, C:N ratios in each compartment decreased in both species, and had similar significant trends as N concentrations, suggesting that there was a consistent increase of N with fertilization but less (to no) effect on the C content (Figure 3 and Figure 4).
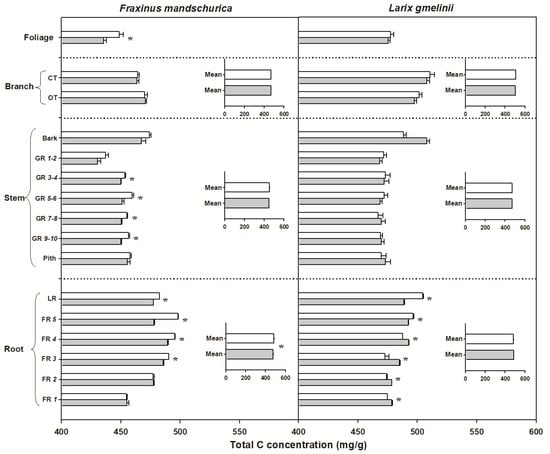
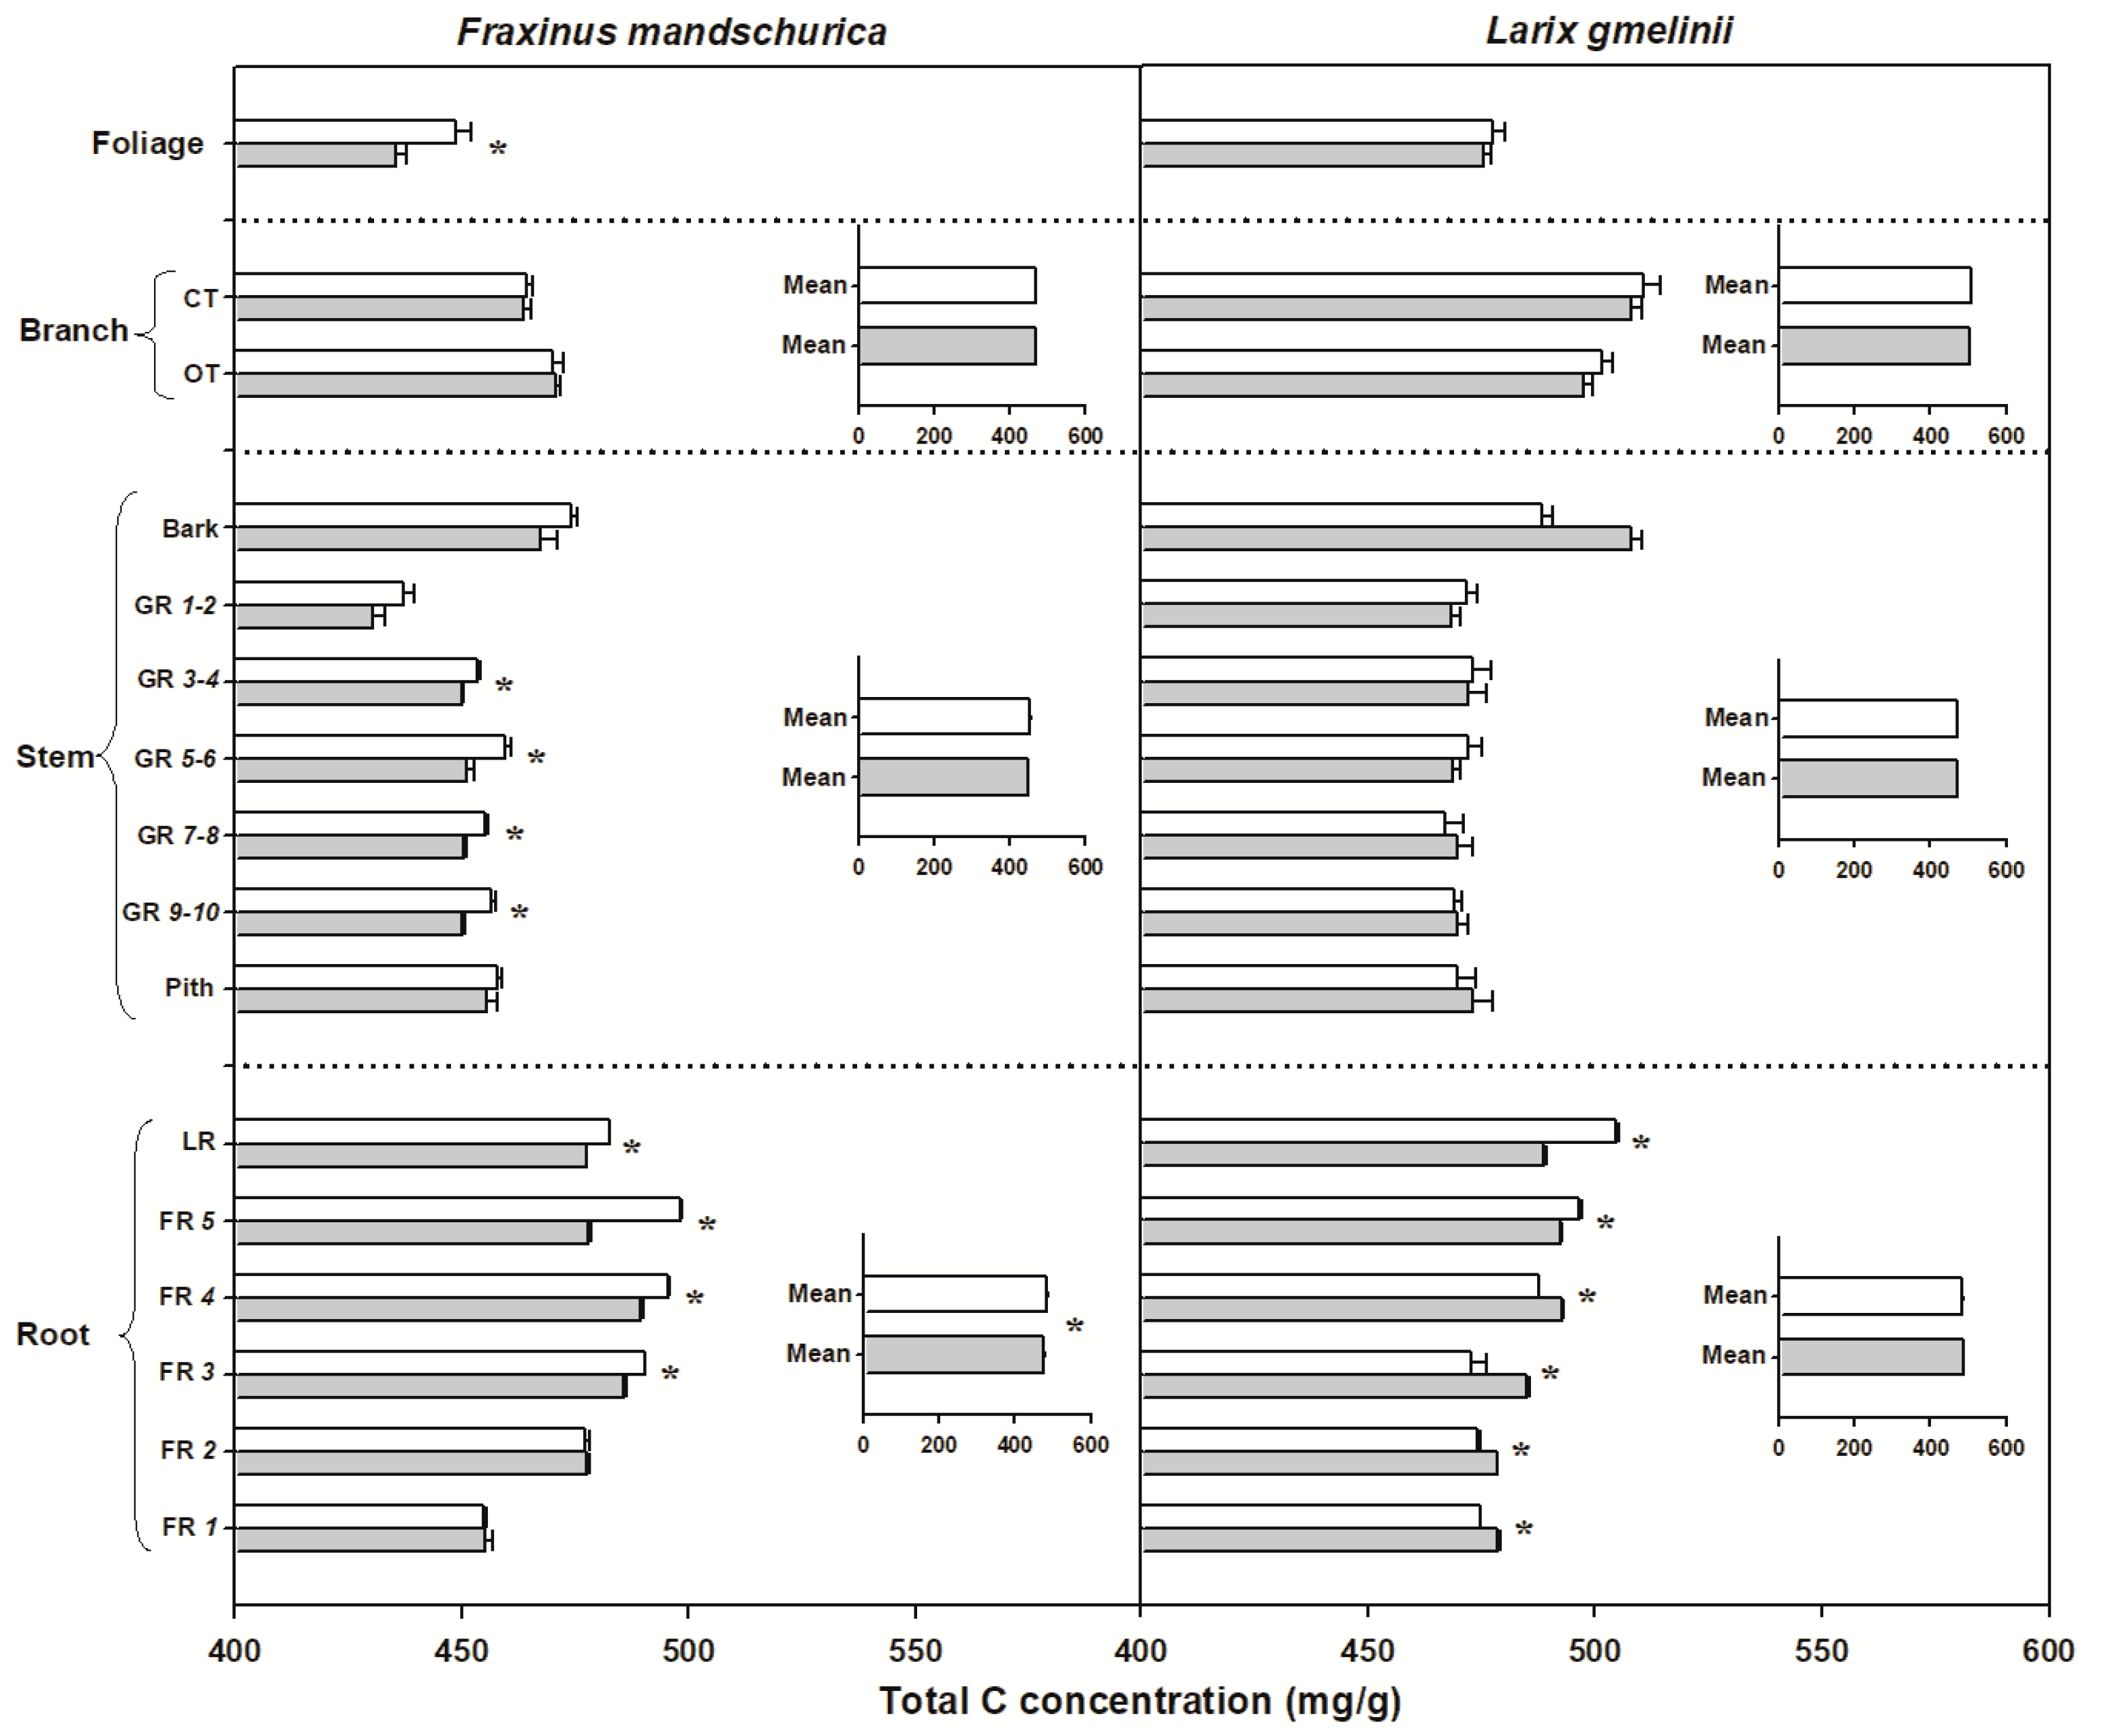
Figure 2.
Total carbon (C) concentrations for compartments from organs (foliage, branch, stem and roots) in Fraxinus mandschurica and Larix gmelinii in control (white bar) and N fertilization (grey bar) plots. Inset: Mean values of C concentration within an organ across compartments in control and N fertilization treatments. CT, current-year twig; OT, one-year-old twig; GR, growth ring; LR, large root; FR, fine root branching order. “*” within a compartment indicates significant (p < 0.05) differences between control and N fertilization treatments.
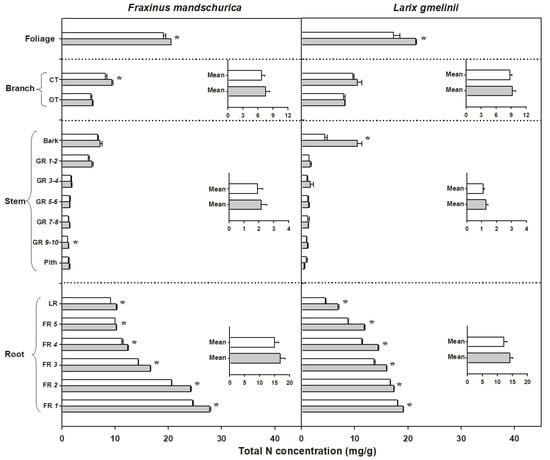
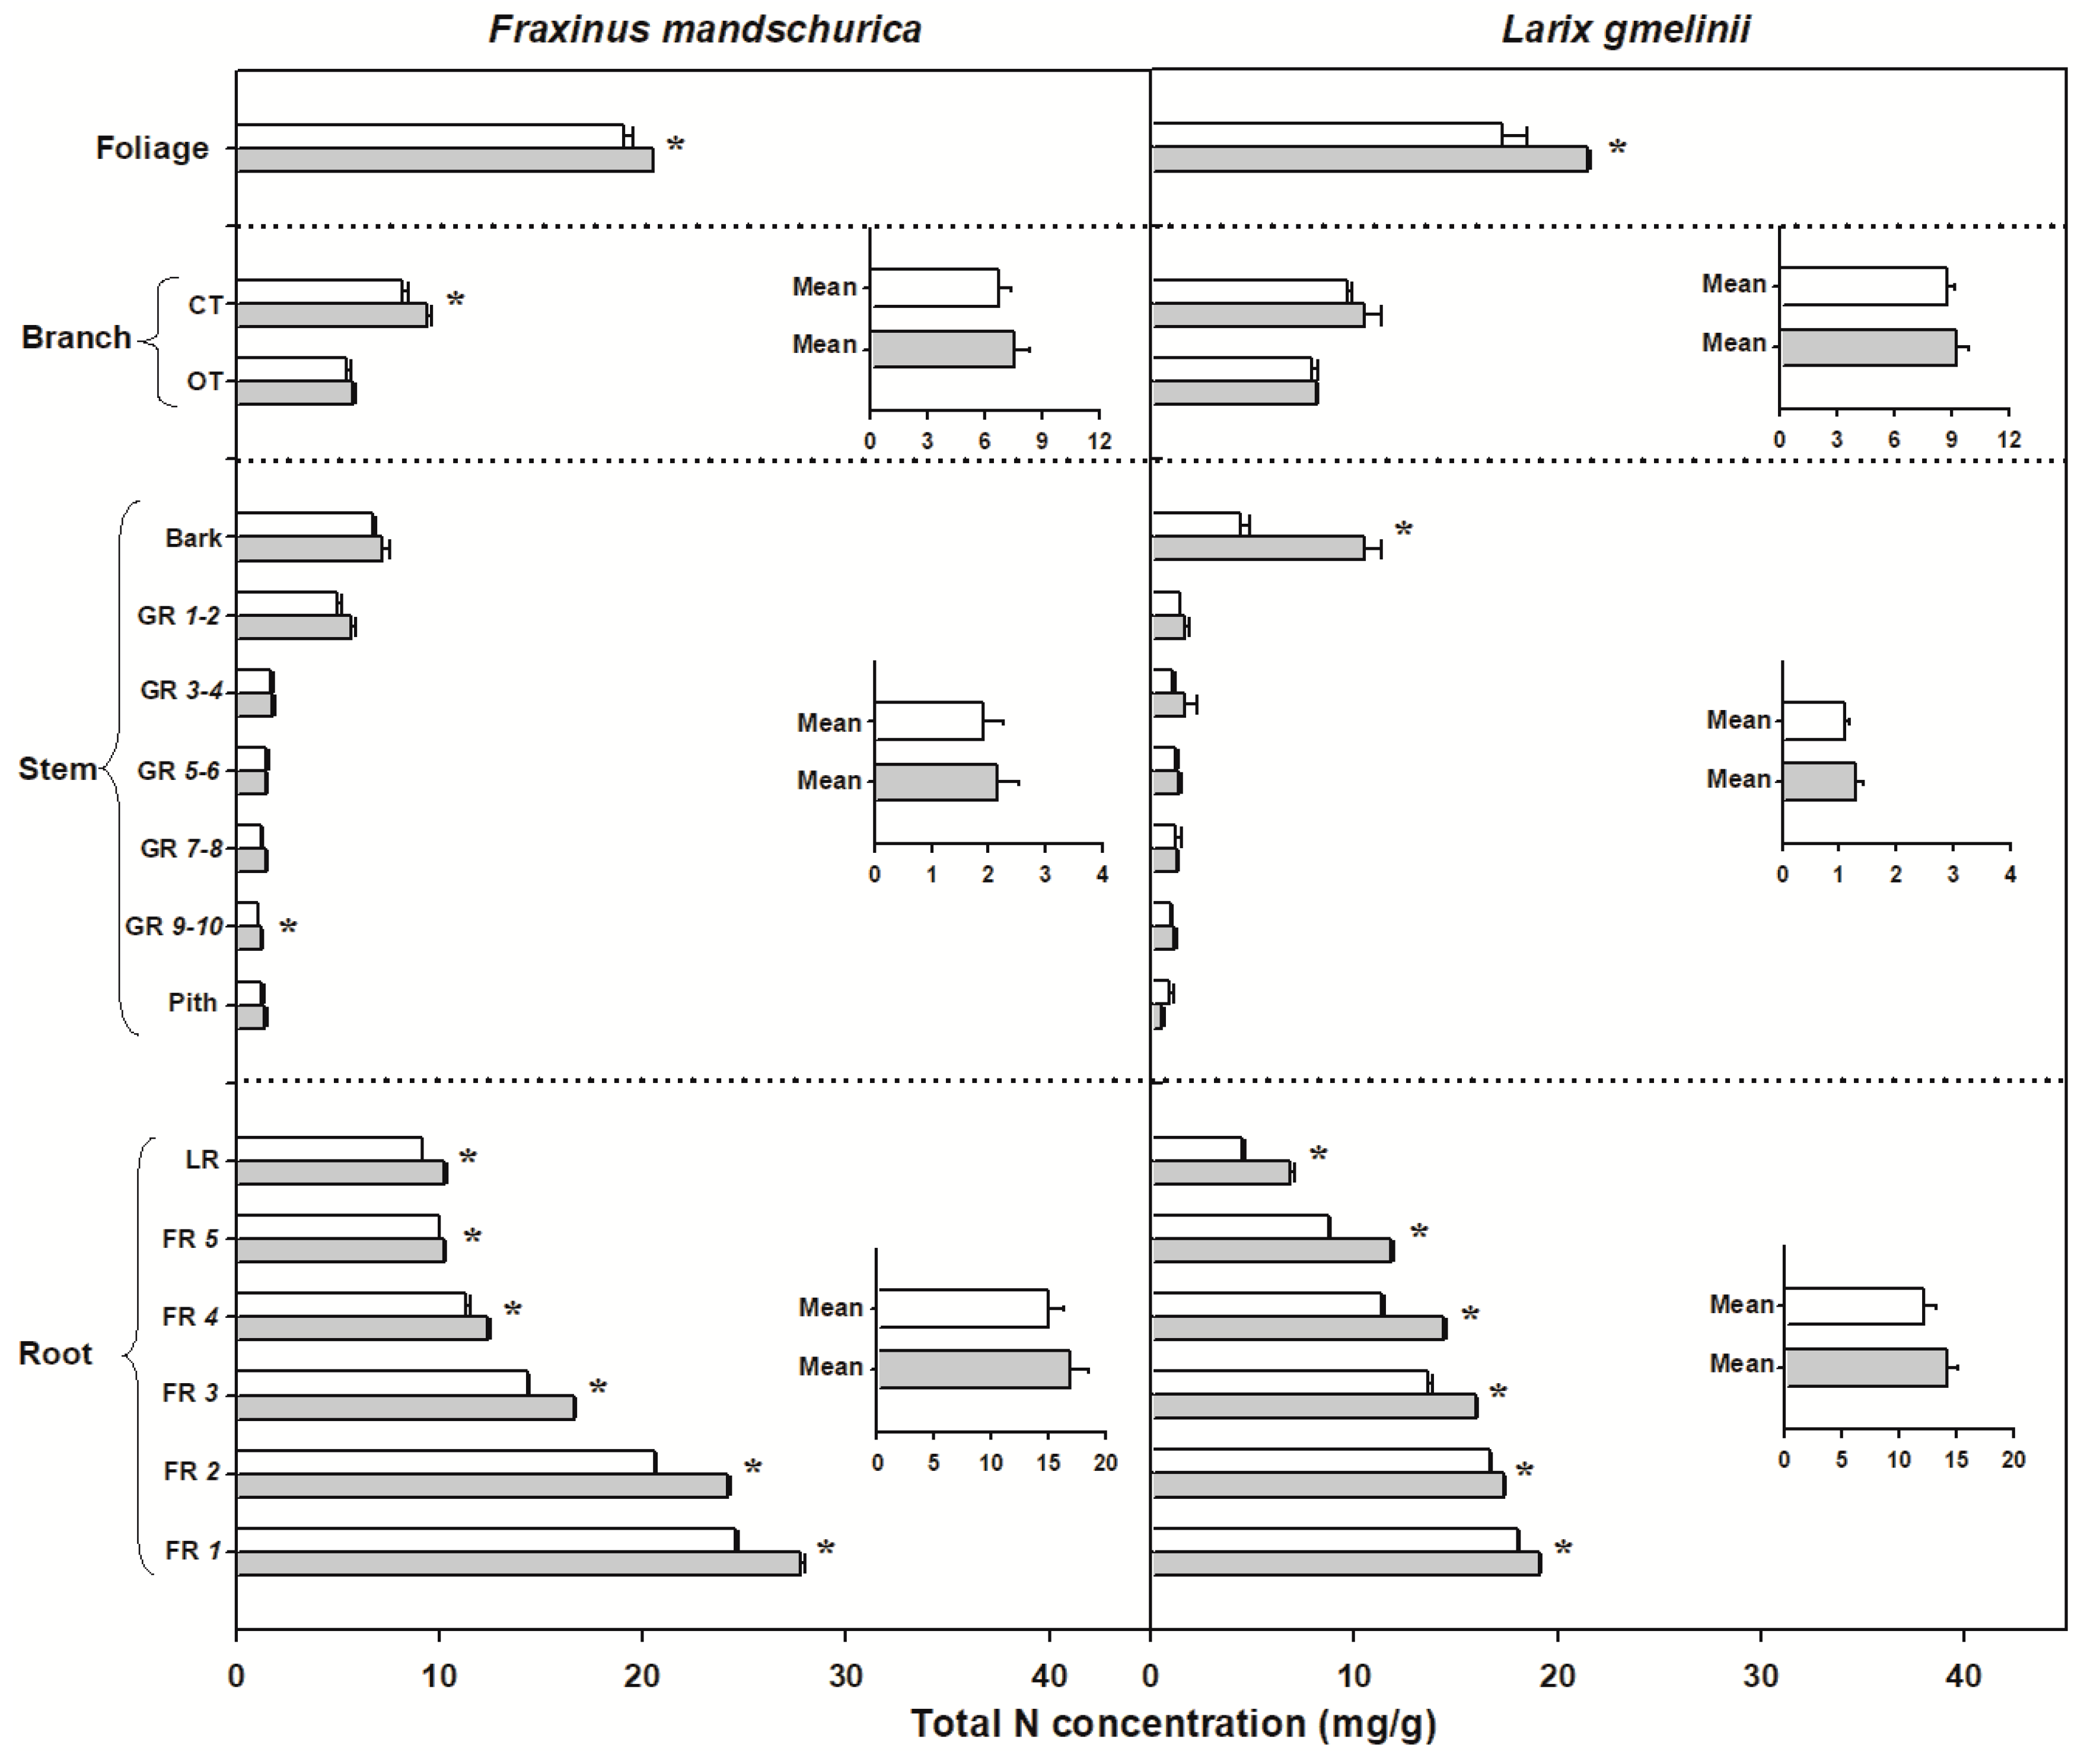
Figure 3.
Total nitrogen (N) concentrations for compartments from organs (foliage, branch, stem and roots) in Fraxinus mandschurica and Larix gmelinii in control (white bar) and N fertilization (grey bar) plots. Inset: Mean values of N concentration within an organ across compartments in control and N fertilization treatments. CT, current-year twig; OT, one-year-old twig; GR, growth ring; LR, large root; FR, fine root branching order. “*” within a compartment indicates significant (p < 0.05) differences between control and N fertilization treatments.

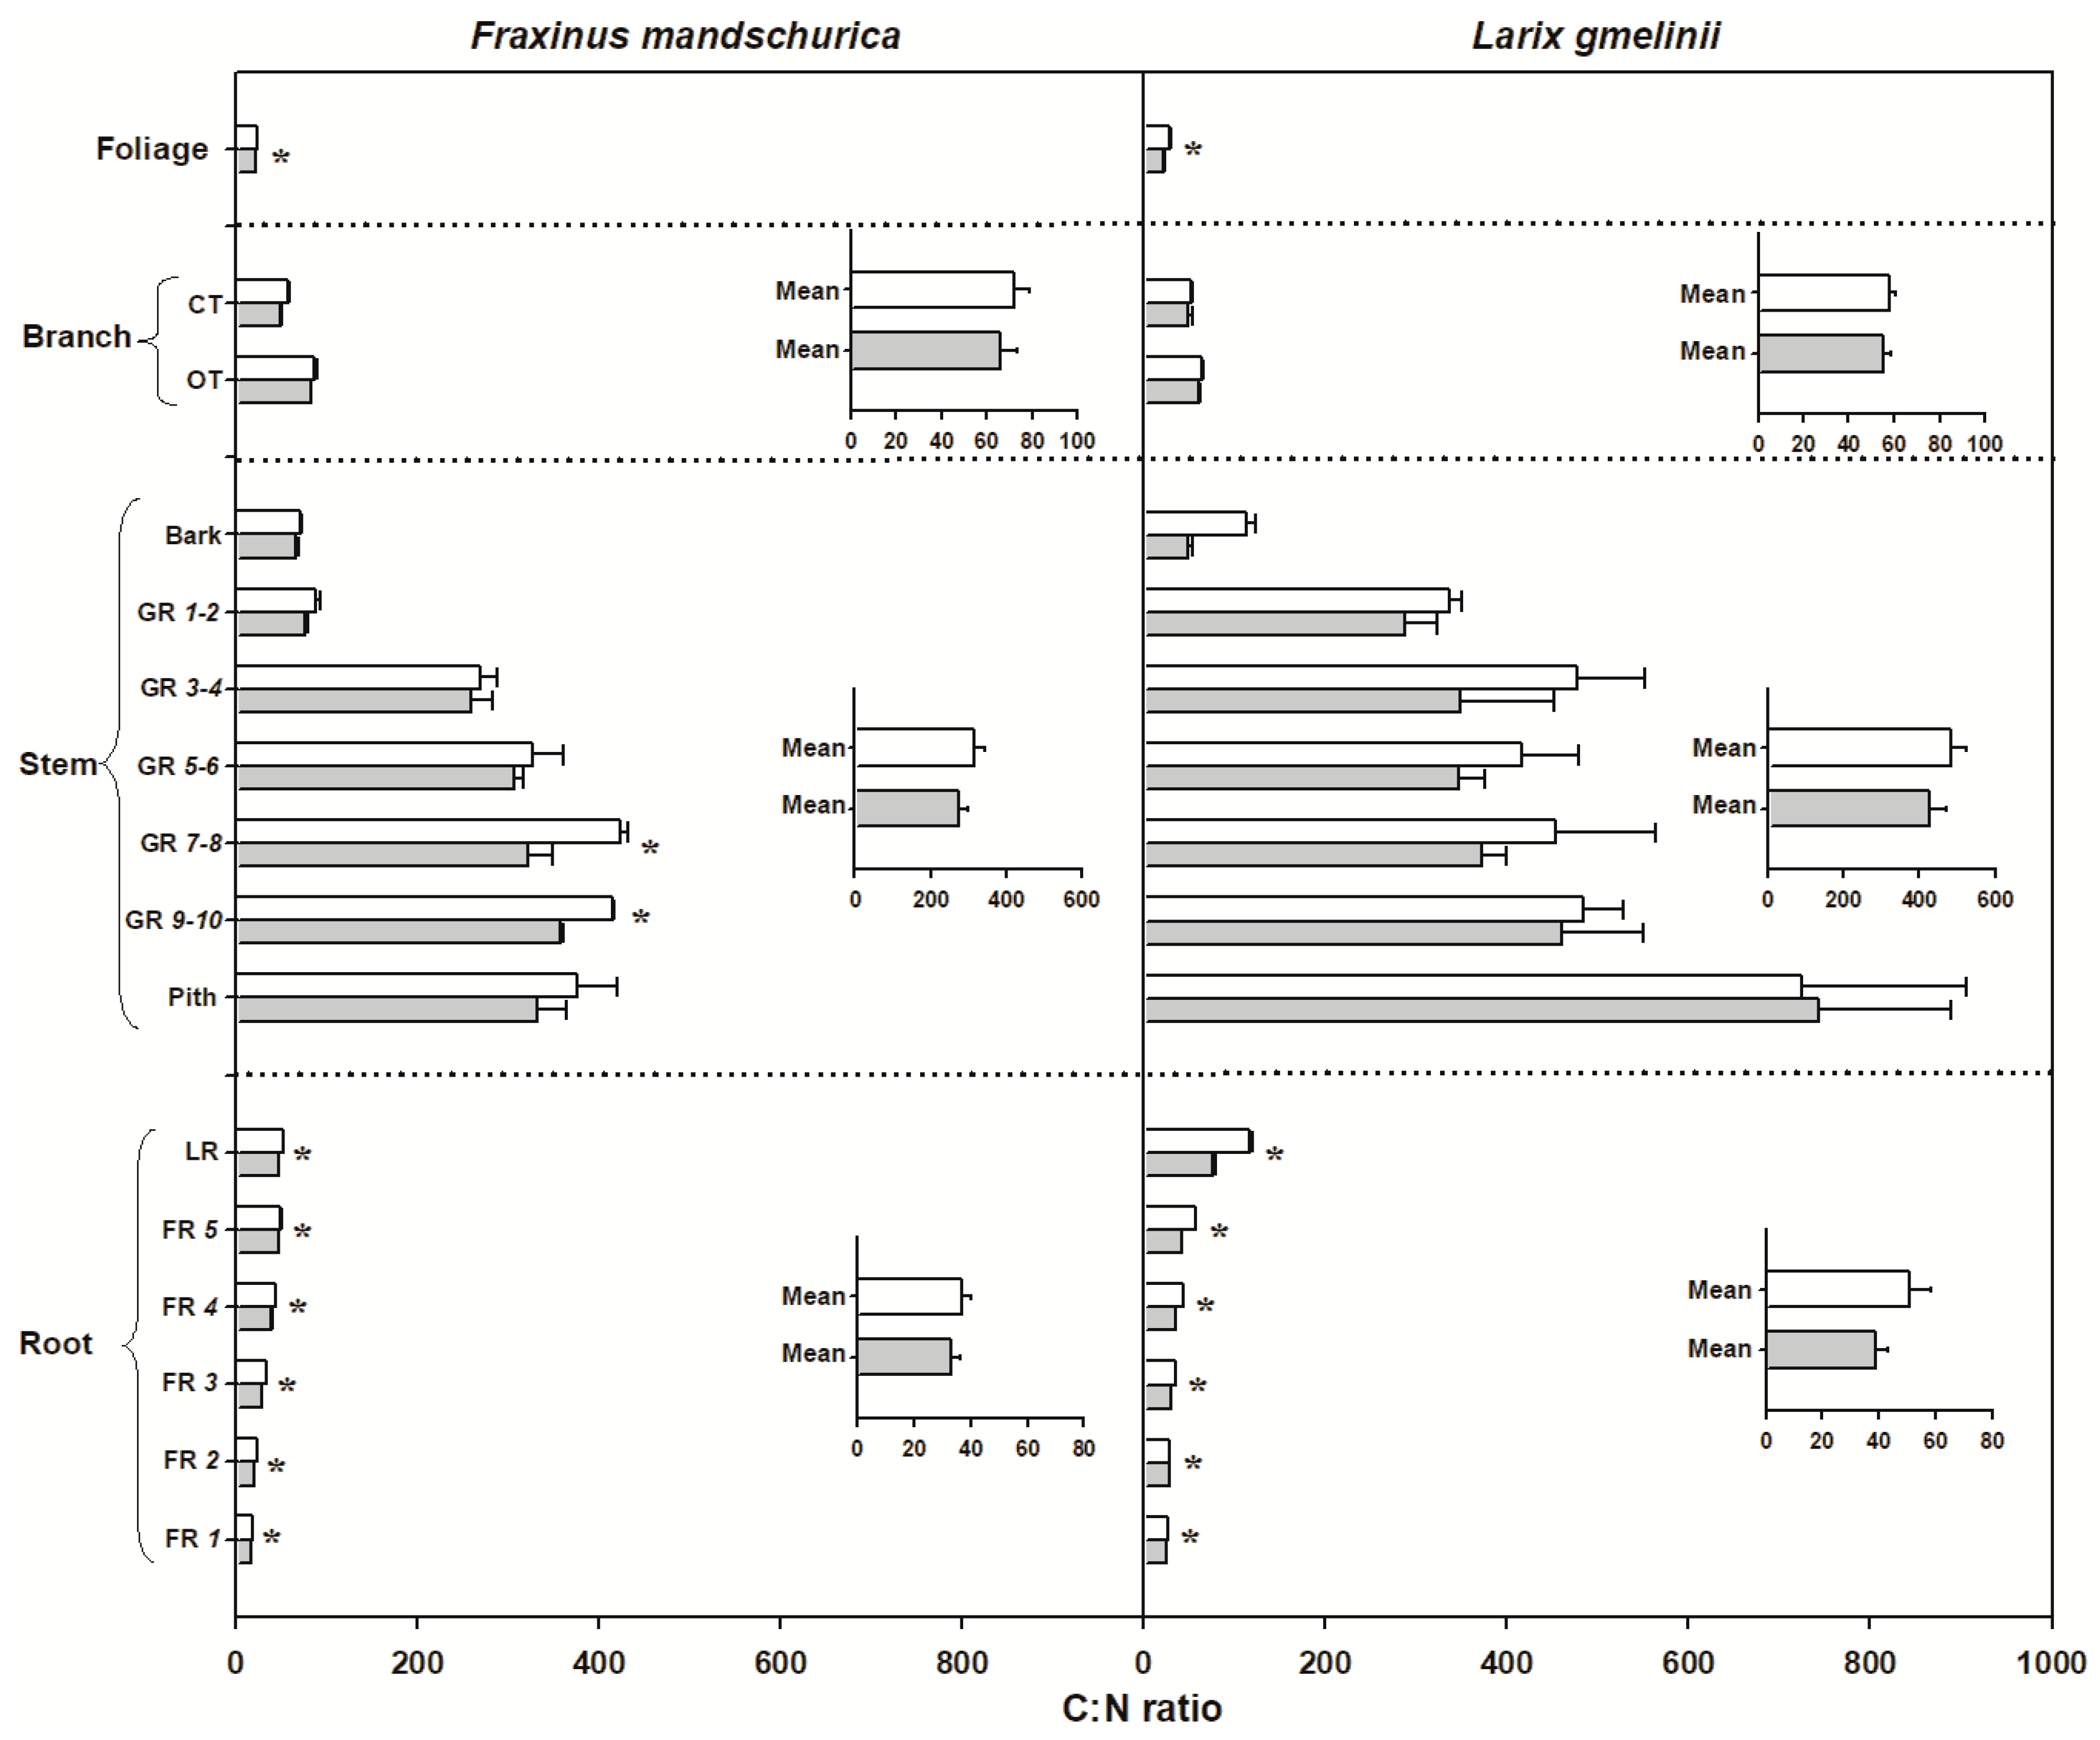
Figure 4.
C:N ratio for compartments from organs (foliage, branch, stem and roots) in Fraxinus mandschurica and Larix gmelinii in control (white bar) and N fertilization (grey bar) plots. Inset: Mean values of C:N ratio within an organ across compartments in control and N fertilization treatments. CT, current-year twig; OT, one-year-old twig; GR, growth ring; LR, large root; FR, fine root branching order. “*” within a compartment indicates significant (p < 0.05) differences between control and N fertilization treatments.
3.3. Relationship between N and NSC
Within each species, significant correlations were found between N and both NSC and soluble sugar concentrations in fine roots and aboveground woody organs (i.e., branch and stem) from the control plots, except for fine roots of ash (Table 3). However, the correlations showed an opposite direction between above- and belowground organs, which were positive among aboveground woody compartments but negative among fine root compartments. In comparison, N and starch concentrations were generally poorly correlated, except for aboveground woody organs from the control plots and fine roots from the N fertilized plots, with most correlation coefficients (r) less than 0.4. The weak correlation between N and starch resulted in smaller Pearson’s correlation coefficients for the correlation between N and NSC concentrations than those between N and soluble sugar concentrations.
Table 3.
Pearson’s correlations between N concentration and NSC, soluble sugar and starch concentrations under control (C) and N fertilization (Fert) treatments in Fraxinus mandschurica and Larix gmelinii. For each treatment per species, 24 and 15 replications were used for correlation analysis of aboveground woody organs and fine roots, respectively.
The correlation between N and both NSC and components under N fertilization showed similar significant trends to those of the control (Table 3). The strongest relationship was also exhibited between N and soluble sugar concentrations. Pearson’s correlation coefficients for the relationships between N and both NSC and soluble sugar concentrations were generally slightly increased in fine roots in both species (with no significant correlations between N and NSC concentrations in ash) but decreased in aboveground woody organs of ash following N fertilization.
4. Discussion
4.1. Effects of N Fertilization on NSC, Soluble Sugar and Starch Concentrations
NSC, as a key substrate for tree functional processes, are affected by environmental changes, such as soil N availability [27]. However, the response of NSC concentrations in mature trees to long-term N fertilization has been rarely examined, especially at the whole-tree level. Our results on mature trees of ash and larch revealed a general increase of NSC concentrations in aboveground organs but a decrease of NSC concentrations in fine roots after 10 years of N fertilization, largely supporting our first hypothesis. Kaakinen et al. [38] reported similar NSC responses to long-term N fertilization in secondary xylem of stem wood of mature Norway spruce from southern Finland. Normally, mature trees cannot be simply compared to seedlings or saplings. For example, they differ in their carbohydrate allocation and storage pools [10], and their growth and photosynthetic capacity do not scale isometrically with tree size. In addition, mature trees generally have a more constrained growth period and earlier leaf senescence but a disproportionally greater leaf N content than seedlings or saplings [10,47,48,49]. However, when comparing the mature trees of our study to seedlings or saplings of other reports, their overall responses of NSC concentrations to N fertilization were similar. For example, a meta-analysis covering 22 tree species of mainly seedlings or saplings, showed that NSC in roots decreased with N fertilization, but within aboveground woody tissues, NSC increased in the reported cases [27].
At the level of the whole-tree, the general opposite change of NSC concentrations in aboveground woody organs and fine roots following N fertilization is likely driven by different C allocation patterns between the above- and belowground tissues [27,37]. NSC allocation in trees should theoretically follow an optimal partitioning, which means that plants may allocate additional NSC to organs that have a relatively higher metabolic activity [27,50,51]. Under sufficient supply of water and soil nutrients, trees generally allocate more C to the growth of aboveground relative to belowground organs [27,52], which can be further enhanced in response to additional N-fertilization [53], because trees need relatively fewer roots, and less C export to root symbionts to satisfy their N demand [37,54,55].
It has been suggested that NSC tissue concentrations in trees are changing in response to imbalances between C source- (acquisition by photosynthesis) and C sink-activities (demand for growth and respiration processes) [7,10,56]. In the current study, NSC concentrations increased slightly following N fertilization in aboveground organs. At the same time, N fertilization also led to a small increase of stem radial growth in ash (1.8%) and larch (0.6%). Although we measured NSC concentrations only at a single time point (end of season), the higher concentrations at fertilized plots, might suggest that the photosynthetic C supply could easily compensate the slight increase in C demand with N-fertilization. According to high tissue NSC concentrations in control and N-fertilized plots, it is reasonable to assume that mature trees of both investigated species were likely not C limited [56] regardless of the N fertilization treatment.
For belowground organs, a consistently significant decrease of NSC concentrations with N fertilization occurred only in fine roots of larch. Generally, short-term negative C source-sink imbalances can decrease NSC concentrations in plant tissues [57]. However, when the C source-sink imbalance persists over longer time periods, trees often recover their NSC concentrations to levels prior to the C source-sink change [58]. Therefore, low NSC concentration in fine roots of our study might not be caused by long-term C source-sink imbalances but are more likely due to either a change in root anatomy/morphology [41] or a shift in stoichiometry (e.g., an increase in N concentrations). For example, the stronger decrease of NSC in fine roots of larch compared to ash following fertilization was accompanied by a stronger increase of N concentrations in larch than in ash.
4.2. Effects of N Fertilization on N Concentrations and C:N Ratio
In comparison to the non-significant response of aboveground woody organs in our study, foliage and fine root N concentrations tended to respond strongest to long-term N fertilization in mature ash and larch trees (Figure 3), which is in accordance with our second hypothesis. Simultaneous increases of N concentrations in both foliage and fine roots were also observed in temperate and subtropical forests under long-term N fertilization [30,36,37]. This result indicates that long-term N fertilization mainly has a strong influence on the N-accumulation in ephemeral organs such as foliage and fine roots rather than in long-lived woody organs (i.e., stem and branch). Metabolic activities of both foliage and fine roots should be thus facilitated by N fertilization [42,59,60], supporting the theory of functional equilibrium to some extent [61].
C:N ratio is also an indicator for the lifespan of a plant organ. In general, higher C:N ratios are found in organs with longer lifespans [62,63]. Our observations (Figure 4) and those of Li et al. [53] found that C:N ratio largely declined in both foliage and fine roots with long-term N fertilization. The decrease in C:N ratio caused by long-term N fertilization was found to be consistent with the decline of foliage lifespan under 6–11 years of N fertilization in a tropical forest [64]. However, we did not measure the lifespan of foliage or fine roots in the deciduous species observed in our study. Hence, we do not have direct evidence for the assumption that long term N fertilization could shorten the lifespan of ephemeral organs of mature deciduous temperate trees as well.
Total C of plant tissues can be divided between structural (the sum of cell-wall polysaccharides and lignin) and nonstructural C (the sum of organic compounds that are not bound in cell walls, incl. NSC) [65]. In our study, long-term N fertilization induced significant increases of total C in fine roots of larch but decreases of total C in coarse roots of both species and in older stem growth rings of ash. NSC concentrations showed generally an opposite trend to total C concentration in the above-mentioned compartments. Based on the variations of total C and NSC concentrations, the sum of other non-structural compounds and structural carbohydrates, which we did not measure separately, should thus have increased in fine roots but decreased in coarse roots and stem wood following N fertilization. Given that non-structural compounds other than NSC normally resemble only a small proportion of the total C, we assume that the structural carbohydrates (i.e., cellulose, hemicellulose and lignin) were increased in woody tissues but declined in fine roots (only larch) with N fertilization. Previous studies also reported that xylem anatomy, cellulose, hemicellulose and lignin content in trees changed with N fertilization [19,53,66], thereby changing tree resistance to insect and disease infestations [25].
4.3. Correlation of NSC Concentrations and N Concentration
Tissue N concentrations have been previously reported to be closely related to tissue NSC concentrations in trees [18,67]. For example, Cheng et al. [18] found a negative relationship between NSC concentration and N concentration following two months of N fertilization on a whole-tree basis in Malus domestica Borkh. As with above- and belowground organs in our study, the correlation of N and NSC showed an opposite relationship among each involved compartment, with strong negative correlations in fine roots but positive relationships in aboveground woody organs (i.e., branches and stems, Table 3). These results support our third hypothesis. These opposite relationships are likely led by the different allocation patterns of N and NSC among above- and belowground compartments.
Within the complex lateral root branching system, individual roots have different functions depending on their position [45,68,69]. Generally, the first three order roots are typically absorptive roots for the uptake of water and nutrients [41,70,71], and therefore possess a greater effective absorbing surface due to root hairs and high mycorrhizal colonization, as well as an active metabolism for nutrient assimilation and respiration [45,59,68,69,72]. As a result, root tips possess greater concentrations of proteins than higher order roots [73]. In addition, root tips are generally not lignified, therefore they contain much fewer structural tissues that reduce the N concentration per dry mass. Thus, less proteins but higher lignin content generally leads to decreasing tissue N concentrations with increasing root order [19,73,74]. According to the function of NSC to fuel N assimilation, the consumption of NSC should decline with root order, resulting in a generally opposite pattern of NSC and N allocations among fine root compartments and thus a strong negative relationship between NSC and N for each species (Table 3). While for aboveground woody organs, newer tissues have both greater NSC and N concentrations than older ones due to a priority for storage or greater percentage of living cells in the former [75,76]. This may lead to the positive correlation of N and NSC among aboveground woody organs in both control and N fertilized treatments. Overall, the correlation of N and NSC concentrations among aboveground woody organs and among fine roots highlighted that NSC and N allocations are highly influenced by tissue position.
5. Conclusions
Improved N supply by long-term fertilization generally increased NSC concentrations in aboveground organs but decreased them in roots, suggesting that NSC allocation patterns were different between the above- and belowground organs. N fertilization appears to facilitate N accumulation at the whole-tree level due to a general increase of N concentration in each compartment, which benefits metabolism, especially in ephemeral tissues. In addition, compared with C concentrations, which largely varied with tree species and compartments, C:N ratios consistently declined in all compartments (especially in fine roots and foliage) following N fertilization. Different allocation patterns of NSC and N concentrations among aboveground woody organs and among fine root orders resulted in an opposite direction of correlations between N and NSC (mainly soluble sugar) regardless of the fertilized treatments. Following N fertilization, the relationship between N and NSC concentrations was generally strengthened in fine roots but weakened in aboveground woody organs. Our results highlight that long-term N fertilization influences the NSC and N status and their interrelation in mature trees, while the size and direction of the effect depending on tree species and organ type, implying complexity in predicting the responses of plant growth and physiology to N deposition.
Author Contributions
Conceptualization, J.G. and G.H.; Methodology, J.G.; Software, W.W. and S.W.; Validation, W.W.; Formal Analysis, S.W.; Investigation, W.W., Y.W. and G.G.; Resources, J.G.; Data Curation, W.W., Y.W. and G.G.; Writing–Original Draft Preparation, W.W. and H.X.; Writing–Review & Editing, W.W., S.W., G.H. and J.G.; Supervision, J.G. and W.W.; Project Administration, J.G. and W.W.; Funding Acquisition, J.G. and W.W. All authors have read and agreed to the published version of the manuscript.
Funding
This research was funded by the National Natural Science Foundation of China (31901301; 31870608), and Hainan Provincial Natural Science Foundation of China for High-level Talents (2019RC159).
Institutional Review Board Statement
Not applicable.
Informed Consent Statement
Not applicable.
Data Availability Statement
Not applicable.
Acknowledgments
We would like to thank Junnan Li and Lingzhi Xie for their help with field work, Xueyun Dong and Hongfeng Wang for guidance in measurement of carbohydrates and Zhengquan Wang for editing the manuscript and insightful comments.
Conflicts of Interest
The authors declare no conflict of interest.
References
- Chapin, F.S.; Schulze, E.; Mooney, H.A. The ecology and economics of storage in plants. Annu. Rev. Ecol. Syst. 1990, 21, 423–447. [Google Scholar] [CrossRef]
- Pregitzer, K.S.; Euskirchen, E.S. Carbon cycling and storage in world forests: Biome patterns related to forest age. Glob. Change Biol. 2004, 10, 2052–2077. [Google Scholar] [CrossRef]
- Hartmann, H.; Trumbore, S. Understanding the roles of nonstructural carbohydrates in forest trees—From what we can measure to what we want to know. New Phytol. 2016, 211, 386–403. [Google Scholar] [CrossRef] [PubMed] [Green Version]
- Körner, C. Carbon limitation in trees. J. Ecol. 2003, 91, 4–17. [Google Scholar] [CrossRef] [Green Version]
- Würth, M.K.R.; Peláez-Riedl, S.; Wright, S.J.; Körner, C. Non-structural carbohydrate pools in a tropical forest. Oecologia 2005, 143, 11–24. [Google Scholar] [CrossRef] [PubMed]
- Lynch, D.J.; Matamala, R.; Iversen, C.M.; Norby, R.J.; Gonzalez-Meler, M.A. Stored carbon partly fuels fine-root respiration but is not used for production of new fine roots. New Phytol. 2013, 199, 420–430. [Google Scholar] [CrossRef] [PubMed]
- Hoch, G. Carbon reserves as indicators for carbon limitation in trees. In Progress in Botany; Lüttge, U., Beyschlag, W., Eds.; Springer International Publishing: Cham, Switzerland, 2015; pp. 321–346. [Google Scholar] [CrossRef]
- Augusto, L.; Ranger, J.; Dan, B.; Rothe, A. Impact of several common tree species of European temperate forests on soil fertility. Ann. For. Sci. 2002, 59, 233–253. [Google Scholar] [CrossRef] [Green Version]
- Dietze, M.C.; Sala, A.; Carbone, M.S.; Czimczik, C.I.; Mantooth, J.A.; Richardson, A.D. Nonstructural carbon in woody plants. Annu. Rev. Plant Biol. 2014, 65, 667–687. [Google Scholar] [CrossRef] [Green Version]
- Hartmann, H.; Adams, H.D.; Hammond, W.M.; Hoch, G.; Landhäusser, S.M.; Wiley, E.; Zaehle, S. Identifying differences in carbohydrate dynamics of seedlings and mature trees to improve carbon allocation in models for trees and forests. Environ. Exp. Bot. 2018, 152, 7–18. [Google Scholar] [CrossRef]
- Nadelhoffer, K.J. Atmospheric nitrogen deposition: Implications for terrestrial ecosystem structure and functioning. In Acid in the Environment: Lessons Learned and Future Prospects; Visgillio, G.R., Whitelaw, D.M., Eds.; Springer: New York, NY, USA, 2007; pp. 77–95. [Google Scholar] [CrossRef]
- Fujimaki, R.; Sakai, A.; Kaneko, N. Ecological risks in anthropogenic disturbance of nitrogen cycles in natural terrestrial ecosystems. Ecol. Res. 2009, 24, 955–964. [Google Scholar] [CrossRef]
- Pardo, L.H.; Fenn, M.E.; Goodale, C.L.; Geiser, L.H.; Driscoll, C.T.; Allen, E.B.; Baron, J.S.; Bobbink, R.; Bowman, W.D.; Clark, C.M.; et al. Effects of nitrogen deposition and empirical nitrogen critical loads for ecoregions of the United States. Ecol. Appl. 2011, 21, 3049–3082. [Google Scholar] [CrossRef] [Green Version]
- Wallace, Z.P.; Lovett, G.M.; Hart, J.E.; Machona, B. Effects of nitrogen saturation on tree growth and death in a mixed-oak forest. For. Ecol. Manag. 2007, 243, 210–218. [Google Scholar] [CrossRef]
- LeBauer, D.S.; Treseder, K.K. Nitrogen limitation of net primary productivity in terrestrial ecosystems is globally distributed. Ecology 2008, 89, 371–379. [Google Scholar] [CrossRef] [PubMed] [Green Version]
- Bobbink, R.; Hicks, K.; Galloway, J.; Spranger, T.; Alkemade, R.; Ashmore, M.; Bustamante, M.; Cinderby, S.; Davidson, E.; Dentener, F.; et al. Global assessment of nitrogen deposition effects on terrestrial plant diversity: A synthesis. Ecol. Appl. 2010, 20, 30–59. [Google Scholar] [CrossRef] [Green Version]
- De Schrijver, A.; De Frenne, P.; Ampoorter, E.; Van Nevel, L.; Demey, A.; Wuyts, K.; Verheyen, K. Cumulative nitrogen input drives species loss in terrestrial ecosystems. Glob. Ecol. Biogeogr. 2011, 20, 803–816. [Google Scholar] [CrossRef]
- Cheng, L.L.; Ma, F.W.; Ranwala, D. Nitrogen storage and its interaction with carbohydrates of young apple trees in response to nitrogen supply. Tree Physiol. 2004, 24, 91–98. [Google Scholar] [CrossRef] [PubMed] [Green Version]
- Guo, D.L.; Mitchell, R.J.; Hendricks, J.J. Fine root branch orders respond differentially to carbon source-sink manipulations in a longleaf pine forest. Oecologia 2004, 140, 450–457. [Google Scholar] [CrossRef]
- Eyles, A.; Pinkard, E.A.; Mohammed, C. Shifts in biomass and resource allocation patterns following defoliation in Eucalyptus globulus growing with varying water and nutrient supplies. Tree Physiol. 2009, 29, 753–764. [Google Scholar] [CrossRef] [Green Version]
- Kobe, R.K.; Iyer, M.; Walters, M.B. Optimal partitioning theory revisited: Nonstructural carbohydrates dominate root mass responses to nitrogen. Ecology 2010, 91, 166–179. [Google Scholar] [CrossRef]
- Niinemets, Ü.; Tenhunen, J.D.; Canta, N.R.; Chaves, M.M.; Faria, T.; Pereira, J.S.; Reynolds, J.F. Interactive effects of nitrogen and phosphorus on the acclimation potential of foliage photosynthetic properties of cork oak, Quercus suber, to elevated atmospheric CO2 concentrations. Glob. Change Biol. 1999, 5, 455–470. [Google Scholar] [CrossRef]
- Rothstein, D.E.; Zak, D.R.; Pregitzer, K.S.; Peter, S.C. Kinetics of nitrogen uptake by Populus tremuloides in relation to atmospheric CO2 and soil nitrogen availability. Tree Physiol. 2000, 4, 265–270. [Google Scholar] [CrossRef] [Green Version]
- Huttunen, L.; Saravesi, K.; Markkola, A.; Niemela, P. Do elevations in temperature, CO2, and nutrient availability modify belowground carbon gain and root morphology in artificially defoliated silver birch seedlings? Ecol. Evol. 2013, 3, 2783–2794. [Google Scholar] [CrossRef]
- Entry, J.A.; Runion, G.B.; Prior, S.A.; Mitchell, R.J.; Rogers, H.H. Influence of CO2 enrichment and nitrogen fertilization on tissue chemistry and carbon allocation in longleaf pine seedlings. Plant Soil 1998, 200, 3–11. [Google Scholar] [CrossRef]
- Vizoso, S.; Gerant, D.; Guehl, J.M.; Joffre, R.; Chalot, M.; Gross, P.; Maillard, P. Do elevation of CO2 concentration and nitrogen fertilization alter storage and remobilization of carbon and nitrogen in pedunculate oak saplings? Tree Physiol. 2008, 28, 1729. [Google Scholar] [CrossRef] [PubMed]
- Li, W.B.; Hartmann, H.; Adams, H.D.; Zhang, H.X.; Jin, C.J.; Zhao, C.Y.; Guan, D.X.; Wang, A.Z.; Yuan, F.H.; Wu, J.B. The sweet side of global change-dynamic responses of non-structural carbohydrates to drought, elevated CO2, and N fertilization in tree species. Tree Physiol. 2018, 38, 1706–1723. [Google Scholar] [CrossRef] [PubMed]
- Samuelson, L.; Kelly, J.M. Scaling ozone effects from seedlings to forest trees. New Phytol. 2001, 149, 21–41. [Google Scholar] [CrossRef] [PubMed]
- Bragazza, L.; Limpens, J.; Gerdol, R.; Grosvernier, P.; Hájek, M.; Hájek, T.; Hajkova, P.; Hansen, I.; Iacumin, P.; Kutnar, L.; et al. Nitrogen concentration and δ15N signature of ombrotrophic Sphagnum mosses at different N deposition in Europe. Glob. Change Biol. 2005, 11, 106–114. [Google Scholar] [CrossRef]
- Lovett, G.M.; Goodale, C.L. A new conceptual model of nitrogen saturation based on experimental nitrogen addition to an oak forest. Ecosystems 2011, 14, 615–631. [Google Scholar] [CrossRef]
- Field, C. Allocating leaf nitrogen for the maximization of carbon gain: Leaf age as a control on the allocation program. Oecologia 1983, 56, 341–347. [Google Scholar] [CrossRef]
- Anten, N.P.R.; Shieving, F.; Werger, M.J.A. Patterns of light and nitrogen distribution in relation to whole canopy carbon gain in C3 and C4 mono- and dicotyledonous species. Oecologia 1995, 101, 504–513. [Google Scholar] [CrossRef]
- Shipley, B.; Lechowicz, M.J.; Wright, I.J.; Reich, P.B. Fundamental trade-offs generating the worldwide leaf economics spectrum. Ecology 2006, 87, 535–541. [Google Scholar] [CrossRef]
- Mcmurtrie, R.E.; Dewar, R.C. Leaf-trait variation explained by the hypothesis that plants maximize their canopy carbon export over the lifespan of leaves. Tree Physiol. 2011, 9, 1007. [Google Scholar] [CrossRef] [PubMed]
- Reich, P.B.; Walters, M.B.; Ellsworth, D.S. From tropics to tundra: Global convergence in plant functioning. Proc. Natl. Acad. Sci. USA 1997, 94, 13730–13734. [Google Scholar] [CrossRef] [Green Version]
- Burton, A.J.; Jarvey, J.C.; Jarvi, M.P.; Zak, D.R.; Pregitzer, K.S. Chronic N deposition alters root respiration-tissue N relationship in northern hardwood forests. Glob. Change Biol. 2012, 18, 258e266. [Google Scholar] [CrossRef] [Green Version]
- Fan, H.B.; Wu, J.P.; Liu, W.F.; Yuan, Y.H.; Huang, R.Z.; Liao, Y.C.; Li, Y.Y. Nitrogen deposition promotes ecosystem carbon accumulation by reducing soil carbon emission in a subtropical forest. Plant Soil 2014, 379, 361–371. [Google Scholar] [CrossRef]
- Kaakinen, S.; Saranpää, P.; Vapaavuori, E. Effects of growth differences due to geographic location and N-fertilisation on wood chemistry of Norway spruce. Trees 2007, 21, 131–139. [Google Scholar] [CrossRef]
- Wang, Z.Q.; Guo, D.L.; Wang, X.R.; Gu, J.C.; Mei, L. Fine root architecture, morphology, and biomass of different branch orders of two Chinese temperate tree species. Plant Soil 2006, 288, 155–171. [Google Scholar] [CrossRef]
- Gong, Z.T.; Chen, Z.C.; Luo, G.B.; Zhang, G.L.; Zhao, W.J. Soil reference with Chinese soil taxonomy. Soil 1999, 31, 57–63. (In Chinese) [Google Scholar]
- Wang, W.N.; Wang, Y.; Hoch, G.; Wang, Z.Q.; Gu, J.C. Linkage of root morphology to anatomy with increasing nitrogen availability in six temperate tree species. Plant Soil 2018, 425, 189–200. [Google Scholar] [CrossRef]
- Jia, S.X.; Wang, Z.Q.; Li, X.P.; Zhang, X.P. N fertilization affects on soil respiration, microbial biomass and root respiration in Larix gmelinii and Fraxinus mandshurica plantations in China. Plant Soil 2010, 333, 325–336. [Google Scholar] [CrossRef]
- Jia, S.X.; Wang, Z.Q.; Li, X.P.; Zhang, X.P.; Mclaughlin, N.B. Effect of nitrogen fertilizer, root branch order and temperature on respiration and tissue N concentration of fine roots in Larix gmelinii and Fraxinus mandshurica. Tree Physiol. 2011, 31, 718–726. [Google Scholar] [CrossRef] [Green Version]
- Sala, A.; Founts, W.; Hoch, G. Carbon storage in trees: Does relative carbon supply decrease with tree size? In Size- and Age-Related Changes in Tree Structure and Function; Meinzer, F.C., Lachenbruch, B., Dawson, T.E., Eds.; Springer: Dordrecht, The Netherlands, 2011; pp. 287–306. [Google Scholar] [CrossRef]
- Pregitzer, K.S.; Deforest, J.L.; Burton, A.J.; Allen, M.F.; Ruess, R.W.; Hendrick, R.L. Fine root architecture of nine North American trees. Ecol. Monogr. 2002, 72, 293–309. [Google Scholar] [CrossRef]
- Buysse, J.; Roel, M. An improved colorimetric method to quantify sugar content of plant tissue. J. Exp. Bot. 1993, 10, 1627–1629. [Google Scholar] [CrossRef]
- Kozlowski, T.T.; Pallardy, S.G. Growth Control in Woody Plants; Academic Press: San Diego, CA, USA, 1997; pp. 166–172. [Google Scholar] [CrossRef] [Green Version]
- Mediavilla, S.; Escudero, A. Mature trees versus seedlings: Differences in leaf traits and gas exchange patterns in three co-occurring Mediterranean oaks. Ann. For. Sci. 2003, 60, 455–460. [Google Scholar] [CrossRef] [Green Version]
- Gressler, E.; Jochner, S.; Capdevielle-Vargas, R.M.; Morellato, L.P.C.; Menzel, A. Vertical variation in autumn leaf phenology of Fagus sylvatica L. in southern Germany. Agric. For. Meteorol. 2015, 201, 176–186. [Google Scholar] [CrossRef]
- Bloom, A.J.; Chapin, F.S.; Mooney, H.A. Resource limitation in plants—An economic analogy. Annu. Rev. Ecol. Syst. 1985, 16, 363–392. [Google Scholar] [CrossRef]
- Poorter, H.; Niklas, K.J.; Reich, P.B.; Oleksyn, J.; Poot, P.; Mommer, L. Biomass allocation to leaves, stems and roots: Meta-analyses of interspecific variation and environmental control. New Phytol. 2012, 193, 30–50. [Google Scholar] [CrossRef]
- Liu, L.; Greaver, T.L. A global perspective on belowground carbon dynamics under nitrogen enrichment. Ecol. Lett. 2010, 13, 819–828. [Google Scholar] [CrossRef] [PubMed]
- Li, W.B.; Jin, C.J.; Guan, D.X.; Wang, Q.K.; Wang, A.Z.; Yuan, F.H.; Wu, J.B. The effects of simulated nitrogen deposition on plant root traits: A meta-analysis. Soil Biol. Biochem. 2015, 82, 112–118. [Google Scholar] [CrossRef]
- Haynes, B.E.; Gower, S.T. Belowground carbon allocation in unfertilized and fertilized red pine plantations in northern Wisconsin. Tree Physiol. 1995, 15, 317–325. [Google Scholar] [CrossRef]
- Giardina, C.; Ryan, M.; Binkley, D.; Fownes, J. Primary production and carbon allocation in relation to nutrient supply in a tropical experimental forest. Glob. Change Biol. 2003, 9, 1438–1450. [Google Scholar] [CrossRef] [Green Version]
- Piper, F.I.; Cavieres, L.A.; Reyes-Díaz, M.; Corcuera, L.J. Carbon sink limitation and frost tolerance control performance of the tree Kageneckia angustifolia D. Don (Rosaceae) at the treeline in central Chile. Plant Ecol. 2006, 185, 29–39. [Google Scholar] [CrossRef]
- Maguire, A.J.; Kobe, R.K. Drought and shade deplete nonstructural carbohydrate reserves in seedlings of five temperate tree species. Ecol. Evol. 2015, 5, 5711–5721. [Google Scholar] [CrossRef]
- Weber, R.; Gessler, A.; Hoch, G. High carbon storage in carbon limited trees. New Phytol. 2019, 222, 171–182. [Google Scholar] [CrossRef] [Green Version]
- Ryan, M.G.; Hubbard, R.M.; Pongracic, S.; Raison, R.J.; McMurtrie, R.E. Foliage, fine-root, woody-tissue and stand respiration in Pinus radiata in relation to nitrogen status. Tree Physiol. 1996, 16, 333–343. [Google Scholar] [CrossRef] [PubMed]
- Li, H.; Li, M.C.; Luo, J.; Cao, X.; Qu, L.; Gai, Y.; Jiang, X.N.; Liu, T.X.; Bai, H.; Janz, D.; et al. N-fertilization has different effects on the growth, carbon and nitrogen physiology, and wood properties of slow- and fast-growing populus species. J. Exp. Bot. 2012, 63, 6173–6185. [Google Scholar] [CrossRef] [PubMed]
- Brouwer, R. Functional equilibrium: Sense or nonsense? Neth. J. Agric. Sci. 1983, 31, 335–348. [Google Scholar] [CrossRef]
- Withington, J.M.; Reich, P.B.; Oleksyn, J.; Eissenstat, D.M. Comparisons of structure and life span in roots and leaves among temperate trees. Ecol. Monogr. 2006, 76, 381–397. [Google Scholar] [CrossRef]
- Mccormack, M.L.; Adams, T.S.; Smithwick, E.A.H.; Eissenstat, D. Predicting fine root lifespan from plant functional traits in temperate trees. New Phytol. 2012, 195, 823–831. [Google Scholar] [CrossRef]
- Harrington, R.A.; Fownes, J.H.; Vitousek, P.M. Production and resource use efficiencies in N- and P-limited tropical forests: A comparison of responses to long-term fertilization. Ecosystems 2001, 4, 646–657. [Google Scholar] [CrossRef]
- Niinemets, Ü.; Kull, O. Stoichiometry of foliar carbon constituents varies along light gradients in temperate woody canopies: Implications for foliage morphological plasticity. Tree Physiol. 1998, 7, 467–479. [Google Scholar] [CrossRef] [PubMed] [Green Version]
- Pitre, F.E.; Lafarguette, F.; Boyle, B.; Pavy, N.; Caron, S.; Dallaire, N.; Poulin, P.; Ouellet, M.; Morency, M.; Wiebe, N.; et al. High nitrogen fertilization and stem leaning have overlapping effects on wood formation in poplar but invoke largely distinct molecular pathways. Tree Physiol. 2010, 30, 1273–1289. [Google Scholar] [CrossRef] [PubMed] [Green Version]
- Cheng, L.; Fuchigami, L.H. Growth of young apple trees in relation to reserve nitrogen and carbohydrates. Tree Physiol. 2002, 22, 1297. [Google Scholar] [CrossRef] [Green Version]
- Comas, L.H.; Bouma, T.J.; Eissenstat, D.M. Linking root traits to potential growth rate in six temperate tree species. Oecologia 2002, 132, 34–43. [Google Scholar] [CrossRef]
- Wells, C.E.; Eissenstat, D.M. Beyond the roots of young seedlings: The influence of age and order on fine root physiology. J. Plant Growth Regul. 2003, 21, 324–334. [Google Scholar] [CrossRef]
- Guo, D.L.; Xia, M.X.; Wei, X.; Chang, W.J.; Liu, Y.; Wang, Z.Q. Anatomical traits associated with absorption and mycorrhizal colonization are linked to root branch order in twenty-three Chinese temperate tree species. New Phytol. 2008, 180, 673–683. [Google Scholar] [CrossRef] [PubMed]
- Valenzuela-Estrada, L.R.; Vera-Caraballo, V.; Ruth, L.E.; Eissenstat, D.M. Fine roots have different morphology on their complex lateral branching system: Root anatomy, morphology, and longevity among root orders in Vaccinium corymbosum (Ericaceae). Am. J. Bot. 2008, 95, 1506–1514. [Google Scholar] [CrossRef] [PubMed] [Green Version]
- Pregitzer, K.S.; Laskowski, M.J.; Burton, A.J.; Lessard, V.C.; Zak, D. Variation in sugar maple root respiration with root diameter and soil depth. Tree Physiol. 1998, 18, 665–670. [Google Scholar] [CrossRef] [Green Version]
- Jia, S.X.; Mclaughlin, N.; Gu, J.C.; Li, X.P.; Wang, Z.Q. Relationships between root respiration rate and root morphology, chemistry and anatomy in Larix gmelinii and Fraxinus mandshurica. Tree Physiol. 2013, 33, 579–589. [Google Scholar] [CrossRef] [Green Version]
- Mei, L.; Xiong, Y.M.; Gu, J.C.; Wang, Z.Q.; Guo, D.L. Whole-tree dynamics of non-structural carbohydrate and nitrogen pools across different seasons and in response to girdling in two temperate trees. Oecologia 2015, 177, 333–344. [Google Scholar] [CrossRef]
- Ceschia, É.; Damesin, C.; Lebaube, S.; Pontailler, J.Y.; Dufrêne, É. Spatial and seasonal variations in stem respiration of beech trees (Fagus sylvatica). Ann. For. Sci. 2002, 59, 801–812. [Google Scholar] [CrossRef] [Green Version]
- Lacointe, A.; Kajji, A.; Daudet, F.A.; Archer, P.; Frossard, J.S.; Saint-Joanis, B.; Vandame, M. Mobilization of carbon reserves in young walnut trees. Acta Bot. Gall. 1993, 140, 435–441. [Google Scholar] [CrossRef]
Publisher’s Note: MDPI stays neutral with regard to jurisdictional claims in published maps and institutional affiliations. |
© 2022 by the authors. Licensee MDPI, Basel, Switzerland. This article is an open access article distributed under the terms and conditions of the Creative Commons Attribution (CC BY) license (https://creativecommons.org/licenses/by/4.0/).