Article

Origin, Persistence, and Vulnerability to Climate Changes of Podocarpus Populations in Central African Mountains

by
Jérémy Migliore
1,2,3,*,
Anne-Marie Lézine
2,
Michel Veuille
4,5,
Gaston Achoundong
6,
Barthélémy Tchiengué
6,
Arthur F. Boom
1,
Franck K. Monthe
1,7,
Gaël U. D. Bouka
8,
Stephen F. Omondi
9,
Lawrence Wagura
10,
Francisco Maiato P. Gonçalves
11,12,
Tariq Stévart
13,14,15,
João N. M. Farminhão
13 and
Olivier J. Hardy
1
1
Service Evolution Biologique et Ecologie, Faculté des Sciences, Université Libre de Bruxelles, 1050 Brussels, Belgium
2
Laboratoire d’Océanographie et du Climat—Expérimentations et Approches Numériques (LOCEAN/IPSL), CNRS UMR 7159, Sorbonne Université, 75006 Paris, France
3
Muséum Départemental du Var, Jardin Départemental du Las, 737 Chemin du Jonquet, 83200 Toulon, France
4
Institut de Systématique, Évolution, Biodiversité (ISYEB), UMR 7205—CNRS, MNHN, SU, EPHE, UA, Sorbonne Université, 75006 Paris, France
5
Ecole Pratique des Hautes Etudes (EPHE), Paris Sciences et Lettres University (PSL), 75006 Paris, France
6
Herbier National du Cameroun, Institut de Recherche Agricole pour le Développement, Yaoundé P.O. Box BP 2123, Cameroon
7
Nature + asbl/TERRA Research Centre, Central African Forests, Gembloux Agro-Bio Tech, Université de Liège, 5030 Gembloux, Belgium
8
Laboratoire de Botanique et Ecologie, Faculty of Sciences and Techniques, Marien Ngouabi University, Brazzaville P.O. Box 69, Congo
9
Forest Genetics and Tree Improvement, Kenya Forestry Research Institute, Nairobi 20412-00200, Kenya
10
Natural Africa Concern, Nairobi P.O. Box 28513, Kenya
11
Biocenter Klein Flottbek and Botanical Garden (BioZ Flottbek), University of Hamburg, 22609 Hamburg, Germany
12
Herbarío do Lubango, ISCED-Huíla, Rua Sarmento Rodrigues S/N, Lubango, Angola
13
Herbarium et Bibliothèque de Botanique Africaine, Université Libre de Bruxelles, 1050 Brussels, Belgium
14
Africa and Madagascar Department, Missouri Botanical Garden, St. Louis, MO 63110, USA
15
Botanic Garden Meise, 1860 Meise, Belgium
*
Author to whom correspondence should be addressed.
Forests 2022, 13(2), 208; https://doi.org/10.3390/f13020208
Submission received: 13 May 2021 / Revised: 17 January 2022 / Accepted: 19 January 2022 / Published: 29 January 2022
(This article belongs to the Special Issue Past Environmental Changes and Forest Conservation)

Abstract

:
Background and objectives—Podocarpus latifolius (synonym of P. milanjianus) is a key tree representative of Afromontane forests where it is highly threatened by climate and land-use changes. While large populations occur in East Africa, only a few isolated and usually small populations remain in western Central Africa (Cameroon to Angola). Studying the evolutionary history of such relictual populations can thus be relevant to understand their resilience under changing environments. Materials and Methods—we developed nine polymorphic nuclear microsatellites (nSSRs) to estimate genetic variability, (historical) gene flow, and demographic changes among natural populations from Central to East Africa. Results—despite the extended distribution range of P. latifolius, a strong isolation-by-distance pattern emerges at the intra-population scale, indicating low seed and pollen dispersal capacities. Central African populations display a lower genetic diversity (He = 0.34 to 0.61) and are more differentiated from each other (FST = 0.28) than are East African populations (He = 0.65 to 0.71; FST = 0.10), suggesting high genetic drift in the Central African populations. Spatial genetic structure reveals past connections between East and West Africa but also a gene flow barrier across the equator in western Central Africa. Demographic modelling anchors the history of current lineages in the Pleistocene and supports a strong demographic decline in most western populations during the last glacial period. By contrast, no signature of demographic change was detected in East African populations. Conclusions—in Cameroon, our results exclude a recent (re)colonization from one source population of all mountain ranges, but rather indicate long-term persistence of populations in each mountain with fluctuating sizes. A higher impact of genetic drift and further loss of diversity can be expected by survival through climatically unfavorable periods in such small refugial populations. Tracking the Quaternary legacy of podocarp populations is thus essential for their conservation since there is a temporal gap between environment crises and an ecological/genetic answer at the population level.

1. Introduction

Among Afromontane forest trees, Podocarpus latifolius (Thunb.) R. Br. ex Mirb. (Podocarpaceae; synonym of P. milanjianus Rendle) is a gymnosperm characterized by an extended geographic range from Cameroon to Angola in western Central Africa and from Rwanda to Kenya south to the Cape Region in East and Southern Africa. However, Afromontane forests are patchily distributed, bounded at higher elevation by Afroalpine grasslands and an ericaceous belt, and at lower elevation by sub-montane forests and savannas, which form the transition with lowland rain and seasonal forests [1]. Besides being regarded as hotspots of biodiversity acting simultaneously as cradles and museums of tropical African plant biodiversity [2,3,4], Afromontane forests also constitute sentinel ecosystems, responding rapidly to environmental changes affecting our biosphere [5,6]. While P. latifolius populations can be locally extensive in East Africa, most are extremely reduced in western Central Africa, often appearing as relictual populations in mountains [7]. In Cameroon, P. latifolius populations are highly fragmented, growing exclusively between 850 and 2900 m a.s.l. along the Cameroon Volcanic Line in populations rarely exceeding several tens of trees, except in Mount Oku where there is still a unique large stand. These populations appear highly threatened by climate and land-use changes in one of the most populated regions of Cameroon. However, fossil pollen records indicate that podocarps have been abundant in western Central Africa during various periods of the Quaternary, until the end of the African Humid Holocene [8,9,10]. In this context, studying their evolutionary history can be relevant to understanding their resilience under changing environments and to improving conservation policy.
Pollen records from African highlands suggest different regional responses of montane forest ecosystems to glacial-interglacial alternation. In Eastern Africa, the altitudinal shift of vegetation belts is well recognized in response to Quaternary climate oscillations [11], except in the Eastern Arc region where relative stability of forest composition has been observed during the past 48 kyrs [12]. However, any extrapolation from East to Central Africa remains very difficult and even inaccurate [13] because of distinct climatic and environmental conditions, and the existence of two distinct podocarps genera (Podocarpus and Afrocarpus) and several species with the same palynological signature in eastern Africa but distinct ecological requirements. In southwestern Central Africa, a wide expansion of podocarps in the lowlands has been documented during the last glacial period in Angola, the Republic of the Congo, and Gabon, but not north of the equator in Cameroon [8]. There, a 90 kyrs continental paleoecological record (Lake Bambili, in Cameroon) shows that the podocarp mountain forests present today on the Cameroon volcanic line are not glacial relicts but persisted at varying extents at the same altitude level throughout this period [10]. After a mid-Holocene optimum for podocarp forests, their current fragmented distribution is thought to result from the last environmental crisis at the end of the Holocene Humid Period 3.3 kyrs ago [9,14,15].
The phylogeographic structure detected in P. latifolius, using plastomes, nuclear ribosomal and mitochondrial DNA regions, suggests that most of the current populations in Africa diverged from each other c. 200 to 300 kyrs ago after a large-scale range expansion [16]. Hence, despite the ancient history of podocarps in Africa revealed by paleobotanical records, the extensive distribution of current P. latifolius lineages is shown to result from more recent history, mostly during the mid-late Pleistocene. Phylogenomic data also revealed the imprints left by past gene flow barriers between East Africa and western Central Africa, and to a lesser extent on both sides of the equator between Cameroon and the Republic of the Congo/Angola in the west. However, at this genomic scale, it is still difficult to determine when and how the current isolation of populations in each mountain range occurred. Furthermore, to what extent fragmented populations are connected through gene flow is also unknown. Podocarpus latifolius seeds are fleshy and dispersed by birds [17,18], which can lead to short or long-distance dispersal, depending on bird behavior [19]. Although Podocarpus pollen grains bear characteristic air-bladders, pollen deposits on the ground decline very rapidly as one moves away from adult trees, indicating a short-distance dispersal [20,21]. However, long-distance dispersal for a small fraction of pollen grains taken in strong wind is also likely, leading to a fat-tailed dispersal pattern and explaining the abundance of podocarp pollen in oceanic sediments [8]. Whether such long-distance dispersal contributes to gene flow between fragmented populations remains unknown, the answer depending also on flowering synchronicity.
We aim to assess the imprints left by past climate changes on the persistence of Afromontane populations of P. latifolius throughout western Central and East Africa, and the current population connectivity, to better evaluate the species’ vulnerability to environmental changes. To this end, we developed new nuclear microsatellite markers (nSSRs) to investigate phylogeographic patterns and recent gene flow at different spatial scales. Indeed, nSSRs proved useful to estimate the scale of gene dispersal (e.g., [22]) as well as to detect past events of population fragmentation, colonization, and/or demographic changes, and date those events using coalescent simulations [23,24,25]. We genotyped a total of 270 P. latifolius individuals mainly from eight western Central African populations and four East African populations to address the following questions: (1) Is genetic diversity correlated with the current population size, which differs between East and western Central Africa? (2) Does a fine-scale genetic structure occur within populations, indicating limited seed and pollen dispersal? (3) Are scattered populations of the Cameroon Volcanic Line connected through gene flow? (4) Does genetic differentiation among western Central African and East African populations reveal past migration routes? (5) Is there a signature of drastic demographic decline at the end of the Holocene, or an earlier period? If so, does it vary among regions?

2. Materials and Methods

2.1. Nuclear Microsatellites Development

To identify and select nuclear microsatellite markers (nSSR) specific to P. latifolius, we used non-enriched genomic libraries of two P. latifolius samples from Cameroon (POD03-MV02 sample) and Equatorial Guinea (POD04-CM186) that were previously sequenced on an NextSeq platform (Illumina, San Diego, CA, USA), paired-end 2 × 150 bp, with 1,483,618 R1-R2 reads and 1,565,092 R1-R2 reads, respectively [16]. Each genomic library was pair-assembled with PANDAseq [26], to use the software QDD with default settings [27] and launch SSR detection, elimination of similar sequences, and primer design steps. We detected 37,564 SSR primer combinations, before filtering them with these main criteria: (i) eliminating duplicate primers for the same microsatellite locus, (ii) having primers located at least 20 bp from the pure SSR motif, (iii) reaching at least eight di- or trinucleotide repeats, (iv) providing PCR products 130–300 bp long, and (v) avoiding the formation of self-dimers (tested using Multiple Primer Analyzer, Thermo Fisher Scientific, https://www.thermofisher.com, accessed on 25 January 2022). To facilitate multiplexing in the next steps, we selected 48 loci showing a good distribution of PCR product sizes for amplification tests. We labeled them with the fluorochromes FAM, NED, VIC, or PET by adding one of the four possible linkers Q1–Q4 [28] to the 5′ end of the forward primer. Amplification tests were performed on two individuals of P. latifolius (JM0903 from Cameroon and JM1043 from Kenya) in 13-μL PCR reactions with the following conditions: 0.08 μL of TopTaq DNA Polymerase (5 U/μL; QIAGEN, Venlo, The Netherlands), 1.5 μL of buffer (10×), 0.6 μL of MgCl2 (25 mM), 0.45 μL of dNTPs (10 mM each), 0.3 μL of each primer (0.2 μM), 1 μL of template DNA (of c. 10–50 ng/μL), and 8.77 μL of water. PCR conditions were: 94 °C (4 min); 30 cycles of 94 °C (30 s), 55 °C (45 s), and 72 °C (1 min); and a final extension at 72 °C (10 min). All the nSSR loci were amplified after testing them on QIAxcel Advanced System (QIAGEN, Germantown, MD, USA), so four samples were then tested adding fluorescent primers (JM0903 Cameroon, JM1043 Kenya, JM0871 Angola, OH3600 South Africa) on ABI3730 sequencer (Applied Biosystems, Lennik, The Netherlands) to check amplicon sizes (PCR conditions below). Several combinations of primers were tested to select finally nine nSSR loci, minimizing the number of PCR reactions with the higher number of nSSR regions examined, and exhibiting interpretable electropherograms showing allelic polymorphism. These loci were amplified in two multiplexed reactions (Supplementary Materials, Table S1), optimized using Multiplex Manager 1.0 [29].

2.2. Population Sampling and Nuclear Microsatellites Genotyping

Leaf or cambium samples of P. latifolius were collected in the main Afromontane blocks of the western Central African region (four sites in Cameroon CM, three sites in the Republic of the Congo CG, and one site in Angola AO), and in four East African sites (three sites in Kenya KE, one site in Rwanda RW), sampling 8 to 37 samples per population (Figure 1, Table S2). Whenever possible, GPS coordinates were taken for each sample.
We genotyped 270 samples with the nine newly developed nSSR markers. Total genomic DNA was extracted from 15–25 mg of dried leaves or cambial tissue, using the Nucleospin 96 Plant II kit (Macherey-Nagel, Duren, Germany) following the manufacturer’s instructions. PCR reactions were performed using the nine multiplexed nSSR loci in 15-μL total volumes: 0.15 μL of the reverse and 0.1 μL of the forward (0.2 μM for both) microsatellite primers, 0.15 μL of Q1–Q4 labeled primers (0.2 μM each), 7.5 μL of Type-it Microsatellite PCR Kit (QIAGEN), 3.6 μL of H2O, and 1.5 μL of DNA extract. PCR conditions were: 3-min initial denaturation at 94 °C; followed by 25 cycles of 94 °C for 30 s, 55 °C for 45 s, and 72 °C for 1 min; 10 cycles of 94 °C for 30 s, 53 °C for 45 s, and 72 °C for 1 min; and a final elongation step at 72 °C for 30 min. All individuals were genotyped on an ABI3730 sequencer at the Evolutionary Biology and Ecology Unit, Université Libre de Bruxelles (Belgium) using 0.8 μL of each PCR product, 12 μL of Hi-Di formamide (Life Technologies, Carlsbad, CA, USA), and 0.3 μL of Map-Marker 500 labeled with DY-632 (Eurogentec, Seraing, Belgium).
The data generated for each specimen were scored using the microsatellite plugin 1.4.6 in Geneious 9.1.6 [30]. Failed amplification at a locus was scored as missing data in each specimen data file.

2.3. Genetic Diversity and Fine-Scale Genetic Structure within Populations

For each population (n = 247 individuals), the following multilocus genetic diversity parameters were computed: the number of alleles (NA), allelic richness (AR), expected heterozygosity (He), observed heterozygosity (Ho), and individual inbreeding coefficient (Fi). Differentiation between pairs of populations was computed using FST and the phylogeographic signal was checked by computing RST, which takes allele sizes into account and is expected to be larger than FST if mutations (under the stepwise mutation model) have contributed to the differentiation [31]. Allele size permutation tests allowed to assess if RST was significantly larger than FST. All computations were performed with SPAGeDi 1.5 [32].
We followed the approach of [22] to characterize the spatial genetic structure within each population represented by at least 30 individuals (Oku in CM, Maba Moubou and Kouyi in CG, Kereita and Taita Hills, combining KEnga et KEmsi, in KE; 6 out of 12). To this end, we computed pairwise kinship coefficients (Fij) for all pairs of individuals from the same population (using J. Nason’s estimator in software SPAGeDi [32]) and regressed them on the logarithm of the spatial distance, giving the slope b. Fij values were averaged over a set of spatial distance intervals to show how kinship decays with distance, and the strength of the spatial genetic structure was quantified by the statistic Sp = −b/(1 − F(1)), where F(1) is the average kinship coefficient between nearby individuals (here between 10 and 100 m).

2.4. Genetic Structure

To characterize the genetic relationships between populations, a discriminant analysis of principal components (DAPC) was done using 229 samples of P. latifolius from the 12 mains populations distributed in western Central and East Africa (balancing the sampling effort between populations). The DAPC multivariate method relies on data transformation using principal component analysis as a prior step to discriminant analysis, to explore genetic structure without any explicit evolutionary models and underlying assumptions (R3.6.0: adegenet package; R Development Core Team; [33]).
In addition, Bayesian clustering analyses were performed with Structure 2.3.4 [34]. Using the admixture and independent allele frequencies models, K = 1 to 20 genetic clusters were tested with a burn-in period of 100,000 generations for a total of 1,000,000 generations, and 10 runs at each K. In order to select the optimal number of K we used StructureHarvester [35] to plot the following statistics against K: log-likelihood of the data Ln(P), deltaK [36], measuring the increment in the probability of the data at each K, and the geographic congruence of the genetic clusters. To better depict the structure occurring in western Central Africa, we ran again the analyses using only the samples from this area (n = 189 including herbarium specimens; Table S2).

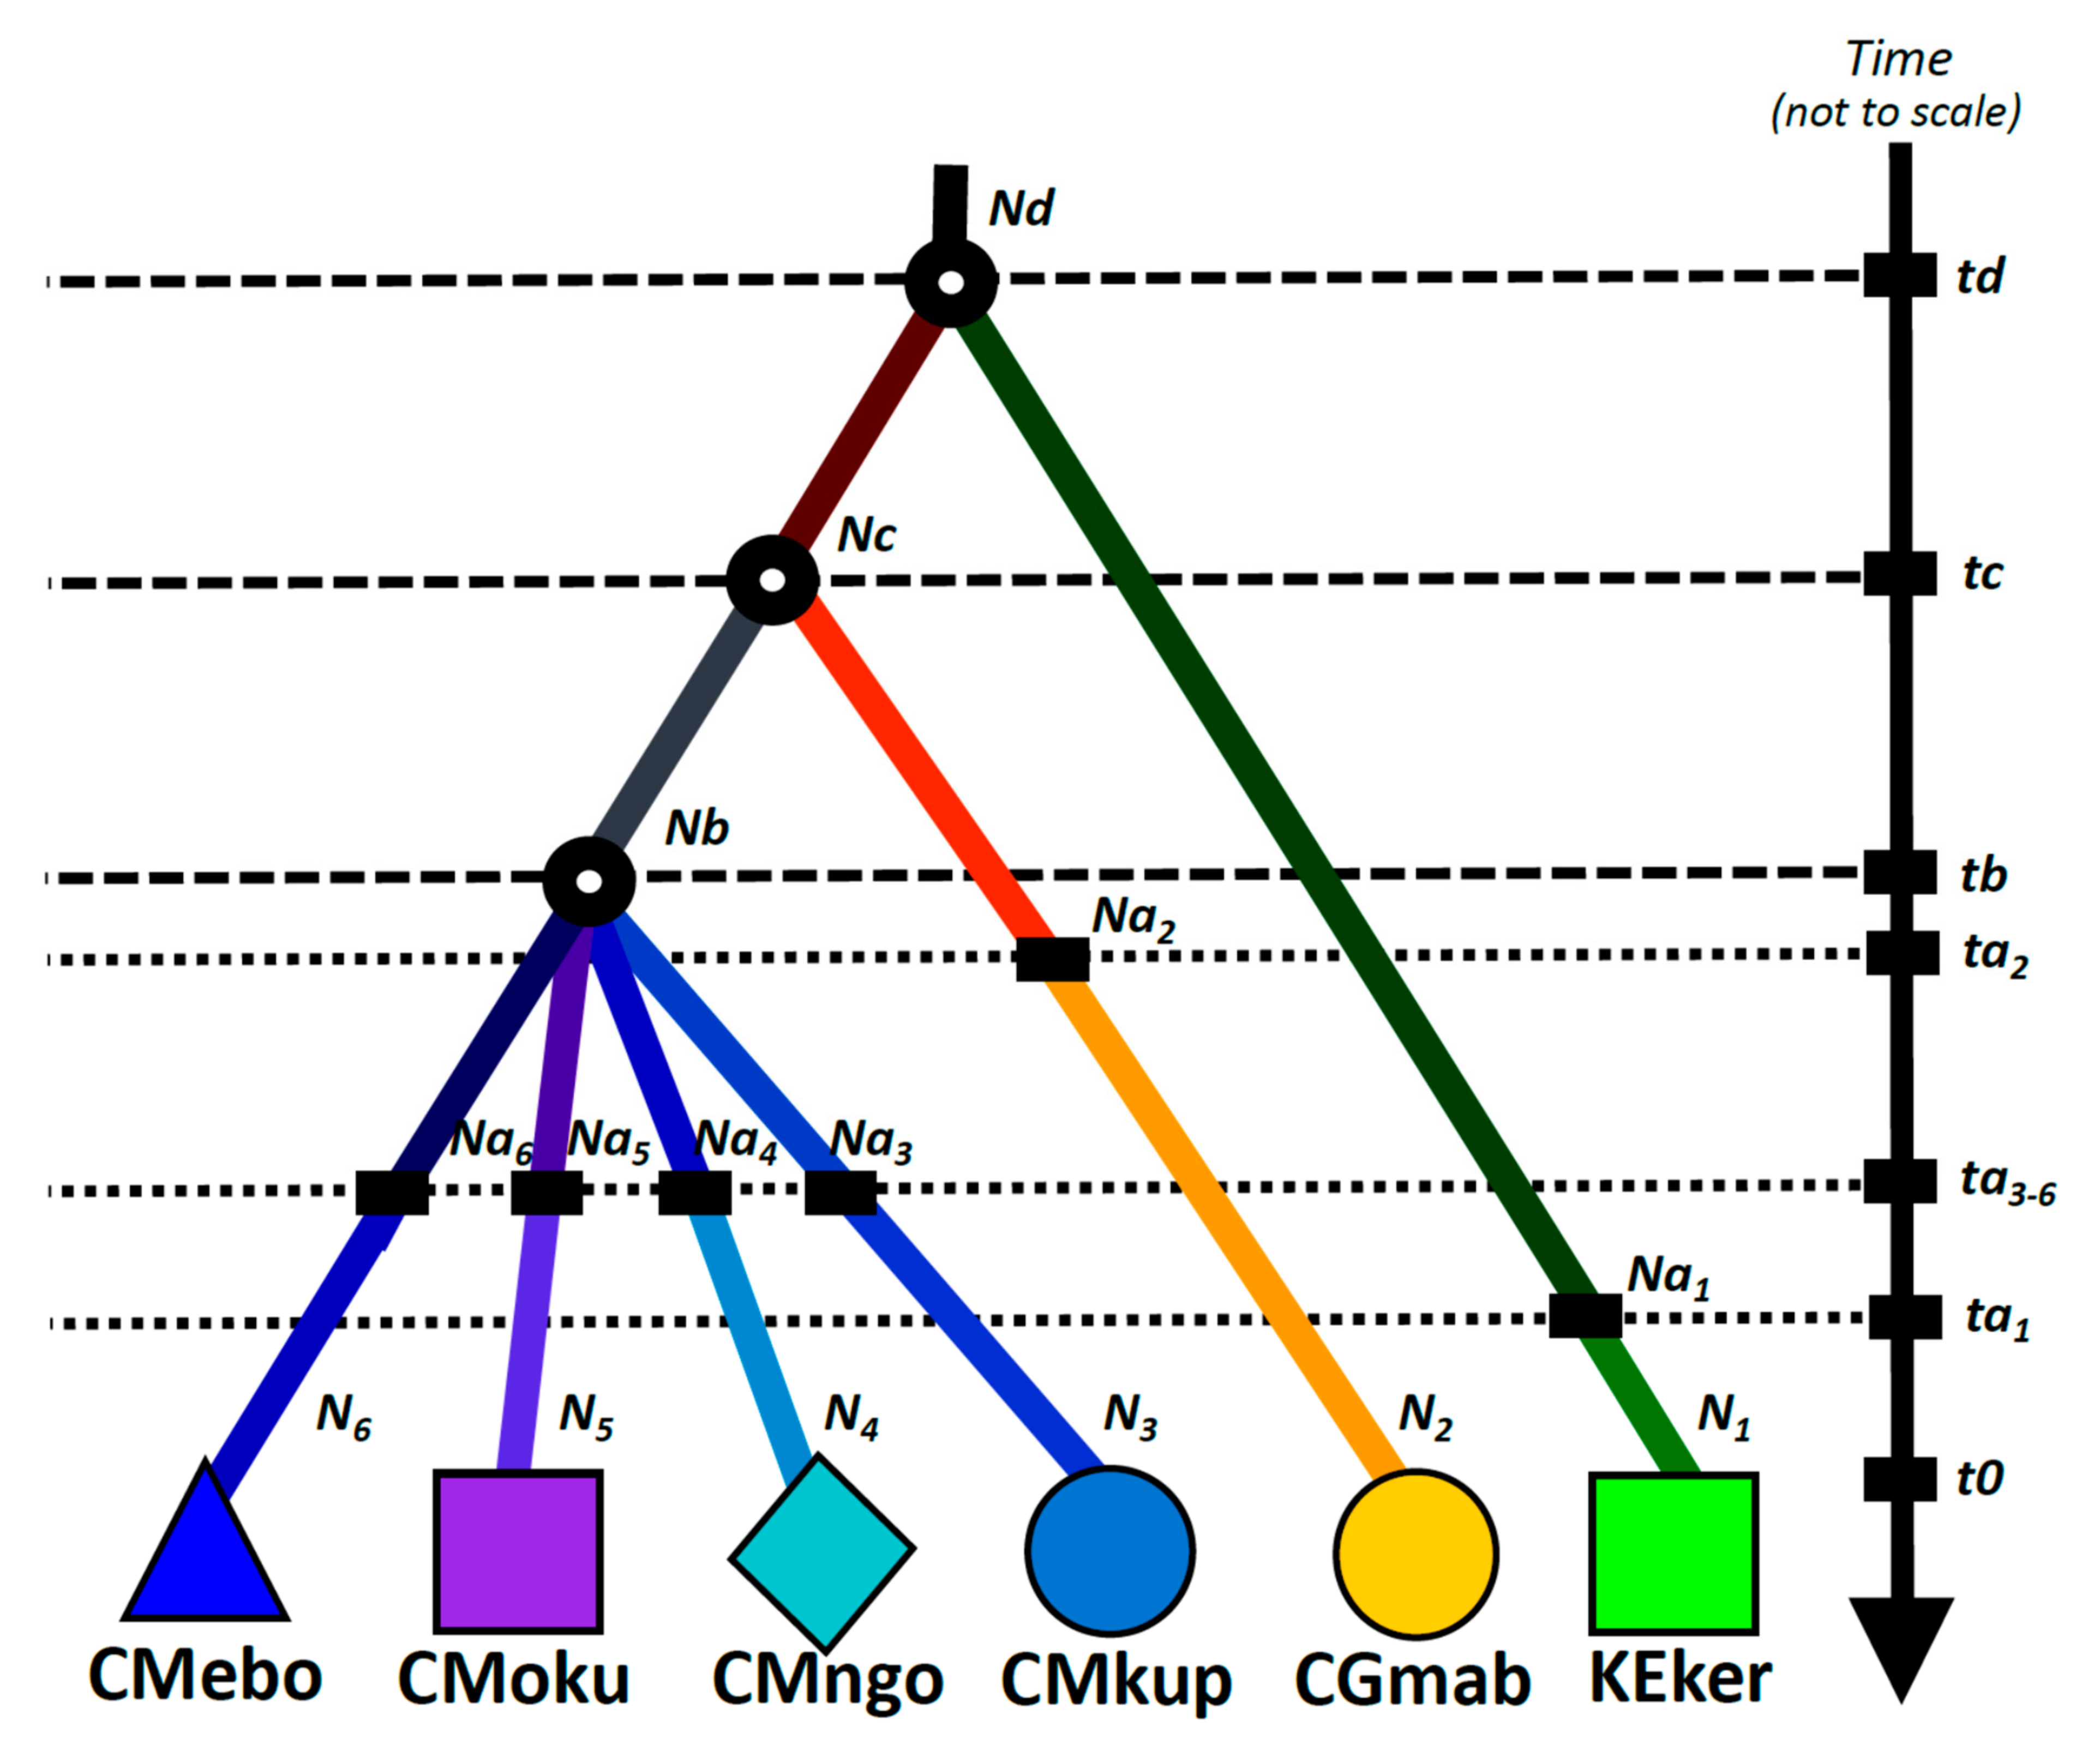
2.5. Demographic Inference

The demographic history of P. latifolius was investigated with DIYABC 2.1.0 beta [37,38] with a focus on populations from Cameroon to assess their divergence time and populations dynamics, as well as their relationship to East African populations. Nuclear SSR datasets were simulated under different demographic scenarios (coalescent simulations) and compared to the real dataset using summary population genetics statistics (approximate Bayesian computation, ABC) in order to estimate the most likely scenario. We investigated both when the actual sampled populations diverged and their demographic history. A two-step simulation process was tested. First, we included only Cameroonian populations (CMebo in Ebo Mt, CMkup in Kupé Mt, CMngo in Ngoro Mt, CMoku in Oku Mt) to evaluate the timescale of fragmentation events (scenario 1; from the last Holocene environmental crisis to the Glacial Maximum, or scenario 2; before 250 kyrs). We considered only a simultaneous split of Cameroonian populations since the similarity in pairwise FST (range 0.20–0.28) does not suggest a hierarchical order of population splits. Second, we added one population from the Republic of the Congo (CGmab) and one from Kenya (KEker) to assess their relationship with Cameroonian populations and to estimate the global temporal scale of diversification of these representative populations. Here we compared two alternative models, where the population from Kenya separates first, followed by the population from the Republic of the Congo, or in the reverse order, while Cameroonian populations split last and simultaneously.
The prior microsatellite mutation rate per generation across loci followed a log-uniform distribution (from 10−5 to 10−4), after preliminary tests having excluded values higher than 10−4. One million genetic datasets were simulated per scenario. The posterior probabilities of each scenario and the respective demographic parameters were estimated using local logistic regression [37]. Confidence for a scenario was the number of “pseudo-observed” datasets drawn from this scenario and correctly assigned to it. Confidence in parameter estimates was calculated as mean bias (difference between the estimated and the “true value” divided by the “true value”) and factor 2 (proportion of estimated values falling 50–200% of the “true value”). Time parameters were estimated in generations and their conversion into years depends on the actual generation time of P. latifolius, which is difficult to assess. In South African forests, tree ring counts gave a median age close to 100 years for trees with a diameter at breast height (dbh) ranging from 5 to 100 cm and a median dbh of 23 cm [17]. Similar dbh distributions were encountered in the sampled Kenyan populations (results not shown) but in Cameroon and the Republic of Congo, the median dbh was close to 12 cm and trees rarely exceeded a dbh of 40 cm (results not shown) despite the absence of evidence of logging. Therefore, as we focus on western Central African populations, we assumed a generation time of 50 years.

3. Results

3.1. Genetic Diversity and Fine-Scale Genetic Structure within Populations

The nine nuclear microsatellite markers genotyped for 247 samples of P. latifolius exhibited 4–18 alleles per locus (average number of alleles per locus = 12, total number of alleles = 112). East African populations (Kenya and Rwanda) had a higher allelic richness and expected heterozygosity (AR for a resampling of 6 allele copies between 3.21 and 3.55 and He between 0.65 and 0.71) than populations from western Central Africa (AR between 1.87 and 3.02 and He between 0.34 and 0.61) where the largest population of Mt Oku (CMoku) hosted the highest genetic diversity (Table 1).
A signal of isolation by distance was detected within the six populations represented by at least 30 samples (the nearby Kenyan populations KEnga and KEmsi were grouped for this purpose), except in Oku population in Cameroon (Figure 2). For the other populations, the spatial genetic structure intensity (Sp), based on the significant decay of pairwise kinship coefficients with the logarithm of spatial distance, ranged from 0.01 ** (KEker) to 0.02 *** (KEtai) in the East and from 0.01 *** (CGkou) to 0.03 *** (CGmab) in the west (** p < 0.01; *** p < 0.001).

3.2. Genetic Structure

Pairwise FST indices ranged from 0.08 to 0.14 between East African populations, 0.08 to 0.19 between Congolese populations, and 0.19 to 0.28 between Cameroonian populations (Table 2). The highest FST values were detected between Cameroonian and Congolese or Angolan populations (0.25–0.45). RST values followed the same trends, and allele permutation tests showed that they were not significantly higher than FST values (Table 2), indicating that allele size does not bring additional information and that genetic differentiation was mostly driven by genetic drift rather than stepwise mutations. Pairwise population genetic differentiation remained low even at high spatial distances (c. 1000 km) in East Africa, contrary to what we observed in western Central Africa where even populations separated by less than 50 km showed FST values approaching 0.2 (Figure 3).
The ordination of populations along the first two axes of the DAPC clearly shows two gradients of genetic differentiation (Figure 4). Axis 1 shows that populations from the Republic of the Congo (CG) are more genetically similar to samples from Angola (AO), but also to Rwandan (RW) and East African populations. Populations from Cameroon (CM) and Kenya (KE) are separated along axis 2. Axis 3 further separates the Cameroonian populations from each other (Figure S1). Thus, if populations from western Central Africa originate from East Africa, they seem to have taken two independent colonization pathways, and current or past gene flow between Cameroonian populations and those from the Republic of the Congo or Angola seems unlikely or was very limited.
According to genetic clustering analyses using Structure, when increasing K from two to six on western Central African samples, one major gene flow barrier separated Cameroonian from Congolese and Angolan populations (K = 2), then populations corresponding to different mountain ranges in Cameroon were progressively separated (from K = 3 to K = 4, and K = 6) while Angolan and Congolese samples segregated in distinct clusters at K = 5 (Figure S2).

3.3. Demographic Inference

Preliminary analyses with DIYABC using only the four Cameroonian populations indicated a population decline but rejected scenario 1 of a demographic change related to the last Holocene environmental crisis in favor of a more ancient bottleneck event (Table S3). These prior analyses allowed us to adjust the final DIYABC simulation parameters for modeling the population history, now also including the Congolese and Kenyan populations (Table 3, Figure 5). We assumed that the four Cameroonian populations underwent a demographic change synchronously (regional effect) while demographic changes in the Congolese and Kenyan populations were allowed at other times (Figure 5).
The scenario where the Kenyan population diverged first from all other populations received more support than the scenario assuming that the Congolese population diverged first (posterior probabilities of 0.64 vs. 0.36 for comparison of scenarios with logistic approach). The inferred current effective sizes of populations follow a logical pattern in comparison to field observations with larger sizes in East Africa, and in Oku at the Cameroonian level (mode of Ne estimates of 46,600 for KEker, and between 476 for CMngo and 4130 for CMoku; Table 3). However, in Cameroon, these estimates remain large compared to the size of most populations where usually < 100 adult trees were observed. A drastic population decline is inferred mainly for CGmab, CMkup, CMngo, and CMebo (20-to-80-fold reduction of Ne; Table 3). Despite large 95% posterior distribution intervals for temporal estimations, population differentiation is anchored in the Pleistocene, during the last million years, with Cameroonian populations diverging from each other around 250 kyrs (between 75–680 kyrs) and undergoing a demographic decline around 32 kyrs (between 8.8–67 kyrs), as detailed in Table 3.

4. Discussion

4.1. Wide Distribution despite Currently Limited Dispersal Capacities

The extensive sub-continental distribution range of P. latifolius in Central, East, and Southern Africa suggests a high dispersal capacity in this conifer tree species, especially since it underwent a rapid demographic and range expansion during the last 200–300 kyrs according to plastome phylogeography [16]. Yet, the rapid decay of kinship coefficients with geographic distance implies spatially restricted gene flow, both for pollen and seed dispersal (Figure 2). This pattern of isolation-by-distance at a scale of only a few kilometers is observed for all populations in both East and Central Africa, except in the population CMoku. These results are consistent with modern pollen deposits of podocarps which decay rapidly with the distance to source plants/forests [21,39,40] and suggest that long-distance pollen dispersal does not contribute to connecting significantly the remaining populations. However, they imply also that seed dispersal must be very limited, at odds with the inferred historical rapid range expansion. This paradox might be explained if seed dispersal was much more extensive when P. latifolius was a lot more abundant because the species fruits could then represent a key resource for dispersers [41]. This hypothesis could be related to the asynchronous and variable fruiting of podocarps observed in different forest fragments in South Africa, where the smallest forest patches showed lower fruit production [18], possibly limiting their attractiveness for seed dispersers.
The absence of homogenizing effect of pollen flow probably explains the genetic individualization of each mountain range (Figure S2). While tree species with a relatively continuous distribution throughout lowland African rain forests typically show FST values lower than 0.1 between populations separated by less than 500 km (e.g., [24,42,43,44]), P. latifolius populations from western Central Africa generally showed FST values higher than 0.2 even when separated by less than 200 km (Figure 3), probably reflecting the disjunct distribution area of the species. The same level of genetic differentiation was observed in other Afromontane trees, such as Hagenia abyssinica (FST = 0.32 in Kenya; [45]) and Prunus africana (FST = 0.27 and RST = 0.70; [46]). Contrary to the last two species, P. latifolius populations did not show shifts in microsatellite allele sizes (RST not significantly higher than FST), even between Central and East Africa, indicating relatively recent divergence compared to the reciprocal of the mutation rate (µ). Indeed, theory predicts that RST > FST if the number of generations since divergence ≥1/µ [31], requiring at least c. 40,000 generations according to the posterior estimate of µ following the ABC modeling (µ = 2.56 × 10⁻⁵; Table 3), that is nearly two million years assuming a generation time of 50 years. Genetic drift is thus the main driver of population differentiation at the nine nSSR used in our study. Genetic drift appears much higher in western Central Africa than in East Africa. Accordingly, in East Africa, genetic diversity within the population is much higher and FST remains relatively low even at large distances, compared to populations from western Central Africa (FST ≤ 0.14; Figure 3; Table 1). The large East African populations are thus more genetically diverse than the small populations from western Central Africa.
Moderate or even low levels of gene flow between fragmented populations could significantly alleviate the loss of genetic diversity by preventing the effects of genetic drift [47]. However, considering the interactions between population size, degree of isolation, matrix characteristics, and how rapid global changes challenge connectivity, podocarp populations in western Central Africa could be pushed to the limits of their persistence, thus threatening the long-term survival of the species in this region.

4.2. Recent and Strong Bottleneck in the West despite Past Connections throughout Africa

The phylogeographic pattern revealed by genomic data [16], indicating a westward range expansion of P. latifolius is completed by the present nSSR markers: DAPC analysis suggests that western Central Africa was colonized from East Africa following two independent pathways, a northern one leading to Cameroon, and a southern one leading to the Republic of Congo through Angola and possibly Rwanda (Figure 4 and Figure S1). This pattern provides further evidence for historical migration routes connecting East and western Central Africa, as previously shown by phylogenomic data on P. latifolius, but also by data on Prunus africana [48], Delphinium taxa [49], and Afroalpine Festuca grasses [50]. In our case, including Angolan and Congolese populations supported genetic isolation between northern and southern populations of western Central Africa that could be related to different historical dynamics. Indeed, climate changes impacted differently Podocarpus on both sides of the equator in western Central Africa. In the north, pollen percentages fell to low levels after 74 kyrs, supporting their possible disappearance from the Guinean mountains, while southern marine paleorecords in the Atlantic indicated that Podocarpus was fairly abundant during the last glacial cycle [8].
Demographic inference supports differentiation of current populations of P. latifolius during the last million years when glacial/interglacial oscillations intensified [51]. A strong bottleneck is detected in the last 100 kyrs in western Central Africa, contrary to East Africa where populations seem to have remained more stable (Figure 5 and Table 3). The mid- and late Pleistocene seem to have been crucial for the evolution of current Afromontane species, as evidenced by Festuca abyssinica, which colonized the Cameroon volcanic line as a result of two independent long-distance dispersal events (Albertine Rift and Mt. Cameroon 860 kyrs ago, Kilimanjaro to Bioko 520 kyrs ago; [50]). A key role of Pleistocene climatic cycles has also been shown on the sequential divergence of chameleons per mountain range in Kenya from 590 to 930 kyrs with expansion for the largest isolate 182 kyrs ago [52], vicariant speciation of eastern Afromontane flightless orthopterans between 500 and 900 kyrs [53], diversification of endemic rodents from the Albertine Rift region starting from 910 kyrs [54,55], avian diversification across Africa [56], and on the recent expansion of drosophilid populations starting 130 kyrs ago [57].
The past dynamics of Cameroonian podocarps reconstructed here excludes successive migration waves of (re)colonization of all the Cameroon Volcanic Line. There were probably no large amplitude altitudinal shifts with reconnection of the mountain range as each mountain range is genetically well structured. New pollen data from Cameroon [58] suggest that, instead of migration waves of Podocarpus, changes in populations size or density occurred in response to climate change. The genetic pattern observed today results from a more ancient fragmentation event than the last Holocene environmental crisis and highlights the absence of recent reconnection between mountains. The population decay recorded in western Central Africa c. 3 kyrs ago by fossil pollen data, leading to the small, scattered distribution of the species we see today, apparently did not leave detectable genetic signatures, like a signature of very recent population decline. The likely reason is that the number of generations elapsed (probably <100) is not yet sufficient, at least in regard to the previous signatures of the bottleneck. It may also explain why estimates of current effective sizes (Ne) are larger than the census size of small populations (N < 100) if these estimated Ne largely reflects those occurring before the population reduction 3 kyrs ago.

5. Conclusions

The unprecedented rates of climate change, in addition to land-use changes that impede gene flow, can be expected to disrupt the interplay of adaptation and migration, likely threatening the persistence of many species [59]. Assessing extinction risks and evolutionary potential of Afromontane ecosystems, already highly disconnected, is a challenging task [60]. In this context, investigating intraspecific genetic structure and diversity has direct implications for assessing resilience in the face of environmental change. Especially, as each mountain range, even small isolates (CMngo for example) harbor genetically and evolutionarily distinctive populations of P. latifolius, as documented here, it is important to argue for the conservation of these smaller isolated and often peripheral areas [61]. However, once a detailed view of the evolutionary history and genetic resources has been established, the evolutionary timescale is rarely considered in conservation biology and ecology, despite crucial implications.
As evidenced from Cameroonian pollen records [10,58], species’ response to the post-glacial climate amelioration must be considered in terms of millennia, during which local environmental conditions and competition between species play a key role in determining the resilience of podocarps after an environmental crisis. According to our genetic data, the genetic response of populations also has to be considered at a longer timescale than the short-term timescale used in conservation. Indeed, we detected genetic inertia, since the estimated effective population sizes from genetic data are higher than what we encountered in the field. The negative effects of recent population reduction and habitat fragmentation on genetic diversity may not be observed in the current mature individuals but might be reflected in their future generations [62]. Understanding the forest dynamics implies thus integrating environmental and biotic changes that occurred at the millennial-scale, which is clearly distinct from the timescale currently considered by policymakers.
Finally, our study focused on western Central Africa, but further work should be conducted in eastern and southern Africa where P. latifolius is more common, probably underwent a very distinct demographic history, and perhaps exposed to different threats.

Supplementary Materials

The following supporting information can be downloaded at: https://www.mdpi.com/article/10.3390/f13020208/s1, Figure S1. Discriminant Analysis of Principal Components (DAPC) drawn across 229 samples of Podocarpus latifolius from western Central and East Africa using nine nuclear SSR markers. X and Y axes of the DAPC scatterplots describe the first and second discriminant functions (a), the first and the third functions (b), and the second and the third functions (c). Barplots of Discriminant Analysis eigenvalues (top left in (a–c)) display the proportion of genetic information comprised in each consecutive discriminant function. Principal Component Analysis eigenvalues graphs (bottom left) represent cumulated variance explained by the eigenvalues of the PCA. Populations sampled are distinguished by symbols and colors within with 95% inertia ellipses and mapped within the distribution range of P. latifolius (d). Figure S2. Analysis of genetic clustering (Structure results) of Podocarpus latifolius SSR data in western Central Africa. Representation of the Log probability of data Ln Pr(D|K) and deltaK as a function of Kmax (a,b). Distribution of the nSSR genetic clusters for Kmax = 2, 3, 4, 5, and 6 (c–g), highlighting admixed samples with triangles when 0.5 < q < 0.7, and asterisks when q < 0.5; q designating the probability of clusters assignment. Structure graphs represent the membership coefficients (q) of each individual using the K = 2 and K = 6 (h,i). Table S1. Characteristics of the nine nuclear microsatellite markers developed and used for Podocarpus latifolius. The linkers (Q1, Q2, Q3, Q4) attached to the forward primers are underlined in the forward primer sequences. Table S2. Characteristics of samples of Podocarpus latifolius used for nuclear SSR genotyping. For each sample (n = 270), the following elements are provided: the DNA ID, the sampling location, the population ID, the GPS coordinates, the collection details, and their Structure clustering membership for K = 2, 3, 4, 5, and 6. Individuals were considered as admixed (symbol 0) when their probability of assignment to a single gene pool was below 0.5 and an interrogation point indicates assignment values between 0.5 and 0.7. Table S3. Results of ABC demographic inference for P. latifolius in Cameroon, using the software DIYABC: prior and posterior distributions of the demographical and historical parameters (graphical representation in Figure 5). Times in year BP and effective sizes in a number of individuals.

Author Contributions

J.M., A.-M.L. and O.J.H. planned this study and were responsible for the writing of the article with key advice from M.V. and A.F.B. J.M., A.-M.L., M.V., G.A., B.T., A.F.B., F.K.M., G.U.D.B., S.F.O., L.W., F.M.P.G., T.S., J.N.M.F. and O.J.H. actively participated to the sampling. J.N.M.F. performed the molecular biology work, after which J.M. and O.J.H. focused on the molecular analyses, following advice of F.K.M. All authors have read and agreed to the published version of the manuscript.

Funding

This study was financially supported by the BELMONT FORUM research program VULPES (French ANR-15-MASC-0003, coordinator: Rachid Cheddadi), the Belgian BRAIN-be BELSPO research program BR/132/A1/AFRIFORD (coordinator Olivier J. Hardy), and the Belgian Fonds de la Recherche Scientifique (F.R.S.-FNRS, grants J.0143.15 and J.0292.17). The study was initiated also during the IFORA (ANR-06-BDIV-0014, coordinator Michel Veuille) and C3A (ANR-09-PEXT-001, coordinator Anne-Marie Lézine) French research programs.

Data Availability Statement

Sampling locations available as supporting information. Nuclear microsatellite primers developed available as supporting information and in GenBank (OM201662 to OM201670).

Acknowledgments

Thanks are due to Rachid Cheddadi (CNRS Montpellier), Esra Kaymak (ULB-EBE) for their constructive discussions, and to Laurent Grumiau (ULB-EBE Molecular Biology platform, Belgium), Latifa Karim and Wouter Coppieters (GIGA Liège, Belgium) for their advices on genomics. Finally, we are grateful to other colleagues who have kindly participated in the sampling for several years: Thierry Desjardins, Vincent Droissart, Kévin Lemonnier, Alexandra Ley, Olivier-Valérie Séné, Bruno Turcq, Maria Cristina Duarte & Maria M. Romeiras (LISC herbarium, Portugal), Geoffrey Fadeur (BRLU herbarium, Belgium), with special thanks to Claire Micheneau and Rosalía Piñeiro. We also thank two anonymous reviewers for their constructive comments.

Conflicts of Interest

The authors declare no conflict of interest.

References

  1. White, F. The Afromontane Region. In Biogeography and Ecology of Southern Africa; Springer: Dordrecht, The Netherlands, 1978; pp. 463–513. ISBN 978-94-009-9953-4. [Google Scholar]
  2. Myers, N.; Mittermeier, R.A.; Mittermeier, C.G.; Da Fonseca, G.A.B.; Kent, J. Biodiversity hotspots for conservation priorities. Nature 2000, 403, 853–858. [Google Scholar] [CrossRef] [PubMed]
  3. Küper, W.; Sommer, J.H.; Lovett, J.C.; Mutke, J.; Linder, H.P.; Beentje, H.J.; Rompaey, R.S.A.R.V.; Chatelain, C.; Sosef, M.; Barthlott, W. Africa’s Hotspots of Biodiversity Redefined. Ann. Mo. Bot. Gard. 2004, 91, 525–535. [Google Scholar]
  4. Dagallier, L.-P.M.J.; Janssens, S.B.; Dauby, G.; Blach-Overgaard, A.; Mackinder, B.A.; Droissart, V.; Svenning, J.-C.; Sosef, M.S.M.; Stévart, T.; Harris, D.J.; et al. Cradles and museums of generic plant diversity across tropical Africa. New Phytol. 2020, 225, 2196–2213. [Google Scholar] [CrossRef] [PubMed] [Green Version]
  5. White, F. The history of the Afromontane archipelago and the scientific need for its conservation. Afr. J. Ecol. 1981, 19, 33–54. [Google Scholar] [CrossRef]
  6. Platts, P.J.; Gereau, R.E.; Burgess, N.D.; Marchant, R. Spatial heterogeneity of climate change in an Afromontane centre of endemism. Ecography 2013, 36, 518–530. [Google Scholar] [CrossRef]
  7. Adie, H.; Lawes, M. Podocarps in Africa: Temperate zone relicts or rainforest survivors? Smithson. Contrib. Bot. 2011, 95, 79–100. [Google Scholar] [CrossRef] [Green Version]
  8. Dupont, L.M.; Jahns, S.; Marret, F.; Ning, S. Vegetation change in equatorial West Africa: Time-slices for the last 150 ka. Palaeogeogr. Palaeoclimatol. Palaeoecol. 2000, 155, 95–122. [Google Scholar] [CrossRef]
  9. Lézine, A.-M.; Assi-Kaudjhis, C.; Roche, E.; Vincens, A.; Achoundong, G. Towards an understanding of West African montane forest response to climate change. J. Biogeogr. 2013, 40, 183–196. [Google Scholar] [CrossRef]
  10. Lézine, A.-M.; Izumi, K.; Kageyama, M.; Achoundong, G. A 90,000-year record of Afromontane forest responses to climate change. Science 2019, 363, 177–181. [Google Scholar] [CrossRef]
  11. Osmaston, H.A.; Harrison, S.P. The Late Quaternary glaciation of Africa: A regional synthesis. Quat. Int. 2005, 138–139, 32–54. [Google Scholar] [CrossRef]
  12. Finch, J.; Leng, M.J.; Marchant, R. Late Quaternary vegetation dynamics in a biodiversity hotspot, the Uluguru Mountains of Tanzania. Quat. Res. 2009, 72, 111–122. [Google Scholar] [CrossRef]
  13. Izumi, K.; Lézine, A.-M. Pollen-based biome reconstructions over the past 18,000 years and atmospheric CO2 impacts on vegetation in equatorial mountains of Africa. Quat. Sci. Rev. 2016, 152, 93–103. [Google Scholar] [CrossRef] [Green Version]
  14. Elenga, H.; Schwartz, D.; Vincens, A. Pollen evidence of late Quaternary vegetation and inferred climate changes in Congo. Palaeogeogr. Palaeoclimatol. Palaeoecol. 1994, 109, 345–356. [Google Scholar] [CrossRef]
  15. Vincens, A.; Schwartz, D.; Elenga, H.; Reynaud-Farrera, I.; Alexandre, A.; Bertaux, J.; Mariotti, A.; Martin, L.; Meunier, J.-D.; Nguetsop, F.; et al. Forest response to climate changes in Atlantic Equatorial Africa during the last 4000 years BP and inheritance on the modern landscapes. J. Biogeogr. 1999, 26, 879–885. [Google Scholar] [CrossRef] [Green Version]
  16. Migliore, J.; Lézine, A.-M.; Hardy, O.J. The recent colonization history of the most widespread Podocarpus tree species in Afromontane forests. Ann. Bot. 2020, 126, 73–83. [Google Scholar] [CrossRef]
  17. Adie, H.; Lawes, M.J. Role reversal in the stand dynamics of an angiosperm–conifer forest: Colonising angiosperms precede a shade-tolerant conifer in Afrotemperate forest. For. Ecol. Manag. 2009, 258, 159–168. [Google Scholar] [CrossRef]
  18. Hart, L.A.; Grieve, G.R.H.; Downs, C.T. Fruiting phenology and implications of fruit availability in the fragmented Ngele forest complex, KwaZulu-Natal, South Africa. S. Afr. J. Bot. 2013, 88, 296–305. [Google Scholar] [CrossRef] [Green Version]
  19. Uriarte, M.; Anciães, M.; Da Silva, M.T.; Rubim, P.; Johnson, E.; Bruna, E.M. Disentangling the drivers of reduced long-distance seed dispersal by birds in an experimentally fragmented landscape. Ecology 2011, 92, 924–937. [Google Scholar] [CrossRef]
  20. Maley, J.; Caballé, G.; Sita, P. Etude d’un peuplement résiduel à basse altitude de Podocarpus latifolius sur le flanc congolais du massif du Chaillu. Implications paléoclimatiques et biogéographiques. Etude de la pluie pollinique actuelle. Paysages Quat. L’afrique Cent. Atl. 1990, 336–352. [Google Scholar]
  21. Verlhac, L.; Izumi, K.; Lézine, A.-M.; Lemonnier, K.; Buchet, G.; Achoundong, G.; Tchiengué, B. Altitudinal distribution of pollen, plants and biomes in the Cameroon highlands. Rev. Palaeobot. Palynol. 2018, 259, 21–28. [Google Scholar] [CrossRef]
  22. Vekemans, X.; Hardy, O.J. New insights from fine-scale spatial genetic structure analyses in plant populations. Mol. Ecol. 2004, 13, 921–935. [Google Scholar] [CrossRef] [PubMed]
  23. Demenou, B.B.; Piñeiro, R.; Hardy, O.J. Origin and history of the Dahomey Gap separating West and Central African rain forests: Insights from the phylogeography of the legume tree Distemonanthus benthamianus. J. Biogeogr. 2016, 43, 1020–1031. [Google Scholar] [CrossRef]
  24. Demenou, B.B.; Doucet, J.-L.; Hardy, O.J. History of the fragmentation of the African rain forest in the Dahomey Gap: Insight from the demographic history of Terminalia superba. Heredity 2018, 120, 547. [Google Scholar] [CrossRef] [PubMed]
  25. Piñeiro, R.; Dauby, G.; Kaymak, E.; Hardy, O.J. Pleistocene population expansions of shade-tolerant trees indicate fragmentation of the African rainforest during the Ice Ages. Proc. R. Soc. B 2017, 284, 20171800. [Google Scholar] [CrossRef] [PubMed] [Green Version]
  26. Masella, A.P.; Bartram, A.K.; Truszkowski, J.M.; Brown, D.G.; Neufeld, J.D. PANDAseq: Paired-end assembler for illumina sequences. BMC Bioinform. 2012, 13, 31. [Google Scholar] [CrossRef] [Green Version]
  27. Meglécz, E.; Pech, N.; Gilles, A.; Dubut, V.; Hingamp, P.; Trilles, A.; Grenier, R.; Martin, J.-F. QDD version 3.1: A user friendly computer program for microsatellite selection and primer design revisited: Experimental validation of variables determining genotyping success rate. Mol. Ecol. Resour. 2014, 14, 1302–1313. [Google Scholar] [CrossRef]
  28. Micheneau, C.; Dauby, G.; Bourland, N.; Doucet, J.-L.; Hardy, O.J. Development and characterization of microsatellite loci in Pericopsis elata (Fabaceae) using a cost-efficient approach. Am. J. Bot. 2011, 98, e268–e270. [Google Scholar] [CrossRef]
  29. Holleley, C.E.; Geerts, P.G. Multiplex Manager 1.0: A cross-platform computer program that plans and optimizes multiplex PCR. Bio Tech. 2009, 46, 511–517. [Google Scholar] [CrossRef]
  30. Kearse, M.; Moir, R.; Wilson, A.; Stones-Havas, S.; Cheung, M.; Sturrock, S.; Buxton, S.; Cooper, A.; Markowitz, S.; Duran, C.; et al. Geneious Basic: An integrated and extendable desktop software platform for the organization and analysis of sequence data. Bioinformatics 2012, 28, 1647–1649. [Google Scholar] [CrossRef]
  31. Hardy, O.J.; Charbonnel, N.; Fréville, H.; Heuertz, M. Microsatellite Allele Sizes: A Simple Test to Assess Their Significance on Genetic Differentiation. Genetics 2003, 163, 1467–1482. [Google Scholar] [CrossRef]
  32. Hardy, O.J.; Vekemans, X. SPAGeDi: A versatile computer program to analyse spatial genetic structure at the individual or population levels. Mol. Ecol. Notes 2002, 2, 618–620. [Google Scholar] [CrossRef] [Green Version]
  33. Jombart, T.; Devillard, S.; Balloux, F. Discriminant analysis of principal components: A new method for the analysis of genetically structured populations. BMC Genet. 2010, 11, 94–109. [Google Scholar] [CrossRef] [PubMed] [Green Version]
  34. Falush, D.; Stephens, M.; Pritchard, J.K. Inference of population structure using multilocus genotype data: Linked loci and correlated allele frequencies. Genetics 2003, 164, 1567–1587. [Google Scholar] [CrossRef] [PubMed]
  35. Earl, D.A.; VonHoldt, B.M. STRUCTURE HARVESTER: A website and program for visualizing STRUCTURE output and implementing the Evanno method. Conserv. Genet. Resour. 2012, 4, 359–361. [Google Scholar] [CrossRef]
  36. Evanno, G.; Regnaut, S.; Goudet, J. Detecting the number of clusters of individuals using the software STRUCTURE: A simulation study. Mol. Ecol. 2005, 14, 2611–2620. [Google Scholar] [CrossRef] [Green Version]
  37. Cornuet, J.-M.; Santos, F.; Beaumont, M.A.; Robert, C.P.; Marin, J.-M.; Balding, D.J.; Guillemaud, T.; Estoup, A. Inferring population history with DIY ABC: A user-friendly approach to approximate Bayesian computation. Bioinformatics 2008, 24, 2713–2719. [Google Scholar] [CrossRef] [Green Version]
  38. Cornuet, J.-M.; Pudlo, P.; Veyssier, J.; Dehne-Garcia, A.; Gautier, M.; Leblois, R.; Marin, J.-M.; Estoup, A. DIYABC v2.0: A software to make approximate Bayesian computation inferences about population history using single nucleotide polymorphism, DNA sequence and microsatellite data. Bioinformatics 2014, 30, 1187–1189. [Google Scholar] [CrossRef] [Green Version]
  39. Vincens, A. Palynologie, Environnements Actuels et Plio-Pléistocènes à l’est du lac Turkana (Kenya). Ph.D. Thesis, Université d’Aix-Marseille, Marseille, France, 1982. [Google Scholar]
  40. Gajewski, K.; Lézine, A.-M.; Vincens, A.; Delestan, A.; Sawada, M. Modern climate–vegetation–pollen relations in Africa and adjacent areas. Quat. Sci. Rev. 2002, 21, 1611–1631. [Google Scholar] [CrossRef]
  41. Hadley, A.S.; Betts, M.G. The effects of landscape fragmentation on pollination dynamics: Absence of evidence not evidence of absence. Biol. Rev. 2012, 87, 526–544. [Google Scholar] [CrossRef]
  42. Bizoux, J.-P.; Daïnou, K.; Bourland, N.; Hardy, O.J.; Heuertz, M.; Mahy, G.; Doucet, J.-L. Spatial genetic structure in Milicia excelsa (Moraceae) indicates extensive gene dispersal in a low-density wind-pollinated tropical tree. Mol. Ecol. 2009, 18, 4398–4408. [Google Scholar] [CrossRef]
  43. Debout, G.D.G.; Doucet, J.-L.; Hardy, O.J. Population history and gene dispersal inferred from spatial genetic structure of a Central African timber tree, Distemonanthus benthamianus (Caesalpinioideae). Heredity 2011, 106, 88–99. [Google Scholar] [CrossRef] [PubMed] [Green Version]
  44. Duminil, J.; Brown, R.P.; Ewédjè, E.-E.B.; Mardulyn, P.; Doucet, J.-L.; Hardy, O.J. Large-scale pattern of genetic differentiation within African rainforest trees: Insights on the roles of ecological gradients and past climate changes on the evolution of Erythrophleum spp (Fabaceae). BMC Evol. Biol. 2013, 13, 1–13. [Google Scholar] [CrossRef] [PubMed]
  45. Gichira, A.W.; Li, Z.-Z.; Saina, J.K.; Hu, G.-W.; Gituru, R.W.; Wang, Q.-F.; Chen, J.-M. Demographic history and population genetic structure of Hagenia abyssinica (Rosaceae), a tropical tree endemic to the Ethiopian highlands and eastern African mountains. Tree Genet. Genomes 2017, 13, 72. [Google Scholar] [CrossRef]
  46. Kadu, C.A.C.; Konrad, H.; Schueler, S.; Muluvi, G.M.; Eyog-Matig, O.; Muchugi, A.; Williams, V.L.; Ramamonjisoa, L.; Kapinga, C.; Foahom, B.; et al. Divergent pattern of nuclear genetic diversity across the range of the Afromontane Prunus africana mirrors variable climate of African highlands. Ann. Bot. 2013, 111, 47–60. [Google Scholar] [CrossRef] [Green Version]
  47. Kormann, U.; Scherber, C.; Tscharntke, T.; Klein, N.; Larbig, M.; Valente, J.J.; Hadley, A.S.; Betts, M.G. Corridors restore animal-mediated pollination in fragmented tropical forest landscapes. Proc. R. Soc. B Biol. Sci. 2016, 283, 20152347. [Google Scholar] [CrossRef] [Green Version]
  48. Kadu, C.A.C.; Schueler, S.; Konrad, H.; Muluvi, G.M.M.; Eyog-Matig, O.; Muchugi, A.; Williams, V.L.; Ramamonjisoa, L.; Kapinga, C.; Foahom, B.; et al. Phylogeography of the Afromontane Prunus africana reveals a former migration corridor between East and West African highlands. Mol. Ecol. 2011, 20, 165–178. [Google Scholar] [CrossRef]
  49. Chartier, M.; Dressler, S.; Schönenberger, J.; Mora, A.R.; Sarthou, C.; Wang, W.; Jabbour, F. The evolution of afro-montane Delphinium (Ranunculaceae): Morphospecies, phylogenetics and biogeography. Taxon 2016, 65, 1313–1327. [Google Scholar] [CrossRef]
  50. Mairal, M.; Namaganda, M.; Gizaw, A.; Chala, D.; Brochmann, C.; Catalán, P. Multiple mountain-hopping colonization of sky-islands on the two sides of Tropical Africa during the Pleistocene: The afroalpine Festuca grasses. J. Biogeogr. 2021, 48, 1858–1874. [Google Scholar] [CrossRef]
  51. Dupont, L.M.; Donner, B.; Schneider, R.; Wefer, G. Mid-Pleistocene environmental change in tropical Africa began as early as 1.05 Ma. Geology 2001, 29, 195–198. [Google Scholar] [CrossRef] [Green Version]
  52. Measey, G.J.; Tolley, K.A. Sequential Fragmentation of Pleistocene Forests in an East Africa Biodiversity Hotspot: Chameleons as a Model to Track Forest History. PLoS ONE 2011, 6, e26606. [Google Scholar] [CrossRef] [Green Version]
  53. Voje, K.L.; Hemp, C.; Flagstad, Ø.; Sætre, G.-P.; Stenseth, N.C. Climatic change as an engine for speciation in flightless Orthoptera species inhabiting African mountains. Mol. Ecol. 2009, 18, 93–108. [Google Scholar] [CrossRef] [PubMed]
  54. Huhndorf, M.H.; Peterhans, J.C.K.; Loew, S.S. Comparative phylogeography of three endemic rodents from the Albertine Rift, east central Africa. Mol. Ecol. 2007, 16, 663–674. [Google Scholar] [CrossRef] [PubMed]
  55. Bryja, J.; Mikula, O.; Patzenhauerová, H.; Oguge, N.O.; Šumbera, R.; Verheyen, E. The role of dispersal and vicariance in the Pleistocene history of an East African mountain rodent, Praomys delectorum. J. Biogeogr. 2014, 41, 196–208. [Google Scholar] [CrossRef]
  56. Bowie, R.C.K.; Fjeldså, J.; Hackett, S.J.; Bates, J.M.; Crowe, T.M. Coalescent models reveal the relative roles of ancestral polymorphism, vicariance, and dispersal in shaping phylogeographical structure of an African montane forest robin. Mol. Phylogenetics Evol. 2006, 38, 171–188. [Google Scholar] [CrossRef]
  57. Bouiges, A.; Yassin, A.; Ikogou, M.; Lelarge, C.; Sikoa, A.-R.; Mona, S.; Veuille, M. Detecting recent changes in the demographic parameters of drosophilid populations from western and central Africa. Comptes Rendus Geosci. 2013, 345, 297–305. [Google Scholar] [CrossRef]
  58. Lézine, A.-M.; Izumi, K.; Achoundong, G. Mbi Crater (Cameroon) illustrates the relations between mountain and lowland forests over the past 15,000 years in western equatorial Africa. Quat. Int. 2020, in press. [Google Scholar] [CrossRef]
  59. Davis, M.B.; Shaw, R.G.S. Range Shifts and Adaptative Responses to Quaternary Climate Change. Science 2001, 292, 673–679. [Google Scholar] [CrossRef] [Green Version]
  60. Ayele, T.B.; Gailing, O.; Finkeldey, R. Assessment and integration of genetic, morphological and demographic variation in Hagenia abyssinica (Bruce) J.F. Gmel to guide its conservation. J. Nat. Conserv. 2011, 19, 8–17. [Google Scholar] [CrossRef]
  61. Kahindo, C.; Bowie, R.C.K.; Bates, J.M. The relevance of data on genetic diversity for the conservation of Afro-montane regions. Biol. Conserv. 2007, 134, 262–270. [Google Scholar] [CrossRef]
  62. Aguilar, R.; Quesada, M.; Ashworth, L.; Herrerias-Diego, Y.; Lobo, J. Genetic consequences of habitat fragmentation in plant populations: Susceptible signals in plant traits and methodological approaches. Mol. Ecol. 2008, 17, 5177–5188. [Google Scholar] [CrossRef]
Figure 1. Populations of Podocarpus latifolius sampled for genetic analyses in Angola (AO), Cameroon (CM), Republic of the Congo (CG), Kenya (KE), and Rwanda (RW). Symbols and colors correspond to the DAPC analyses. Black dots refer to the distribution range of P. latifolius (data extracted from GBIF, field missions, herbarium specimens (BRLU, BR, P), the Conifers of the world database, see [16]). Colors on the map refer to elevation, using the software QGIS (QGIS.org, 2021. QGIS Geographic Information System. QGIS Association (http://www.qgis.org, accessed on 25 January 2022).
Forests 13 00208 g001
Figure 2. Fine-scale spatial genetic structure within populations of P. latifolius in Cameroon (CM), Republic of the Congo (CG), and Kenya (KE) assessed by kinship-distance decay for populations with more than 30 individuals sampled (Oku in CM, Maba Moubou and Kouyi in CG, Kereita and Taita Hills, combining KEnga and KEmsi, in KE).
Forests 13 00208 g002
Figure 3. Pairwise genetic differentiation (FST) in relation to spatial distances. We distinguish population pairs of P. latifolius sampled between western Central Africa and East Africa, within East Africa, and within western Central Africa.
Forests 13 00208 g003
Figure 4. Discriminant Analysis of Principal Components (DAPC) including 229 samples of P. latifolius from western Central Africa and East Africa using nine nuclear SSR markers. X and Y axes of the DAPC scatterplots describe the first and second discriminant functions. Barplots of discriminant analysis eigenvalues (top left) display the proportion of genetic information comprised in each consecutive discriminant function. Populations sampled are distinguished by symbols and colors with 95% inertia ellipses and mapped within the distribution range of P. latifolius (Figure 1).
Forests 13 00208 g004
Figure 5. Most likely scenario retained for inferring the demographic history of populations of P. latifolius in Kenya (KE), the Republic of the Congo (CG), and Cameroon (CM). Prior and posterior of each parameter (effective sizes N1N6, Na1Na6, Nb, Nc, Nd, and time intervals ta, ta1, ta6, tb, tc, td) are detailed in Table 3.
Forests 13 00208 g005
Table 1. Genetic diversity parameters of the 12 P. latifolius populations studied using nine nuclear SSR loci.
PopulationnMissing GenotypesNAARHoHeFiPval
AOtun91.4 (16.0%)3.562.720.2100.5600.6500
CGkou281.8 (6.3%)4.332.690.4170.5820.2880
CGmab332.6 (7.7%)3.222.250.3020.4830.3810
CGmou80.6 (6.9%)2.221.870.3060.3360.0970.396
CMebo230.7 (2.9%)4.112.710.5600.6130.0890.047
CMkup120.9 (7.4%)3.222.550.5460.5700.0470.543
CMngo160.2 (1.4%)2.672.120.4800.458−0.0500.473
CMoku370.6 (1.5%)5.893.020.5160.6060.1500
KEker320.6 (1.7%)8.333.550.4540.7050.3590
KEmsi161.7 (10.4%)5.223.210.4450.6900.3650
KEnga221.3 (6.1%)7.003.490.4150.7070.4200
RWbig111.1 (10.1%)5.443.330.4390.6510.3390
All populations24713.3 (5.4%)12.563.800.4430.7680.4230
n: sample size. NA: number of alleles. AR: allelic richness. Expected number of alleles among 6 gene copies. Ho: observed heterozygosity. He: expected heterozygosity. Fi: individual inbreeding coefficient. Pval: tests if Fi = 0 after 999 randomization of gene copies among individuals.
Table 2. Genetic differentiation between 12 P. latifolius populations at nine nuclear SSR loci: FST (below diagonal) and RST (above diagonal).
PopulationsAOtunCGkouCGmabCGmouCMeboCMkupCMngoCMokuKEkerKEmsiKEngaRWbig
AOtun 0.180.150.170.330.260.390.290.150.160.210.07
CGkou0.16 0.030.140.470.370.420.320.210.320.320.32
CGmab0.250.16 0.050.430.380.430.320.160.310.300.28
CGmou0.330.190.08 0.410.400.480.270.140.310.290.32
CMebo0.250.250.300.35 0.230.280.190.190.210.270.29
CMkup0.340.340.370.440.21 0.190.230.210.190.290.15
CMngo0.370.330.330.450.250.28 0.220.260.260.270.25
CMoku0.240.250.300.360.190.230.24 0.100.150.180.28
KEker0.160.230.300.330.200.220.290.17 0.050.100.14
KEmsi0.210.270.310.340.180.180.260.150.10 0.000.11
KEnga0.190.240.330.360.200.230.300.120.080.08 0.16
RWbig0.090.230.260.330.210.260.330.230.090.140.11
Average:FST = 0.24 RST = 0.25
Table 3. Results of ABC demographic inference for P. latifolius: prior and posterior distributions of the demographic and historical parameters (graphical representation in Figure 4). Times in year BP and effective sizes in a number of individuals.
ParameterPrior DistributionMeanModeq025q975
N1Effective population size KEker at t0Uniform (10–50,000)37,70046,60016,20049,600
N2Effective population size CGmab at t0Uniform (10–20,000)244096032511,900
N3Effective population size CMkup at t0Uniform (10–2000)10107932571900
N4Effective population size CMngo at t0Uniform (10–2000)7374761501760
N5Effective population size CMoku at t0Uniform (10–20,000)84404130181019,000
N6Effective population size CMebo at t0Uniform (10–2000)121011403721940
Na1Effective population size KEker at ta1Uniform (10–100,000)51,80034,80014,40096,600
Na2Effective population size CGmab at ta3–6Uniform (10–100,000)53,70096,300774098,200
Na3Effective population size CMkup at ta3–6Uniform (10–100,000)54,90081,400656098,000
Na4Effective population size CMngo at ta3–6Uniform (10–100,000)57,70093,300673098,500
Na5Effective population size CMoku at ta3–6Uniform (10–100,000)31,5008950269092,300
Na6Effective population size CMebo at ta3–6Uniform (10–100,000)47,70020,200497096,600
NbEffective population size CM at tbUniform (10–100,000)42,50022,700486094,900
NcEffective population size CM+CG at tcUniform (10–100,000)53,20047,200759097,700
NdEffective population size CM+CG+KE at tdUniform (10–100,000)47,00029,500913093,000
ta1Last demographic changes for KEkerUniform (500–250,000)91,50014,7503350237,000
ta2Last demographic changes for CGmabUniform (500–250,000)151,500232,00017,350246,000
ta3–6Last demographic changes for CMUniform (500–250,000)32,65031,800880067,000
tbDivergence CM popsUniform (500–1,000,000)311,000250,50075,000680,000
tcDivergence CG popUniform (500–1,000,000)560,000499,000231,000895,000
tdDivergence KE popUniform (500–1,000,000)845,000980,000525,000995,000
Mean µMean mutation rateUniform (1.0 × 10⁻⁵–1.0 × 10⁻⁴)4.00 × 10−52.56 × 10−51.28 × 10−58.59 × 10−5
Mean PMean coefficient PUniform (0.1–0.3)0.2260.3000.1220.300
Publisher’s Note: MDPI stays neutral with regard to jurisdictional claims in published maps and institutional affiliations.

