Article

Impacts of Site Conditions and Stand Structure on the Biomass Allocation of Single Trees in Larch Plantations of Liupan Mountains of Northwest China

1
Key Laboratory of Forest Ecology and Environment of National Forestry and Grassland Administration, Institute of Forest Ecology, Environment and Nature Conservation, Chinese Academy of Forestry, Beijing 100091, China
2
School of Soil and Water Conservation, Beijing Forestry University, Beijing 100083, China
*
Author to whom correspondence should be addressed.
Forests 2022, 13(2), 177; https://doi.org/10.3390/f13020177
Submission received: 24 November 2021 / Revised: 18 January 2022 / Accepted: 19 January 2022 / Published: 24 January 2022

Abstract

:
Understanding the determinants of tree biomass allocation patterns among organs is crucial for both predicting the rate and potential of forest carbon sinks and guiding future multifunctional forest management. However, it is still not clear how the site conditions (e.g., elevation) and stand structure (e.g., tree dominance, stand density) affect the biomass allocation of single trees in forests. This study was implemented in the Liupan Mountains of the Loess Plateau of Northwest China by collecting the related information of biomass data of 110 sample trees with different dominance and influencing factors within 23 sample plots of larch plantations set up along the elevation gradient. Based on these data, the response tendency and functions of biomass allocation of single trees to individual influencing factors of site conditions and forest structure were analyzed. Moreover, the results illustrated that the ratio between root biomass and aboveground biomass decreased significantly with rising stand age and tree density, but increased significantly with rising elevation, and there was no significant relationship with the dominance of individual trees. The results of this study revealed the importance of considering the influencing factors of site conditions and stand structure when developing dynamic models of tree biomass allocation. The results and research methods used in this study provide useful tools for quantifying the biomass allocation and carbon storage partitioning in the study area and other similar regions.

1. Introduction

Plant biomass is not only the third largest carbon stock in terrestrial ecosystems but also represents the critical link between the carbon pools in the atmosphere and soil [1,2]; therefore, in 2015, the forest carbon sinks, which have a big portion from plant biomass increment, were included in the Paris Agreement as part of the strategy to alleviate climate change [3]. Accordingly, accurate information on forest carbon storage was requested to be provided by all countries. Thus, attention should be paid not only to the total forest biomass but also to its distribution pattern, because the biomass allocation has a significant impact on plant productivity [4]. Moreover, the biomass allocation ratios of different organs are an important parameter in dynamic global vegetation models, e.g., for estimating the underground biomass from aboveground biomass data [5,6]. In addition, the differences in carbon storage in plant organs affect the rate and potential of forest carbon sinks [7]. Understanding how the determinants of multiple environmental factors influence the carbon allocation pattern will be helpful to improve the ability of accurate prediction of climate–C cycle feedback in terrestrial ecosystems under a changing climate, and to guide forest management toward increasing forest carbon sequestration.
Based on many previous studies, it is clear that the tree biomass allocation is mainly influenced by the climate (precipitation and temperature), geographical factors (elevation, slope gradient, slope aspect, etc.), and biological factors (tree species, tree age, stand density, etc.) [8,9]. However, their relative importance is still a subject of controversy and poorly understood [10,11]. For instance, the effects of age on the productivity of subtropical forests in China have been studied [12], with the conclusion that age may influence biomass and productivity through changes in stand structure as forests develop. Many studies showed that the biomass allocation is closely related to forest density [13]. In addition, the mechanism-based vegetation models that predict the responses to changes in CO2 and climate often predict tree allometry using fixed ratios or scaling laws, despite the fact that these approaches do not capture the known dynamics of carbon allocation and its responses to environmental conditions [14]. Therefore, it is necessary to quantify the dynamic relationship between biomass allocation and environmental factors, such as site conditions and stand structure, so as to accurately estimate forest and carbon reserves.
China has undertaken unprecedented large-scale afforestation across the country, including the Three-North Shelterbelt Program since 1978, and the Grain for Green and Natural Forest Protection Program since 2000 [15,16], with the initial main aim of restoring the deteriorated environment but increasingly also the aim of increasing forest carbon storage. At present, China’s plantation area represents as much as one-third of the world total [17]. As an important national action and measure to mitigate climate change and actively respond to the Paris Agreement, China planned further large-scale afforestation. However, the major challenge regarding China’s forest carbon sequestration work is that there is less and less space suitable for afforestation, and the new afforestation areas are mainly concentrated in the northern semi-arid regions with a harsh environment [18]. Furthermore, the carbon sequestration capacity of China’s forests is poor. The forest stock per hectare is only 72.4% of the world average, only half of that in Brazil, and less than one-third of that in Germany. As a result, the work of forest carbon sequestration will shift from increasing afforestation area to improving forest quality through rational forest management. To address this issue, it is important to understand the impact of site conditions and stand structure on tree biomass allocation.
The tree species of Rupprecht’s larch (Larix principis-rupprechtii Mayr) is a native species widely used for afforestation in the dryland regions of North and Northwest China as fast-growing and high-yielding plantations with the main aim of timber production, or as protective forests for hydrological regulation and soil erosion control. However, the dynamic response of tree biomass allocation to site conditions and stand structure was not studied for the plantation of this tree species [19,20]. Therefore, this study on the response of tree biomass allocation to site conditions and stand structure was implemented in the Liupan Mountains area, where most of the plantations were established since the 1970s using the tree species of Rupprecht’s larch, by the investigation of 110 sample trees within 23 sample plots along the elevation gradients. This study will quantify the variation of tree biomass allocation of the Rupprecht’s larch and supply a basis for the precise estimation of carbon sequestration of this kind of plantation.

2. Materials and Methods
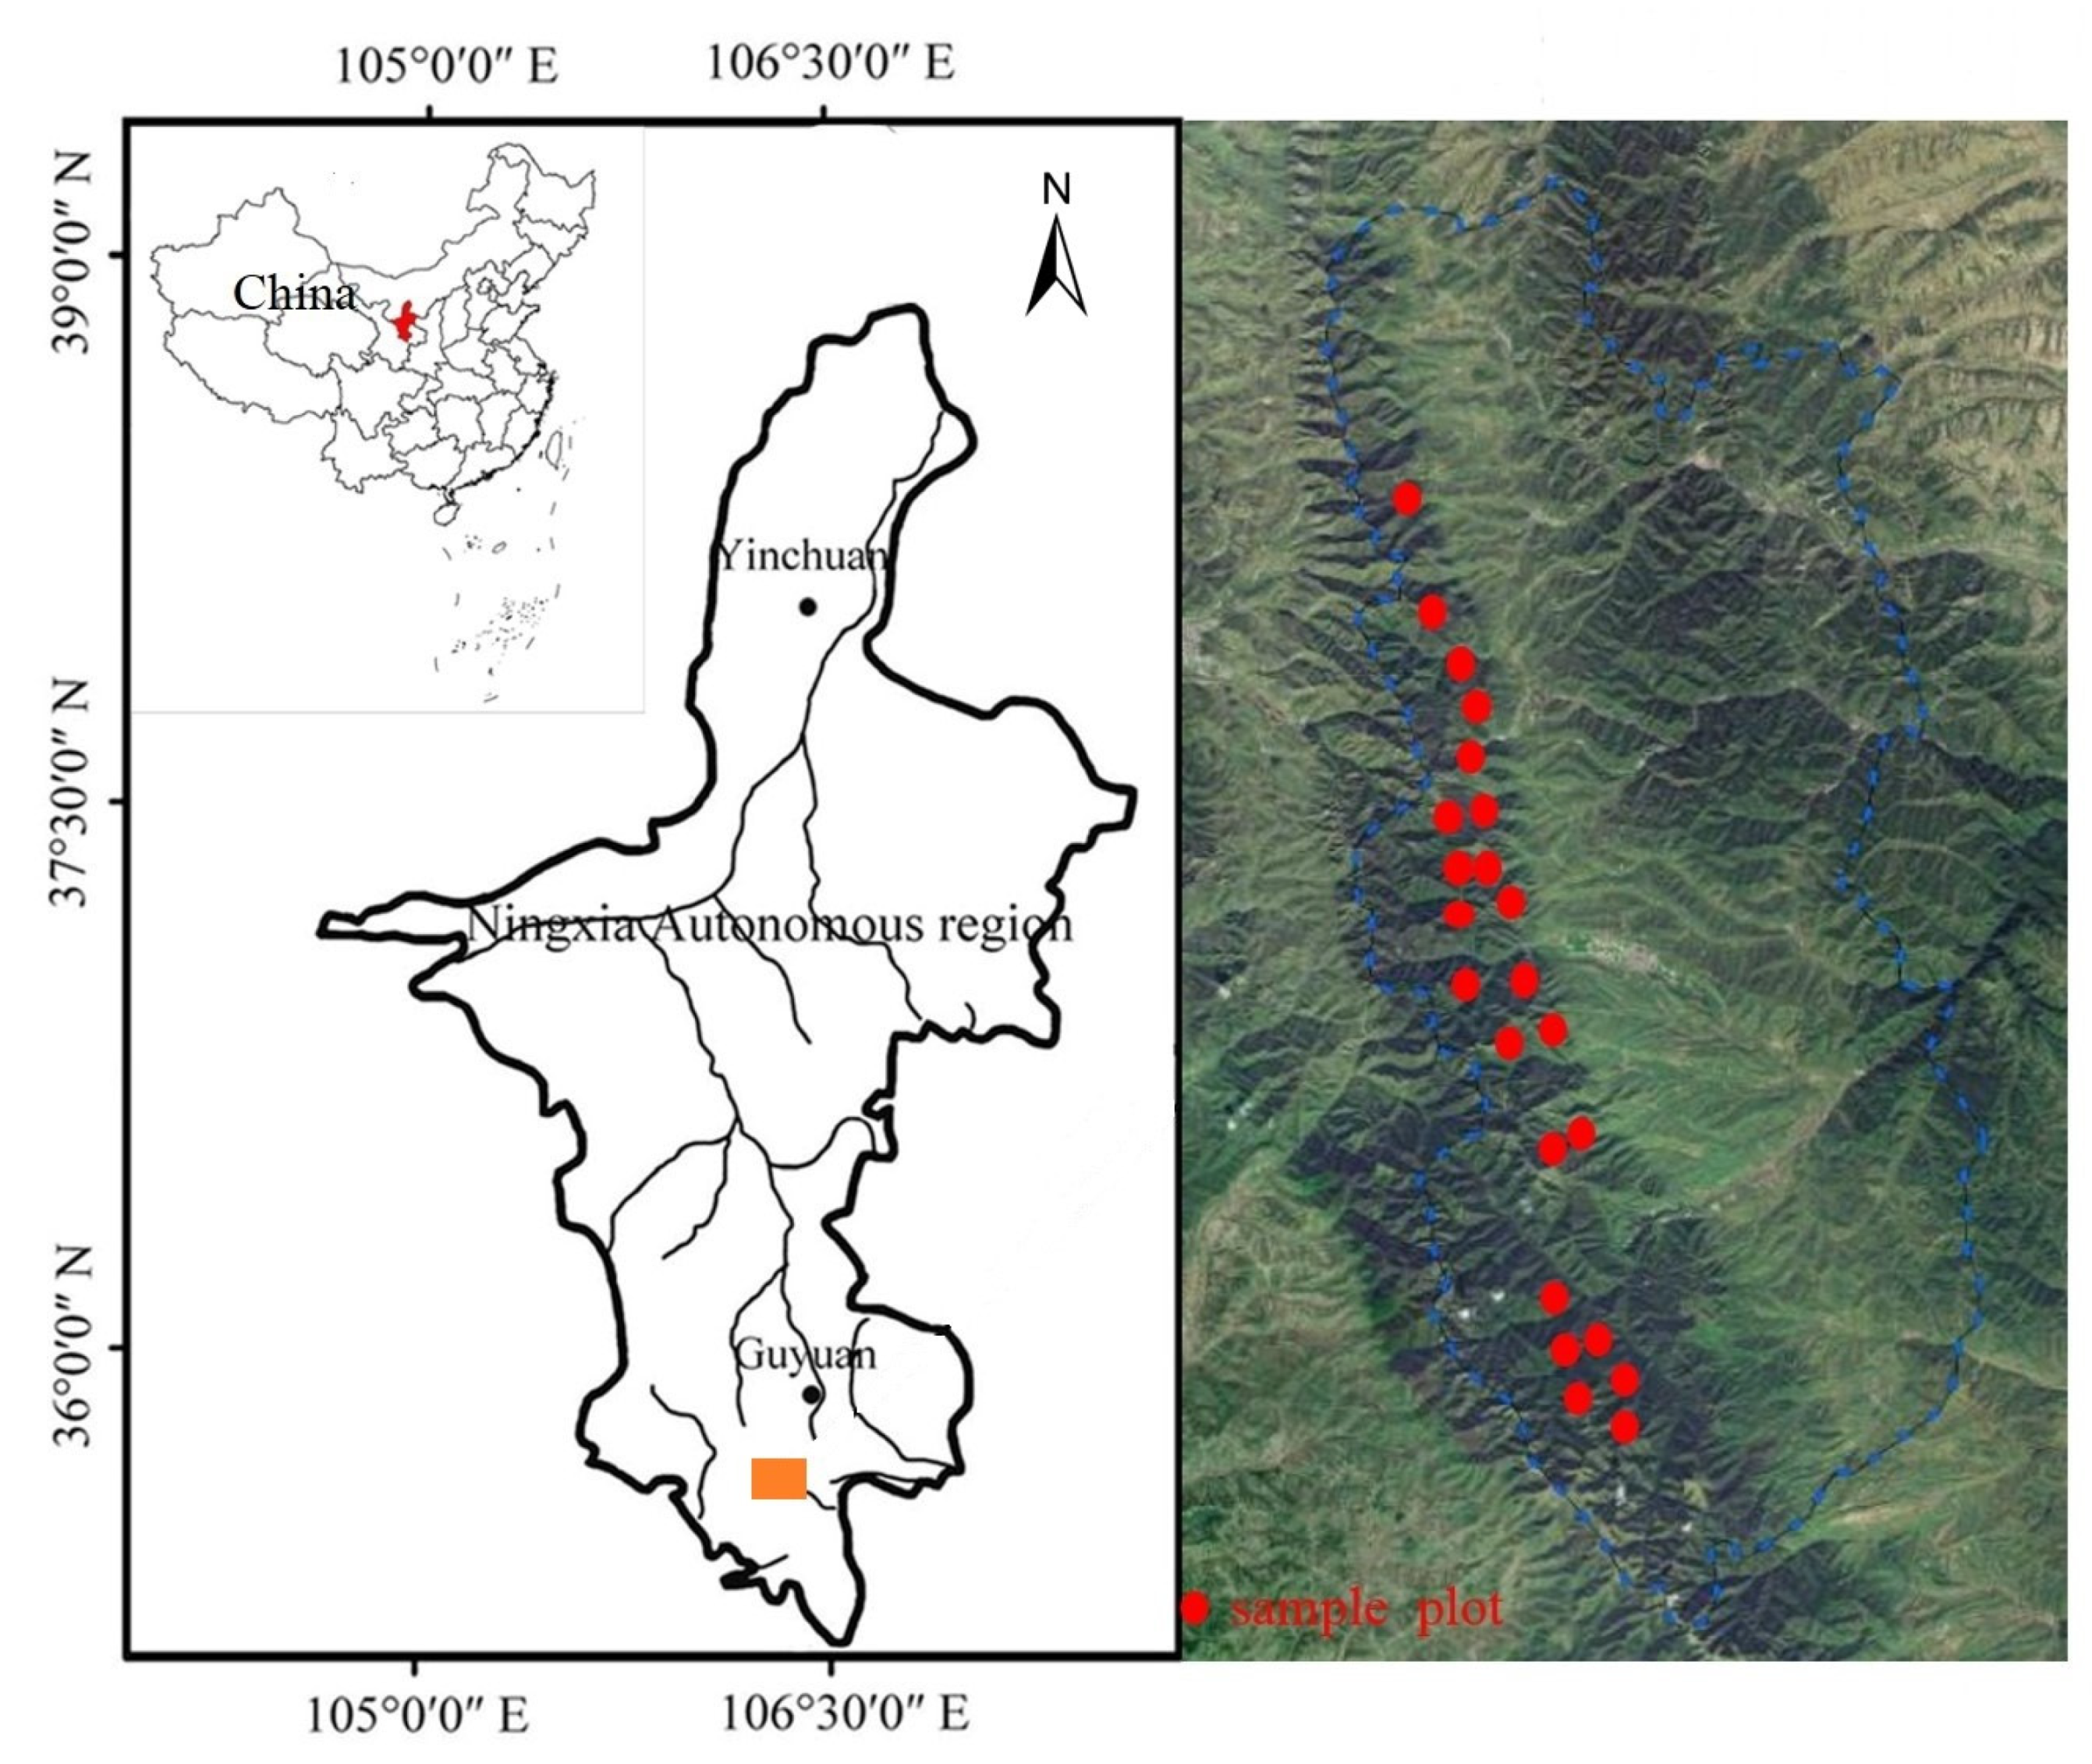
2.1. Study Area

The study area is located in the southern part of the Liupan Mountains (LPM) (106°09′–30′ E, 35°15′–41′ N) in Ningxia, Northwest China (Figure 1). The elevation of LPM ranges within 1900–2942 m a.s.l. LPM has a temperate semi-humid climate with a mean annual air temperature of 5.8 °C, mean annual sunshine duration of 2100–2400 h, and mean annual precipitation of 676 mm, of which 73.3% occurs from June to September. The bedrock is primarily composed of sandy mudstone and calcareous shale. The main soil types are humic cambisols and alpine meadow soil, with a thickness of mostly 0.4–1 m, but rich in fragment content. The main vegetation types in LPM are secondary broadleaved deciduous forests (the tree species including Betula platyphylla Sukaczev, Betula albo-sinensis Burkill, Quercus liaotungensis Koidz., etc.) and meadow at higher elevations (>2800 m). The forest cover amounts to 82.4%, of which 24.4% is plantations of mainly Rupprecht’s larch.
The larch plantations in this area had been established in a similar way on bare ground on which the natural forest had been cut down in the 1960s. Due to the implementation of the “Grain for Green” and “Natural Forest Protection Program” since 2000, mainly for improving the deteriorated environment, there was almost no management measures adopted, such as deforestation and thinning in the research plantations.

2.2. Data Collection

2.2.1. Study Plots and Sample Trees

Twenty-three sample plots of larch plantations with a size of 20 × 20 m were setup on the Liupan Mountains along the elevation gradient within the elevation range of 2000–2940 m a.s.l. These plots covered the variation ranges of tree density, slope gradient, and slope aspect (Table 1).
For each plot, the items of geographic location, site factors (elevation, slope aspect, and slope gradient), and stand structure (tree age, density, height, DBH, canopy diameter, and canopy density) were investigated in the summer of 2019. All the trees in sample plots were measured. Additionally, the dominance of all individual trees was calculated and classified as: (1) dominant, (2) codominant, (3) intermediate, and (4) overtopped according to the Schädelin classification [21]. In this study, there were the 110 sample trees, which did not include any codominant trees.
In addition, the following method was used to convert qualitative data into quantitative data; the relative tree height was used to represent the dominance of individual trees. In order to eliminate the interference of different tree heights in various plots, the height of all individual sample trees was divided by the biggest tree height of the sample plot, and then the difference between the relative tree height of each tree and the mean relative tree height of the sample plot was viewed as the dominance of each tree.

2.2.2. Biomass Assessment

The 110 sample trees were cut down and divided into the following organs: trunk (with bark), branches, leaves (needles), and roots. After obtaining the fresh weight of each organ in the field, representative samples were collected and oven-dried under the temperature of 65 °C and then weighed for calculating the water content. Using these water contents, the dry biomass of each organ and the total biomass of the whole tree were calculated, following the standard method [8]. Then the biomass ratio of each organ to the total tree biomass was obtained for an easy comparison and understanding. The ratio of root biomass to the aboveground biomass (R/S) were calculated. Then the trunk mass fraction, branch mass fraction, leaf mass fraction, and root mass fraction were calculated. The biomass of cones and dead branches was not identified from the branch biomass because of their very low weight and fraction.

2.3. Statistical Analyses

2.3.1. Univariate Response of Biomass Allocation to Site Conditions and Stand Structure

Using the collected data described above, the relationships describing the response of tree biomass allocation to site conditions and stand structure were analyzed using the statistic method of Pearson correlation analysis. The method of upper-boundary line (UBL), a method to show the effect of one factor by minimizing the effects of other factors [22], was used to describe the variation trend of biomass allocation with a single influencing factor and to derive the corresponding response functions. The upper-boundary line was derived using the scatter diagram of measured data obtained from the not-controlled field investigation. For the UBL analysis, the entire variation range for each independent variable was divided into segments. Then, UBL data of dependent variables were selected in each segment when their values were one standard deviation higher than the mean value within each segment [23].

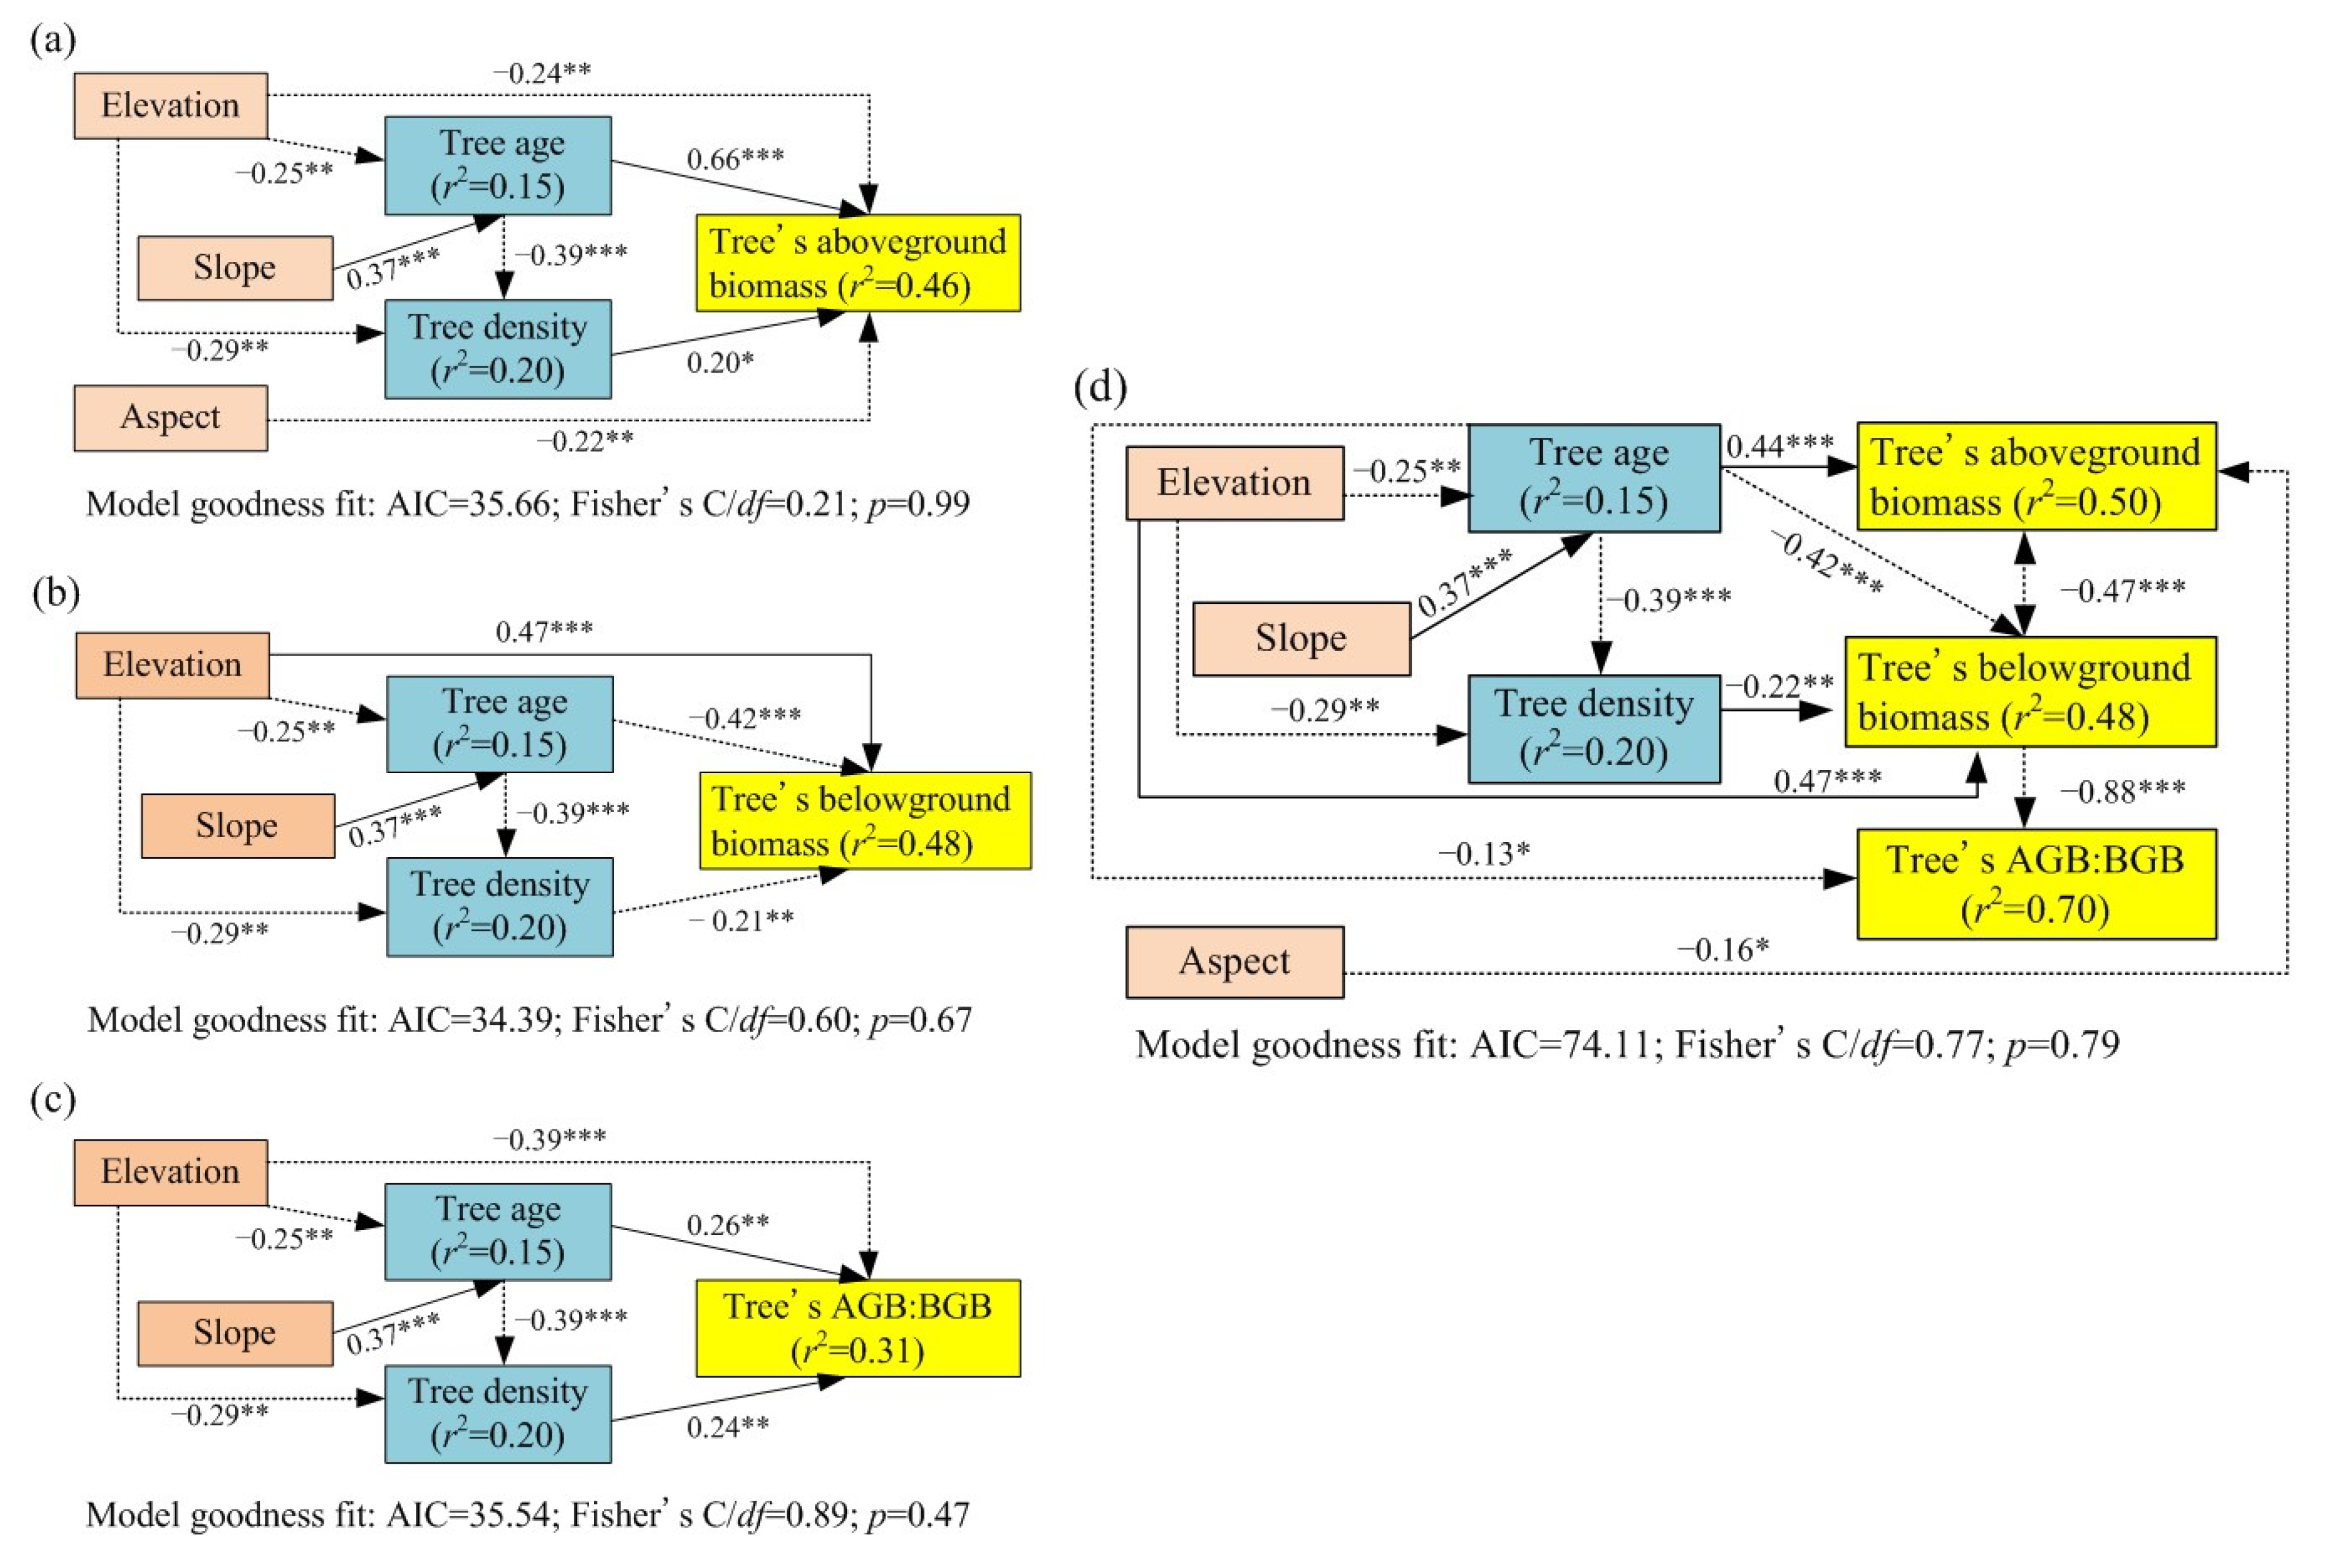
2.3.2. Structural Equation Models of Organ Biomass

Structural equation modeling is the most commonly used statistical method to analyze the relationship between latent variables [24]. Considering that stand structure and site conditions change the utilization of light, water, and other resources, which ultimately affect biomass distribution, a conceptual framework based on a priori ecological knowledge was proposed in which site conditions and stand structure fundamentally determine the biomass allocation of larch trees in the Liupan Mountains. We fitted piecewise structural equation models (SEMs) to demonstrate the direct and indirect effects on the biomass allocation. The piecewise SEMs were conducted using the piecewise SEM package [25]. Variables included site conditions (elevation, slope aspect, and slope gradient) and stand structure (tree age, tree dominance, and tree density). Significantly correlated variables in the Mantel tests were used in the piecewise SEMs, with stand structure as a random effect. Moreover, covariance between significant (p < 0.05) correlated variables were also included in the models. The least significant paths were removed in a stepwise manner from the models based on the Akaike information criterion. Meanwhile, we kept variables in the models with p < 0.1. The final models were selected on the basis of Fisher’s C test showing satisfactory goodness of model fit (i.e., 0 < Fisher’s C/df < 2 and 0.05 < p < 1) [25].

2.3.3. Statistics and Figures

In this study, the statistical analyses were carried out with SPSS 20 (IBM, Armonk, NY, USA). The fitting of UBL equations were carried out with 1stOpt 1.5 based on the nonlinear least squares method and the figures were drawn using Origin 8.0 (OriginLab, Northampton, MA, USA).

3. Results

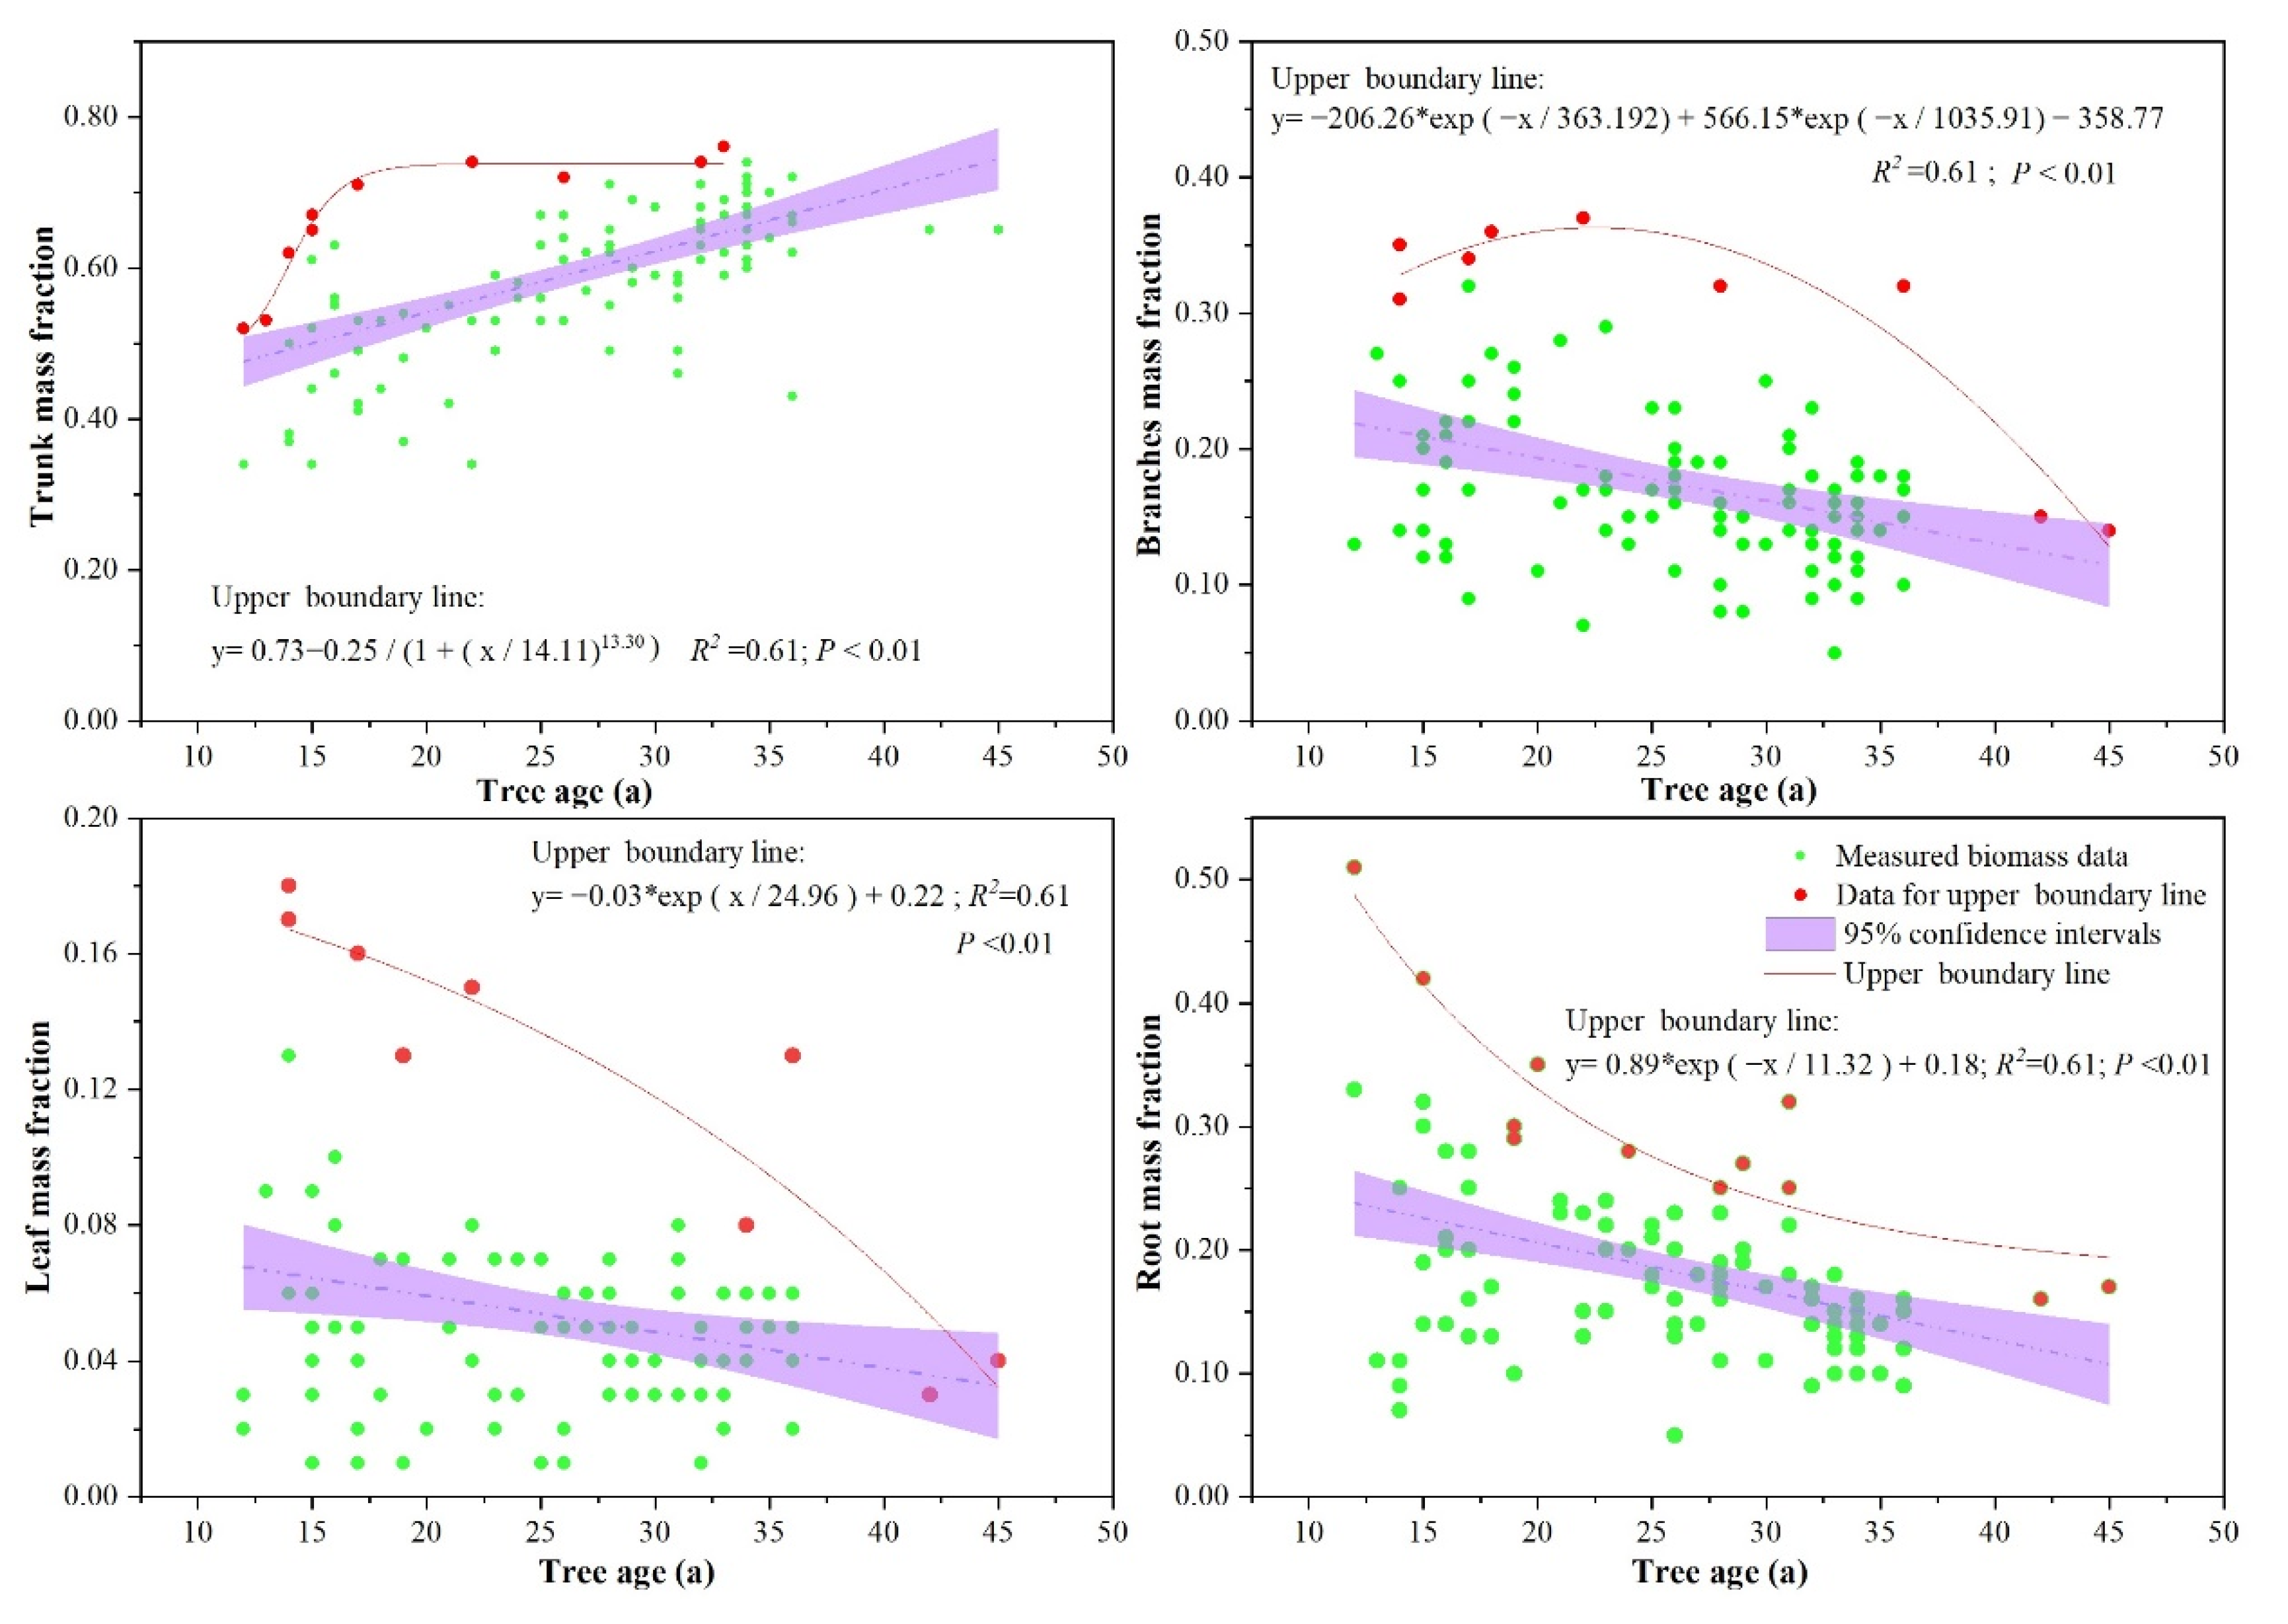
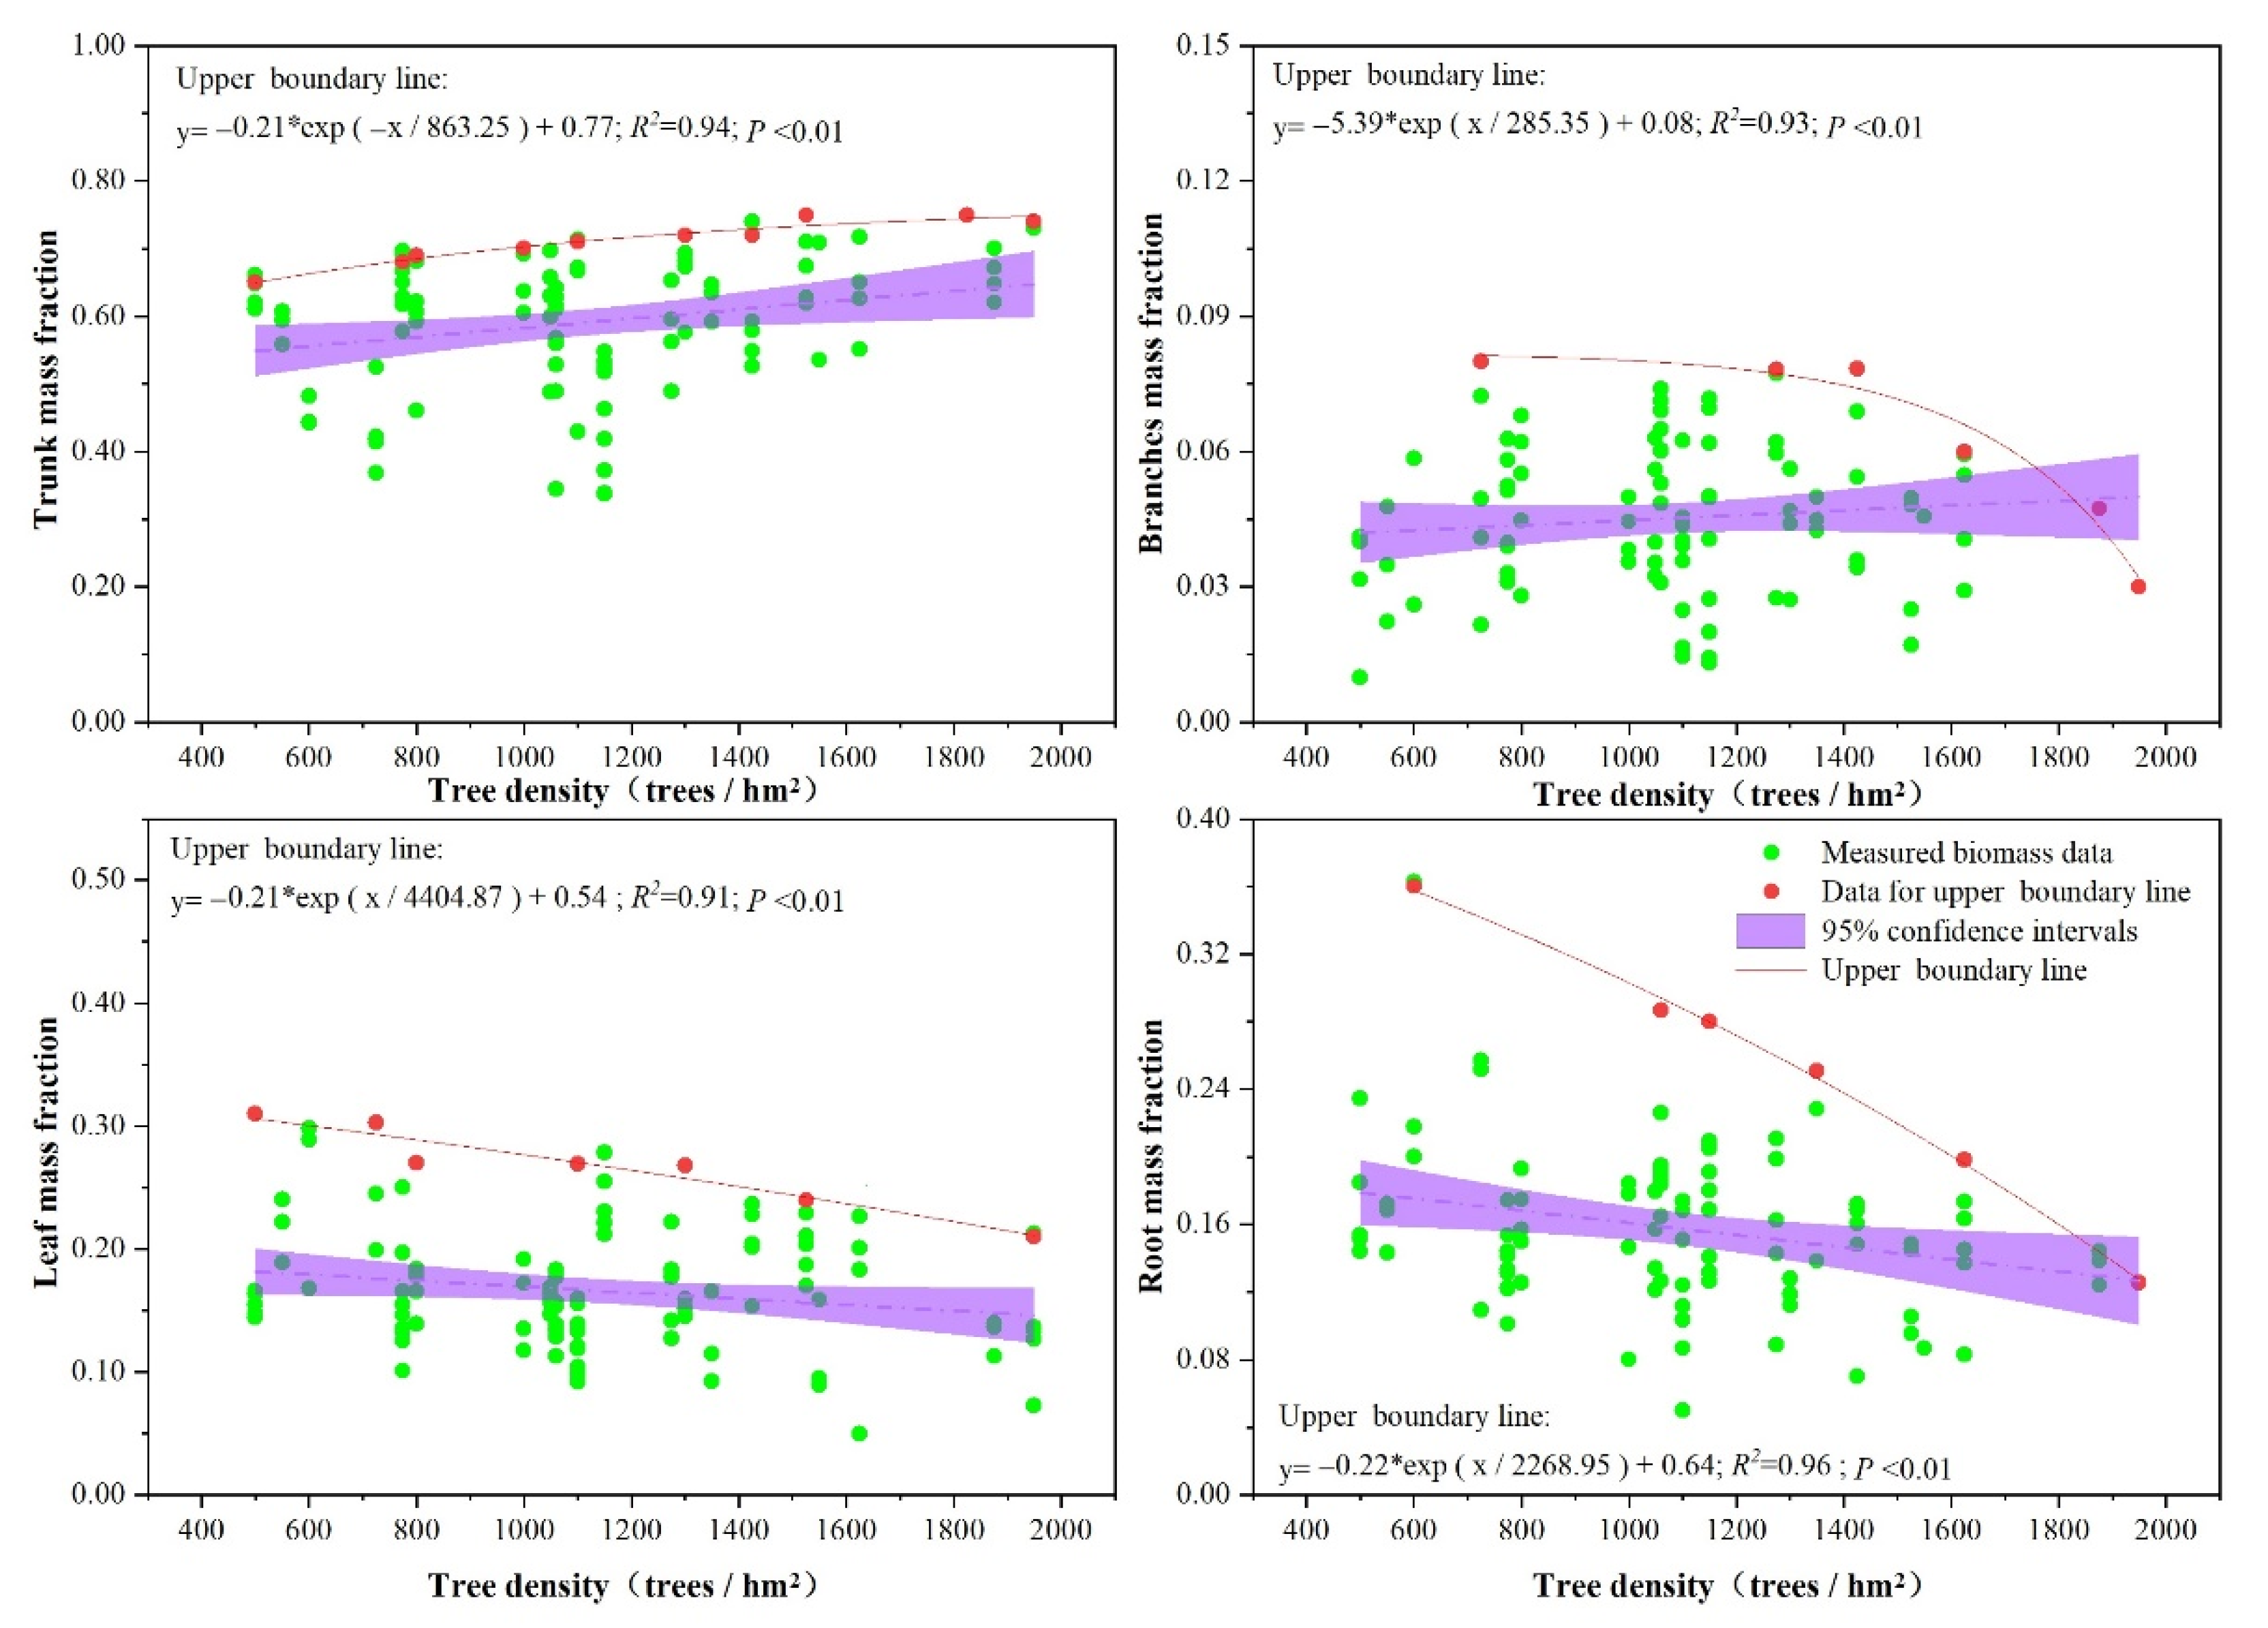
3.1. The Variation of Biomass Allocation with Site Conditions and Stand Structure

As shown in Table 2, the trunk mass fraction showed significant positive correlation with tree age (R2 = 0.61, p < 0.01), and the mass fractions of branches, leaves, and roots were significantly negatively correlated with tree age; the coefficient of Pearson correlation (R2) reached −0.37, −0.26, and −0.42, respectively. Only the trunk mass fraction showed significant positive correlation with tree dominance (R2 = 0.21, p < 0.01). The trunk mass fraction showed significant positive correlation with tree density (R2 = 0.35, p < 0.01), and the mass fraction of branches, leaves, and roots was significant negatively correlated with tree density; the coefficient of Pearson correlation (R2) reached −0.21, −0.38, and −0.27, respectively. The root mass fraction showed significant positive correlation with elevation (R2 = 0.59, p < 0.01), and the mass fraction of trunk and leaves was significant negatively correlated with elevation; the coefficient of Pearson correlation (R2) reached −0.28 and −0.45.

3.2. The R/S Responses to Stand Structure and Site Conditions

The response of R/S ratio to stand structure and site conditions was analyzed using a violin plot. As shown in Figure 2, the tree biomass allocation decreases with rising tree age, from 0.28 ± 0.19 at the age range of 10–20 years to 0.22 ± 0.12 at 20–30 years and 0.18 ± 0.09 at 30–40 years, showing a low and stable R/S ratio at higher ages. Unexpectedly, the effect of tree dominance on R/S ratio was weak, with the values of 0.22 ± 0.09, 0.22 ± 0.12, and 0.28 ± 0.19 for the dominant, intermediate, and overtopped trees. The tree density leads to a decreasing R/S ratio, from 0.26 ± 0.11 at the density range of 500–1000 trees/hm2 to 0.24 ± 0.16 at 1000–1500 trees/hm2 and 0.18 ± 0.19 at 1500–2000 trees/hm2.
The R/S ratio increased with rising elevation, in the case of the 2000–2200, 2200–2400, 2400–2600, 2600–2800, and 2800–3000 m a.s.l., the R/S reached 0.15 ± 0.04, 0.17 ± 0.06, 0.20 ± 0.04, 0.23 ± 0.08, and 0.40 ± 0.18, respectively. Slope aspect was also a significant factor affecting biomass allocation. The results showed that a sunny slope had a higher R/S, followed by a semi-sunny slope and a semi-shady slope, where the ratios reached 0.40 ± 0.12, 0.28 ± 0.09, and 0.23 ± 0.10, respectively, and a shady slope had the lowest R/S of 0.17 ± 0.08. Our results did not support that slope gradient had a significant effect on the R/S ratio. The largest R/S with a mean share as high as 0.26 ± 0.19 was in stands between 10 and 20° slope, while in the stands between 20 and 30° slope, it was 0.21 ± 0.07; in the case of stands of 20–30° slope, the ratio was 0.24 ± 0.11.

3.3. Effects of Stand Structure (Tree Age, Tree Dominance, and Tree Density) on Biomass Allocation

As shown by the UBL in Figure 3, the trunk mass fraction increased firstly quickly with rising tree age to 17 years, and then gradually leveled off. The branch mass fraction firstly increased with rising tree age to 23 years, and then decreased with further rising tree age. The leaf mass fraction showed a continuous decrease with rising tree age. The root mass fraction declined with rising tree age firstly rapidly to 23 years, and thereafter slowly.
As shown in Figure 4, as the dominance increases, the trunk mass fraction increased gradually, both the mass fraction of branches and leaves decreased with tree dominance but at varying rates in different dominance indexes. In the intermediate and overtopped trees, the mass fraction of branches and leaves was relatively stable and essentially constant. In the dominant trees, the mass fraction of leaves and branches showed a rapid downward trend. The root mass fraction increased rapidly with the increase of dominance index in the overtopped trees and remained stable in the dominant and intermediate trees.
It was found that the trunk mass fraction increased with the rising tree density (Figure 5). The mass fraction of branches and leaves had the same trend with the change in tree density, which showed the trend of slow decrease, and finally rapid decrease. When the tree density was less than 800 trees/hm2, the mass fraction of branches and leaves decreased slowly. When the tree density was greater than 1600 trees/hm2, the mass fraction of branches and leaves began to decrease rapidly. The root mass fraction decreased rapidly with the increase of tree density.

3.4. Effects of Elevation on Biomass Allocation

As shown in Figure 6, it was found that the mass fraction of leaf and branch biomass decreased with rising elevation, while the root mass fraction increased with the elevation. The elevation of 2800 m a.s.l. was the inflection point of the change in trunk biomass allocation; when the elevation was more than 2800 m a.s.l., the trunk mass fraction decreased rapidly.

3.5. Establishment of Tree Biomass Allocation Multifactor Model

The piecewise structural equation models (SEMs) in Figure 7 demonstrated that integrating the site conditions and stand structures can explain 46% of the variations of aboveground biomass (AGB) allocations, 48% of the variations of belowground biomass (BGB) allocations, and 31% of the variation of the AGB-BGB trade-off (Figure 7a–c). Specifically, the proportion of aboveground biomass allocation increased with rising tree density and age, while it decreased with rising elevation. Moreover, only the aboveground biomass allocation was affected by the slope aspect (Figure 7a). However, the stands allocated more biomass to the underground part with rising elevation, which also drove tree density negatively (Figure 7b). Interestingly, the tree dominance and slope gradient had non-significant direct effects on the proportions of aboveground and belowground biomass allocation (Figure 7a,b). Collectively, the allocation trade-off between aboveground and belowground biomass resulted fundamentally from elevation—the higher the stands were located, the more allocation of biomass to the underground (Figure 7c). When all variables were integrated together, the final model verified the accuracy of the above separate models, in which the explanation rates of the dependent variables were improved (Figure 7d). As a supplement, the final model demonstrated that the belowground biomass allocation had a critical effect on deciding the trade-off of AGB and BGB with a related coefficient of 0.88 (Figure 7d).

4. Discussion

4.1. Effects of Stand Structure on Biomass Allocation

This study showed that all the stand structure parameters (tree age, tree dominance, tree density) influenced the tree biomass allocation of larch plantations significantly.
The age effect is a result of the balance between the tree growth and the distribution of photosynthetic products among tree organs [26,27]. The increase of aboveground biomass allocation is an integrated result of the counteracting variations of aboveground organs, i.e., increasing proportion of trunk biomass and decreasing proportion of leaf and branch biomass with rising tree age (Figure 1). This is consistent with the findings in previous studies [28,29,30,31,32]. This is primarily due to the rapid expansion of leaves and branches in the early stages of forest development, which is essential for photosynthesis and tree survival [29,33]. Then, as the tree age increases, more resources are allocated to stem growth due to ontogeny and tree size [34]. At the same time, as the stand canopy becomes more closed, the further growth of the tree crown is limited, and leaf and branch biomass increase more slowly than stem biomass, which continues to increase as a result of physical adaptation to ensure tree stability [29].
The tree dominance influences the tree growth and biomass allocation. Naidu [35] found that trees with poor dominance allocate more biomass to the trunk and less to branches and leaves than trees with high dominance. Peri [36] found that under the same forest age and site conditions, the whole biomass of dominant trees of beech was much larger than that of overtopped trees. Some studies also have found that the tree dominance affect the biomass allocation more greatly than tree density. In contrast to the above, the results of this study confirmed that the tree dominance had a weak effect on biomass allocation. This is because, compared with other studies, our study mainly focused on high-density plantations. Trees should firstly allocate more resources to the trunk in cases of increased competition for light caused by high density. The high density of the studied plantations affects the biomass allocation significantly more than the tree dominance.
Management of forest density has been recognized as a tool that provides forest managers with the opportunity to optimize growth and yield [37,38,39,40]. Knowledge of the relationship between tree density and biomass allocation could have direct implications for forest management decision making [41]. Some studies found that the average response to increasing plant density was a small decrease in the leaf mass fraction and root mass fraction and an increase in the trunk mass fraction. The authors explained that these phenomena were connected to the near-unidirectional nature of light in a closed canopy, where the positioning of the leaves at the top of the canopy was of utmost importance for light interception; therefore, an increase in stem length was essential [42]. In contrast to the above, our results show that with the increase in tree density, the trunk mass fraction gradually increased, while the mass fraction of branches, leaves, and roots significantly decreased. These trends are similar to those found in some other studies. However, our study showed that the biomass allocation ratio of roots decreased with the increase in density, contrarily to other studies. This is mainly because our research focuses on young forest with high density, and the trees need to invest more resources into trunks at an early stage of growth in order to compete for light resources in high-density stands.
The R/S ratio has been widely used for carbon stock estimation and is a key parameter for terrestrial ecosystem C modeling [43,44]. Some studies have reported that no significant correlation was found between R/S ratio and tree age [45]. However, other studies have found a significant correlation between R/S ratio and tree age [46,47], and some research showed that stand age and R/S ratio were positively correlated in coniferous forests across China, but no significant correlation was observed in broadleaved forests [48]. Our results found that the R/S ratio decreased significantly with rising tree age. This is inconsistent with the aforementioned studies, and the results about root biomass allocation are similar to those of previous studies, where the relative proportion of root biomass decreased considerably after stand establishment and then stabilized to a certain value [49]. Therefore, due to the influence of other factors such as forest age, the variation of R/S ratio needs to be considered to avoid considerable errors in root biomass and C stock estimates.

4.2. Effects of Site Conditions on Biomass Allocation

Elevation, slope aspect, slope gradient, and soil layer thickness are the most important site condition factors affecting tree biomass distribution. These environmental factors mainly affect tree biomass distribution through changes in light, temperature, nutrients, and water in the affected area. Among these, elevation mainly affects the distribution of regional hydrothermal conditions, that is, the vertical distribution of temperature change, water evapotranspiration, and precipitation [50,51,52]. The biomass distribution in different regions may have different responses to a change in elevation [53]. In some research, aboveground and belowground carbon was expected to decrease with elevation [54,55,56]. However, other patterns of aboveground association with elevation have been reported: positive monotone [57], single peak [58], double peak [59], or empty peak [60]. Slope aspect and slope gradient mainly affect the change of solar radiation, and the distribution of tree biomass varies significantly in different slope aspects. Generally, the solar radiation time on the sunny slope is longer than that on the shady slope. Because the study area is mainly affected by a semi-humid climate, the Rupprecht’s larch distributed in low latitudes were significantly affected by drought [61]. In the high-elevation section, the Rupprecht’s larch exhibits higher growth on sunny and semi-sunny slopes [20]. Our results show that with the increase in elevation, the proportion of aboveground biomass was gradually decreasing. On the contrary, the proportion of underground biomass was increasing, similarly to the results of other research; this is mainly due to the slow growth of the aboveground parts of the trees at high altitudes due to wind and low temperatures. Therefore, in this study area, the main site conditions affecting the biomass distribution of larch plantation are elevation and slope aspect, but attention should be paid to the influence of soil moisture caused by site conditions in local areas.

5. Conclusions

The study was based on a comparatively large dataset, and the effects of site conditions and stand structure on the biomass distribution of organs and individuals were discussed. The results show that the dynamic changes in biomass allocation should be taken into account in forest management. In the larch plantation of the study area, tree density was the primary consideration factor, with greater influence than the tree dominance. Attention should also be given to the impact of site conditions on the biomass of larch plantations. The main influencing factors are elevation and slope aspect; however, the influence of soil moisture caused by local three-dimensional conditions should not be ignored. In order to improve the accuracy of forest carbon sink calculation and evaluation, we suggest that the establishment of a root–shoot dynamic ratio and model with site and stand structure should be considered; in addition, even though stem biomass is the largest component of biomass, leaf and branch biomass are also important for C storage and should be included in C accounting in forests, particularly in young plantations.
On the basis of previous studies, our study considered the effects of stand structure and site conditions on forest biomass allocation and tried to establish the dynamic relationship between them. This research method and results indicate the determined relationships can adequately characterize the carbon sink of North China larch in this region, though whether these relationships can be applied to stands in other regions would need further testing. In future studies, more attention should be given to more adequately describing the effects of soil conditions, such as soil moisture, soil physical properties, and soil chemical properties on tree biomass distribution.

Author Contributions

Conceptualization, X.W., X.H. and P.Y.; methodology, Y.W.; data curation, X.W.; formal analysis, X.W.; writing—original draft preparation, X.W.; writing—review and editing, Y.W. and P.Y.; supervision, J.G. All authors have read and agreed to the published version of the manuscript.

Funding

This work was funded by the Central Public-Interest Scientific Institution Basal Research Fund of Chinese Academy of Forestry (CAFYBB2021ZW002), the National Natural Science Foundation of China (U20A2085, U21A2005, 41971038).

Institutional Review Board Statement

Not applicable.

Informed Consent Statement

Not applicable.

Data Availability Statement

The data presented in this study are available from corresponding authors upon reasonable request.

Acknowledgments

We sincerely thank the Forest Administration of Liupan Mountains for providing the research site for this experiment. We also thank the long-term forest ecological station of Liupan Mountains of the National Forestry and Grassland Administration of China (NFGAC) and the NFGAC Key Laboratory for Forest Ecology and Environment Provide support to this work.

Conflicts of Interest

The authors declare no conflict of interest.

References

  1. Schimel, D.S. Terrestrial ecosystems and the carbon cycle. Glob. Chang. Biol. 1995, 1, 77–91. [Google Scholar] [CrossRef]
  2. Zhou, L.; Liu, H.; Zhou, G.; Zhou, X.; Hong, Y.; Li, C.; Lu, C.; He, Y.; Shao, J.; Sun, X.; et al. Responses of biomass allocation to multi-factor global change: A global synthesis. Agr. Ecosyst. Environ. 2020, 304, 107115. [Google Scholar] [CrossRef]
  3. Aguirre, A.; Río, M.D.; Ruiz-Peinado, R.; Condés, S. Stand-level biomass models for predicting c stock for the main spanish pine species. For. Ecosyst. 2021, 8, 29. [Google Scholar] [CrossRef]
  4. Agathokleous, E.; Belz, R.G.; Kitao, M.; Koike, T.; Calabrese, E.J. Does the root to shoot ratio show a hormetic response to stress? An ecological and environmental perspective. J. For. Res. 2019, 30, 1569–1580. [Google Scholar] [CrossRef] [Green Version]
  5. Mokany, K.; Raison, R.J.; Prokushkin, A.S. Critical analysis of root: Shoot ratios in terrestrial biomes. Glob. Chang. Biol. 2006, 12, 84–96. [Google Scholar] [CrossRef]
  6. Litton, C.M.; Raich, J.W.; Ryan, M.G. Carbon allocation in forest ecosystems. Glob. Chang. Biol. 2007, 13, 2089–2109. [Google Scholar] [CrossRef] [Green Version]
  7. Yin, Q.; Tian, T.; Han, X.; Xu, J.; Chai, Y.; Mo, J. The relationships between biomass allocation and plant functional trait. Ecol. Indic. 2019, 102, 302–308. [Google Scholar] [CrossRef]
  8. Poorter, H.; Nagel, O. The role of biomass allocation in the growth response of plants to different levels of light, CO2, nutrients and water: A quantitative review. Funct. Plant Biol. 2000, 27, 595–607. [Google Scholar] [CrossRef]
  9. Toledo, M.; Poorter, L.; Pea-Claros, M.; Alarcón, A.; Bongers, F. Climate is a stronger driver of tree and forest growth rates than soil and disturbance. J. Ecol. 2011, 99, 254–264. [Google Scholar] [CrossRef]
  10. Chen, Y.; Liu, Z.; Rao, X.; Wang, X.; Liang, C.; Lin, Y.; Zhou, L.; Cai, X.-A.; Fu, S. Carbon storage and allocation pattern in plant biomass among di_erent forest plantation stands in Guangdong, China. Forests 2015, 6, 794–808. [Google Scholar] [CrossRef] [Green Version]
  11. Zhou, X.; Cai, Q.; Xiong, X.; Fang, W.; Zhu, J.; Zhu, J.; Ji, C. Ecosystem carbon stock and within-system distribution in successional Fagus lucida forests in Mt. Yueliang, Guizhou, China. Chin. J. Plant Ecol. 2018, 42, 703–712. [Google Scholar]
  12. Ouyang, S.; Xiang, W.; Wang, X.; Xiao, W.; Chen, L.; Li, S.; Sun, H.; Deng, X.; Forrester, D.I.; Zeng, L. Effects of stand age, richness and density on productivity in subtropical forests in China. J. Ecol. 2019, 107, 2266–2277. [Google Scholar] [CrossRef]
  13. Wertz, B.; Bembenek, M.; Karaszewski, Z.; Ocha, W.; Mederski, P.S. Impact of stand density and tree dominance on aboveground biomass allocation of scots pine Pinus sylvestris L. Forests 2020, 11, 765. [Google Scholar] [CrossRef]
  14. Trugman, A.T.; Anderegg, L.D.L.; Wolfe, B.T.; Birami, B.; Anderegg, W.R.L. Climate and plant trait strategies determine tree carbon allocation to leaves and mediate future forest productivity. Glob. Chang. Biol. 2019, 25, 3395–3405. [Google Scholar] [CrossRef] [Green Version]
  15. Li, Q.; Liu, Z.; Zander, P.; Hermanns, T.; Wang, J. Does farmland conversion improve or impair household livelihood in small holder agriculture system? A case study of Grain for Green project impacts in China’s Loess Plateau. World Dev. Pers. 2016, 2, 43–54. [Google Scholar] [CrossRef]
  16. Wang, S.; Fu, B.; Chen, H.; Liu, Y. Regional development boundary of China’s Loess Plateau: Water limit and land shortage. Land Use Policy 2018, 74, 130–136. [Google Scholar] [CrossRef]
  17. Wang, G.; Innes, J.L.; Lei, J.; Dai, S.; Wu, S.W. China’s forestry reforms. Science 2007, 318, 1556–1557. [Google Scholar] [CrossRef] [Green Version]
  18. Liu, H. It is difficult for Chinas greening through large-scale afforestation to cross the Hu Line. Sci. China Earth Sci. 2019, 62, 194–196. [Google Scholar] [CrossRef]
  19. Wang, Y.; Bonell, M.; Feger, K.H.; Yu, P.; Xiong, W.; Xu, L. Changing forestry policy by integrating water aspects into forest/vegetation restoration in dryland areas in China. Bull. Chin. Acad. Sci. 2012, 26, 59–67. [Google Scholar]
  20. Tian, A.; Wang, Y.; Webb, A.A.; Yu, P.; Liu, Z.; Wang, X. Water yield variation with elevation, tree age and density of larch plantation in the liupan mountains of the loess plateau and its forest management implications. Sci. Total Environ. 2020, 752, 141752. [Google Scholar] [CrossRef]
  21. Schädelin, W. Die Durchforstung als Auslese-und Veredelungsbetrieb Höchster Wertleistung; Verlag Paul Haupt, Bern-Leipzig: Bern, Switzerland, 1936; pp. 23–26. [Google Scholar]
  22. Struhar, M.; Tomsik, K.; Mimra, K. Application of the “boundary line analysis method” for the optimisation of the number of tractors used in an agricultural company. Agr. Econ. 2014, 38, 303–319. [Google Scholar]
  23. Da, R.; Zhang, Y.; Guo, J.; Wang, J.; Chen, S. Effect of thinning intensity on growth of Larix principis-rupprechtii by using survey method of circular sample of target tree. Chin. Agr. Sci. Bull. 2016, 32, 11–15. [Google Scholar]
  24. Ali, A.; Sanaei, A.; Li, M.; Asadi Nalivan, O.; Pour, M.J.; Valipour, A.; Karami, J.; Aminpour, M.; Kaboli, H.; Askari, Y. Big-trees—Energy mechanism underlies forest diversity and aboveground biomass. For. Ecol. Manag. 2020, 461, 117968. [Google Scholar] [CrossRef]
  25. Lefcheck, J.S. piecewiseSEM: Piecewise structural equation modelling in r for ecology, evolution, and systematics. Methods Ecol. Evol. 2016, 7, 573–579. [Google Scholar] [CrossRef]
  26. Landsberg, J.; Sands, P. Physiological Ecology of Forest Production; Academic Press: London, UK, 2011; pp. 30–35. [Google Scholar]
  27. Xiang, W.; Li, L.; Ouyang, S.; Xiao, W.; Zeng, L.; Chen, L. Effects of stand age on tree biomass partitioning and allometric equations in chinese fir (cunninghamia lanceolata) plantations. Eur. J. For. Res. 2021, 140, 317–332. [Google Scholar] [CrossRef]
  28. Saint-André, L.; M’Bou, A.T.; Mabiala, A.; Mouvondy, W.; Jourdan, C.; Roupsard, O.; Deleporte, P.; Hamel, O.; Nouvellon, Y. Age related equations for above- and below-ground biomass of a Eucalyptus hybrid in Congo. For. Ecol. Manag. 2005, 205, 199–214. [Google Scholar] [CrossRef]
  29. Peichl, M.; Arain, M.A. Allometry and partitioning of above- and belowground tree biomass in an age-sequence of white pine forests. For. Ecol. Manag. 2007, 253, 68–80. [Google Scholar] [CrossRef]
  30. Seo, Y.O.; Lee, Y.J.; Lumbres, R.I.C.; Pyo, J.K.; Kim, R.H.; Son, Y.M.; Lee, K.H. Influence of stand age class on biomass expansion factor and allometric equations for Pinus rigida plantations in South Korea. Scand. J. For. Res. 2013, 28, 566–573. [Google Scholar] [CrossRef]
  31. Li, H.; Li, C.; Zha, T.; Liu, J.; Jia, X.; Wang, X.; Chen, W.; He, G. Patterns of biomass allocation in an age-sequence of secondary Pinus bungeana forests in China. For. Chron. 2014, 90, 169–176. [Google Scholar] [CrossRef] [Green Version]
  32. Lim, H.; Lee, K.H.; Lee, K.H.; Park, I.H. Biomass expansion factors and allometric equations in an age sequence for Japanese cedar (Cryptomeria japonica) in southern Korea. J. For. Res. 2014, 18, 316–322. [Google Scholar] [CrossRef]
  33. Fatemi, F.R.; Yanai, R.D.; Hamburg, S.P.; Vadeboncoeur, M.A.; Arthur, M.A.; Briggs, R.D.; Levine, C.R. Allometric equations for young northern hardwoods: The importance of age-specific equations for estimating aboveground biomass. Can. J. For. Res. 2011, 41, 881–891. [Google Scholar] [CrossRef]
  34. Mensah, S.; Kaka, R.G.; Seifert, T. Patterns of biomass allocation between foliage and woody structure: The effects of tree size and specific functional traits. Ann. For. Res. 2016, 59, 49–60. [Google Scholar] [CrossRef] [Green Version]
  35. Naidu, S.L.; DeLucia, E.H.; Thomas, R.B. Contrasting patterns of biomass allocation in dominant and suppressed loblolly pine. Can. J. For. Res. 1998, 128, 1116–1124. [Google Scholar] [CrossRef]
  36. Peri, P.L.; Gargaglione, V.; Pastur, G.M. Dynamics of above- and below-ground biomass and nutrient accumulation in an age sequence of Nothofagus antartica forest of southern Patagonia. For. Ecol. Manag. 2006, 233, 85–99. [Google Scholar] [CrossRef]
  37. Zeide, B. Optimal stand density: A solution. Can. J. For. Res. 2004, 34, 846–854. [Google Scholar] [CrossRef]
  38. Zhang, J.; Oliver, W.W.; Ritchie, M.W. Effect of stand densities on stand dynamics in white fir (Abies concolor) forests in northeast California, USA. For. Ecol. Manag. 2007, 244, 50–59. [Google Scholar] [CrossRef]
  39. MacDonald, E.; Hubert, J. A review of the effects of silviculture on timber quality of Sitka spruce. For. Inst. For. Great Br. 2002, 75, 107–138. [Google Scholar] [CrossRef] [Green Version]
  40. Bembenek, M.; Karaszewski, Z.; Kondracki, K.; Łacka, A.; Mederski, P.S.; Skorupski, M.; Strzeli’nski, P.; Sułkowski, S.; Wegiel, A. Value of merchantable timber in Scots pine stands of different densities. Drewno 2014, 57, 133–142. [Google Scholar]
  41. Gizachew, B.; Brunner, A. Density-growth relationships in thinned and unthinned Norway spruce and Scots pine stands in Norway. Scand. J. For. Res. 2011, 26, 543–554. [Google Scholar]
  42. Poorter, H.; Niklas, K.J.; Reich, P.B.; Oleksyn, J.; Poot, P.; Mommer, L. Biomass allocation to leaves, stems and roots: Meta-analyses of interspecific variation and environmental control. N. Phytol. 2012, 193, 30–50. [Google Scholar] [CrossRef]
  43. Baskaran, P.; Hyvönen, R.; Berglund, S.L.; Clemmensen, K.E.; Ågren, G.I.; Lindahl, B.D.; Manzoni, S. Modelling the influence of ectomycorrhizal decomposition on plant nutrition and soil carbon sequestration in boreal forest ecosystems. N. Phytol. 2011, 213, 1452–1465. [Google Scholar] [CrossRef]
  44. Wang, Y.; Deng, L.; Wu, G.; Wang, K.; Shangguan, Z. Large-scale soil organic carbon mapping based on multivariate modelling: The case of grasslands on the Loess Plateau. Land Degrad. Dev. 2018, 29, 26–37. [Google Scholar] [CrossRef]
  45. Wang, J.; Fan, X.; Fan, J.; Zhang, C.; Xia, F. Effects of tree competition on the biomass partitioning of Abies nephrolepis. Sci. Silvae Sin. 2012, 48, 14–20. [Google Scholar]
  46. Landuyt, D.; Maes, S.L.; Depauw, L.; Ampoorter, E.; Blondeel, H.; Perring, M.P.; Brūmelis, G.; Brunet, J.; Decocq, G.; den Ouden, J.; et al. Drivers of above-ground understorey biomass and nutrient stocks in temperate deciduous forests. J. Ecol. 2020, 108, 982–997. [Google Scholar] [CrossRef]
  47. Don, A.; Janssens, I.A.; Marin, G.; Schulze, E.D. Effects of forest management on biomass stocks in romanian beech forests. For. Ecosyst. 2019, 6, 19. [Google Scholar] [CrossRef] [Green Version]
  48. Guo, B.; Zhong, Q.; Ma, Y.; Lu, H.; Jin, B.; Li, M.; Zheng, Y.; Cheng, D. The effect of stand and climatic factors on the root–shoot allocation in Chinese natural forest. Chin. J. Appl. Environ. Biol. 2016, 22, 326–331. [Google Scholar]
  49. Tobin, B.; Nieuwenhuis, M. Biomass expansion factors for Sitka spruce (Picea sitchensis (Bong). Carr.) in Ireland. Eur. J. For. Res. 2005, 126, 189–196. [Google Scholar] [CrossRef]
  50. Li, B.; Suzuki, J.I.; Hara, T. Latitudinal variation in plant size and relative growth rate in Arabidopsis thaliana. Oecologia 1998, 115, 293–301. [Google Scholar] [CrossRef]
  51. Primiciaa, I.; Camarerob, J.J.; Jandaa, P. Age, competition, disturbance and elevation effects on tree and stand growth response of primary Picea abies forest to climate. For. Ecol. Manag. 2015, 354, 77–86. [Google Scholar] [CrossRef]
  52. Tom, E. Growth and shoot: Root ratio of seedlings in relation to nutrient availability. Plant Soil 1995, 18, 259–274. [Google Scholar]
  53. de Castilho, C.V.; Magnusson, W.E.; de Araújo, R.N.O. Variation in aboveground tree live biomass in a central Amazonian Forest: Effects of soil and topography. For. Ecol. Manag. 2006, 234, 85–96. [Google Scholar] [CrossRef]
  54. Girardin, C.A.J.; Farfan-Rios, W.; Garcia, K.; Feeley, K.J.; Jørgensen, P.M.; Murakami, A.A. Spatial patterns of above-ground structure, biomass and composition in a network of six Andean elevation transects. Plant Ecol. Divers. 2013, 7, 161–171. [Google Scholar] [CrossRef]
  55. Pastorella, F.; Paletto, A. Biomass allocation in natural regeneration of Fagus sylvatica and Picea abies trees in Italian alps. For. Stud. 2014, 61, 35–46. [Google Scholar] [CrossRef] [Green Version]
  56. Cruz-Amo, L.D.L.; Baares-De-Dios, G.; Cala, V.; Cerda, G.D.L.; Cayuela, L. Trade-offs among aboveground, belowground, and soil organic carbon stocks along altitudinal gradients in Andean tropical montane forests. Front. Plant Sci. 2020, 11, 106. [Google Scholar] [CrossRef] [Green Version]
  57. Tashi, S.; Singh, B.; Keitel, C.; Adams, M. Soil carbon and nitrogen stocks in forests along an altitudinal gradient in the eastern Himalayas and a meta-analysis of global data. Glob. Chang. Biol. 2016, 22, 2255–2268. [Google Scholar] [CrossRef]
  58. Ensslin, A.; Rutten, G.; Pommer, U.; Zimmermann, R.; Hemp, A.; Fischer, M. Effects of elevation and land use on the biomass of trees, shrubs and herbs at Mount Kilimanjaro. Ecosphere 2015, 6, 1–15. [Google Scholar] [CrossRef] [Green Version]
  59. Venter, M.; Dwyer, J.; Dieleman, W.; Ramachandra, A.; Gillieson, D.; Laurance, S. Optimal climate for large trees at high elevations drives patterns of biomass in remote forests of Papua New Guinea. Glob. Chang. Biol. 2017, 23, 4873–4883. [Google Scholar] [CrossRef]
  60. Peña, M.A.; Feeley, K.J.; Duque, A. Effects of endogenous and exogenous processes on aboveground biomass stocks and dynamics in Andean forests. Plant Ecol. 2018, 219, 1481–1492. [Google Scholar] [CrossRef]
  61. Fu, B. Simulation of the spatial distribution of climatic element in mountain regions. Acta Meteorol. Sin. 1989, 3, 669–676. [Google Scholar]
Figure 1. The geographical location of study areas and sample plots.
Forests 13 00177 g001
Figure 2. Violin plots showing the response of R/S ratio to stand structure and site conditions. Median (white dot), lower, and upper quartiles (box) and range (whiskers).
Forests 13 00177 g002
Figure 3. Effects of tree age on biomass allocation.
Forests 13 00177 g003
Figure 4. Effects of tree dominance on biomass allocation.
Forests 13 00177 g004
Figure 5. Effects of tree density on biomass allocation.
Forests 13 00177 g005
Figure 6. Effects of elevation on biomass allocation.
Forests 13 00177 g006
Figure 7. Structural equation models (SEMs) determine the multivariate effects of biotic and abiotic factors on (a) aboveground biomass (AGB), (b) belowground biomass, (c) AGB:BGB, and (d) the whole.“−” for negative relationships while “+” were positive ones (* p < 0.05; ** p < 0.01; *** p < 0.001).
Forests 13 00177 g007
Table 1. Basic information of sample plots.
Sample Plot No.Elevation
(m)
Slope Aspect
(°)
Slope Gradient
(°)
Tree Age
(a)
Tree Density
(tree/hm2)
Mean DBH *
(cm)
Mean Tree Height
(m)
12033N151014187510.38.5
22042E681517155011.19.7
32086SE1152016195010.18.7
42150SE14025375002218.6
52285SE2063534110017.517.2
62333NE661835110018.619.1
72355W260193277520.119
82375SE121203477520.119
92560SE1563332127515.213
102570SE238253210501815.9
112624W256163280018.814
122626S2002332100019.116.1
132631E863032130016.815.9
142693W2962322142516.811.6
152716E963631135017.810.7
162778SW2293028162515.712.5
172784S1881227152516.611.7
182789W269192177515.811.5
192811SE2482119115012.47.4
202813SW239222155019.19.8
212823NW359171411507.64.4
222886W2663017106611.76.7
232920W281311872595.2
* DBH: diameter at breast height (forestry).
Table 2. The R2 of each variable in explaining the carbon allocation pattern.
Trunk Mass FractionBranch Mass FractionLeaf Mass FractionRoot Mass Fraction
R2pR2pR2pR2p
Tree age+0.61 **<0.01−0.37 **<0.01−0.26 **0.008−0.24 **<0.01
Tree dominance+0.21 **<0.01−0.120.18+0.030.73−0.200.37
Tree density+0.35 **<0.01−0.23 **<0.01−0.38 **<0.01−0.27 **<0.01
Elevation−0.28 **<0.01−0.030.79−0.45 **<0.01+0.59 **<0.01
Slope aspect−0.21 *0.04−0.080.42−0.39 **<0.01+0.54 **<0.01
Slope gradient0.090.35−0.010.97−0.21 *0.03−0.040.66
“−” for negative relationships while “+” were positive ones (* p < 0.05; ** p < 0.01).
Publisher’s Note: MDPI stays neutral with regard to jurisdictional claims in published maps and institutional affiliations.

