Abstract
This study quantified the horizontal influence range of larch stumps and coarse roots on the phosphorus (P) fraction and availability of microsite soils and explored whether this influence range changes with different plantation types. The total P, available P and P fractions were measured in microsite soils at 0–75 cm horizontal distances from stumps and coarse roots at soil depths of 0–40 cm in a pure larch (Larix olgensis Henry) plantation and a mixed larch–ash (Fraxinus mandshurica Rupr.) plantation. Soils at horizontal distances of 85–95 cm from the stumps and coarse roots were used as the controls. Larch stumps and coarse roots affected the total P concentration at depths of 0–40 cm in the mixed plantations, and the maximum horizontal influence range reached 75 cm. However, in the pure plantation, only the total P at 0–10 cm depths were affected, and the maximum influence range was 35 cm. The NaOH-Pi and NaOH-Po changes in the pure plantation were similar to those of total P, while those of HCl-Pi, HCl-Po and NaHCO3-Po in the mixed plantation were similar to those of total P. Larch stumps and coarse roots could affect the total P and P fraction concentrations in microsite soils. The horizontal distance of soil total P and P fractions concentrations affected by larch stumps and coarse roots in the mixed plantation was greater than that in the pure plantation. These results suggest that the position of stumps and coarse roots should be considered when reforestation sites are selected.
1. Introduction
Phosphorus (P) is an essential nutrient for plant growth and metabolism [1], and its soil abundance can not only directly affect the productive capacity of forest ecosystems, but also have long-term impacts on the dynamic balance of ecosystem mineral nutrients. The supply capacity of soil P cannot be completely explained through the analysis of changes in total P or available P [2,3]. However, it can be better evaluated by a quantitative description of soil P forms through a P fractionation method [4]. At present, the accepted method involves dividing soil P into H2O-Pi, NaHCO3-Pi, NaOH-Pi, HCl-Pi, NaHCO3-Po, NaOH-Po, HCl-Po and Res-P according to their solubilities [5,6,7]. These fractions can be interconverted through mineralization, retention, adsorption, desorption, precipitation and dissolution [8], which in turn can affect the availability of P [9].
In the past, studies on soil P fractions and availability in forest ecosystems mostly focused on different ecosystem types and communities during different successional stages [7,10,11,12], as well as on the effects of roots and litter [13,14]. However, few studies have been conducted on the effects of coarse woody debris (CWD) on the different fractions of soil P and their availability [15]. Stumps and coarse roots are important components of CWD [16], and their roles and functions have attracted much attention from researchers in China and other countries. Previous studies have shown that stumps and coarse roots could significantly increase the contents of total C, total N and total P in soil through decomposition [17,18,19]. In particular, the decomposition of stumps and coarse roots can increase the total P content of the topsoil by approximately 50% [18]. However, those results only showed the influence of stumps and coarse roots on the overall level of soil mineral nutrients in the ecosystem [17,18,19]. The overall level of soil nutrients is composed of different soluble fractions, such as P with different solubilities [5,7]. At present, there are few studies on the effects of stumps and coarse roots on the concentrations of different P fractions in soil [20]. In addition, there is a lack of scientific knowledge on the influence of stumps and coarse roots on the spatial range of different P fractions in microsite soils.
Larch (Larix olgensis Henry) plantations are a type of plantation ecosystem that have long cultivation histories and large area ratios in the temperate zone of Northeast China [21], and they have played a substantial role in supplying timber and protecting the ecological environment [22]. Larch plantations are planted at intensely high densities in China, and large numbers of stumps and coarse roots are present in forests after tending–cutting operations are carried out during the processes of management and utilization. The study of the effects of stumps and coarse roots on P fractions and availability in plantation microsite soils is of great practical significance and regional relevance. Therefore, it is necessary to study the changes in soil P fractions and availability at microsite scales, which not only help systematically elucidate the status and role of larch stumps and coarse roots in maintaining the dynamic balance of soil P in ecosystems, but also provide a theoretical basis for the selection and regulation of planting sites during reforestation processes. In the present study, larch stumps and coarse roots microsite soil were selected in a pure larch plantation and mixed larch–ash (Fraxinus mandshurica Rupr.) plantation, respectively. The concentrations of total P, available P and different P fractions were measured. Therefore, the objectives of this work were (1) to explore whether larch stumps and coarse roots will affect the supply level of P in the microsite soil of plantations and (2) to determine the differences in this effect on the microsite scales due to different established species of the plantation.
2. Materials and Methods
2.1. Characteristics of the Study Site
The experiments were conducted at the Mengjiagang National Forest Farm of Jiamusi City Heilongjiang Province in Northeastern China (Figure 1). This region is characterized by a continental monsoon climate that has dry and mild springs, short, warm and wet summers, windy but dry falls, and cold and dry winters. The mean annual air temperature is 2.7 °C, and the mean annual precipitation is 535 mm. The soil is an Alfisol [23]. The types of species in the plantation are mainly Larix olgensis Henry, and some Fraxinus mandshurica Rupr., Betula davurica Pall. and Pinus sylvestris L. exist in the area. The major ground cover plants include Carex tristachya Thunb., Sanguisorbae Radix L., Equisetum arvense L., Corylus heterophylla Fisch., Lespedeza bicolor Turcz., Acanthopanax senticosus Rupr., Schisandra chinensis Turcz., Aster scaber Thunb. and a small amount of Vitis amurensis Rupr. and Aralia elata Seem.
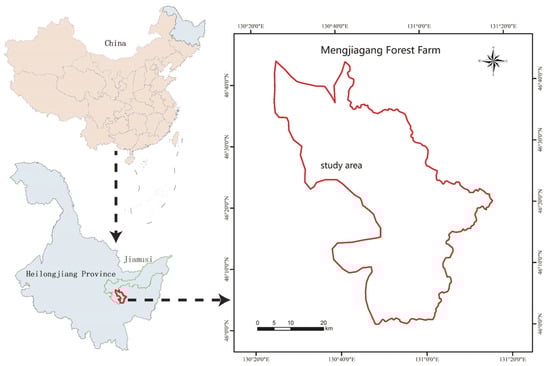
Figure 1.
Location of the study area.
2.2. Soil Sampling
In October 2019, three larch stumps and coarse roots were selected from the pure larch plantation and mixed larch–ash plantation, respectively. Both kinds of plantations were planted in 1969 (Table 1). The decay status of the selected stumps and coarse roots was consistent. The criteria for selecting stumps and coarse roots were that the bark of the stumps had fallen off, the wood was soft, and some could be crumpled into pieces, and roots smaller than 2 cm in diameter had completely decomposed, while roots larger than 2 cm in diameter had not (Figure 2). Based on the research of classification of stumps and coarse roots decayed degree by Hunter [24] and Petrillo et al. [25], the decay degree of stumps and coarse roots could be divided into five classes. The higher the classes are, the higher the degree of decay. The larch root stumps and coarse roots selected in this study could be defined as decay class IV. The stump diameter was within 20 ± 5 cm to reduce the error caused by the diameter. A total of six larch stumps and coarse roots were chosen.

Table 1.
Basic characteristics of pure larch plantation and mixed larch–ash plantation.
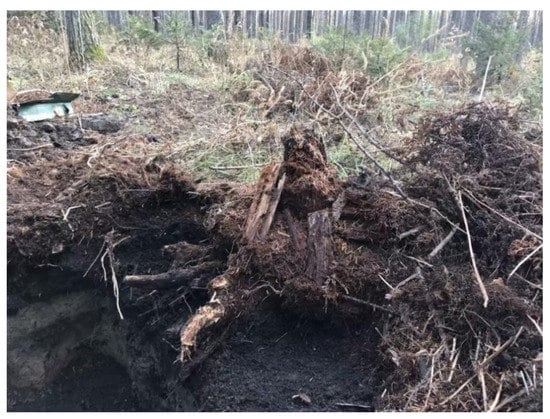
Figure 2.
Larch stump and coarse root of the decay state selected in the experiment.
Since the spacing of the plantation was 150 cm×150 cm and the superficial root systems of the larch [26], soil samples were collected at depths of 0–10 cm, 10–20 cm and 20–40 cm in the pure plantation and mixed plantation, respectively. Four soil sampling points were selected within a 1/2 plant spacing from larch stumps and coarse roots that were taken from one side of the stumps and coarse roots (the unified direction was east) at distances of 5–15 cm, 25–35 cm, 45–55 cm and 65–75 cm in each soil layer, and these were marked as D1, D2, D3 and D4, respectively. The soil over 1/2 plant spacing, which was 85–95 cm away from the stumps, and coarse roots were less affected by the stumps and coarse roots and other trees. Therefore, the soil sampling point with a horizontal distance of 85–95 cm in each soil layer was used as the control and marked as D5 (Figure 3). The samples were dried in a cool room, and the dried samples were then sieved to <2 mm to determine the chemical properties of the soil and the concentrations of the P fractions.
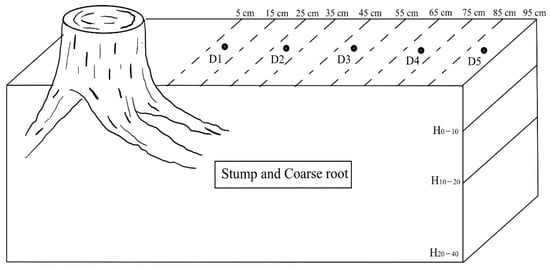
Figure 3.
Illustration of the soil sampling design for each stump and coarse root. H denotes the depth of the soil layers, 0–10 cm, 10–20 cm and 20–40 cm. D1, D2, D3, D4 and D5 denote sampling points within horizontal distances of 5–15 cm, 25–35 cm, 45–55 cm, 65–75 cm and 85–95 cm from the stump and coarse root, respectively.
2.3. Laboratory Analysis
The total P concentration was determined with the phospho-vanado-molybdate colorimetric method, following digestion with H2SO4–HClO4 [27].
Soil P fractionation was performed using the sequential fractionation method [28], as modified by Sui et al. [6]. A 0.5 g dried soil sample was extracted with the following reagents in that order. First, deionized water extracted H2O-Pi that was directly exchangeable with the soil solution. Second, 0.5 M NaHCO3 (pH = 8.2) extracted NaHCO3-Pi and NaHCO3-Po. Third, 0.1 M NaOH extracted NaOH-Pi and NaOH-Po. Fourth, 1 M HCl was used to extract HCl-Pi and HCl-Po. Finally, the residual P (Res-P) was determined by H2SO4–HClO4 digestion using extracted soil. Extractions were shaken end-over-end in 50 mL centrifuge tubes for 16 h and then centrifuged at 25,000 g and 0 °C for 10 min. The supernatant was decanted through filter paper into a clean vial for subsequent analysis. Pi concentrations in each extract were determined with a UV-V spectrophotometer using phosphomolybdate blue. Total P extracted with NaHCO3, NaOH, and HCl was determined using H2SO4–HClO4 digestion. Po was estimated as the difference between total P and Pi. In total, eight P fractions were quantified. H2O-Pi, NaHCO3-Pi and NaHCO3-Po are the most effective P for plant growth [29]. NaOH-Pi and NaOH-Po are considered medium activity P [10,30]. HCl-Pi and HCl-Po are considered low activity P, and Res-P is the most chemically stable P [29].
Available P was measured by a 0.03 M NH4F and 0.025 M HCl extraction method [31]. The P activation coefficient (PAC, %) was calculated as PAC = (available P/total P) × 100%.
2.4. Statistical Analysis
All statistical analyses were performed in SPSS 21.0 (IBM, Chicago, IL, USA). Soil P fractions, total P, available P, and PAC were tested with one-way ANOVA, and the LSD method was used to test significant differences (α = 0.05).
3. Results
3.1. Soil Total P
A comparison of the total P concentration of different soil sampling points in the horizontal direction at 0–40 cm depths in the two types of plantations are shown in Figure 4. The horizontal influence range of larch stumps and coarse roots on the P concentration of forest microsite soil could be determined based on whether the P concentration of each sampling point in the microsite soil was significantly higher than that of D5, which was outside of the microsite. At a depth of 0–10 cm, the total P concentration from D1 to D4 was significantly higher than that from D5 in the mixed plantation, and in the pure plantation, only D1 and D2 were significantly higher than that of D5 (p < 0.05). In the 10–20 cm and 20–40 cm soil layers, the total P concentrations in the mixed plantation at D1, D2 and D3 were significantly higher than that at D5 (p < 0.05), but the total P concentration at each sampling point in the pure plantation showed no noticeable change.
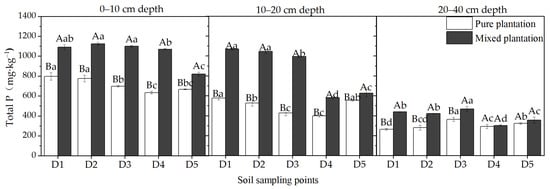
Figure 4.
Concentrations of total P at different soil sampling points in the pure larch plantation and mixed larch–ash plantation. Lowercase letters indicate significant differences among different soil sampling points in the same plantation, p < 0.05; capital letters indicate significant differences among different plantations at the same sampling point, p < 0.05. n = 3, standard deviation bars are shown.
It can be seen that in the 0–10 cm soil layer, the maximum horizontal range of influence of the larch stumps and coarse roots on the total P concentration in the mixed plantation reached 75 cm, while that in the pure plantation only reached 35 cm. In the 10–20 cm and 20–40 cm soil layers, the maximum horizontal influence distance of the mixed plantation reached 55 cm, but that of the pure plantation was unaffected.
3.2. Soil Available P
The differences in available P concentrations among different soil sampling points are shown in Figure 5. In the 0–10 cm soil layer, the concentrations of available P in the pure plantation in D1 through D4 were significantly higher than that in D5 (p < 0.05). At depths of 10–20 cm, the concentrations at D1 and D2 were also significantly higher than that at D5 (p < 0.05). Therefore, the stumps and coarse roots of larch affected the microsite soil in the pure plantation at depths of 0–10 cm and 10–20 cm, and the maximum horizontal influence ranges were 55 cm and 35 cm, respectively. However, they had no distinct effects on the available P concentration at the 0–40 cm depth in the microsite soil of the mixed plantation.
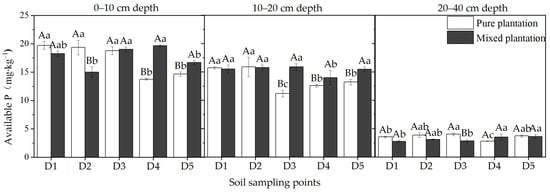
Figure 5.
Concentrations of available P at different soil sampling points in the pure larch plantation and mixed larch-ash plantation. Lowercase letters indicate significant differences among different soil sampling points in the same plantation, p < 0.05; capital letters indicate significant differences among different plantations at the same sampling point, p < 0.05. n = 3, standard deviation bars are shown.
The percentage values of the P activation coefficient (PAC) of the soil sampling points in the different soil layers of the two plantations is given in Table 2. At a depth of 0–10 cm, the PAC values in D1 through D3 were significantly higher than that in D5 in the pure plantation (p < 0.05). In the 10–20 cm and 20–40 cm layers, the values for D1 and D2 were also significantly higher than that of D5 (p < 0.05). Similar to the change in the available P concentration, the PAC values of microsite soils in the mixed plantation were not affected by the larch stumps or coarse roots. The PAC values of microsite soils in the 0–10 cm, 10–20 cm and 20–40 cm depths of the pure plantation were affected by the larch stumps and coarse roots, and the maximum horizontal influence ranges were 55 cm, 35 cm and 35 cm, respectively.
Table 2.
The P activation coefficient at different soil sampling points for the pure larch plantation and mixed larch–ash plantation (%). Lowercase letters indicate significant differences among different soil sampling points in the same plantation, p < 0.05; capital letters indicate significant differences among different plantations at the same sampling point, p < 0.05. n = 3, values are means ± standard deviation.
3.3. Soil P Fractions
A comparison of the concentrations of different P fractions among the soil sampling points is shown in Figure 6. At a depth of 0–10 cm, the concentrations of NaOH-Pi in D1 through D3 in the pure plantation were significantly higher than that in D5, and the NaOH-Po concentration in D1 was also significantly higher than that in D5 (p < 0.05). In the 10–20 cm soil layer, the NaOH-Pi and NaOH-Po concentrations of D1 were significantly higher than those of D5 in the pure plantation (p < 0.05). The results indicate that the concentrations of NaOH-Pi and NaOH-Po were affected by the larch stumps and coarse roots in the pure plantation. In the 0–10 cm and 10–20 cm soil layers, the maximum horizontal influence range of NaOH-Pi reached 55 cm and 35 cm, respectively, and that of NaOH-Po reached 15 cm. The concentrations of NaOH-Pi and NaOH-Po in the mixed plantation microsite soils were not affected by larch stumps and coarse roots.
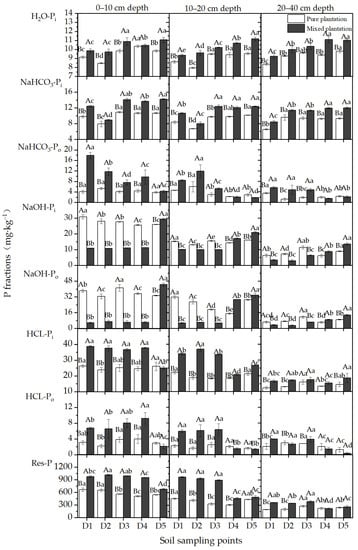
Figure 6.
Concentrations of P fractions at different soil sampling points of the pure larch plantation and mixed larch-ash plantation. Lowercase letters indicate significant differences among different soil sampling points in the same plantation, p < 0.05; capital letters indicate significant differences among different plantations at the same sampling point, p < 0.05. n = 3, standard deviation bars are shown.
At a depth of 0–10 cm, the concentrations of HCl-Pi and HCl-Po in D1 through D4 in the mixed plantation were significantly higher than those in D5 (p < 0.05). At depths of 10–20 cm, their concentrations in D1 through D3 were also significantly higher those that in D5 (p < 0.05). However, the concentrations of HCl-Pi and HCl-Po at each soil sampling point in the pure plantation showed no noticeable change. The results suggest that the concentrations of HCl-Pi and HCl-Po in the 0–10 cm and 10–20 cm depths of microsite soils were influenced by larch stumps and coarse roots in the mixed plantation. The maximum horizontal influence ranges of the two soil layers reached 75 cm and 55 cm, respectively.
In the 0–10 cm soil layer, the concentrations of NaHCO3-Po and Res-P in D1 through D4 in the mixed plantation were significantly higher than those in D5 (p < 0.05). The concentrations of Res-P in D1 and D2 in the pure plantation were significantly higher than those in D5 (p < 0.05). In the 10–20 cm and 20–40 cm soil layers, the concentrations of NaHCO3-Po and Res-P in D1 through D3 in the mixed plantation were significantly higher than those in D5 (p < 0.05). In the 10–20 cm soil layer of the pure plantation, the NaHCO3-Po concentrations of D1 and D2 were significantly higher than that of D5 (p < 0.05). At depths of 20–40 cm, the NaHCO3-Po concentration of D1 was also significantly higher than that of D5 (p < 0.05). The results demonstrate that the larch stumps and coarse roots clearly affected the NaHCO3-Po and Res-P concentrations in the microsite soils at depths of 0–10 cm, 10–20 cm and 20–40 cm in the mixed plantations. The maximum horizontal influence ranges of the three soil layers reached 75 cm, 55 cm and 55 cm, respectively. In addition, they also affected the concentrations of NaHCO3-Po at depths of 10–20 cm and 20–40 cm and the concentrations of Res-P at depths of 0–10 cm in the pure plantations. The maximum horizontal influence ranges of NaHCO3-Po in the pure plantation reached 35 cm and 15 cm in the 10–20 cm and 20–40 cm soil layers, respectively, and those of Res-P reached 35 cm in the 0–10 cm soil layer.
The concentrations of H2O-Pi and NaHCO3-Pi in the microsite soils at different depths in the mixed plantation and the pure plantation showed a trend toward increasing with distance from larch stumps and coarse roots. The results indicate that the concentrations of H2O-Pi and NaHCO3-Pi in the microsite soils of the mixed plantation and pure plantation were not affected by the larch stumps and coarse roots.
4. Discussion
4.1. Effect of Stumps and Coarse Roots on Microsite Soil P and Availability
In this study, it was found that the total P concentration increased with decreasing horizontal distance from the larch stumps and coarse roots in two types of plantations (Figure 4). This result indicated that the stumps and coarse roots could promote an increase in the total P concentration in microsite soils. Błońska et al. [17] reported that the total C and total N concentrations at distances of 0–10 cm from stumps and coarse roots were higher than those at distances of 50 cm from stumps and coarse roots, which also indicated the positive effect of stumps and coarse roots on soil nutrient accumulation. Furthermore, it was also found that the concentration of available P increased with a decrease in horizontal distance from the stumps and coarse roots at depths of 0–20 cm in the pure plantation (Figure 5). More than 2% of the PAC in the microsite soil (Table 2) means that the soil had a strong P activation capacity [32], which can provide effective P for plant growth in the woodland [1,10,29].
4.2. Effects of Different Plantation Established Species on Microsite Soil P
In the present study, the larch stumps and course roots affected the 0–40 cm soil layer in the mixed plantation, and in the pure plantation, they only affected the 0–10 cm layer (Figure 4). This may be due to the differences in the established species of the mixed plantation and the pure plantation. Mixed plantations can enhance the activity of soil microorganisms [33], thus accelerating the release of P from stumps and coarse roots into the soil [34]. Therefore, the influence range of soil total P that was influenced by larch stumps and coarse roots in the mixed plantation was greater than that in the pure plantation.
In this work, two types of plantations had different soil P fractions that dominated the change in total P in the microsite soils. The total P concentration in the pure plantation was mainly related to the change in NaOH-Pi and NaOH-Po concentrations, but in the mixed plantation, it was related to the HCl-Pi, HCl-Po and NaHCO3-Po concentrations (Figure 6). This may be due to the following reasons. On the one hand, Spears et al. [35] illustrated that CWD inputs dissolved organic matter into the soil, and organic acids could promote the release of Fe3+ and Al3+ in the soil [36,37], thereby increasing the concentration of NaOH-P in the soil [10]. This means that a change in the established species in a plantation could inhibit the decomposition of larch stumps and coarse roots and alter the amount of dissolved organic matter that is released into the soil; therefore, the NaOH-P concentrations of microsite soils in the mixed plantation were lower than those in the pure plantation. On the other hand, low soil pH could promote exchangeable Mn2+ and Ca2+ [38], and these were induced to be released in the mixed plantation. This can lead to a rapid precipitation of inorganic P by Mn2+ or Ca2+ [39], thus increasing the recalcitrant and stable concentrations of HCl-P and Res-P in the mixed plantation [40]. In addition, H2O-Pi and NaHCO3-Pi, which are inorganic P fractions that have high activity, showed a decrease in the horizontal distance from larch stumps and coarse roots in the two plantations (Figure 6). A similar phenomenon was also found for the concentration of P fractions in the rhizosphere soil of plants studied by Zhang et al. [41]. This may be because the microorganisms that decompose the stumps and coarse roots need large amounts of P during their process of enzyme synthesis [42,43]. However, H2O-Pi and NaHCO3-Pi are easily absorbed and dissolved [29], so they can be easily used by microorganisms.
The ability of P activation in microsite soil was lower in the mixed plantation than in the pure plantation (Table 2). In terms of P fractions, the concentrations of NaOH-Pi and NaOH-Po were higher in the pure plantation than in the mixed plantation (Figure 6). The NaOH-Pi fraction shows a medium level of soil activity and can be quickly converted into P, which is effective for plants after degradation [10]. Conversely, HCl-Pi and HCl-Po, which have low activity, had high concentrations in the mixed plantation, and these fractions take long periods of time to transform into P that can be used by plants [44].
4.3. Limitations of Research
This study clarified the effects of stumps and coarse roots on soil P, P fractions and availability and explored the maximum horizontal range affecting soil P concentration at the microsite scales. This has important practical significance for the selection of reforestation planting sites. Due to the limited sampling conditions, we are still unable to determine whether the soil within 1/2 of the plant spacing around the stumps and coarse roots is affected by other trees near the sampling stumps and coarse roots and the degree of influence. Further investigations are required to determine this scientific problem.
5. Conclusions
This study explored the effects of larch stumps and coarse roots on total P, P fractions and availability in microsite soil of plantations and provides the first quantitative determination of the maximum horizontal range of P concentrations influenced by larch stumps and coarse roots on plantation soils in China. This research found that the closer to the larch stumps and coarse roots, the higher the concentration of total P, P fractions and availability in microsite soil. Therefore, the distance from stumps and coarse roots should be considered in the selection of planting sites during reforestation processes. Larch stumps and coarse roots affected the total P concentration in microsite soil, and the P fractions that caused the change in total P concentration were different in the two types of plantations. The total P concentration in the pure plantation was mainly related to the change in the medium active P concentration, while that in the mixed plantation was related to the low active P concentration. This means that the microsite soil P affected by stumps and coarse roots in the pure plantation can be converted into P, which can be quickly absorbed and utilized by plants faster than that in the mixed plantation.
Author Contributions
X.C. and Z.S. conceived and designed the study; Y.Y. and X.M. collected field samples, performed the laboratory trials, analyzed the data and wrote the paper. All authors have read and agreed to the published version of the manuscript.
Funding
This work was supported by the National Natural Science Foundation of China (NSFC, grant number 31870612).
Data Availability Statement
The data are available on reasonable request.
Acknowledgments
This research was supported by the National Natural Science Foundation of China (NSFC, No. 31870612). We gratefully acknowledge the assistance of numerous staff from Meng Jia Gang Forest farm with the field investigation and sample processing.
Conflicts of Interest
The authors declare no conflict of interest.
References
- Oburger, E.; Jones, D.L.; Wenzel, W.W. Phosphorus saturation and pH differentially regulate the efficiency of organic acid anion-mediated P solubilization mechanisms in soil. Plant Soil 2011, 341, 363–382. [Google Scholar] [CrossRef]
- Blake, L.; Johnston, A.E.; Poulton, P.R.; Goulding, K.W.T. Changes in soil phosphorus fractions following positive and negative phosphorus balances for long periods. Plant Soil 2003, 254, 245–261. [Google Scholar] [CrossRef]
- Crews, T.E.; Kitayama, K.; Fownes, J.H.; Riley, R.H.; Herbert, D.A.; Muellerdombois, D.; Vitousek, P.M. Changes in Soil-Phosphorus Fractions and Ecosystem Dynamics across a Long Chronosequence in Hawaii. Ecology 1995, 76, 1407–1424. [Google Scholar] [CrossRef]
- Guppy, C.N.; Menzies, N.W.; Moody, P.W.; Compton, B.L.; Blamey, F.P.C. Analytical methods and quality assuranceA simplified, sequential, phosphorus fractionation method. Commun. Soil Sci. Plan. 2008, 31, 1981–1991. [Google Scholar] [CrossRef]
- Han, Y.; Chen, X.; Choi, B. Effect of freeze–thaw cycles on phosphorus fractions and their availability in biochar-amended Mollisols of northeast China (laboratory experiment). Sustainability 2019, 11, 1006. [Google Scholar] [CrossRef]
- Sui, Y.B.; Thompson, M.L.; Shang, C. Fractionation of phosphorus in a mollisol amended with biosolids. Soil Sci. Soc. Am. J. 1999, 63, 1174–1180. [Google Scholar] [CrossRef]
- Zhang, X.; Gu, H.Y.; Chen, X.W. Effects of selective cutting on soil phosphorus forms and availability in Korean pine broad-leaved forest in Xiaoxing’an Mountains of China. Chin. J. Appl. Ecol. 2018, 29, 441–448. [Google Scholar] [CrossRef]
- Yang, X.; Post, W.M. Phosphorus transformations as a function of pedogenesis: A synthesis of soil phosphorus data using Hedley fractionation method. Biogeosciences 2011, 8, 2907–2916. [Google Scholar] [CrossRef]
- Doolette, A.; Smernik, R. Soil organic phosphorus speciation using spectroscopic techniques. In Phosphorus in Action; Springer: Berlin/Heidelberg, Germany, 2011; pp. 3–36. [Google Scholar]
- Redel, Y.; Rubio, R.; Godoy, R.; Borie, F. Phosphorus fractions and phosphatase activity in an Andisol under different forest ecosystems. Geoderma 2008, 145, 216–221. [Google Scholar] [CrossRef]
- Yang, X.Y.; Fan, R.Y.; Wang, E.H.; Xia, X.Y.; Chen, X.W. Topsoil phosphorus forms and availability of different soil and water conservation plantations in typical black soil region, northeast China. Chin. J. Appl. Ecol. 2014, 25, 1555–1560. [Google Scholar] [CrossRef]
- Zhu, X.Y.; Fang, X.; Wang, L.F.; Xiang, W.H.; Alharbi, H.A.; Lei, P.F.; Kuzyakov, Y. Regulation of soil phosphorus availability and composition during forest succession in subtropics. Forest Ecol. Manag. 2021, 502, 119706. [Google Scholar] [CrossRef]
- McGrath, D.A.; Duryea, M.L.; Cropper, W.P. Soil phosphorus availability and fine root proliferation in Amazonian agroforests 6 years following forest conversion. Agr. Ecosyst. Environ. 2001, 83, 271–284. [Google Scholar] [CrossRef]
- Schaap, K.J.; Fuchslueger, L.; Hoosbeek, M.R.; Hofhansl, F.; Martins, N.P.; Valverde-Barrantes, O.J.; Hartley, I.P.; Lugli, L.F.; Quesada, C.A. Litter inputs and phosphatase activity affect the temporal variability of organic phosphorus in a tropical forest soil in the Central Amazon. Plant Soil 2021, 469, 423–441. [Google Scholar] [CrossRef]
- Brandtberg, P.O.; Davis, M.R.; Clinton, P.W.; Condron, L.M.; Allen, R.B. Forms of soil phosphorus affected by stand development of mountain beech (Nothofagus) forests in New Zealand. Geoderma 2010, 157, 228–234. [Google Scholar] [CrossRef]
- Rabinowitsch-Jokinen, R.; Vanha-Majamaa, I. Immediate Effects of Logging, Mounding and Removal of Logging Residues and Stumps on Coarse Woody Debris in Managed Boreal Norway Spruce Stands. Silva. Fenn. 2010, 44, 51–62. [Google Scholar] [CrossRef]
- Błońska, E.; Kacprzyk, M.; Spólnik, A. Effect of deadwood of different tree species in various stages of decomposition on biochemical soil properties and carbon storage. Ecol. Res. 2017, 32, 193–203. [Google Scholar] [CrossRef]
- Hope, G.D. Changes in soil properties, tree growth, and nutrition over a period of 10 years after stump removal and scarification on moderately coarse soils in interior British Columbia. Forest Ecol. Manag. 2007, 242, 625–635. [Google Scholar] [CrossRef]
- Sucre, E.B.; Fox, T.R. Decomposing stumps influence carbon and nitrogen pools and fine-root distribution in soils. Forest Ecol. Manag. 2009, 258, 2242–2248. [Google Scholar] [CrossRef]
- Polglase, P.J.; Attiwill, P.M.; Adams, M.A. Nitrogen and phosphorus cycling in relation to stand age of Eucalyptus regnans F. Muell. III. Labile inorganic and organic P phosphatase activity and P availability. Plant Soil 1992, 142, 177–185. [Google Scholar] [CrossRef]
- Peng, W.; Li, F.R.; Dong, L.H. Individual tree diameter growth model for Larix olgensis plantation in Heilongjiang Province, China. J. Nanjing Forest Univ. 2018, 42, 19–27. [Google Scholar]
- Burger, D.; Shi, D.Z. An introductory comparison of forest ecological conditions in northeast China and Ontario, Canada. For. Chron. 1988, 64, 105–115. [Google Scholar] [CrossRef][Green Version]
- Sun, Z.; Wang, X.; Chen, X. Effects of thinning intensity on carbon storage of Larix olgensis plantation ecosystem. J. Beijing Forest Univ. 2016, 38, 1–13. [Google Scholar] [CrossRef]
- Hunter, J.M.L. Wildlife, Forests, and Forestry. Principles of Managing Forests for Biological Diversity; Prentice Hall: Hoboken, NJ, USA, 1990; p. 370. [Google Scholar]
- Petrillo, M.; Cherubini, P.; Fravolini, G.; Marchetti, M.; Ascher-Jenull, J.; Schärer, M.; Synal, H.; Bertoldi, D.; Camin, F.; Larcher, R.; et al. Time since death and decay rate constants of Norway spruce and European larch deadwood in subalpine forests determined using dendrochronology and radiocarbon dating. Biogeosciences 2016, 13, 1537–1552. [Google Scholar] [CrossRef]
- Kajimoto, T.; Matsuura, Y.; Osawa, A.; Prokushkin, A.S.; Sofronov, M.A.; Abaimov, A.P. Root system development of Larix gmelinii trees affected by micro-scale conditions of permafrost soils in central Siberia. Plant Soil 2003, 255, 281–292. [Google Scholar] [CrossRef]
- Van, E.R.; Verloo, M.; Demeyer, A.; Pauwels, J.M. Manual for the Soil Chemistry and Fertility Laboratory; International Training Centre for Post-Graduate Soil Scientists, Ghent University: Gent, Belgium, 1999; p. 243. [Google Scholar]
- Hedley, M.J.; Stewart, J.W.B.; Chauhan, B.S. Changes in Inorganic and Organic Soil-Phosphorus Fractions Induced by Cultivation Practices and by Laboratory Incubations. Soil Sci. Soc. Am. J. 1982, 46, 970–976. [Google Scholar] [CrossRef]
- Rose, T.J.; Hardiputra, B.; Rengel, Z. Wheat, canola and grain legume access to soil phosphorus fractions differs in soils with contrasting phosphorus dynamics. Plant Soil 2010, 326, 159–170. [Google Scholar] [CrossRef]
- Qin, S.J.; Liu, J.S.; Wang, G.P.; Wang, J.D. Seasonal changes of soil phosphorus fractions under Calamagrostis angustifolia wetlands in Sanjiang Plain, China. Acta Ecol. Sin. 2007, 27, 3844–3851. [Google Scholar] [CrossRef]
- Murphy, J.; Riley, J. A modified single solution method for the determination of phosphate in natural waters. Anal. Chim. Acta. 1962, 27, 31–36. [Google Scholar] [CrossRef]
- Wu, Q.; Zhang, S.; Zhu, P.; Huang, S.; Wang, B.; Zhao, L.; Xu, M. Characterizing differences in the phosphorus activation coefficient of three typical cropland soils and the influencing factors under long-term fertilization. PLoS ONE 2017, 12, e0176437. [Google Scholar] [CrossRef] [PubMed]
- Wu, D.; Zhang, M.; Zhang, Y.; Li, Y.; Zhang, Y.; Chi, Q.; Pang, H.; Sun, G. The carbon metabolism characteristics and diversity of soil microbial communities from pure or coniferous and broad-leaved mixed forests in the Maoer Mountain region. J. Nanjing Forest Univ. 2017, 60, 81. [Google Scholar]
- Palviainen, M.; Finer, L.; Laiho, R.; Shorohova, E.; Kapitsa, E.; Vanha-Majamaa, I. Phosphorus and base cation accumulation and release patterns in decomposing Scots pine, Norway spruce and silver birch stumps. Forest Ecol. Manag. 2010, 260, 1478–1489. [Google Scholar] [CrossRef]
- Spears, J.D.H.; Lajtha, K. The imprint of coarse woody debris on soil chemistry in the western Oregon Cascades. Biogeochemistry 2004, 71, 163–175. [Google Scholar] [CrossRef]
- Cromack, J.K.; Sollins, P.; Graustein, W.C.; Speidel, K.; Todd, A.W.; Spycher, G.; Li, C.Y.; Todd, R.L. Calcium oxalate accumulation and soil weathering in mats of the hypogeous fungus Hysterangium crassum. Soil Biol. Biochem. 1979, 11, 463–468. [Google Scholar] [CrossRef]
- Jones, D.L. Organic acids in the rhizosphere—A critical review. Plant Soil 1998, 205, 25–44. [Google Scholar] [CrossRef]
- Pietri, J.C.A.; Brookes, P.C. Relationships between soil pH and microbial properties in a UK arable soil. Soil Biol. Biochem. 2008, 40, 1856–1861. [Google Scholar] [CrossRef]
- Thomas, S.J.; Pierzynski, G.M. Chemistry of phosphorus in soils. In Chemical Processes in Soils; Soil Science Society of America: Madison, WI, USA, 2005; pp. 151–192. [Google Scholar]
- Sanyal, S.K.; Dedatta, S.K. Chemistry of Phosphorus Transformations in Soil. In Advances in Soil Science; Springer: New York, NY, USA, 1991; pp. 1–120. [Google Scholar]
- Zhang, H.W.; Huang, Y.; Ye, X.S.; Shi, L.; Xu, F.S. Genotypic differences in phosphorus acquisition and the rhizosphere properties of Brassica napus in response to low phosphorus stress. Plant Soil 2009, 320, 91–102. [Google Scholar] [CrossRef]
- Lustenhouwer, N.; Maynard, D.S.; Bradford, M.A.; Lindner, D.L.; Oberle, B.; Zanne, A.E.; Crowther, T.W. A trait-based understanding of wood decomposition by fungi. Proc. Natl. Acad. Sci. USA 2020, 117, 11551–11558. [Google Scholar] [CrossRef]
- Sinsabaugh, R.L.; Antibus, R.K.; Linkins, A.E.; Mcclaugherty, C.A.; Rayburn, L.; Repert, D.; Weiland, T. Wood Decomposition: Nitrogen and Phosphorus Dynamics in Relation to Extracellular Enzyme Activity. Ecology 1993, 74, 1586–1593. [Google Scholar] [CrossRef]
- Song, C.; Han, X.Z.; Tang, C. Changes in phosphorus fractions, sorption and release in Udic Mollisols under different ecosystems. Biol. Fert. Soils 2007, 44, 37–47. [Google Scholar] [CrossRef]
Publisher’s Note: MDPI stays neutral with regard to jurisdictional claims in published maps and institutional affiliations. |
© 2022 by the authors. Licensee MDPI, Basel, Switzerland. This article is an open access article distributed under the terms and conditions of the Creative Commons Attribution (CC BY) license (https://creativecommons.org/licenses/by/4.0/).