Article

Assessment of Past Decadal Dynamics of Tree Stands in Forest–Tundra Transition Zone on the Polar Ural Mountains Calibrated Using Historical and Modern Field Measurements

by
Nail’ F. Nizametdinov
,
Yulia V. Shalaumova
,
Valery S. Mazepa
and
Pavel A. Moiseev
*
Institute of Plant and Animal Ecology, Ural Branch, Russian Academy of Sciences, 620144 Yekaterinburg, Russia
*
Author to whom correspondence should be addressed.
Forests 2022, 13(12), 2107; https://doi.org/10.3390/f13122107
Submission received: 11 November 2022 / Revised: 4 December 2022 / Accepted: 6 December 2022 / Published: 9 December 2022

Abstract

:
Altitudinal forest limits are typically climatically dependent, such that increasing temperatures connected to global warming are causing upslope shifts in treeline ecotones worldwide. However, at the local and regional levels, the degree of such a response is dependent on differences in climate, topography and soil features. In recent decades, attempts have been undertaken to estimate tree stand dynamics with remote sensing methods, but their resolution is still too coarse for a precise assessment of stand structural changes, and requires ground-truthing, which is not possible without historical data collected on a single-tree level. We used aerial photos (1962) and satellite images (2021) in combination with historical inventory data to investigate changes in open forest positions at different spatial scales at the eastern macroslope of the Polar Urals over the past 60 years. Additionally, obtained remote sensing data were validated on a single-slope level using tree crown size estimations. Our investigations showed that since 1960 up to present day, the total crown coverage increased from 6.9 to 22.1% within the test polygon. A highly spatially variable upslope advance in an open forest boundary was identified from 1.7 up to 7.1 m in altitude per decade. We revealed that the rate of tree stand transformations was to a great extent depended on the stand density in the 1960s, soil substrate type, moisture regime, slope aspect and inclination. Our results highlighted the necessity to consider the abovementioned factors when trying to predict climate-induced tree distributional responses in subarctic mountain regions.

1. Introduction

The climate has been changing since the end of the Little Ice Age, having induced structural transformations on different biosphere levels [1]. Because mountains have a high degree of topographic heterogeneity, in turn leading to great environmental variability between sites [2], plant responses to environmental change are not uniform across mountainous landscapes [3]. Trees in regions with humid climates are typically growth-limited due to low summer temperatures at their upper range edges [4], but recent studies discovered that treeline advances are not solely determined here through warming [5,6,7,8,9], but on a landscape level constrained abiotically through features of topography (aspects or slopes) [10,11,12,13], wind load [14], microclimate and soil properties [15,16,17], and biotically due to the demands of tree species and interactions with ground vegetation [12,18,19,20,21,22,23]. Therefore, at some mountain slopes, treelines that experience warming may show no change in position [24]. The nonuniformity of elevational woody vegetation responses to climate change in mountains warrants further investigation into the factors that can influence these responses [25,26,27,28,29]. Evaluations of the parameters of individual trees and hole stands in the abovementioned treeline studies were mainly based on field time-consuming measurements [30,31]. Under short summer conditions and poor transport accessibility to mountainous areas, it is difficult to depend on a large coverage of measurements and representativeness of the data obtained. In recent decades, attempts had been undertaken to estimate the structures of tree stands using remote sensing methods, because repeated aerial photography and satellite imagery offer an excellent resource for the investigation of treeline shifts over wide territories [32,33,34]. Their resolution (0.3–1 m/pixel), however, is still too coarse for a precise assessment of stand structural changes, and requires ground-truthing or pairing with forest inventory data to provide detailed information on tree stand dynamics and changes in treeline positions [35,36,37]. However, in many cases, highly accurate estimations of former stand structures cannot be achieved without historical data collected on a single-tree level in previous periods. Thus, to determine accurate predictions about future changes in tree stand structures and treeline positions, it is crucial to increase the precision of remote sensing estimation based on former and contemporary field measurements, and to examine how different factors on local and landscape levels mediate responses to climate change.
In our study, we estimated structural changes to tree stands on their upper distributional limit in the middle part of the eastern macroslope of the Polar Ural Mountains (Mt. Chernaya, Rai–Iz massif and their surroundings) based on field observations (1960–2020) on a permanent altitudinal transect [38,39,40], interpretations of historical (1962) aerial photos and present-time (2020) satellite images of a test polygon and a comparison of open forest positions in the 1960s and 2020s in entire subregions of the Polar Urals. Additionally, we analyzed how the stand structure and dynamics couple of edaphic conditions and landscape features. Our objectives were: (1) to estimate crown closures within a test polygon (southern and eastern slopes of hills with landmarks, 312 m a.s.l.) by interpreting aerial photos and satellite images taken in 1962 and 2020; (2) to validate obtained crown coverage values using field observation data from 1960, 2011 and 2020, and to deduce the position of the upper boundary of open forests within the test polygon; (3) to investigate the vegetation patterns, detect the upper open forest boundary and assess its advances at a subregional level; (4) to identify the role of topography, sediment mechanical structures and soil wetness for determining stand structures and dynamics. We assumed that treeline positions and behaviors coupled to a great extent in regard to variations in slope aspects and ground peculiarities.

2. Materials and Methods
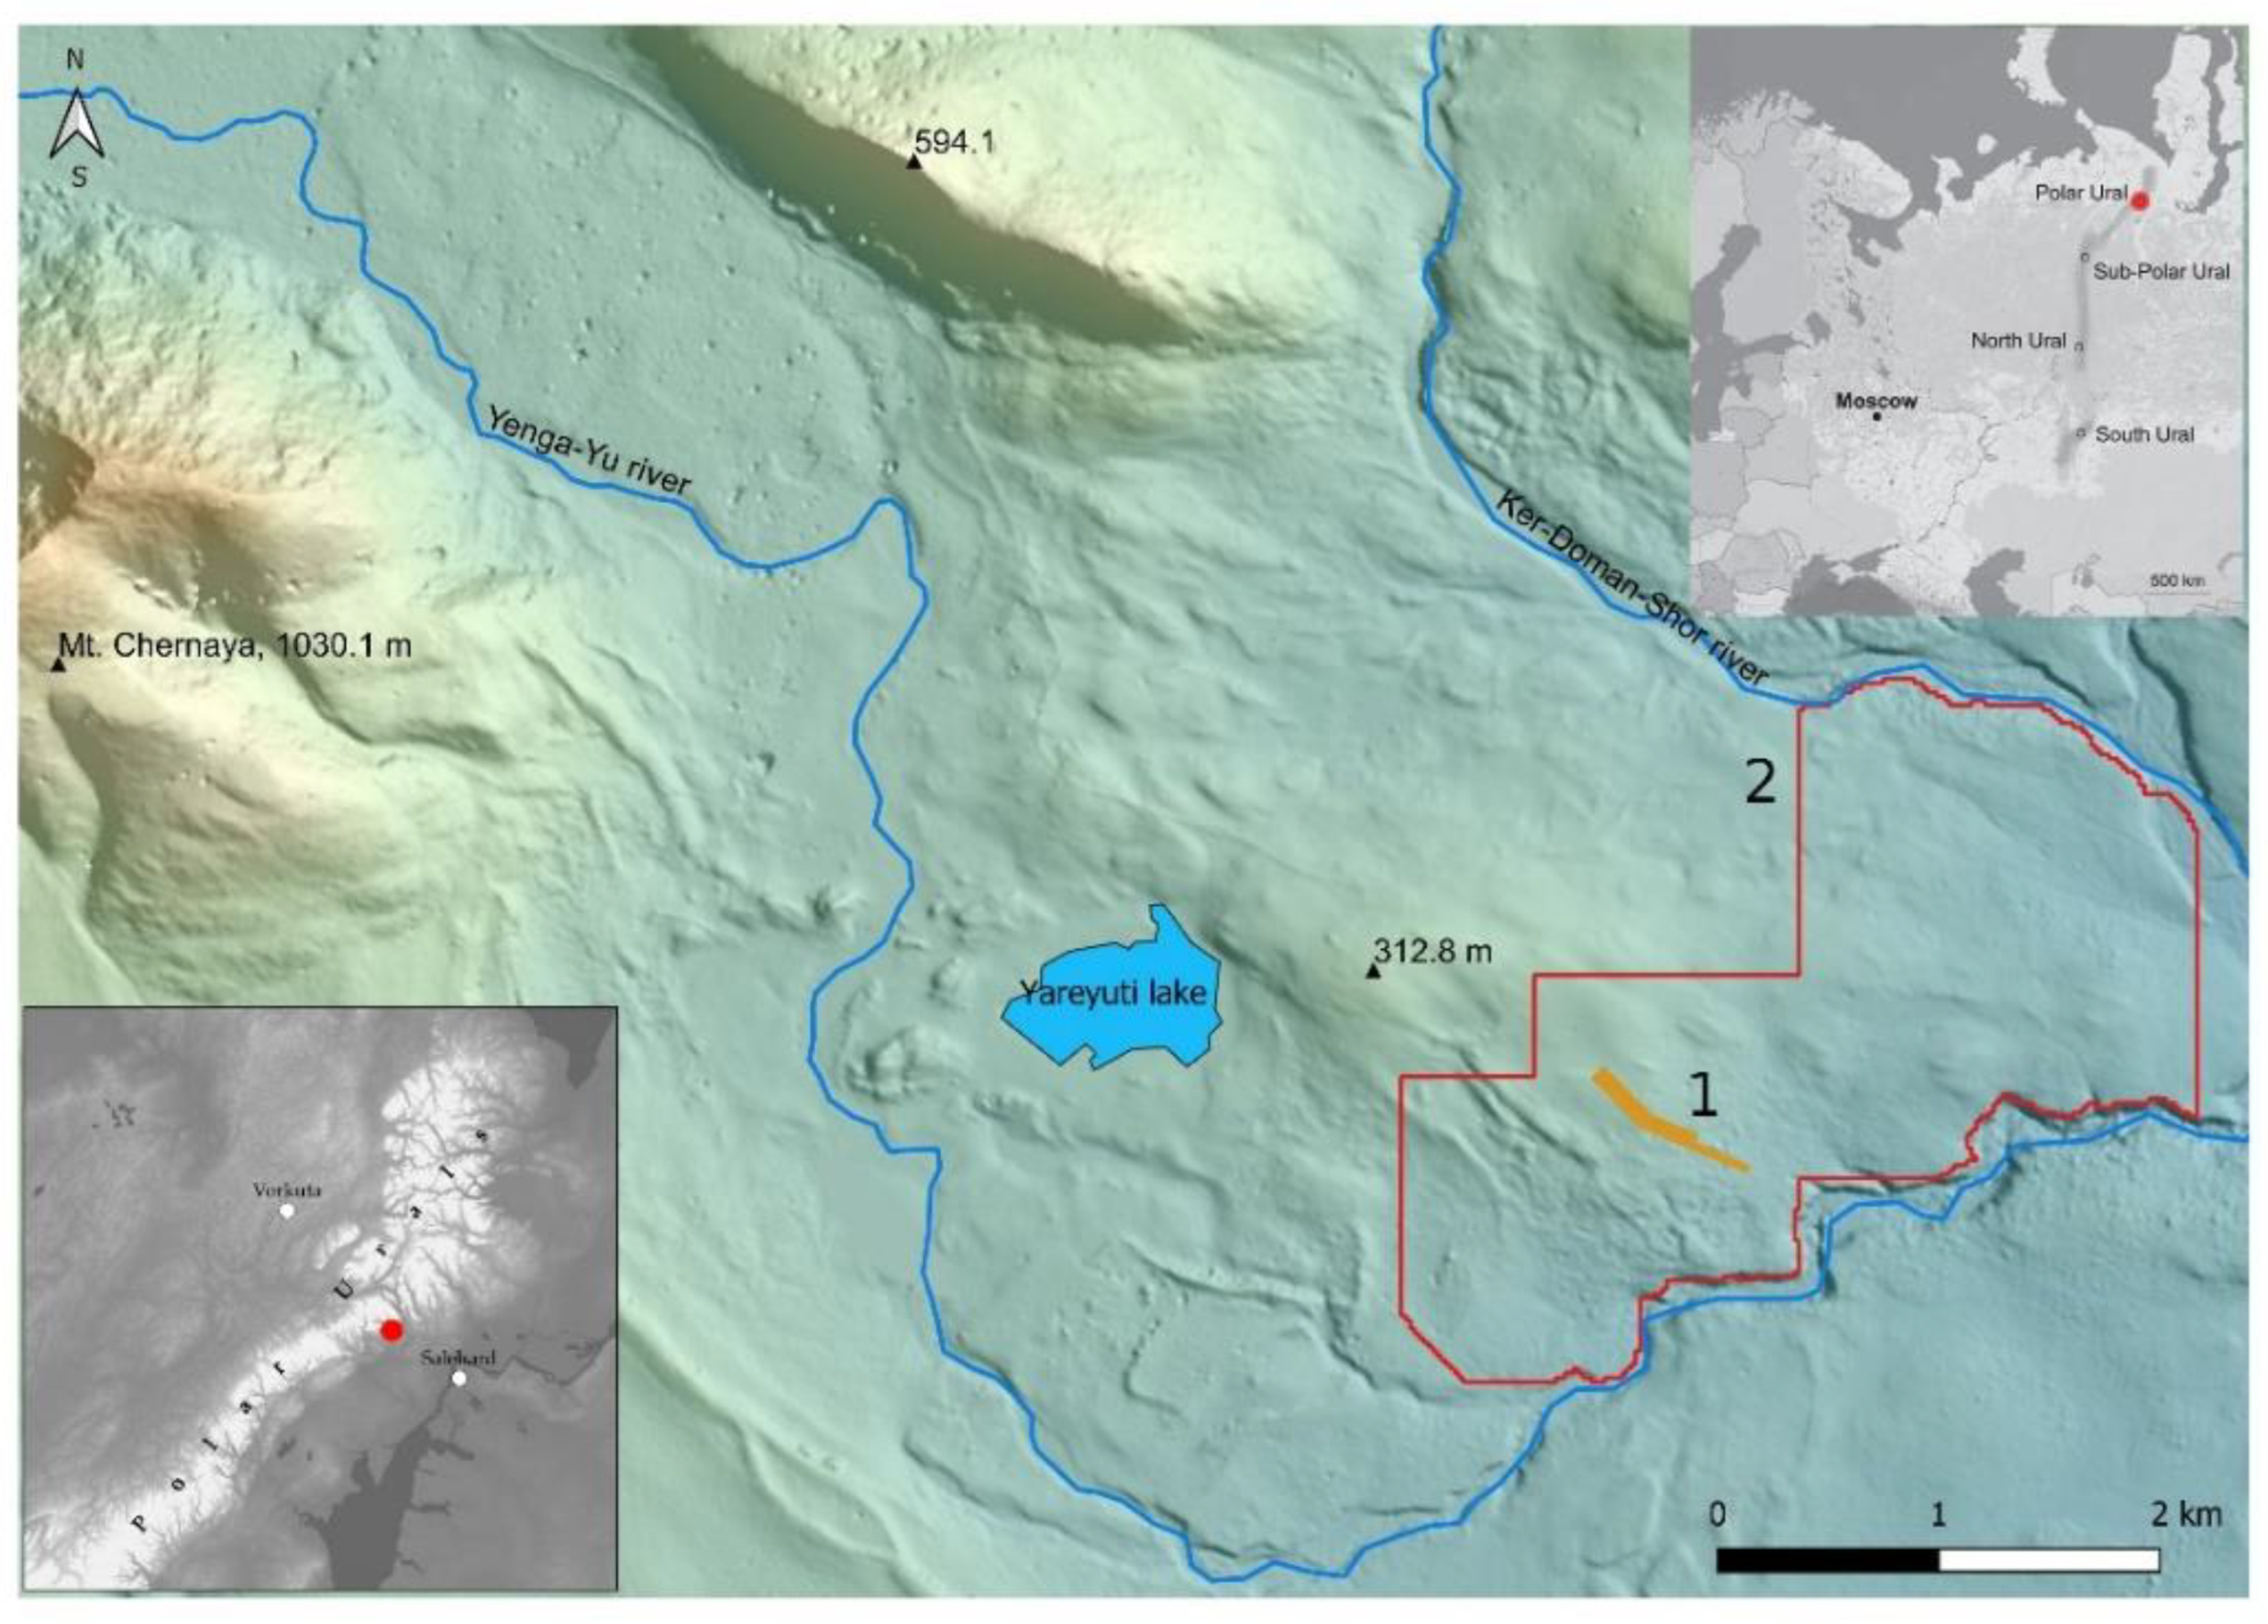
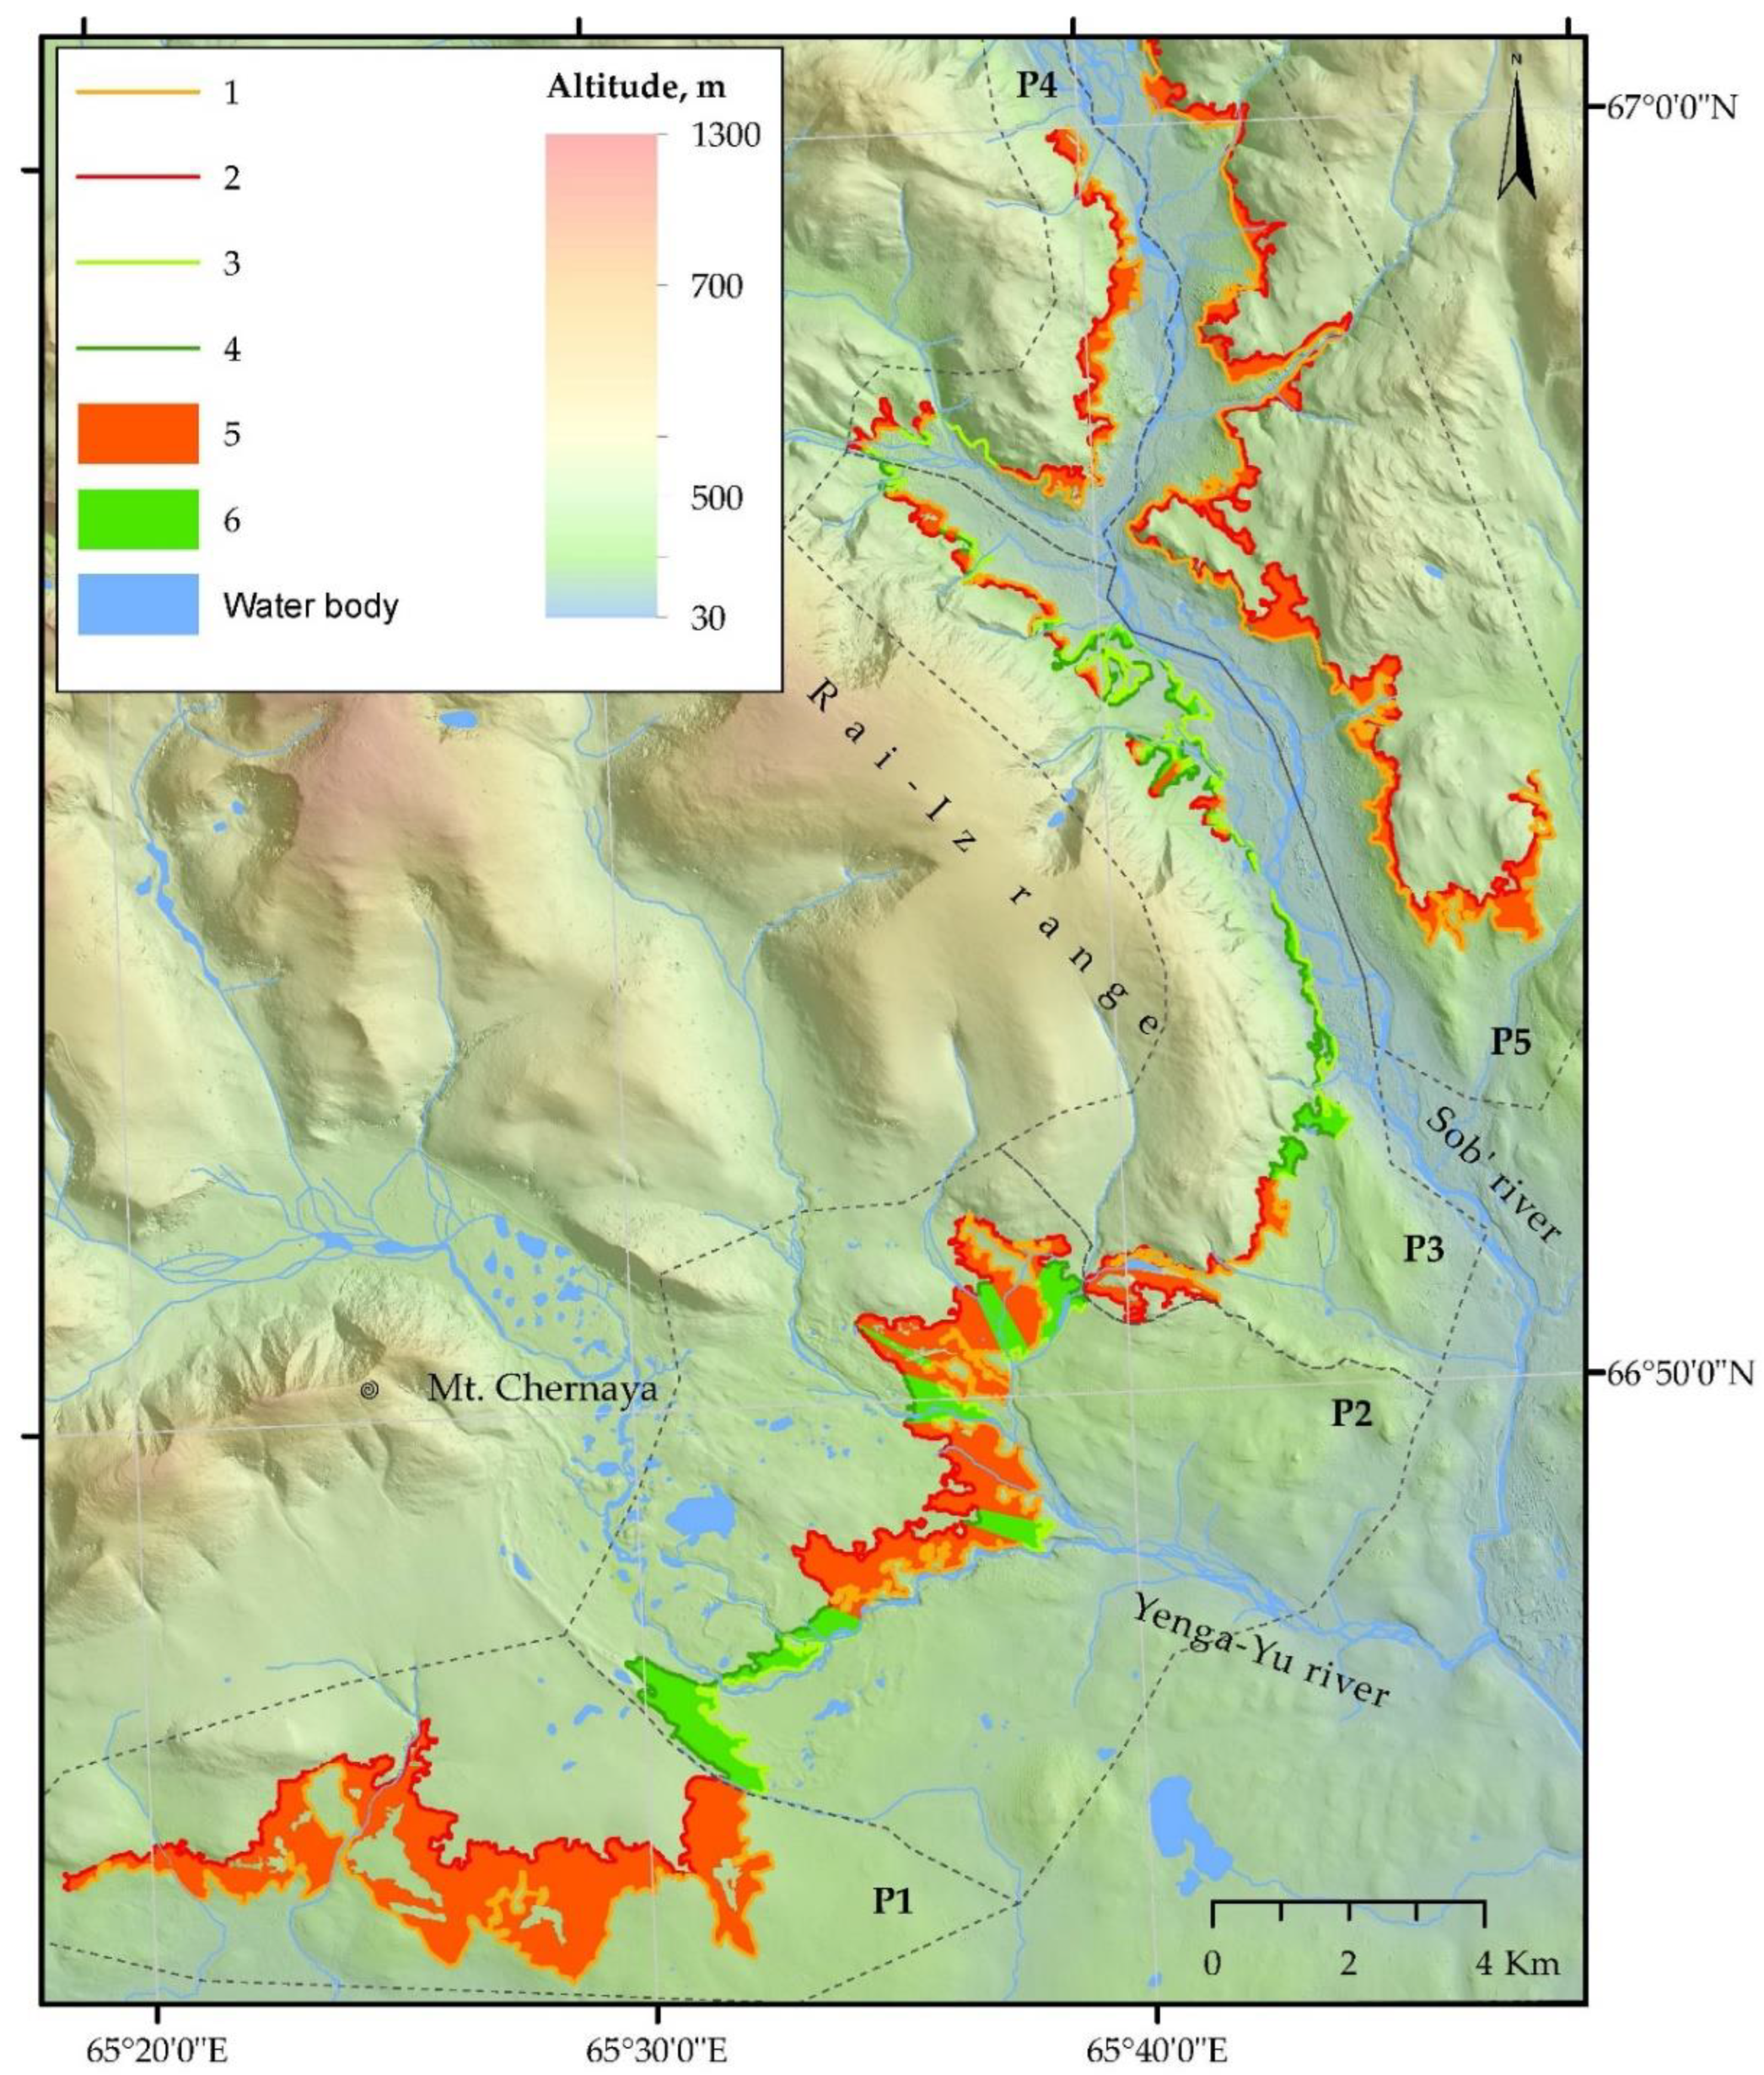
2.1. Study Site

Our study was performed on the eastern macroslope of the Polar Urals close to Mt. Chernaya (gabbro, 66.8377° N, 65.3836° E, 1036 m a.s.l.) and Rai–Iz massif (peridotite, 66.9544° N, 65.3304° E, 1309 m a.s.l.) (Figure 1). There was a chain of gentle-sloped hills (300–460 m a.s.l.) extending along their southeastern slopes. The east-facing slopes of the Rai–Iz massif were framed by the Slantsevaya, Yar–Keu and Pour–Keu mountains (crystalline shales, 400–880 m a.s.l.). On the plains (date of weather station Salekhard, 15 m a.s.l.), the mean air temperature in January was −22.1 °C and in July it was +14.2 °C, but at the same time, in the mountains (Rai–Iz weather station, 895 m a.s.l.) it was –17.9 °C and + 8.5 °C, respectively. The average annual precipitation was 460 mm in the valleys and 881 mm on mountain tops, one third of which would fall in the summer time. The average thickness of snow cover in the valleys was approximately 0.8–1.0 m. The stable snow cover laid approximately 240 days. In summer, western and southwestern winds prevailed, with western and northwestern winds prevailing in winter.
On the plains surrounding the Polar Urals and in the mountain valleys, the Siberian larch (Larix sibirica Ledeb.) dominated in tree stands, but, in some valleys, the Siberian spruce (Picea obovata Ledeb.) increased its abundance, in some areas even forming almost pure spruce forests. On some slopes within the treeline ecotone, birch (Betula pubescens Ehrh. ssp. tortuosa (Ledeb.) Nyman) and alder (Duschekia alnobetula subsp. fruticosa (Rupr.) Raus) prevailed. The vegetation forming the mountain tundra and dominating the open areas between groups of larches in the treeline ecotone (180–350 m a.s.l.) consisted of various shrubs, dwarf shrubs (Betula nana L., Salix sp., Vaccinium sp., Empetrum nigrum L., Arctous alpine L. and Dryas sp.) and herbs (e.g., Polygonum bistorta L., Anemone narcissifolia L. subsp. biarmiensis (Juz.) Jalas, Carex bigelowii Torr. ex Schwein., Festuca ovina L. and Solidago lapponica With.).

2.2. Trees and Stands Data Sampling and Calculation

The monitoring altitudinal (180–260 m a.s.l.) transect within the treeline ecotone was set up in 1960 on the southeastern slope (4 degrees of inclination) of a hill with a height mark of 312.8 m a.s.l., close to Mount Chernaya (Polar Urals), and had a width of 40 to 80 m and a length of 860 m [38,39,40,41] (Figure 1). It mainly consisted of rows of (2 or 4) plots 20 × 20 m. Within each plot, all adult trees and saplings taller than 20 cm were mapped and their morphometric parameters (tree height and diameter of crown horizontal projection) were measured. A repeat inventory and morphometric parameter measurements of the alive trees were carried out in 1999, 2011 and 2020. The sum of crown projection areas for each plot was calculated.

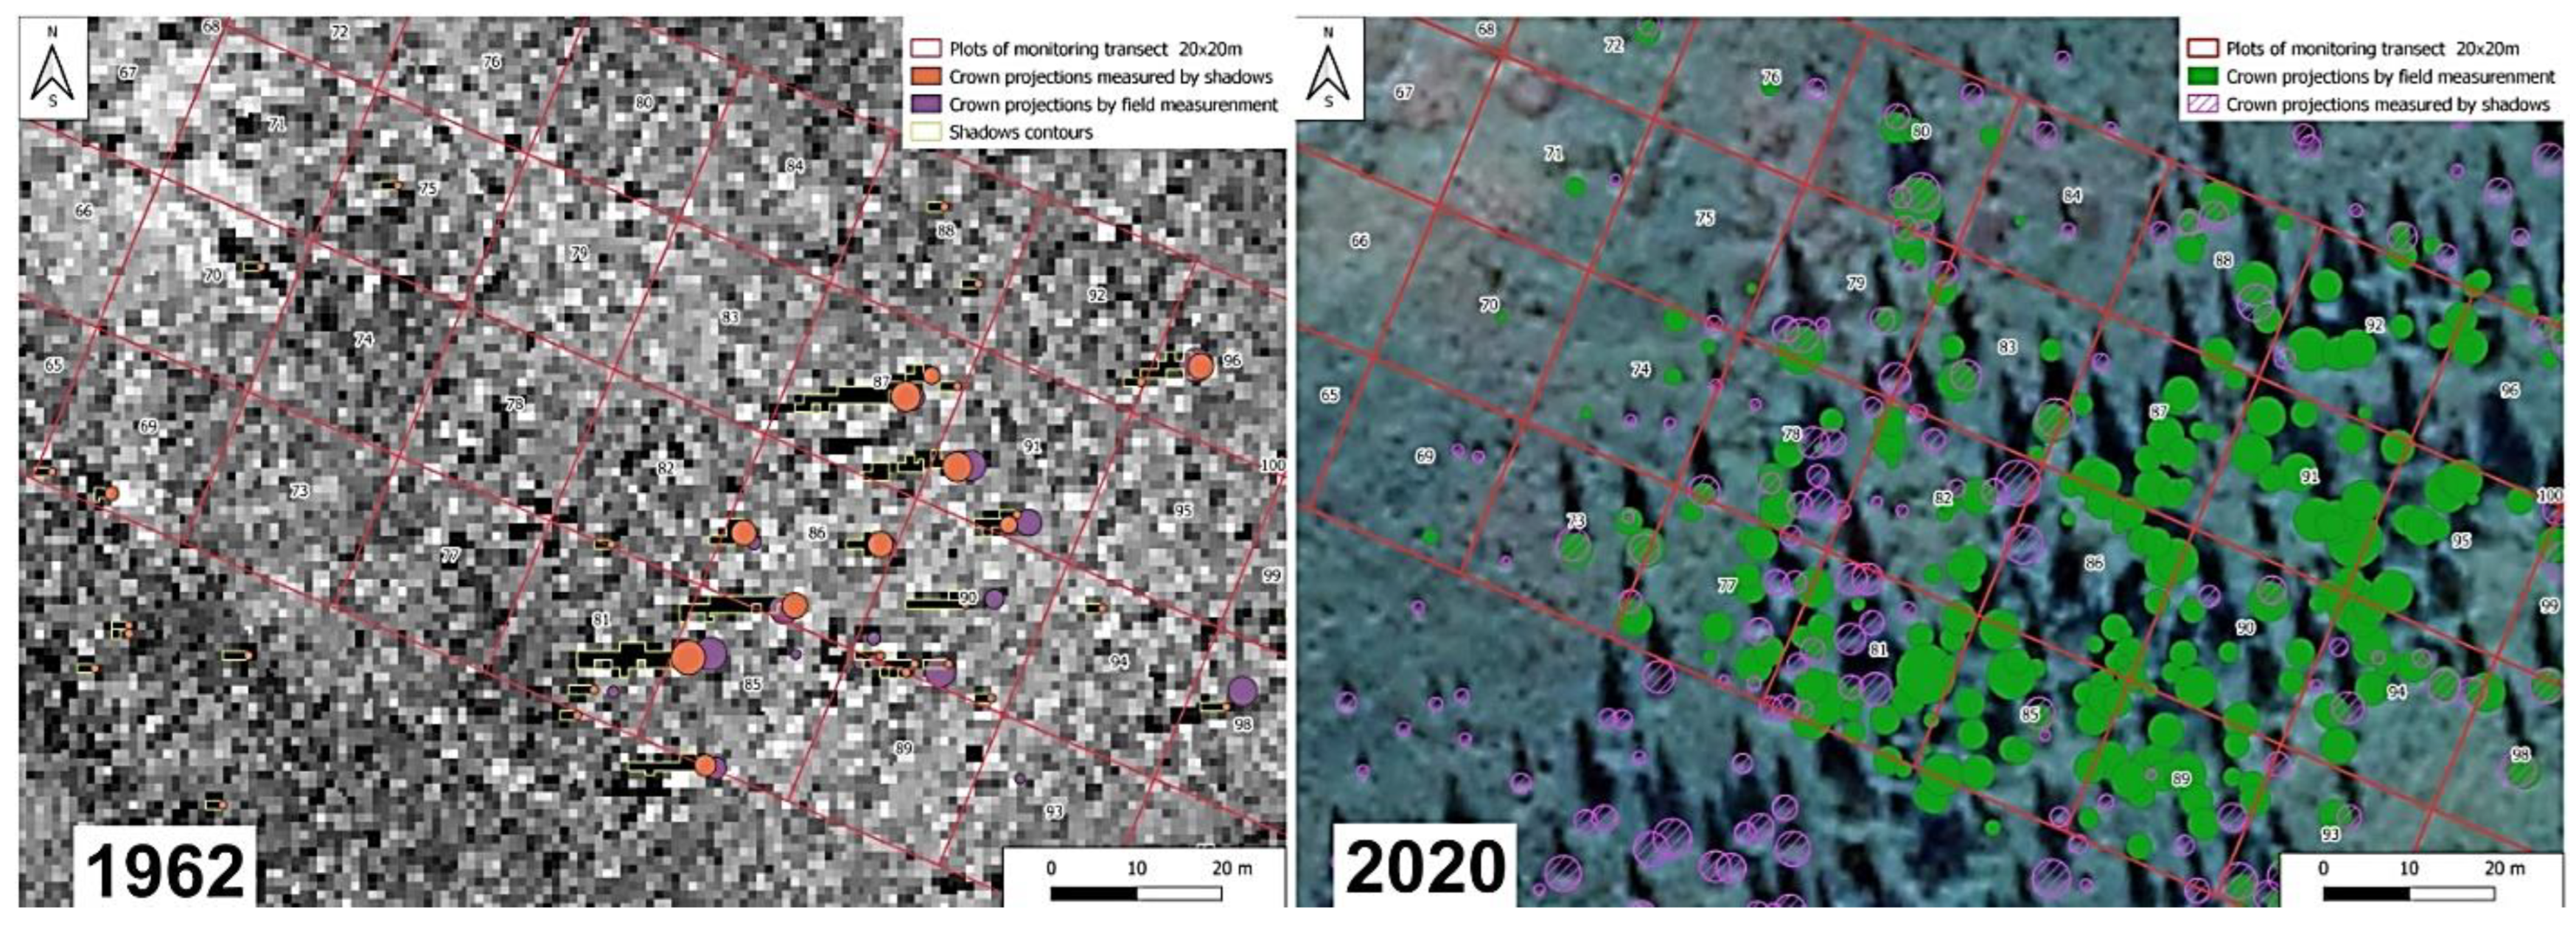
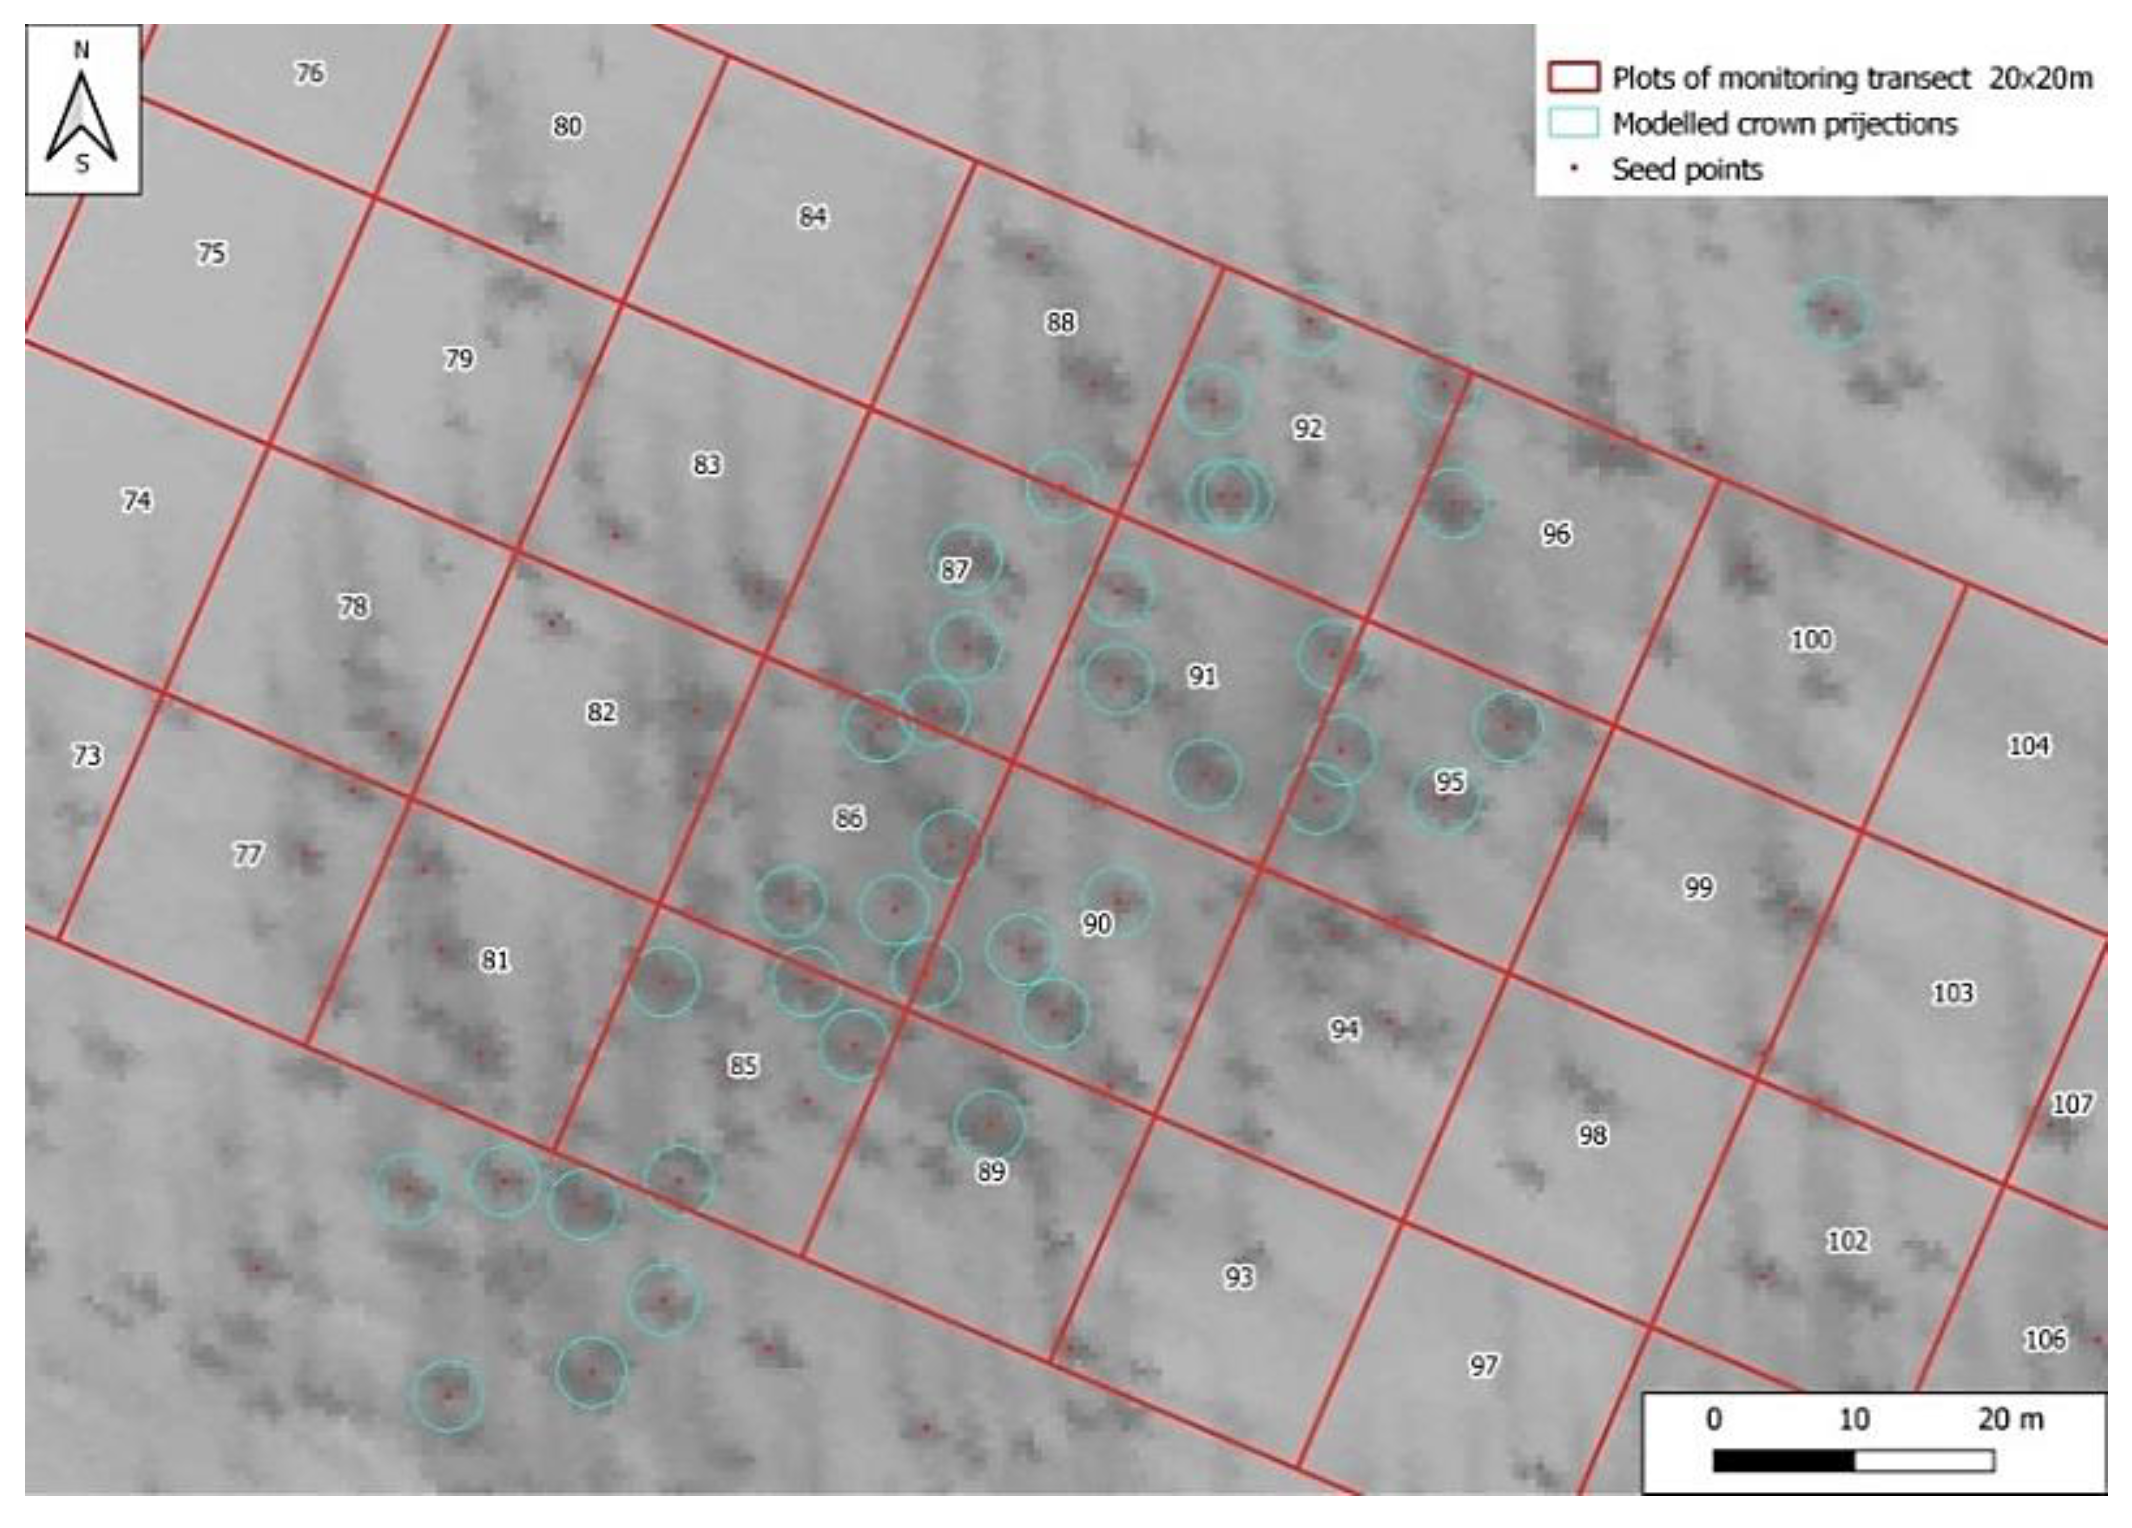
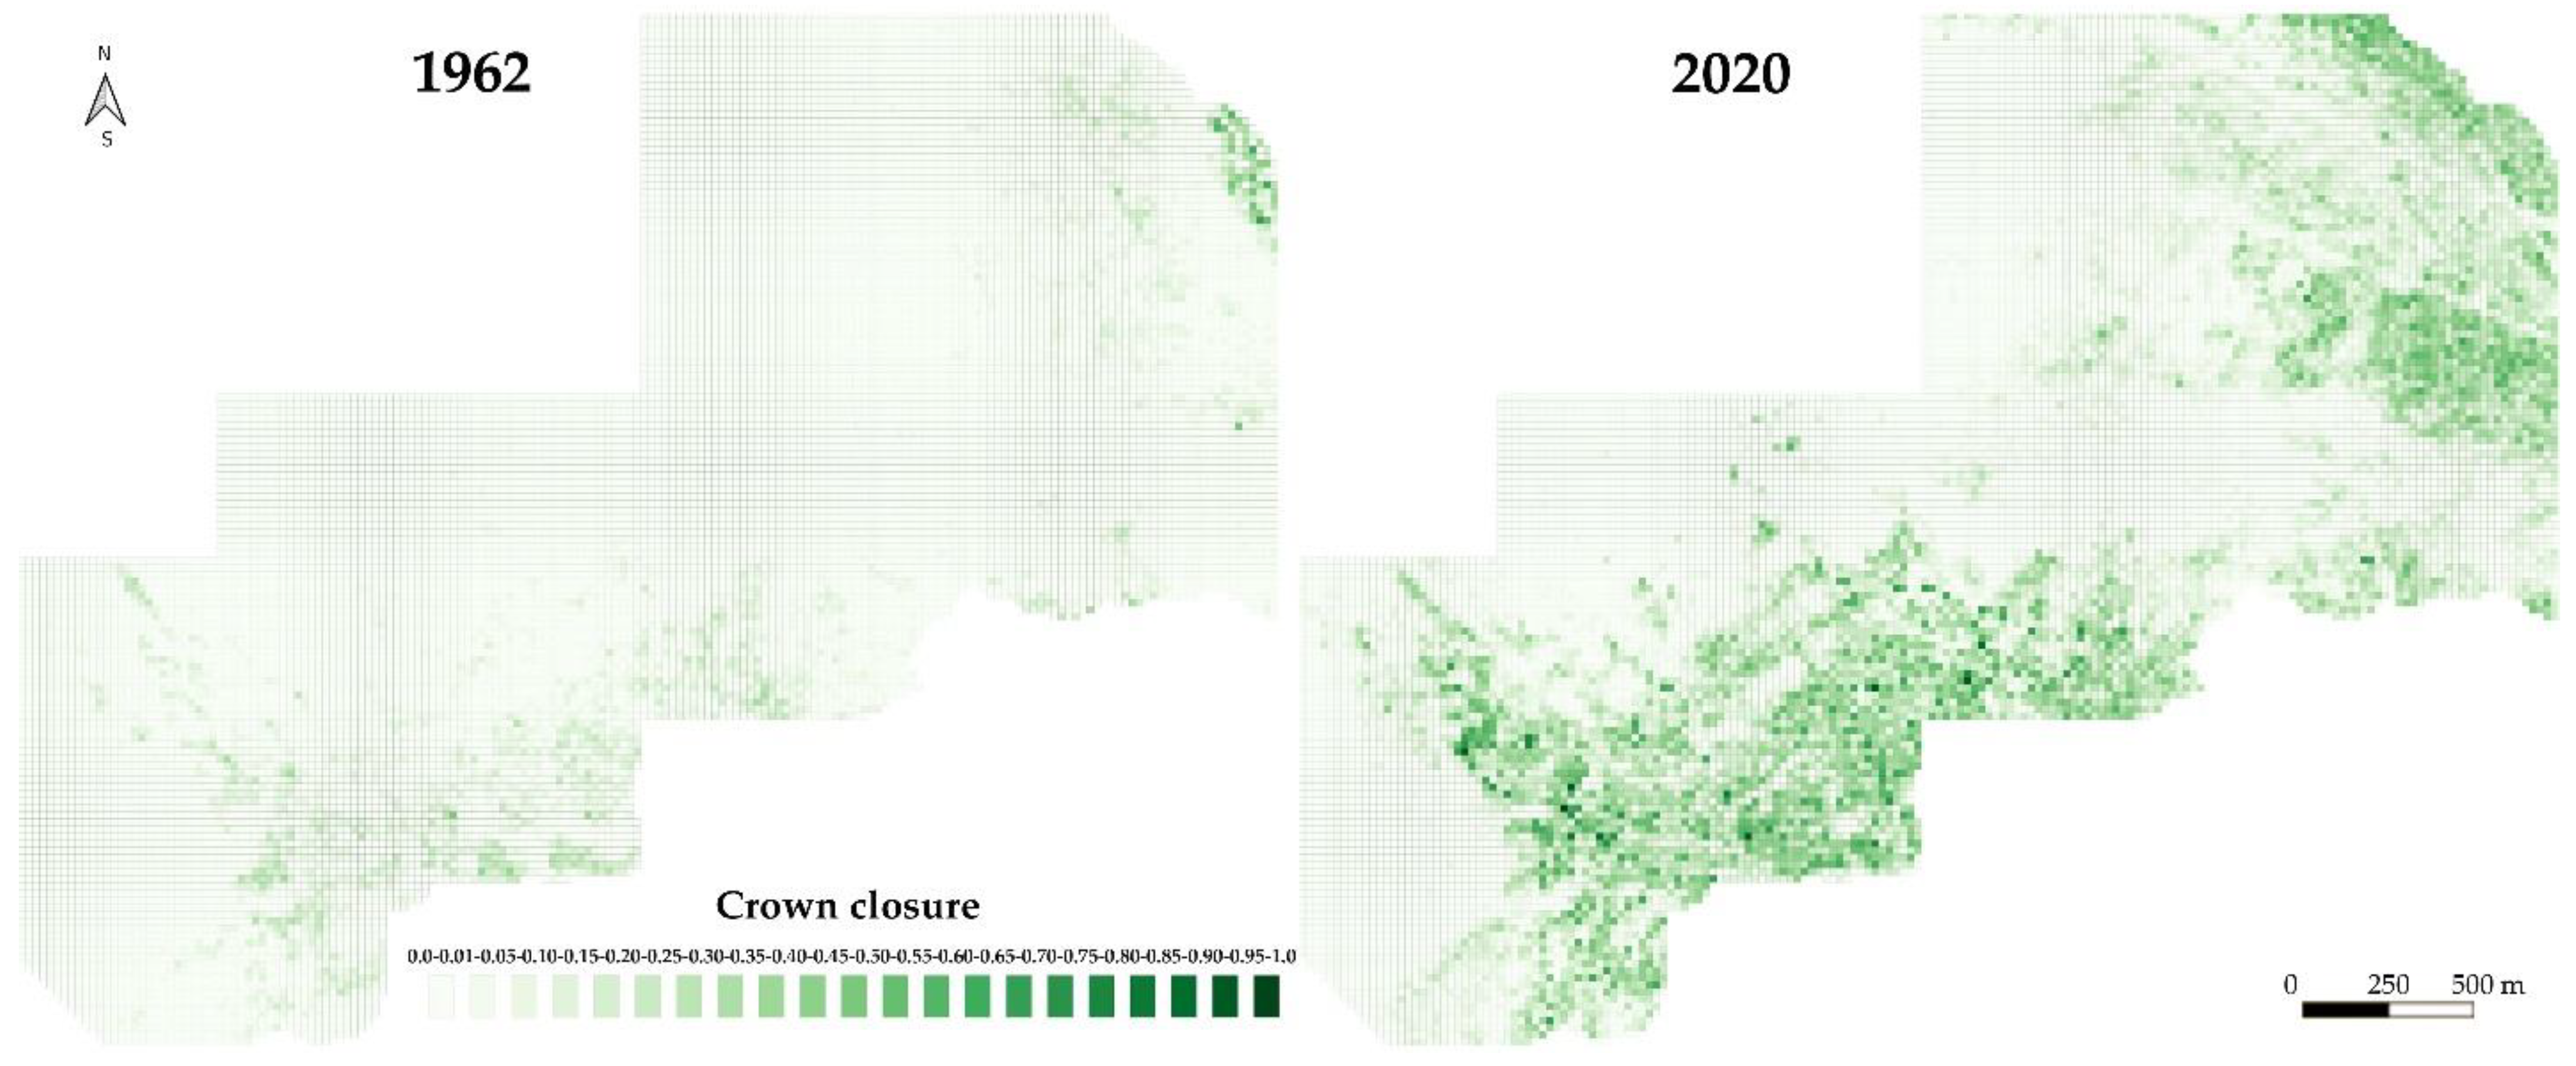
2.3. Estimation of Crown Closure by Interpreting Aerial Photos and Satellite Images

To estimate the structural changes of tree stands on the landscape level since the 1960s, the southern and eastern slopes of the hill surrounding the abovementioned altitudinal transect were taken and divided into 16,000 square plots with 20 m a side (see “Test polygon” in Figure 1).
Estimates for the crown closure of tree stands in the 1960s were obtained using monochrome aerial photographs (APs) with a survey date of 27 July 1962 (Figure 2). The spatial resolution of the digitized AP was 1 m pix−1. The pixel brightness was encoded with values from 0 to 255 units. It helped to localize and identify the boundaries of tree crowns by using their shadows. As the photos were taken in the morning, shadows were directed from east to west. Using the SAGA GIS 2.3.2 software, we detected shadow pixels with a brightness value of less than 40 units in the APs. These pixel groups were vectorized into a polygon layer. For the analysis, we used contours with a size of more than 1 m2, and if their width was greater than the height. The analysis of the morphometry of trees measured on the permanent transect revealed that the height of such trees were more than 2 m.
Tree crown projections (TCPs) were modeled using the contours of the tree’s shadows. The maximum values for the X coordinate of the corresponding shadow contour were taken as the coordinates of the TCP position along the X axis and the Y coordinate of the geometric center of the corresponding shadow contour were taken as the Y coordinate. The height of the shadow was taken as the diameter of the tree crown. This value was used to build the circles simulating the TCPs of the TCP center (Figure 3).
Estimates of the crown closure in the year 2020 for sparse tree stands and open forests, where shadows of neighboring trees did not overlap one another, were built using summer images from the Google Maps web service (satellite imagery supplier Airbus Maxar Technologies, true color image, spatial resolution 0.5 m pix−1, see Figure 2). We also found the contours of the tree shadows and determined the width of the shadows and the length of the shadows from south to north (Figure 3). The width of the shadow, in this case, was taken as the diameter of the tree crown.
The crown closure of the modern dense stands was measured with the winter satellite WorldView-01 images from 2007 if it was not possible to measure the tree shadows (Figure 4). In the SAGA GIS 2.3.2, the Gauss smoothing procedure watershed segmentation was performed and the “Seeds points” layer was created. According to the field measurements in 2020, the average maximum diameter for the tree crown projection was determined for all 20 × 20 m plots of the monitoring transect (5.1 m). This value was used to build the TCP at the seed point, since this method did not allow for the depiction of all the trees in the dense areas (Figure 4). The share of areas where the crown closure was determined using winter images was 29%. The combined use of the two methods for modeling the TCP allowed us to assess the crown closure across the study area (16,000 square plots).

2.4. Calibration of Remote Sensing Data Using Field Observations

To increase the precision of crown closure data obtained through the use of the above described methods, we calibrated them with the TCP calculated from the crown diameter measurements of trees with heights of more than 2 m on the altitudinal monitoring transect in 1960 and 2020. At first, the crown closure (CC) was calculated for all 140 plots (20 × 20 m) based on the sum of the crown projections (obtained during field measurements or using tree shadow contours), where the double counting of crowns overlapping areas was excepted (stand crown projection—SCP).
C C = S C P / 400 ,
where: CC—crown closure of a plot; SCP—the sum of the crown projections, except their overlapping areas.
A comparison of the CC determined from the aerial images and with the field measurements showed a strong relationship between them (R2 = 0.82, Figure S1). The following formula was used to refine the final values of the closure of the entire study area.
C C f i n 1962 = 1.0874 × C C s h 1962 + 0.003 ,
where: CCfin1962—the refined density of tree stands in 1962; CCsh1962—the CC determined using the shadows on the AP 1962.
The CC determined from the 2007 winter images was compared with the 2011 field measurements for squares with closely spaced trees. The data of the measurements of the crown projection areas, according to the winter images, were in good agreement with the field data (R2 = 0.66) (Figure S2).
The tree crown projections obtained from the shadows on the satellite images in 2020 and with the winter images in 2007 were combined into a vector layer and used to calculate the CC for the whole study area. Then, this dataset was compared with the materials of the field measurements taken in 2020 for 140 20 × 20 m squares (Figure S3). The measurement data from the satellite images correlated well with the field measurements (R2 = 0.82), and could be used to calculate the density of the forest stands under these conditions.
According to Formula (3), for the dependence of the CC determined from the field data and measurement data on the satellite images, the measured CC values were calibrated and taken as true.
C C f i n 2020 = 1.2661 C C s h 2020 + 0.0246 ,
where: CCfin2020—calibrated forest stand density for 2020; CCsh2020—density determined using satellite images from 2020.
Field data for 140 squares for 2011 and CC data, measured with images from 2020, allowed us to find a strong relationship between them (R2 = 0.81). Using the dependency, presented in Figure S4, we calculated the corrected crown closure for each square plot in 2011.
C C f i n 2011 = 0.9888 C C s h 2020 + 0.0232 ,
where: CCfin2011—calibrated forest stand density for 2011; CCsh2020—density determined using satellite images from 2020 and 2011.
Using the calibrated CC values for 1962, 2011 and 2020, for each square plot (20 × 20 m) of the 1600-square “grid”, the 21 categories of crown closure were determined. The categories were determined by dividing the CC values from 0 to 1 into equal intervals of 0.05. Category 0 corresponded to a CC of 0 and category 20 to a CC of 0.96–1. For each crown closure category in 1962 the number of plots which came to other categories in 2021 was determined.

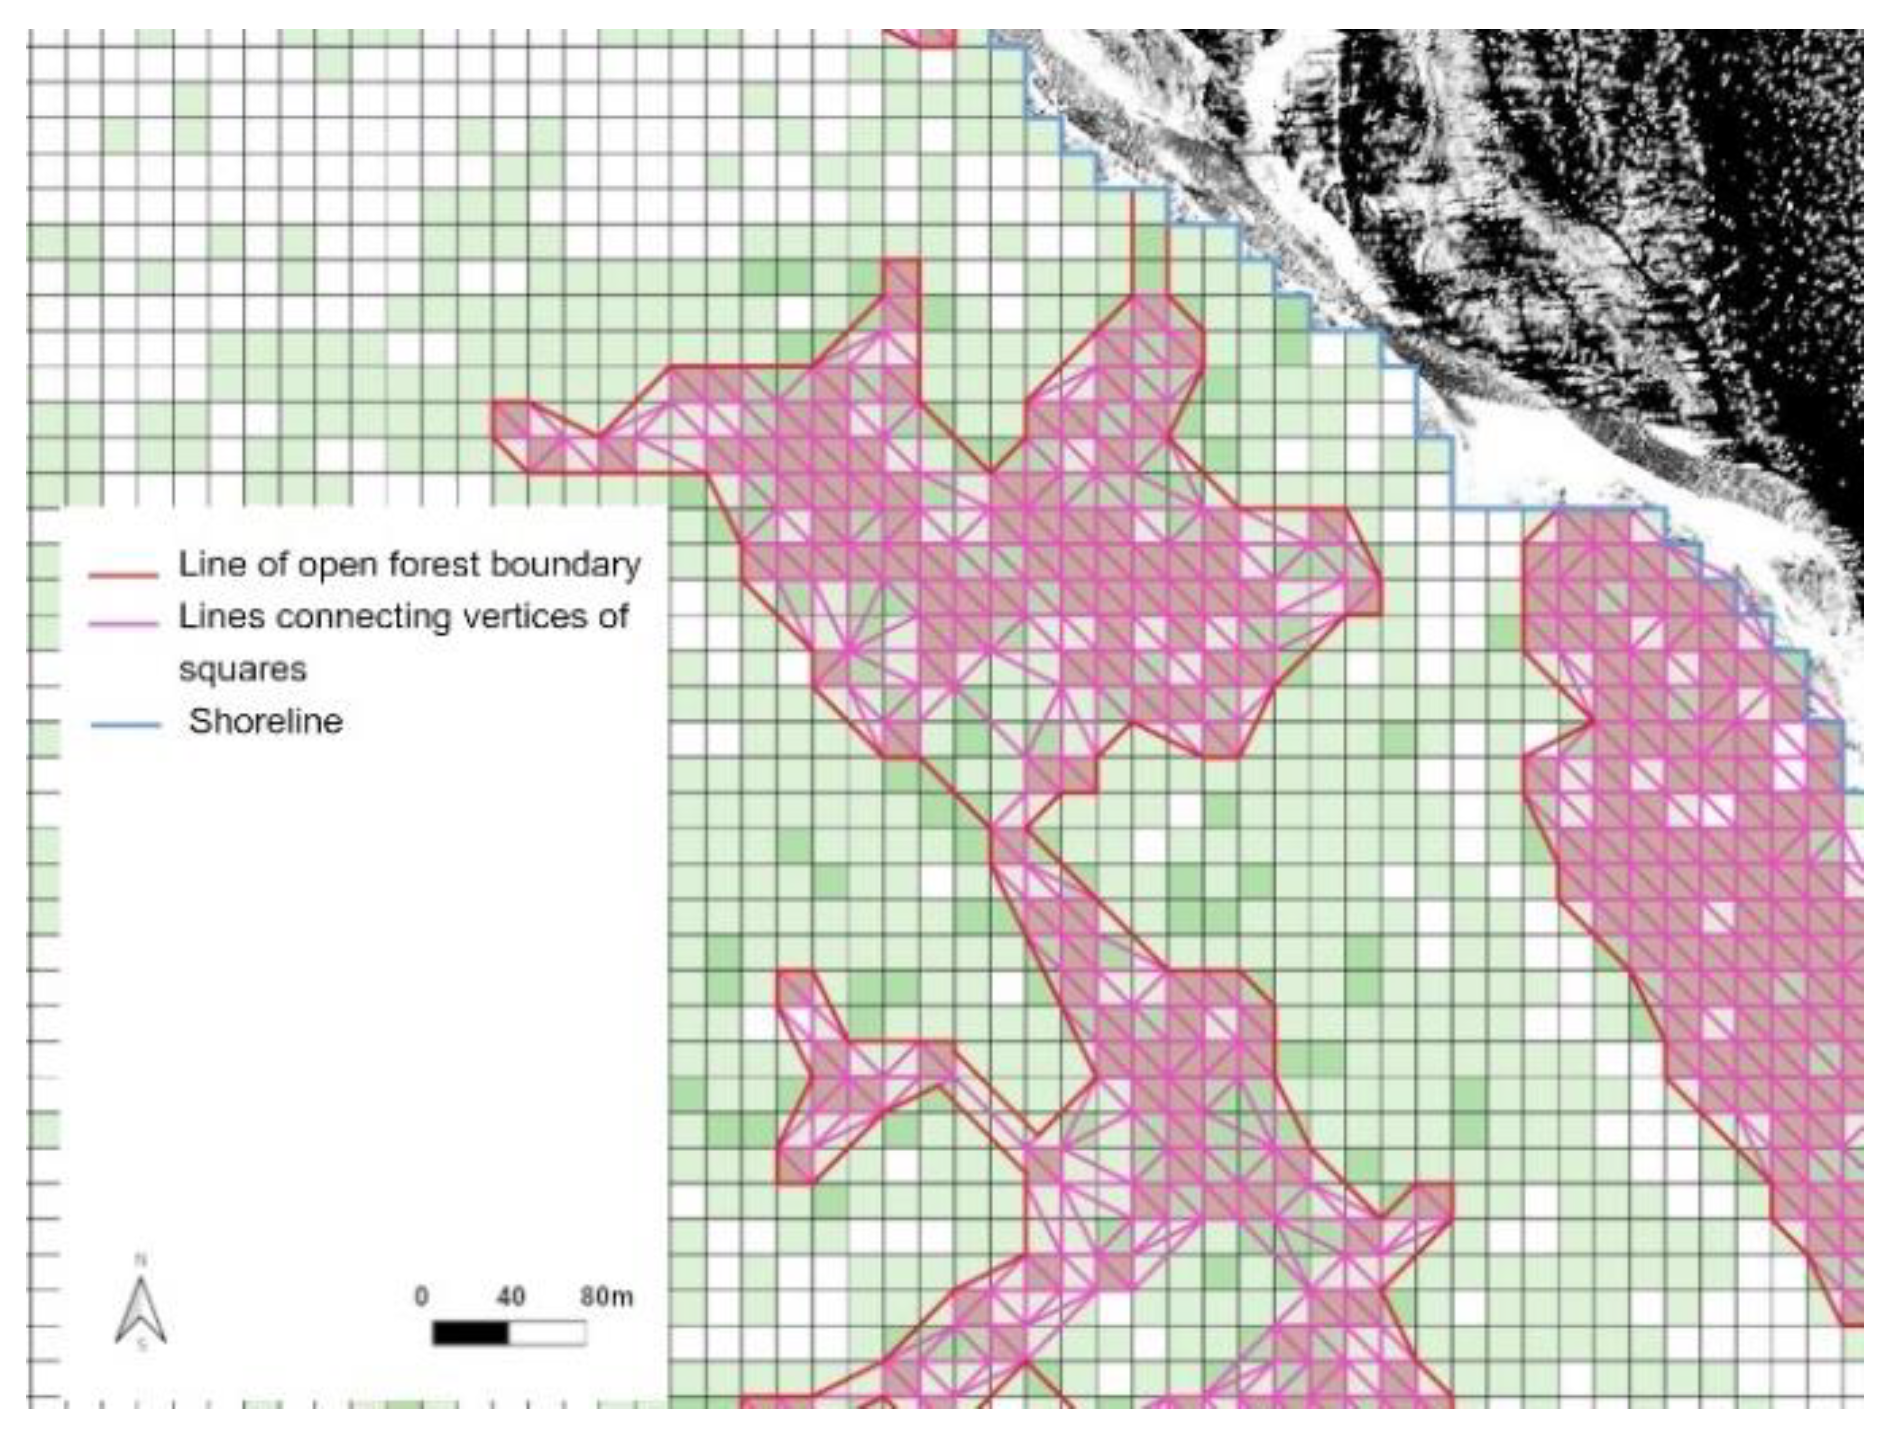
2.5. Detection of Position of Upper Boundaries of Open Forests

The above “grid” was used to determine the average CC along the border of low-density forests, which we carried out in the course of the visual interpretation of the satellite images taken in 2020. The average CC for the plots located along this border was 0.1 (0.088) units. This value was used to find the position of the open forest boundary for 1962, 2011 and 2020.
The generalized upper border of the open forests in 1962 was determined using plots with a CC of 0.1 and higher. Vertices were extracted from these plots and connected with lines (Figure 5).
Lines longer than 60 m were removed. The remaining lines were combined into polygons. Polygons at a distance of 60 m or closer to the river’s shoreline formed the primary line of the forest boundary; later, small polygons were connected to it, at a distance of less than 60 m (for joining such polygons, squares with a CC of more than 0 were used). Thus, the consolidated line of the upper boundary of open forests for 1962 was identified in 2 stages. The generalized upper forest border for 2011 and 2020 was determined using the same method.

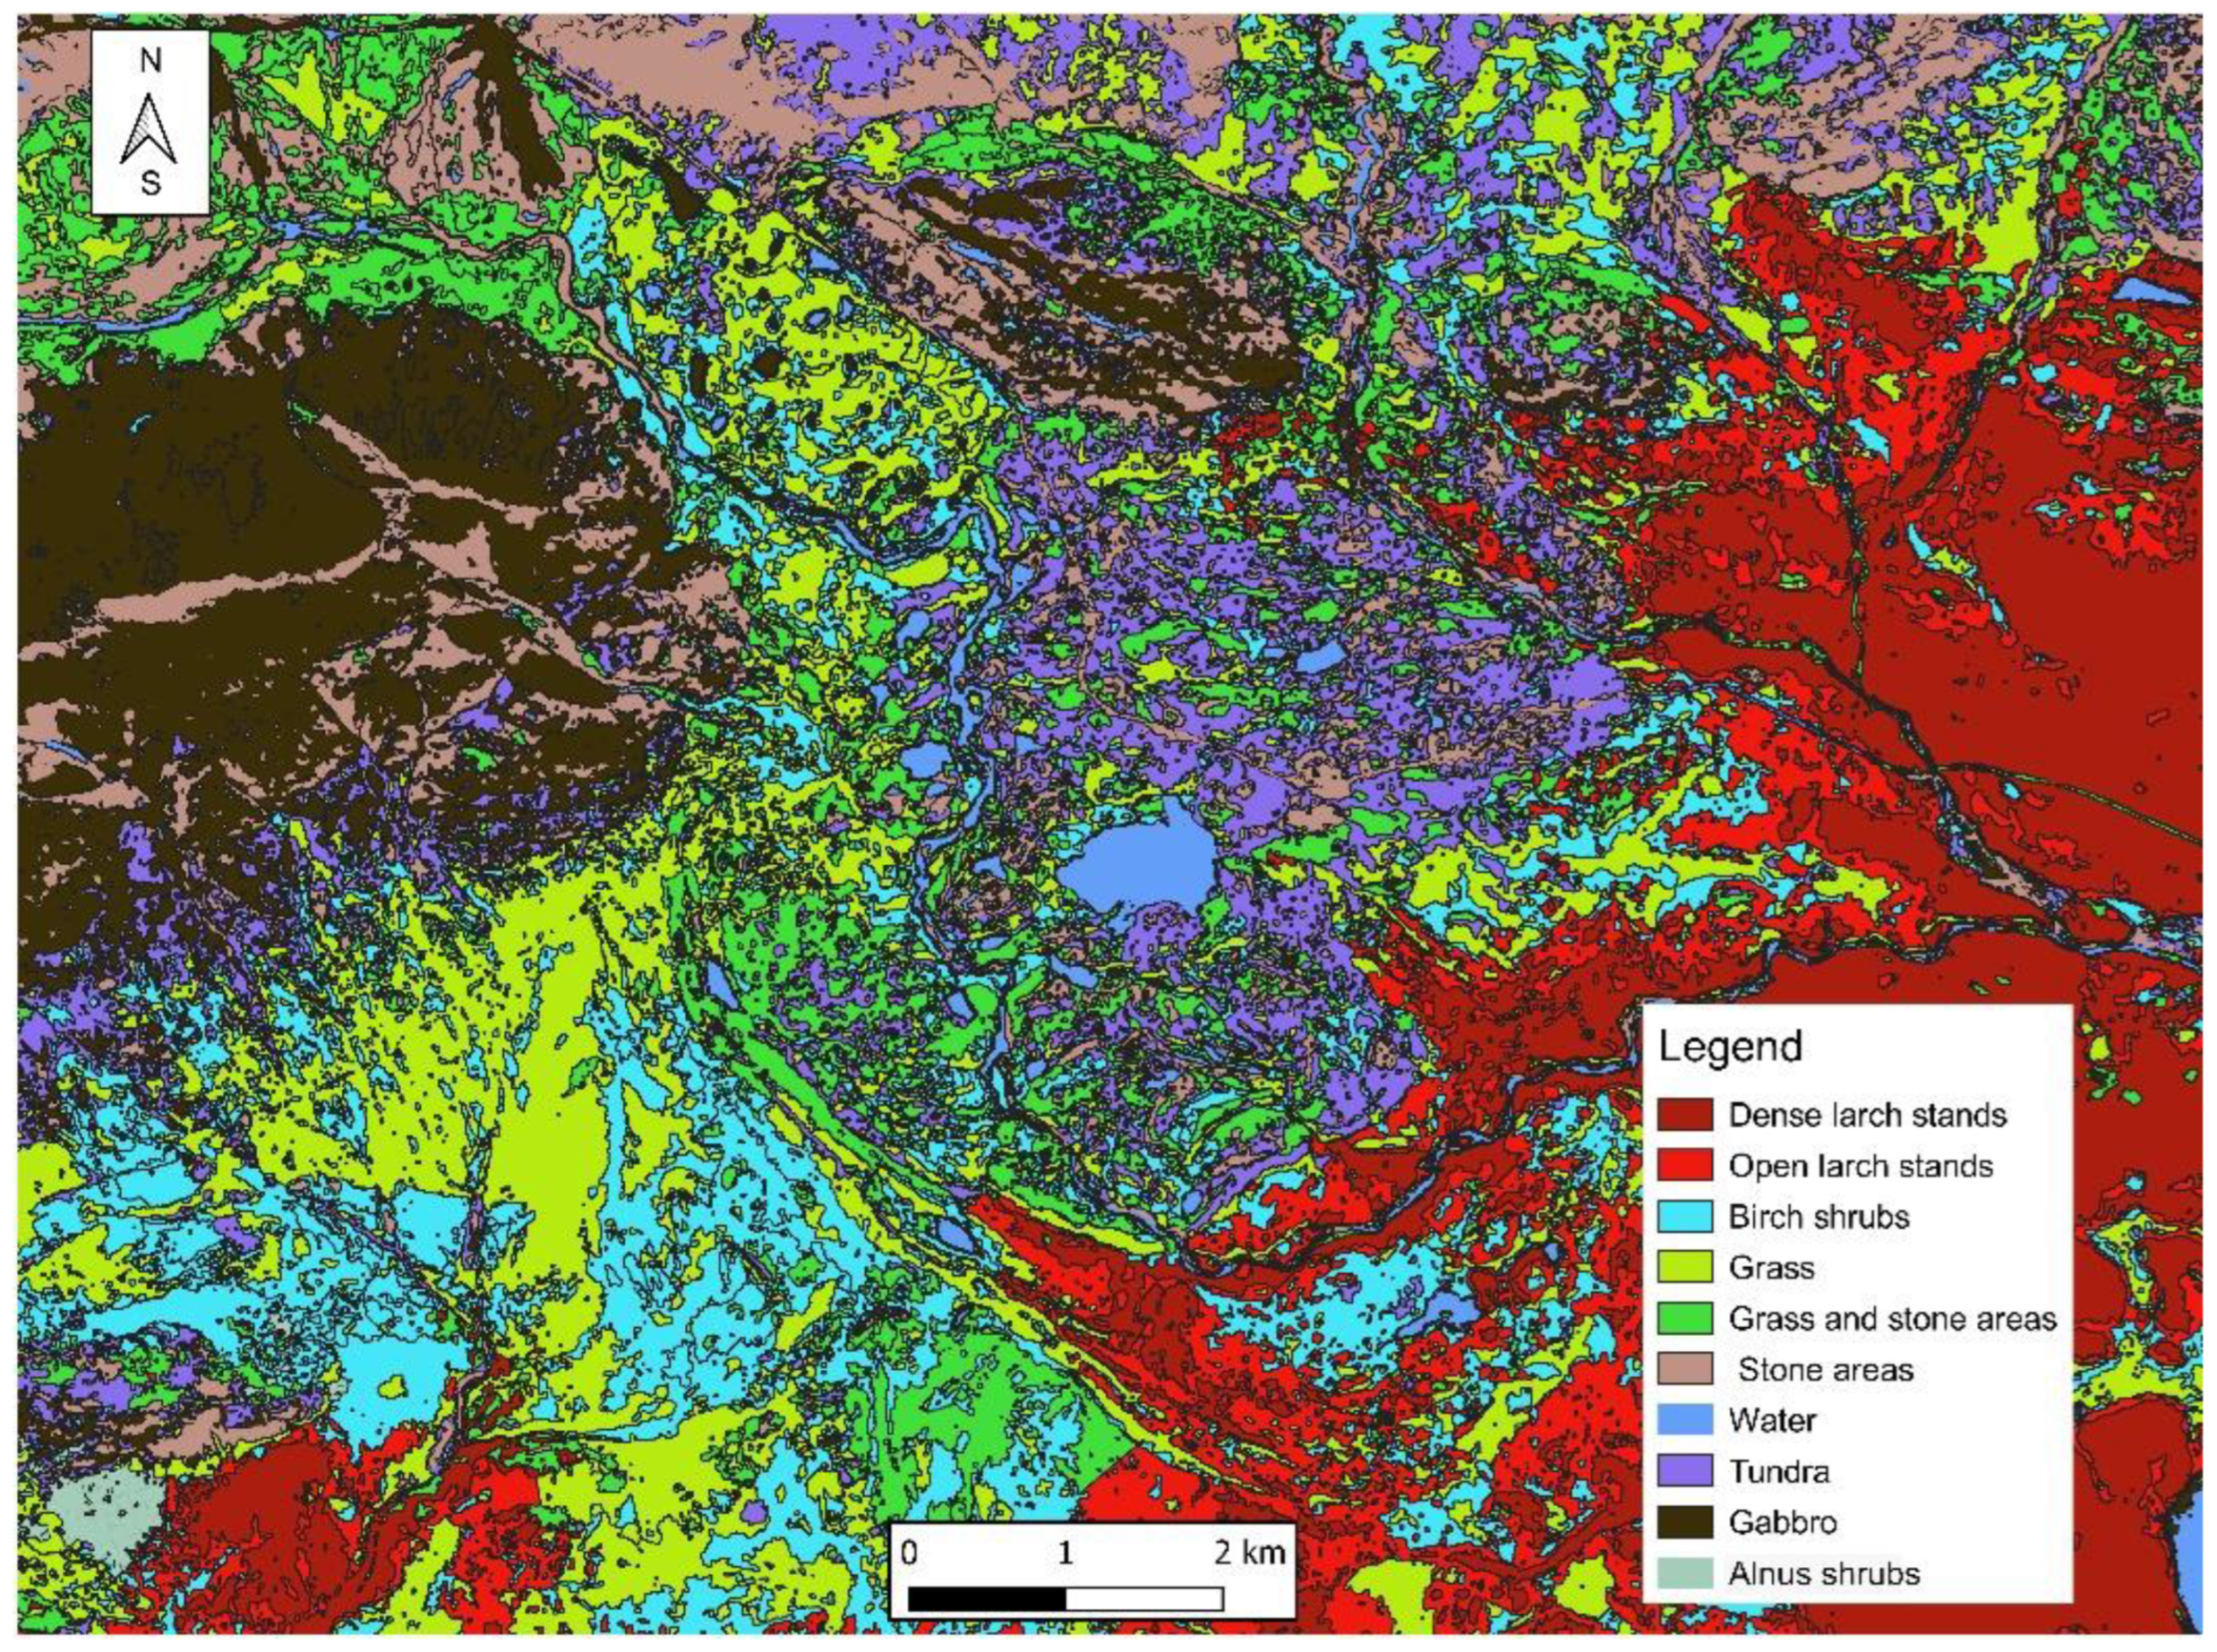
2.6. Creation of Landscape Map and Detection of Upper Open Forest Boundary

The delineation of different categories of landscapes was performed with multispectral satellite imagery. We used winter, spring and summer Seintinel-2 images. All images were downloaded from the Sentinel Hub web service. For further data processing, we used spectral bands 2, 3 and 4 of the winter images, NDVI rasters and all bands of summer–autumn images. The listed dataset enabled us to perform a supervised classification in SAGA GIS. Training areas were determined using field observation data as a polygonal vector layer. Thus, we selected 8 types of landscapes: dense larch forests, open larch forests, dwarf birch (Betula nana), alder shrubs, grass, tundra, gabbro rocks and alluvial deposits. The classification procedure was performed using the method of the minimum distance and distance threshold of 0.
The grid layer we obtained as a result of the classification was vectorized into a polygonal layer. Then, we performed a manual correction of the misclassified objects. Finally, we obtained the vector landscape map to the southeastern part of the Rai–Iz range (Figure 6).
On the basis of the landscape map, we obtained a modern generalized borderline of the open forests. We applied the method that we used to construct a generalized border of open forests according to the measurement of the canopy using shadows.

2.7. Estimation of Upper Open Forest Boundary Shift

The assessment of the upward shift in the upper boundary of open forests (closure 0.1–0.2) in the Polar Urals was carried out through a comparative analysis of historical topographic maps and modern satellite images. These data were combined with a digital elevation model with a resolution of 2 × 2 m in the geographic information system ArcGIS 10.8. (ESRI Inc., Redlands, CA, USA). The boundaries of open forest distribution in 1960 were manually vectorized with topographic maps, and the boundaries in 2020, obtained from satellite images (described in Section 2.6), were added. In accordance with the categories of landscapes (Figure 6), the boundaries were divided into segments with the slight and strong influence of edaphic constrains. In addition, the studied area was divided into 5 parts with relatively similar topographical features (slope inclination and exposure). There were, mainly, gentle eastern and southern slopes in parts #1 and 2, but more steep ones in parts #3–5, in which the prevailing exposition varied from the northern and northeastern to southwestern.
An estimate of the area of the open forest expansion was obtained using the Spatial Statistics tools. The analysis did not include treeless sites within the area of the open forest expansion, where the establishment of forest stands did not occur due to the strong influence of edaphic constrains (bogging, lack of soil substrate, etc.). The calculation of the shift in the upper boundary of the open forests in a horizontal distance was carried out using the function of estimating the Euclidean distance between the borders at initial and final periods. The shift in the upper boundary of the open forests in altitude was estimated from the values (min, max, mean) of the cells of the digital elevation model corresponding to the position of the open forests.
The areas of the open forest expansion were divided into sections according to the different gradations of exposure and slope steepness. The slope steepness was split into classes in steps of 10°. Based on the enlarged raster (10 × 10 m), the exposure consisted of eight groups, 45° each: northern (N, 337.5–22.5°), northeastern (NE, 22.5–67.5°), etc.

3. Results

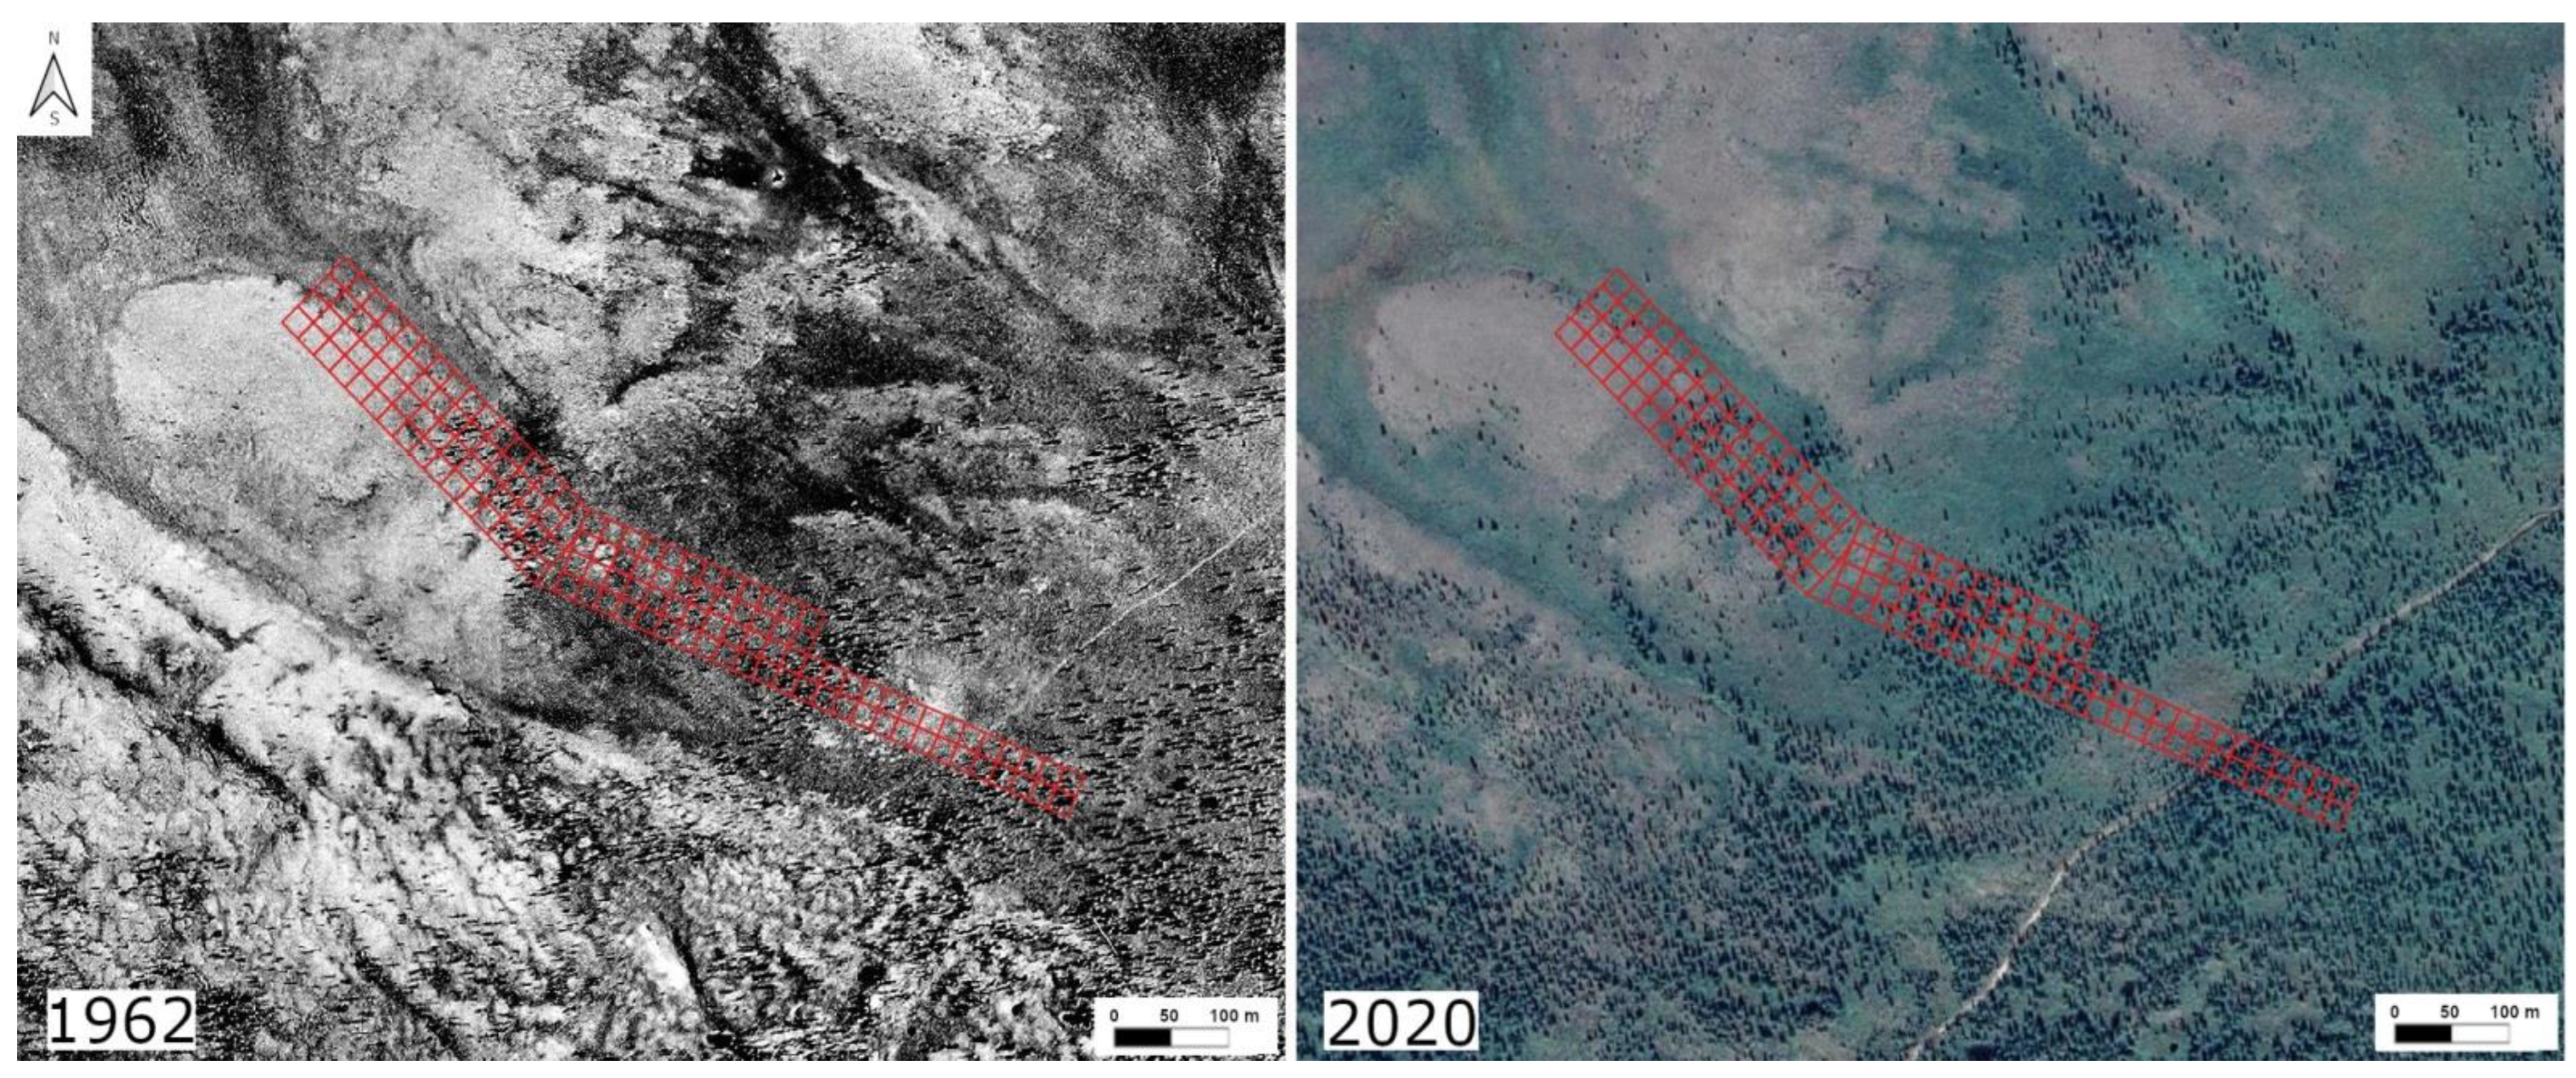
3.1. Tree Stand Dynamics within the Test Polygon Close to Mt. Chernaya

A comparison of crown closures reconstructed on base of aerial photographs from 1962 and satellite images from 2020 and validated using field measurements showed that there was a significant increase in the total tree crown coverage (from 6.9 to 22.1%) on the southern and eastern slopes of a hill with a height mark of 312 m a.s.l., close to Mt. Chernaya (Polar Urals) as a result of tree stand expansions in the tundra areas (Figure 7).
The share of plots without adult trees (>2 m) almost halved (from 65.4% to 34.5%) over the 60-year period as a result of transformations, mostly in sparse tree stands (crown closures of less than 0.1) and open forests (crown closures of 0.11–0.2) (see Table 1). The total percentage of plots with sparse tree stands remained almost unchanged (26.5 vs. 25.8%), but crown closures within a large part of such plots increased since the 1960s, and transformed in the open and closed forests by present day, while a similar quantity of tundra plots was settled with single trees. At the same time, the quantity of plots with open forests increased from 6.3 to 11.3%, and with closed forests in 17 times, from 1.6 to 27.8% (including stands with crown closures of 0.21–0.3 from 1.5 to 11.4%, 0.31–0.4 from 0.1 to 8.7% and 0.41–0.75 from 0 to 7.7%).
An analysis of changes in crown closures on individual plots since 1962 revealed that most of the tree stands with high crown closures (>0.70) at present time were formed on the sites with insignificant (0.01–0.2) initial crown closures in 1962, while on the plots with closed forests (>0.2) in the preliminary period, this increase was minimal (see Table 2).
An analysis of the general dynamics of tree stands of various densities within the test polygon showed that, with an increase in the total tree crown covers of this territory from 1962 to 2020, there was upward shift in the upper boundary of the distribution of all stand categories, and, in particular, open forests (closure 0.1–0.2) by an average of 23.3 m in altitude (see Figure 8). Minimal values (10–14 m) were noted for a sector of the southern slope with moraine deposits (see S_m in Figure 8 and Table 3) and southeastern sectors (SE1 and SE2) with waterlogged soils, whereas the maximum value (41 m) was marked for the south–southeastern sector (SSE-1). In sectors S, SSE-2 and E, the general shift was 25–32 m, although, in the first sectors, changes occurred mainly between 1962 and 2011; in the eastern sector, however, the changes were slow until 2011, and accelerated in the last decade (see Table 3).
Due to the fact that the inclination of the slopes in the sectors was different, the horizontal shifts (see Table 4) had a slightly different sequence in their magnitudes than the vertical ones. Thus, a maximum horizontal shift was noted in the eastern (E) sector (478 m), and the second, using magnitude, was SSE-1 (356 m). The minimum values were noted in the same southern sector with a prevalence of moraine deposits (67 m).
Finally, a comparison of the shifts in the open forest boundaries in different parts of the test polygon demonstrated that such processes were 2.5 times slower on moraine deposits and waterlogged soils (see in Table 3, 4 sectors S_m, SE-1, SE-2) than on sites without them.

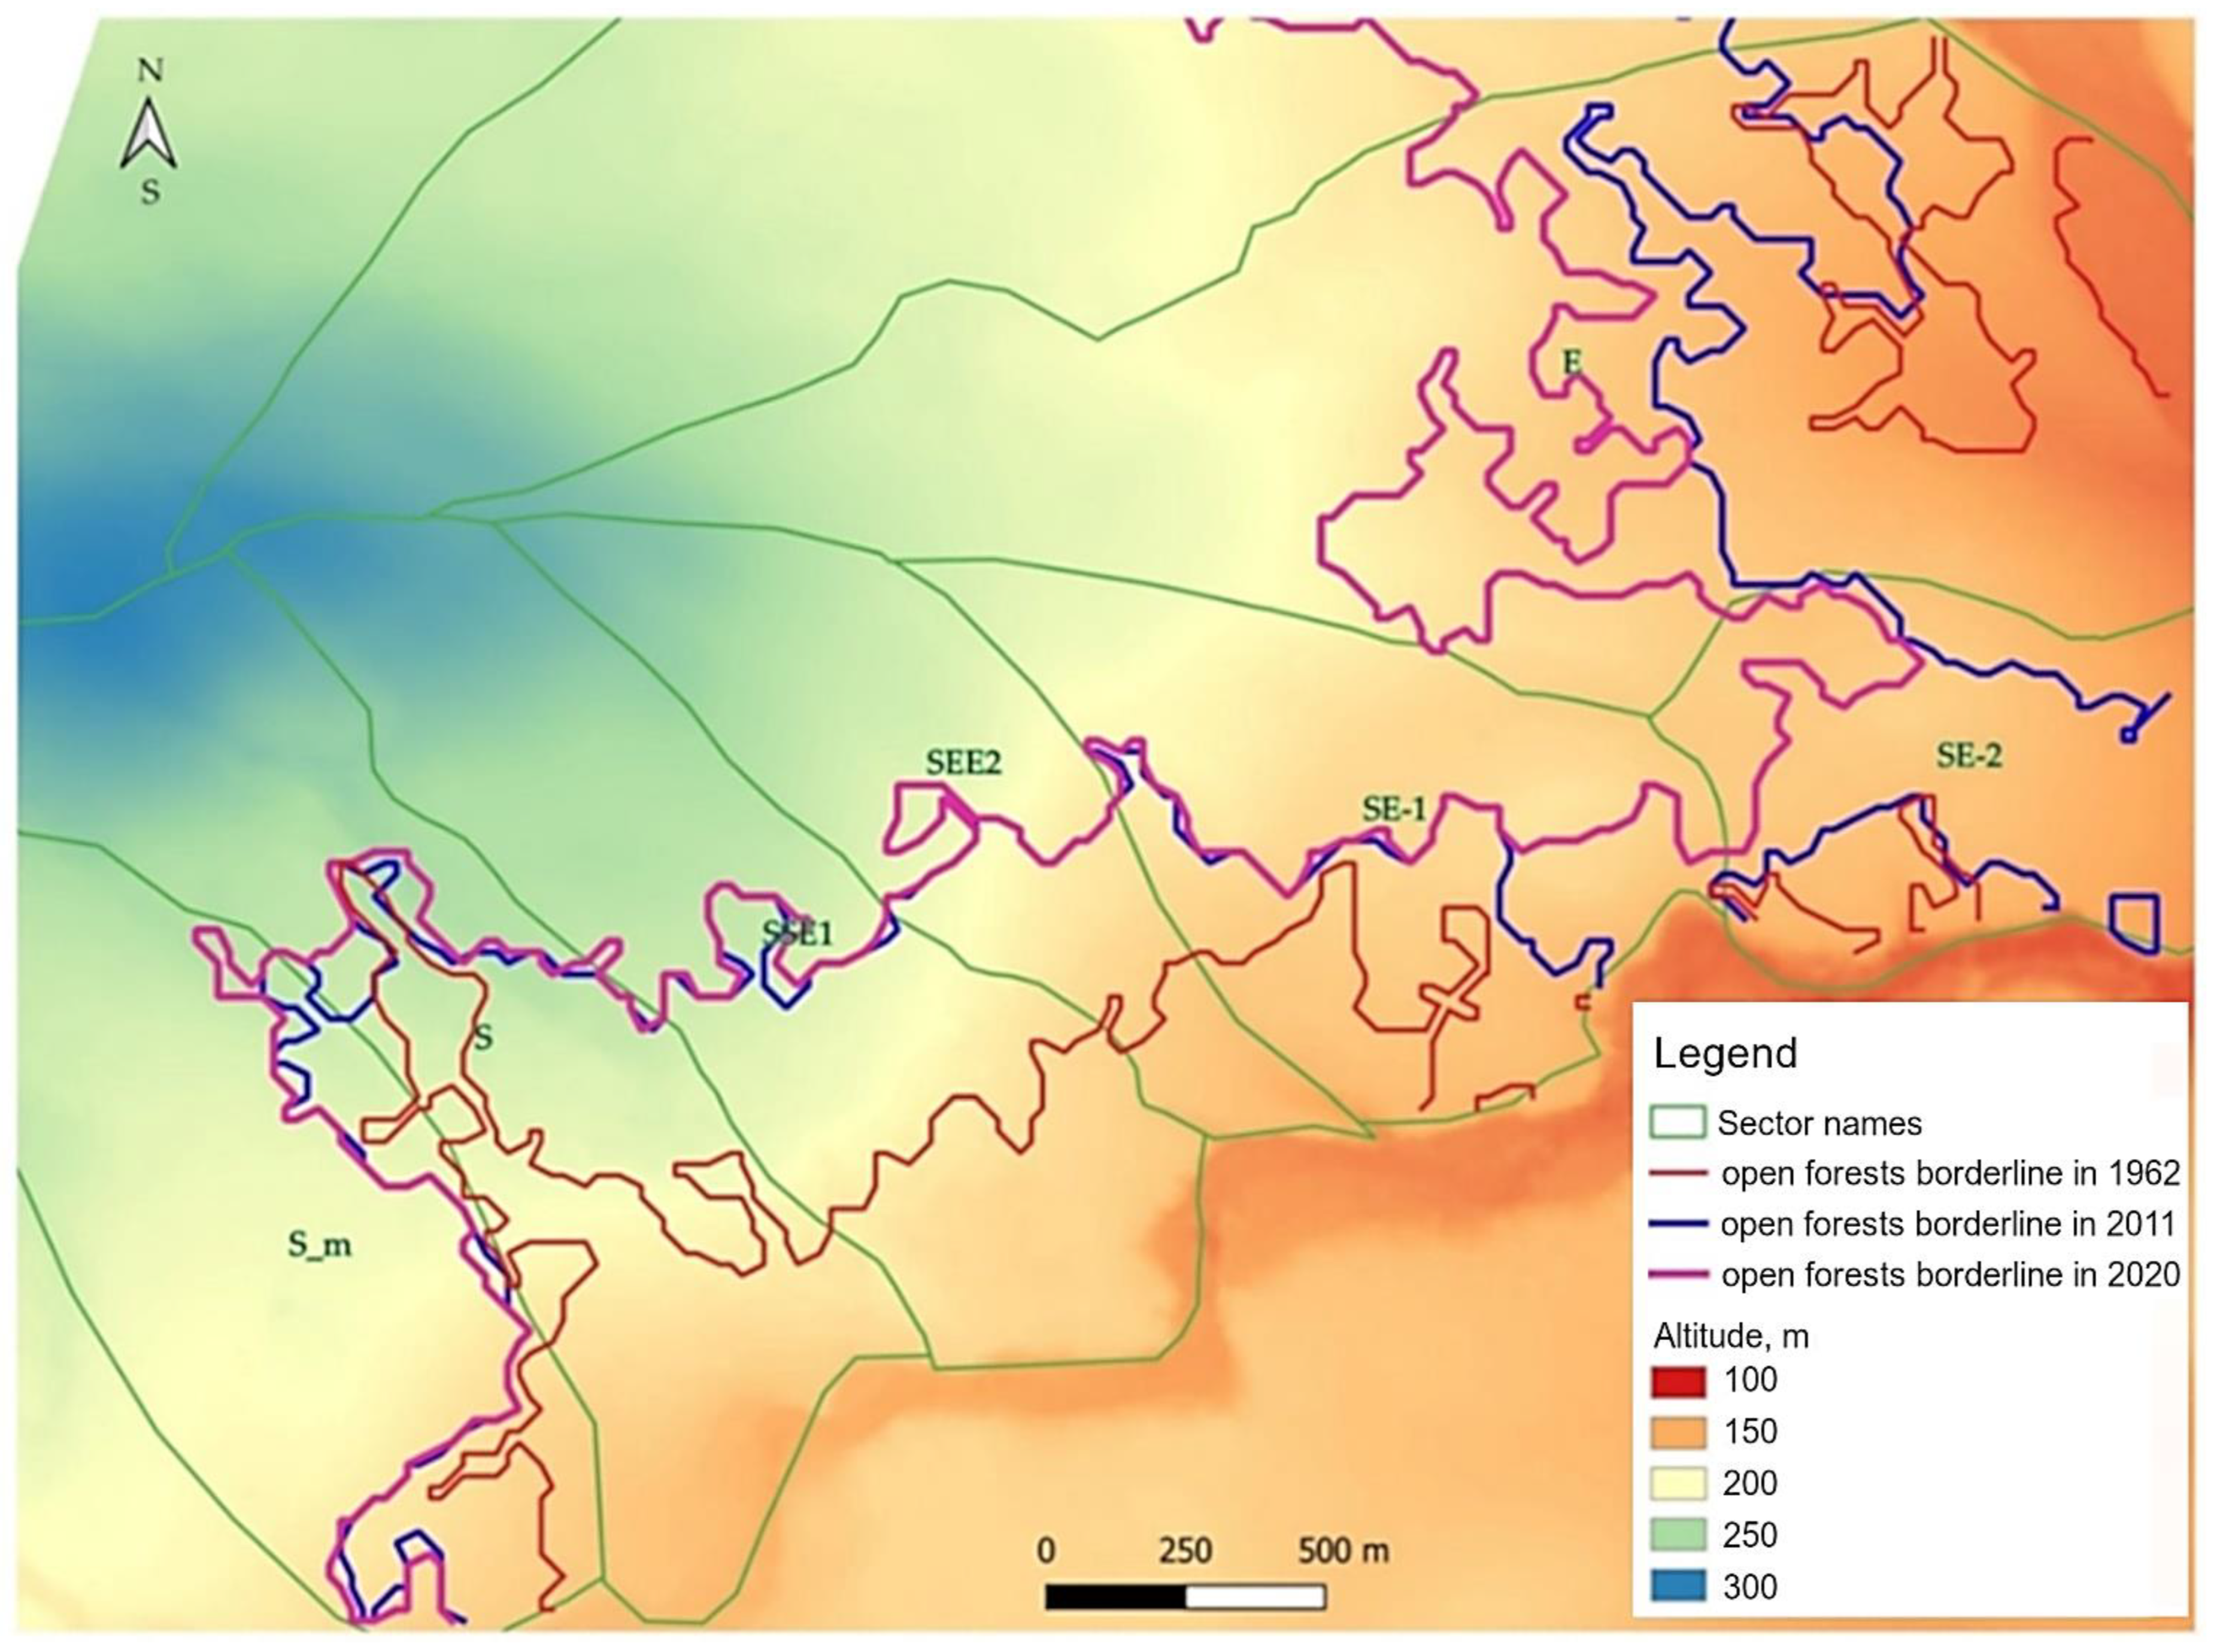
3.2. Characteristics of Open Forest Boundary and Its Dynamics at Studied Subregion of Polar Urals

An analysis of the distribution of moraine deposits, waterlogged soils and boulder fields at the upper location of the open forest boundary showed that their proportion varied significantly (from 0 to 0.64 of the total) at different parts of the studied subregion of the Polar Urals (see Table 5 and Figure 9). On slopes with a prevalence of such types of edaphic conditions, the altitudinal position of the open forest boundary (min, max or mean) located lower (up to 108 m) than at slopes without their wide occurrence. The open forests ascended the maximal position (330 m a.s.l.) on the southern slope of the Rai–Iz massif and descended to minimal altitudes on the northeastern slope of the same massif. There were gentle slopes (mainly less than 10°) surrounding Mt. Chernaya (parts #1 and 2 of the subregion), but at the Rai–Iz massif and Sob’s river valley (parts #3–5), more abrupt slopes were allocated. The prevailing slope expositions at the locations of open forest boundaries changed from southern–southeastern in parts one and two to northeastern expositions at part three, eastern at part four and to southwestern expositions at part five of the studied subregion of the Polar Urals (see Table 5 and Figure 9).
An analysis of the tree stand dynamics over the 60-year period in the studied subregion of the Polar Urals showed that there was an upward shift in the upper boundary of the open forest (closure of 0.1–0.2) by an average of 33 m in altitude at slopes without waterlogged soils, moraine deposits or boulder fields (see Figure 9) and 9 m at slopes with a prevalence of them. Minimal values (0–11 m) were noted at the slopes with edaphic constrains on parts three and four (see Figure 9 and Table 6), whereas the maximum value (42 m) was marked in part one. A comparison of the mean altitude of the upper open forest boundaries on the slopes with different expositions within the Sob’s river valley (parts # 3–4 and 5) showed that open forests ascended higher on 33 m on SW–W than on NE–E slopes (Table 7). In general, the area occupied by open and closed forests increased in approximately 27.4 km2 in this subregion of the Polar Urals over the 60-year period.

4. Discussion

Aerial photography and satellite images ground-truthed with plot-level forest inventory data demonstrates that at the eastern macroslope of the Polar Urals, the tree stand structures changed substantially over the 60-year period. A previous investigation [42] at that part of the Polar Urals showed that, between 1910 and 2000, the altitudinal shift in the upper boundary of open forests was 26 m (from 231 to 257 m a.s.l.) and closed forests was 35 m (from 195 to 230 m). Thus, the respective rates of altitudinal displacement over 90 years were 3 and 4 m per decade. In our research, we revealed for a coinciding part of the studied subregion of the Polar Urals (see part two on Figure 9) for the period between 1960 and 2020, upward changes in open forest positions were 32 m in the elevation (from 194–199 to 226–231 m) (see Table 5). Despite differences in our and previous investigations in time periods, methods of data requisition and definitions of forest type categories, obtained values were very close (4 or 5.3 m per decade).
We calculated altitudinal temperature lapse rates for the Polar Urals to be 0.65 °C per 100 m in altitude for the summer (see Section 2.1). Due to this temperature change with elevations, and the temperature increase in summer (0.82 °C) reported for the Polar Urals [30], the open forests line would be expected to have increased by 126 m (21 m per decade) in elevations between 1940–1960 and 2000–2020, if it was directly following the position of the isotherm. That was similar for the upward shift in isotherm lines due to climate warming estimated from different climatic records in the Alps, 10–20 m [43] or 20–40 m per decade [44]. However, the open forest position responses we provided for the Polar Urals were, therefore, significantly (four times) less than the advances predicted on the basis of climate change. Time-lags were identified between warming and tree stand structure changes, and so they may have taken some time before a response to an open forest advance could be recognized [15,45]. The disproportion between the movement of the isotherm and open forest lines indicate the complex interaction in ecological factors that could strongly influence the magnitude of the shifts on a landscape level [46]. As it was pointed out in some recent researches at the forest–tundra ecotone, this can be due to limited production, dispersal, and establishment of viable seeds [47,48,49,50,51,52,53,54], unfavorable soil properties [55,56,57] and microsite conditions [58,59,60] for seed germination and seedling survival, and competition of young trees with shrubs and heath species [61,62,63].
An analysis of the matrix of the transition of plots with different crown closures in 1962 (Table 2) supported statements about the constraint of forest advances due to insufficient numbers of viable seeds on the limit of tree distributions. Thus, our data demonstrated that tree closures increased only approximately half of the treeless plots since 1962 (see Table 2), while on plots with several single trees (crown closures of less than 0.05), it was observed in 90 % of cases. We assumed that the observed significant change in canopy closures in sparse stands and open forests (crown closures of 0.06–0.2) since 1962 was associated not only with an increase in the size of the tree crowns, but also with the intensification of seed productivity, which contributed to the active tree establishment in these stand categories. However, changes in density in closed stands (crown closures of 0.21–0.35) were not as significant since 1962, due to high competition for limited soil resources (nutrients) both between mature trees and between the undergrowth and mature trees.
Our findings also confirmed the results that the forest advance to the mountains could be significantly limited by unfavorable edaphic conditions, [55,56,57] or tree stands would be unable to occupy new territories due to unsuitable substrates [12]. Thus, the open forest line shifted 2.5–3.5 times less on moraine deposits, waterlogged soils and boulder fields on steep slopes than on sites without them on the test polygon (see Table 3 and Table 4) and throughout the studied subregion of the Polar Urals (see Table 6).
Our obtained research data demonstrated that in the studied subregion of the Polar Urals, the highest altitudinal position and the largest upward shift in the open forest line occurred on the south-oriented slopes if not restricted by edaphic constrains (Table 7). A similar situation was marked on the Khibiny massif (Kola Peninsula), where the open forests reached the highest altitude on slopes of southwestern exposure, which was 123 m higher than on the northeast-oriented slopes [64]. At this mountain massif, a maximum shift in the open forests (99–107 m) was revealed on the slopes of the southern exposition. On the Sukhie Gory massif (Putorana Plateau, northern part of Middle Siberia), the most significant altitudinal shift in the open forest boundary was discovered on the slopes of the southern (111 ± 74 m) exposures [65]. In southwestern Yukon (Canada), treelines shifted upslope higher on south- compared to north-oriented slopes [11]. In midlatitude forests of northwest British Columbia, shaded north-oriented slopes also showed lower productivity than those located on the sunnier and warmer south-oriented slopes [66]. First, variations in the altitudinal positions, responses and productivity of open forests could be explained due to differences in the incoming total solar energy, which, in cold climates, plays a significant role in the heat supply of different slopes. On the south-oriented slopes, the amount of incoming total solar energy was always greater as compared to north-oriented slopes. Thus, from June to August in the Yukspor weather station (Kola Peninsula, Khibiny massif, 910 m a.s.l.), 34.8 kcal cm−2 of solar energy was received by the surface of the south-oriented slopes, with an inclination angle of 10°, whereas 32.9 and 30.6 kcal cm−2 was received by west/east- and north-oriented slopes, respectively. If the angle of inclination of the surface were to increase, the difference between the northern and southern slopes would also grow up to 6.5, 8.8 and 17.7 kcal cm−2 at 20°, 30° and 50° degrees of inclination, respectively [64]. Insolation causes the significant heating of crowns and trunks of trees, causing their temperature to become higher than the air temperature by 7–10 °C in the midday and, on average, by 0.8–2.9 °C per month on south-oriented slope [64]. In the eastern Alp treelines, the cambial activity of treeline trees lasted longer on the southern than on the northern slopes, due to the higher temperature of tree trunks at the first one [67]. Additionally, slope exposure can determine the start and end of snow melting in spring [68] and the growth period due to a greater warming up of tree trunks in the spring [67]. Differences in average altitudes in the upper forest boundary on the eastern and western slopes, which were illuminated by the sun in summer months and warmed up quiet equally, could be explained by the dominance of southwestern and western winds during the winter. This could cause a bigger snow pack accumulation on the northeastern and eastern slopes, and, as a result, could delay snow melting, thereby reducing the growing season in comparison with west-oriented slopes [65]. Thereby, it is important to keep in mind the slope exposure and its effects on tree growth and regeneration when considering models of tree stand dynamics on the upper limits of their distribution [69].

5. Conclusions

Our analysis of spatiotemporal changes of tree stand structures in the studied part of the Polar Urals showed that from 1960 to present day, total crown coverage significantly increased, and open forest lines moved up. Treeline advances originated in higher absorptions of solar radiation in newly forested areas and changes in C sequestration in plants and soils, therefore obtained by us knowledge about tree stand dynamics on the limit of their distribution could be widely applied for more precise forecasting processes of global warming. We suppose that a deeper understanding of the mechanics of tree stand dynamics based on a modelling approach that integrates climate, edaphic conditions (substrate type, thermal and moisture regime) and topographic features (slope exposition and inclination) with information on tree and tundra species ecological traits would be exceptionally helpful for improving predictions of tree stand responses to climate change in mountainous subpolar regions.

Supplementary Materials

The following supporting information can be downloaded at: https://www.mdpi.com/article/10.3390/f13122107/s1, Figure S1: crown closures within square plots (20 × 20 m) of monitoring transect calculated based on field data from 1960 and tree shadows in aerial images from 1962; Figure S2: crown closures within square plots (20 × 20 m) of monitoring transect calculated based on field data from 2020 and estimated with the use of winter satellite images captured using WorldView of 2007; Figure S3: crown closures within square plots (20 × 20 m) of monitoring transect calculated based on field data from 2020 and tree shadows in satellite images from 2007 and 2021; Figure S4: crown closures within square plots (20 × 20 m) of monitoring transect calculated based on field data from 2011 and tree shadows in satellite images from 2007 and 2021.

Author Contributions

P.A.M. conceived and coordinated the overall project. V.S.M. collected and treated field materials. N.F.N., P.A.M. and Y.V.S. analyzed the data. N.F.N., P.A.M. and Y.V.S. prepared the tables and figures and wrote the manuscript. All authors have read and agreed to the published version of the manuscript.

Funding

This study was supported by the Russian Foundation for Basic Research under grant RFBR-21-54-12016 for the sampling and analysis of collected materials and the preparation of the manuscript.

Institutional Review Board Statement

Not applicable.

Informed Consent Statement

Not applicable.

Data Availability Statement

The data presented in this study are available on request from the corresponding author.

Acknowledgments

The authors thank Trubnikov Y.S. for help in field measurements.

Conflicts of Interest

The authors declare no conflict of interest. The funders had no role in the design of the study; in the collection, analyses or interpretation of data; in the writing of the manuscript or in the decision to publish the results.

References

  1. IPCC. 2021: Summary for Policymakers. In Climate Change 2021: The Physical Science Basis. Contribution of Working Group I to the Sixth Assessment Report of the Intergovernmental Panel on Climate Change; Masson-Delmotte, V., Zhai, P., Pirani, A., Connors, S.L., Péan, C., Berger, S., Caud, N., Chen, Y., Goldfarb, L., Gomis, M.I., et al., Eds.; Cambridge University Press: Cambridge, UK, 2021; ISBN 978-92-9169-158-6. [Google Scholar]
  2. Lloyd, A.H.; Fastie, C.L. Spatial and temporal variability in the growth and climate response of treeline trees in Alaska. Clim. Chang. 2002, 52, 481–509. [Google Scholar] [CrossRef]
  3. Ackerly, D.D.; Cornwell, W.K.; Weiss, S.B.; Flint, L.E.; Flint, A.L. A geographic mosaic of climate change impacts on terrestrial vegetation: Which areas are most at risk? PLoS ONE 2015, 10, e130629. [Google Scholar] [CrossRef] [PubMed] [Green Version]
  4. Körner, C. A re-assessment of high elevation treeline positions and their explanation. Oecologia 1998, 115, 445–459. [Google Scholar] [CrossRef] [PubMed] [Green Version]
  5. Körner, C.; Paulsen, J. A world-wide study of high altitude treeline temperatures. J. Biogeogr. 2004, 31, 713–732. [Google Scholar] [CrossRef]
  6. Penuelas, J.; Boada, M. A global change-induced biome shift in the Montseny mountains (NE Spain). Glob. Chang. Biol. 2003, 9, 131–140. [Google Scholar] [CrossRef] [Green Version]
  7. Gehrig-Fasel, J. Treeline and Climate Change: Analyzing and Modeling Patterns and Shifts in the Swiss Alps. Ph.D. Thesis, Ecole Polytechnique, Palaiseau, France, 2007. [Google Scholar]
  8. Payette, S. Contrasted dynamics of Northern Labrador tree lines caused by climate change and migrational lag. Ecology 2007, 88, 770–780. [Google Scholar] [CrossRef]
  9. Lenoir, J.; Gégout, J.C.; Marquet, P.A.; de Ruffray, P.; Brisse, H. A Significant Upward Shift in Plant Species Optimum Elevation During the 20th Century. Science 2008, 320, 1768–1771. [Google Scholar] [CrossRef]
  10. Walsh, S.J.; Butler, D.R.; Malanson, G.P.; Crews-Meyer, K.A.; Messina, J.P.; Xiao, N. Mapping, modeling, and visualization of the influences of geomorphic processes on the alpine treeline ecotone, Glacier National Park, MT, USA. Geomorphology 2003, 53, 129–145. [Google Scholar] [CrossRef]
  11. Danby, R.K.; Hik, D.S. Variability, contingency and rapid change in recent subarctic alpine tree line dynamics. J. Ecol. 2007, 95, 352–363. [Google Scholar] [CrossRef]
  12. Macias-Fauria, M.; Johnson, E.A. Warming-induced upslope advance of subalpine forest is severely limited by geomorphic processes. Proc. Natl. Acad. Sci. USA 2013, 110, 8117–8122. [Google Scholar] [CrossRef]
  13. Treml, V.; Chuman, T. Ecotonal Dynamics of the Altitudinal Forest Limit are Affected by Terrain and Vegetation Structure Variables: An Example from the Sudetes Mountains in Central Europe. Arct. Antarct. Alp. Res. 2015, 47, 133–146. [Google Scholar] [CrossRef] [Green Version]
  14. Holtmeier, F.K.; Broll, G. Wind as an ecological agent at treelines in North America, the Alps, and the European Subarctic. Phys. Geogr. 2010, 31, 203–233. [Google Scholar] [CrossRef]
  15. MacDonald, G.M.; Szeicz, J.M.; Claricoates, J.; Dale, K.A. Response of the central Canadian treeline to recent climatic changes. Ann. Assoc. Am. Geogr. 1998, 88, 183–208. [Google Scholar] [CrossRef]
  16. Holtmeier, F.K.; Broll, G.; Müterthies, A.; Anschlag, K. Regeneration of trees in the treeline ecotone: Northern Finnish Lapland. Fennia 2003, 181, 103–128. [Google Scholar]
  17. Holtmeier, F.-K.; Broll, G. Soils at the Altitudinal and Northern Treeline: European Alps, Northern Europe, Rocky Mountains—A Review. Insights For. Res. 2018, 2, 67–83. [Google Scholar] [CrossRef]
  18. Mckenzie, D.; Peterson, D.W.; Peterson, D.L.; Seattle, P.E.T. Climatic and biophysical controls on conifer species distributions in mountain forests of Washington State, USA. For. Sci. 2003, 30, 1093–1108. [Google Scholar] [CrossRef]
  19. Lloyd, A.H. Ecological Histories From Alaskan Tree Lines Provide Insight Into Future Change. Ecology 2005, 86, 1687–1695. [Google Scholar] [CrossRef] [Green Version]
  20. Kullman, L.; Öberg, L. Post-Little Ice Age tree line rise and climate warming in the Swedish Scandes: A landscape ecological perspective. J. Ecol. 2009, 97, 415–429. [Google Scholar] [CrossRef]
  21. Holtmeier, F.-K. Mountain Timberlines: Ecology, Patchiness, and Dynamics; Springer: Berlin/Heidelberg, Germany, 2009; ISBN 1402097042. [Google Scholar]
  22. Grafius, D.; Malanson, G.; Weiss, D. Secondary controls of alpine treeline elevations in the Western USA. Phys. Geogr. 2012, 33, 146–164. [Google Scholar] [CrossRef]
  23. Weiss, D.J.; Malanson, G.P.; Walsh, S.J. Multiscale Relationships Between Alpine Treeline Elevation and Hypothesized Environmental Controls in the Western United States. Ann. Assoc. Am. Geogr. 2015, 105, 437–453. [Google Scholar] [CrossRef]
  24. Harsch, M.A.; Hulme, P.E.; McGlone, M.S.; Duncan, R.P. Are treelines advancing? A global meta-analysis of treeline response to climate warming. Ecol. Lett. 2009, 12, 1040–1049. [Google Scholar] [CrossRef] [PubMed]
  25. Virtanen, R.; Luoto, M.; RäMä, T.; Mikkola, K.; Hjort, J.; Grytnes, J.A.; Birks, H.J.B. Recent vegetation changes at the high-latitude tree line ecotone are controlled by geomorphological disturbance, productivity and diversity. Glob. Ecol. Biogeogr. 2010, 19, 810–821. [Google Scholar] [CrossRef]
  26. Vitasse, Y.; Hoch, G.; Randin, C.F.; Lenz, A.; Kollas, C.; Körner, C. Tree recruitment of European tree species at their current upper elevational limits in the Swiss Alps. J. Biogeogr. 2012, 39, 1439–1449. [Google Scholar] [CrossRef]
  27. Austin, M.P.; Van Niel, K.P. Impact of landscape predictors on climate change modelling of species distributions: A case study with Eucalyptus fastigata in southern New South Wales, Australia. J. Biogeogr. 2011, 38, 9–19. [Google Scholar] [CrossRef]
  28. Randin, C.F.; Engler, R.; Normand, S.; Zappa, M.; Zimmermann, N.E.; Pearman, P.B.; Vittoz, P.; Thuiller, W.; Guisan, A. Climate change and plant distribution: Local models predict high-elevation persistence. Glob. Chang. Biol. 2009, 15, 1557–1569. [Google Scholar] [CrossRef] [Green Version]
  29. Trivedi, M.R.; Berry, P.M.; Morecroft, M.D.; Dawson, T.P. Spatial scale affects bioclimate model projections of climate change impacts on mountain plants. Glob. Chang. Biol. 2008, 14, 1089–1103. [Google Scholar] [CrossRef] [Green Version]
  30. Hagedorn, F.; Shiyatov, S.G.; Mazepa, V.S.; Devi, N.M.; Grigor’ev, A.A.; Bartysh, A.A.; Fomin, V.V.; Kapralov, D.S.; Terent’ev, M.; Bugman, H.; et al. Treeline advances along the Urals mountain range—Driven by improved winter conditions? Glob. Chang. Biol. 2014, 20, 3530–3543. [Google Scholar] [CrossRef]
  31. Grigoriev, A.A.; Shalaumova, Y.V.; Vyukhin, S.O.; Balakin, D.S.; Kukarskikh, V.V.; Vyukhina, A.A.; Camarero, J.J.; Moiseev, P.A. Upward treeline shifts in two regions of subarctic Russia are governed by summer thermal and winter snow conditions. Forests 2022, 14, 174. [Google Scholar] [CrossRef]
  32. Shugart, H.H.; French, N.H.F.; Kasischke, E.S.; Slawski, J.J.; Dull, C.W.; Shuchman, R.A.; Mwangi, J. Detection of vegetation change using reconnaissance imagery. Glob. Chang. Biol. 2001, 7, 247–252. [Google Scholar] [CrossRef]
  33. Hofgaard, A.; Tømmervik, H.; Rees, G.; Hanssen, F. Latitudinal forest advance in northernmost Norway since the early 20th century. J. Biogeogr. 2013, 40, 938–949. [Google Scholar] [CrossRef]
  34. Rannow, S. Do shifting forest limits in south-west Norway keep up with climate change? Scand. J. For. Res. 2013, 28, 574–580. [Google Scholar] [CrossRef]
  35. Greenwood, S.; Chen, J.C.; Chen, C.T.; Jump, A.S. Strong topographic sheltering effects lead to spatially complex treeline advance and increased forest density in a subtropical mountain region. Glob. Chang. Biol. 2014, 20, 3756–3766. [Google Scholar] [CrossRef] [PubMed]
  36. Mathisen, I.E.; Mikheeva, A.; Tutubalina, O.V.; Aune, S.; Hofgaard, A. Fifty years of tree line change in the Khibiny Mountains, Russia: Advantages of combined remote sensing and dendroecological approaches. Appl. Veg. Sci. 2014, 17, 6–16. [Google Scholar] [CrossRef] [Green Version]
  37. Beckage, B.; Osborne, B.; Gavin, D.G.; Pucko, C.; Siccama, T.; Perkins, T. A rapid upward shift of a forest ecotone during 40 years of warming in the Green Mountains of Vermont. Proc. Natl. Acad. Sci. USA 2008, 105, 4197–4202. [Google Scholar] [CrossRef] [PubMed] [Green Version]
  38. Shiyatov, S.G. Age Structure and Formation of Larch Open Forests in the Upper Timberline in the Sob’ River Basin (the Polar Urals). In Geografiya i Dinamika Rastitel’nogo Pokrova: Trudy Instituta Biologii Ural’skogo Filiala Akademii Nauk SSSR; Institut Biologii Ural’skogo Filiala Akademii Nauk SSSR: Sverdlovsk, Russia, 1965; Volume 42, pp. 81–96. [Google Scholar]
  39. Shiyatov, S.G.; Mazepa, V.S. Climate-driven dynamics of the forest-tundra vegetation in the Polar Ural Mountains. Contemp. Probl. Ecol. 2011, 4, 758–768. [Google Scholar] [CrossRef]
  40. Shiyatov, S.G. Dynamics of Upper forest Boundary on the Eastern Slope of Polar Urals; Institute of Biology of Ural Department of Academy of Sciense of SSSR: Sverdlovsk, Russia, 1964. [Google Scholar]
  41. Shyatov, S.G. Climate fluctuation and stand age structure of larch open forests in mounatains of the Polar Urals. In Vegetation fo Forest-Tundra and Ways of Its Development; Nauka: Lenengrad, Russia, 1967; pp. 271–278. [Google Scholar]
  42. Shiyatov, S.G.; Terent’ev, M.M.; Fomin, V.V.; Zimmermann, N.E. Altitudinal and horizontal shifts of the upper boundaries of open and closed forests in the Polar Urals in the 20th century. Russ. J. Ecol. 2007, 38, 223–227. [Google Scholar] [CrossRef]
  43. Pauli, H.; Gottfried, M.; Grabherr, G. Effects of climate change on mountain ecosystems—Upward shifting of alpine plants. World Resour. Rev. 1996, 8, 382–390. [Google Scholar]
  44. Lamprecht, A.; Semenchuk, P.R.; Steinbauer, K.; Winkler, M.; Pauli, H. Climate change leads to accelerated transformation of high-elevation vegetation in the central Alps. New Phytol. 2018, 220, 447–459. [Google Scholar] [CrossRef]
  45. Holtmeier, F.K.; Broll, G. Altitudinal and polar treelines in the northern hemisphere causes and response to climate change. Polarforschung 2009, 79, 139–153. [Google Scholar] [CrossRef]
  46. Bourgeron, P.S.; Humphries, H.C.; Liptzin, D.; Seastedt, T.R. The forest–alpine ecotone: A multi-scale approach to spatial and temporal dynamics of treeline change at Niwot Ridge. Plant Ecol. Divers. 2015, 8, 763–779. [Google Scholar] [CrossRef]
  47. Dullinger, S.; Dirnböck, T.; Grabherr, G. Modelling climate change-driven treeline shifts: Relative effects of temperature increase, dispersal and invasibility. J. Ecol. 2004, 92, 241–252. [Google Scholar] [CrossRef]
  48. Mencuccini, M.; Piussi, P.; Sulli, A.Z. Thirty years of seed production in a subalpine Norway spruce forest: Patterns of temporal and special variation. For. Ecol. Manag. 1995, 76, 109–125. [Google Scholar] [CrossRef]
  49. Kroiss, S.J.; Hillerislambers, J.; D’Amato, A.W. Recruitment limitation of long-lived conifers: Implications for climate change responses. Ecology 2015, 96, 1286–1297. [Google Scholar] [CrossRef]
  50. Kambo, D.; Danby, R.K. Constraints on treeline advance in a warming climate: A test of the reproduction limitation hypothesis. J. Plant Ecol. 2018, 11, 411–422. [Google Scholar] [CrossRef] [Green Version]
  51. Gamache, I.; Payette, S. Latitudinal response of subarctic tree lines to recent climate change in eastern Canada. J. Biogeogr. 2005, 32, 849–862. [Google Scholar] [CrossRef]
  52. Trant, A.J.; Jameson, R.G.; Hermanutz, L. Variation in reproductive potential across a multi-species treeline. Arct. Antarct. Alp. Res. 2018, 50, e1524191. [Google Scholar] [CrossRef] [Green Version]
  53. Koshkina, N.B.; Moiseev, P.A.; Goryaeva, A.V. Reproduction of the Siberian spruce in the timberline ecotone of the Iremel’ Massif. Russ. J. Ecol. 2008, 39, 83–91. [Google Scholar] [CrossRef]
  54. Grigorieva, A.V.; Moiseev, P.A. Peculiarities and Determinants of Regeneration of Siberian Larch on the Upper Limit of Its Growth in the Urals. Contemp. Probl. Ecol. 2018, 11, 13–25. [Google Scholar] [CrossRef]
  55. Davis, E.L.; Hager, H.A.; Gedalof, Z. Soil properties as constraints to seedling regeneration beyond alpine treelines in the Canadian Rocky Mountains. Arct. Antarct. Alp. Res. 2018, 50, e1415625. [Google Scholar] [CrossRef] [Green Version]
  56. Lloyd, A.H.; Rupp, T.S.; Fastie, C.L.; Starfield, A.M. Patterns and dynamics of treeline advance on the Seward Peninsula, Alaska. J. Geophys. Res. 2002, 108, 8161. [Google Scholar] [CrossRef] [Green Version]
  57. Hagedorn, F.; Gavazov, K.; Alexander, J.M. Above- and belowground linkages shape responses ofmountain vegetation to climate change. Science 2019, 365, 1119–1123. [Google Scholar] [CrossRef]
  58. Brodersen, C.R.; Germino, M.J.; Johnson, D.M.; Reinhardt, K. Seedling Survival at Timberline Is Critical to Conifer Mountain Forest Elevation and Extent. Front. For. Glob. Chang. 2019, 2, 9. [Google Scholar] [CrossRef]
  59. Johnson, A.C.; Yeakley, J.A. Microsites and climate zones: Seedling regeneration in the alpine treeline ecotone worldwide. Forests 2019, 10, 864. [Google Scholar] [CrossRef] [Green Version]
  60. Lett, S.; Dorrepaal, E. Global drivers of tree seedling establishment at alpine treelines in a changing climate. Funct. Ecol. 2018, 32, 1666–1680. [Google Scholar] [CrossRef] [Green Version]
  61. Holtmeier, F.K.; Broll, G. Treeline advance—driving processes and adverse factors. Landsc. Online 2007, 1, 1–33. [Google Scholar] [CrossRef]
  62. Marsman, F.; Nystuen, K.O.; Opedal, Ø.H.; Foest, J.J.; Sørensen, M.V.; De Frenne, P.; Graae, B.J.; Limpens, J. Determinants of tree seedling establishment in alpine tundra. J. Veg. Sci. 2020, 31, e12948. [Google Scholar] [CrossRef]
  63. Kambo, D.; Danby, R.K. Factors influencing the establishment and growth of tree seedlings at Subarctic alpine treelines. Ecosphere 2018, 9, e02176. [Google Scholar] [CrossRef] [Green Version]
  64. Moiseev, P.A.; Galimova, A.A.; Bubnov, M.O.; Devi, N.M.; Fomin, V.V. Tree Stands and Their Productivity Dynamics at the Upper Growing Limit in Khibiny on the Background of Modern Climate Changes. Russ. J. Ecol. 2019, 50, 431–444. [Google Scholar] [CrossRef]
  65. Grigor’ev, A.A.; Devi, N.M.; Kukarskikh, V.V.; V’yukhin, S.O.; Galimova, A.A.; Moiseev, P.A.; Fomin, V.V. Structure and Dynamics of Tree Stands at the Upper Timberline in the Western Part of the Putorana Plateau. Russ. J. Ecol. 2019, 50, 311–322. [Google Scholar] [CrossRef]
  66. Kuyek, N.J.; Thomas, S.C. Trees are larger on south slopes in late-seral conifer stands in northwestern British Columbia. Can. J. For. Res. 2019, 49, 1349–1356. [Google Scholar] [CrossRef] [Green Version]
  67. Rossi, S.; Deslauriers, A.; Anfodillo, T.; Carraro, V. Evidence of threshold temperatures for xylogenesis in conifers at high altitudes. Oecologia 2007, 152, 1–12. [Google Scholar] [CrossRef] [PubMed]
  68. Körner, C. Alpine Treelines: Functional Ecology of the Global High Elevation Tree Limits; Springe: Basel, Switzerland, 2012; ISBN 978-3034-80395-3. [Google Scholar]
  69. Reger, B.; Kölling, C.; Ewald, J. Modelling effective thermal climate for mountain forests in the Bavarian Alps: Which is the best model? J. Veg. Sci. 2011, 22, 677–687. [Google Scholar] [CrossRef]
Figure 1. Location of the Polar Urals (right inset), the studied area within a region (left inset), monitoring altitudinal transect (1) and test polygon, (2) and on the southern and eastern slopes of a hill with a height mark of 312.8 m a.s.l., close to Mount Chernaya.
Forests 13 02107 g001
Figure 2. Aerial photo of 1962 and satellite image of 2020 indicating plot borders of altitudinal transects on the southeastern slope of a hill with a height mark of 312.8 m a.s.l., close to Mt. Chernaya (Polar Urals).
Forests 13 02107 g002
Figure 3. Tree shadows and crown projections built using aerial photos from 1962 (left), satellite images from 2020 (right) and field data measurements from 1960 and 2020.
Forests 13 02107 g003
Figure 4. Tree crown projection simulated using segmentation data of winter satellite images taken with WorldView 2007.
Forests 13 02107 g004
Figure 5. The vertices of squares with crown closures of 0.1 or more connected with lines no longer than 60 m.
Forests 13 02107 g005
Figure 6. Landscape map of Mt. Chernaya and southern part of Rai–Iz range created with the use of satellite images.
Forests 13 02107 g006
Figure 7. Tree crown closures in 1962 and 2020 on the southern and eastern slopes of a hill with a height mark of 312 m a.s.l., close to Mt. Chernaya (Polar Urals).
Forests 13 02107 g007
Figure 8. Upper boundaries of open forests in 1962, 2011 and 2020 on the southern and eastern slopes of a hill with a height mark of 312 m a.s.l., close to Mt. Chernaya (Polar Urals).
Forests 13 02107 g008
Figure 9. Position of upper open forest boundary in 1960 (1 and 3) and 2020 (2 and 4) at different parts (P1–P5) of the studied subregion of Polar Urals and area occupied by open and closed forests (5 and 6) over the 60-year period (1, 2, 5—on slopes without wide spread of moraine or river sediment deposits and boulder fields; 3, 4, 6—on slopes with wide spread of moraine or river sediment deposits and boulder fields).
Forests 13 02107 g009
Table 1. Share (in %) of the total number of plots with different crown densities in 1962 and 2020 on the southern and eastern slopes of a hill with a height mark of 312 m a.s.l., near Mount Chernaya (Polar Urals).
Crown closure0.000.01–0.050.05–0.10.11–0.150.16–0.20.21–0.250.26–0.30.31–0.350.36–0.40.41–0.450.46–0.50.51–0.550.56–0.60.61–0.650.66–0.70.71–0.750.76–0.80.81–0.850.86–0.90.91–0.950.96–1.0
196265.518.67.94.41.91.00.50.20000000000000
202034.516.49.47.14.75.75.75.13.62.91.61.41.00.50.20.10.020.040.020.010.01
Table 2. Matrix of transition (in %) of plots with different crown closures in 1962 into plots with different crown closures in 2020 on southern and eastern slopes of a hill with a height mark of 312 m a.s.l., close to Mt. Chernaya (Polar Urals).
2020
Crown closure 0.000.01–0.050.05–0.10.11–0.150.16–0.20.21–0.250.26–0.30.31–0.350.36–0.40.41–0.450.46–0.50.51–0.550.56–0.60.61–0.650.66–0.70.71–0.750.76–0.80.81–0.850.86–0.90.91–0.950.96–1.0
19620.0052.122.28.95.13.12.22.11.41.00.70.40.30.20.20.10.00.00.00.00.00.0
0.01–0.050.010.114.413.59.011.311.19.56.95.23.22.01.91.10.50.10.10.00.00.10.0
0.05–0.10.00.011.58.47.612.115.015.39.67.64.14.61.90.60.30.50.00.20.50.20.0
0.11–0.150.00.00.012.55.716.713.114.511.49.63.74.54.31.11.11.10.00.30.00.00.3
0.16–0.20.00.00.00.06.416.114.114.715.411.56.47.13.23.21.30.60.00.00.00.00.0
0.21–0.250.00.00.00.00.017.111.023.28.612.28.56.18.52.41.20.00.01.20.00.00.0
0.26–0.30.00.00.00.00.00.027.013.510.918.98.18.18.15.40.00.00.00.00.00.00.0
0.31–0.350.00.00.00.00.00.00.025.025.025.00.016.78.30.00.00.00.00.00.00.00.0
Table 3. Altitudinal position of open forest boundaries (mean ± SD) on the southern and eastern slopes of a hill with height mark of 312 m a.s.l., close to Mt. Chernaya (Polar Urals), in 1962, 2011 2020, and their vertical shift from 1962 to 2020.
Sector NameAltitudinal Position (m a.s.l.)Altitudinal Difference (m a.s.l.)Altitudinal Shift (m 10 y−1)
1962201120201962 and 20112011 and 20201962 and 2020in 1962–2011in 2011–2020in 1962–2020
S220 ± 17.8243 ± 12.8245 ± 10.9233254.63.04.4
SSE1195 ± 6.5234 ± 7.7236 ± 7.3401418.11.47.1
SEE2182 ± 2.2208 ± 9.0214 ± 10.3265325.46.05.5
E158 ± 9.2172 ± 6.9186 ± 7.91314282.715.84.7
Mean for group189 ± 9214 ± 9220 ± 9266325.26.65.4
S_m198 ± 16.6210 ± 19.6213 ± 21.7123142.43.22.5
SE-1176 ± 5.4185 ± 11.2189 ± 7.894131.94.32.3
SE-2167 ± 4.7168 ± 6.8177 ± 2.229100.39.61.7
Mean for group180 ± 9188 ± 13193 ± 1185121.55.72.2
Mean for all polygons185 ± 9203 ± 11209 ± 10186233.66.24.0
Table 4. Horizontal shifts (m) in open forest borders (mean ± SD) on the southern and eastern slopes of a hill with height mark of 312 m a.s.l., close to Mt. Chernaya (Polar Urals), in 1962–2020.
Sector Name Absolute Horizontal Shift (m)Horizontal Shift per 10 Years (m)
1962–20112011–20201962–20201962–20112011–20201962–2020
S152 ± 13521 ± 30167 ± 13230.923.828.8
SSE1344 ± 436 ± 11356 ± 4770.16.461.4
SEE2260 ± 561 ± 4268 ± 5353.01.346.2
E131 ± 112194 ± 160478 ± 14426.6215.982.3
S_m62 ± 579 ± 1967 ± 5912.610.311.6
SE-1126 ± 8645 ± 74193 ± 11725.750.233.3
SE-236 ± 47229 ± 188254 ± 1457.4254.243.8
Table 5. Characteristics of open forest boundary in the studied subregion of Polar Urals in 2020.
Part of Study AreaPortion of Total LengthAltitude in 2020 (m asl)Distribution of Slope Inclination (Degrees)Distribution of Slope Exposition
MinMax0–1010–2020–30NNEESESSWWNW
Slopes without wide spread of moraine deposits and boulder fields
111462790.970.030.000.010.050.100.200.340.230.050.02
20.661363300.920.070.010.040.130.180.240.270.110.020.01
30.36853110.660.290.050.160.230.240.120.070.090.050.04
40.82922430.370.480.120.040.220.430.150.070.060.020.01
51972880.420.350.160.030.040.080.100.170.240.240.10
Slopes with a prevalence of moraine deposits and boulder fields
10n.d.n.d.n.d.n.d.n.d.n.d.n.d.n.d.n.d.n.d.n.d.n.d.n.d.
20.341452530.910.080.010.060.230.180.180.200.110.020.02
30.64732350.760.200.030.150.300.250.100.050.050.040.06
40.181402280.530.360.080.080.170.110.130.210.120.100.08
50n.d.n.d.n.d.n.d.n.d.n.d.n.d.n.d.n.d.n.d.n.d.n.d.n.d.
Table 6. Altitudinal position and shift in the open forest boundary (mean ± SD) at different parts of the studied subregion of the Polar Urals in 1960 and 2020, and the area occupied by open forests over the 60-year period.
Part of SubregionAltitudinal Position
(m a.s.l.) in
Altitudinal Differences for Period 1960–2020 (m a.s.l.)Shift in 1960–2020
(m 10 year−1)
Area Occupied by Open and Closed Forests (km2)
19602020VerticalHorizontal
Slopes with slight influences of edaphic constrains
1202 ± 28244 ± 23427.048.29.81
2199 ± 39231 ± 38325.333.75.39
3213 ± 61238 ± 62254.225.51.54
4162 ± 39200 ± 35386.314.71.37
5207 ± 39238 ± 42315.219.84.33
All200 ± 42233 ± 43335.535.522.4
Slopes with strong influences of edaphic constrains
1n.d.n.d.n.d.n.d.n.d.n.d.
2194 ± 25226 ± 29325.341.33.59
3119 ± 36130 ± 42111.813.81.71
4169 ± 18169 ± 2000.03.20.03
5n.d.n.d.n.d.n.d.n.d.n.d.
All149 ± 47158 ± 5791.532.85.33
Table 7. Altitudinal position of the open forest boundary (mean and SD) on prevailing slope exposures at different parts of the studied subregion of Polar Urals in 1960 and 2020.
Part of Subregion12345
Year1960202019602020196020201960202019602020
Slopes slightly influence by edaphic constrains
Prevail slope exposureS, SWSE, SNE, ENE, ESW, W
Mean211238204234179205160197204234
SD43243635426036364246
Slopes strongly influence with edaphic constrains
Prevail slope exposuren.d.S, SWNE, ENE, Sn.d.
Meann.d.n.d.197240120131167167n.d.n.d.
SDn.d.n.d.323436421416n.d.n.d.
Publisher’s Note: MDPI stays neutral with regard to jurisdictional claims in published maps and institutional affiliations.

