
London Plane Tree Pollen and Pla A 1 Allergen Concentrations Assessment in Urban Environments

 ,
,  , ,
, , 
Abstract
1. Introduction
2. Materials and Methods
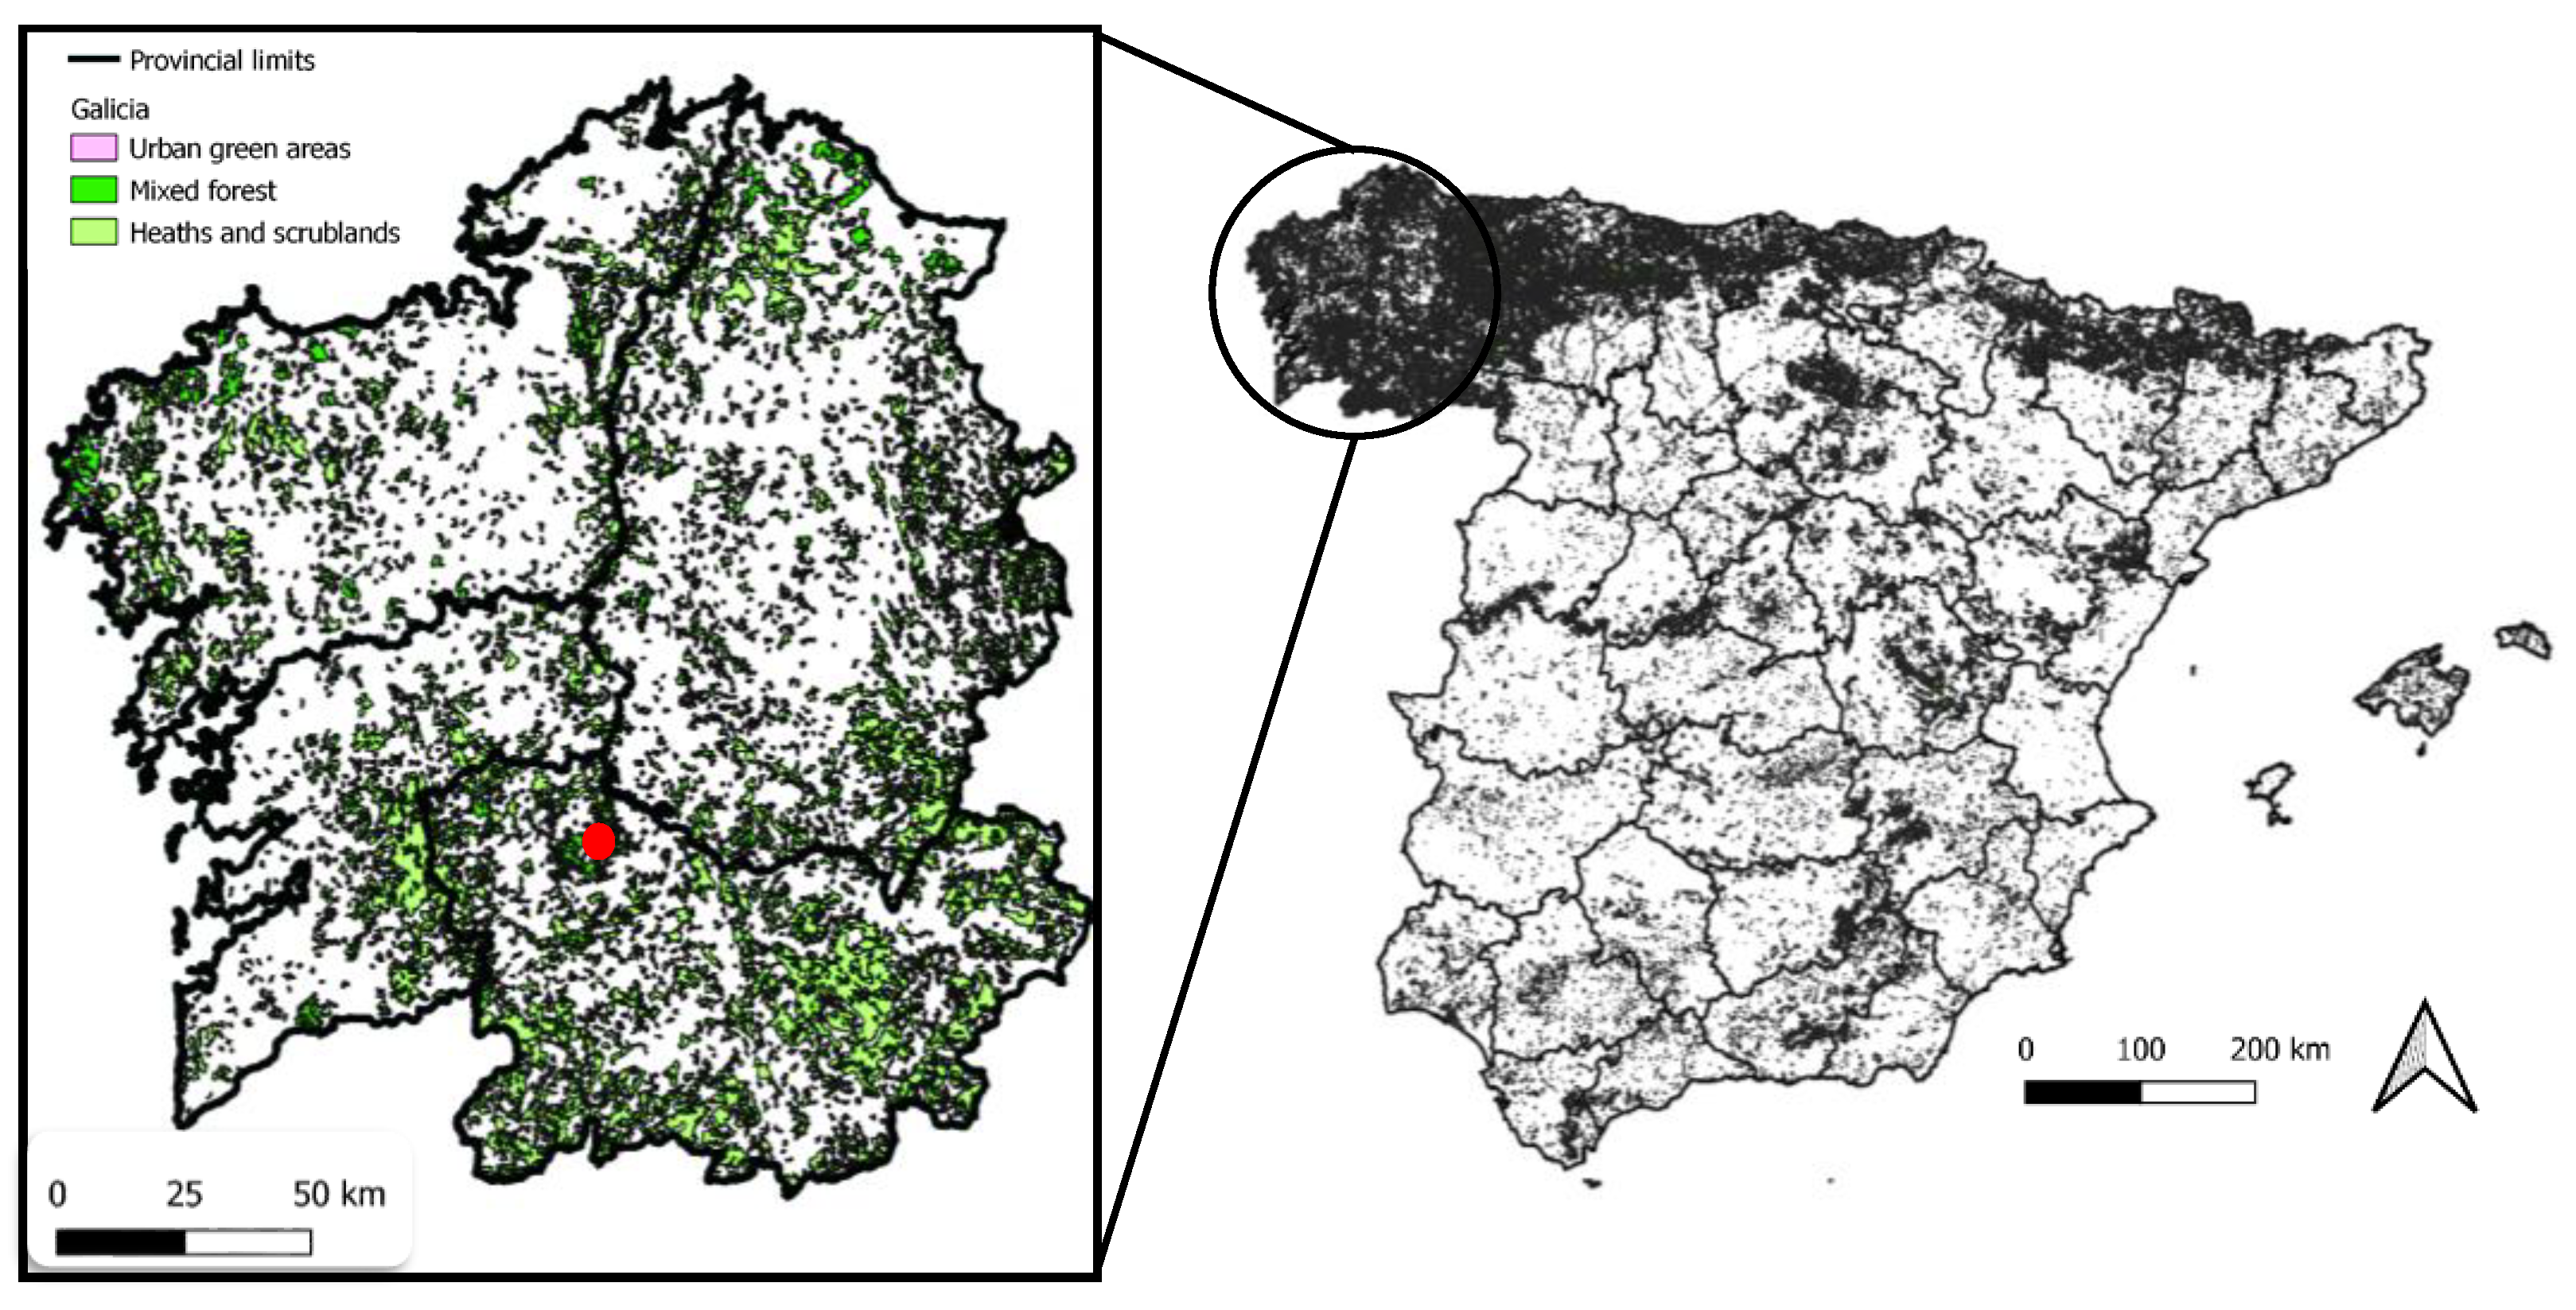
2.1. Study Area
2.2. Aerobiological Monitoring
2.3. Enzyme-Linked Immunosorbent Assay (ELISA) Technique
2.4. Meteorological Data
2.5. Statistical Analysis
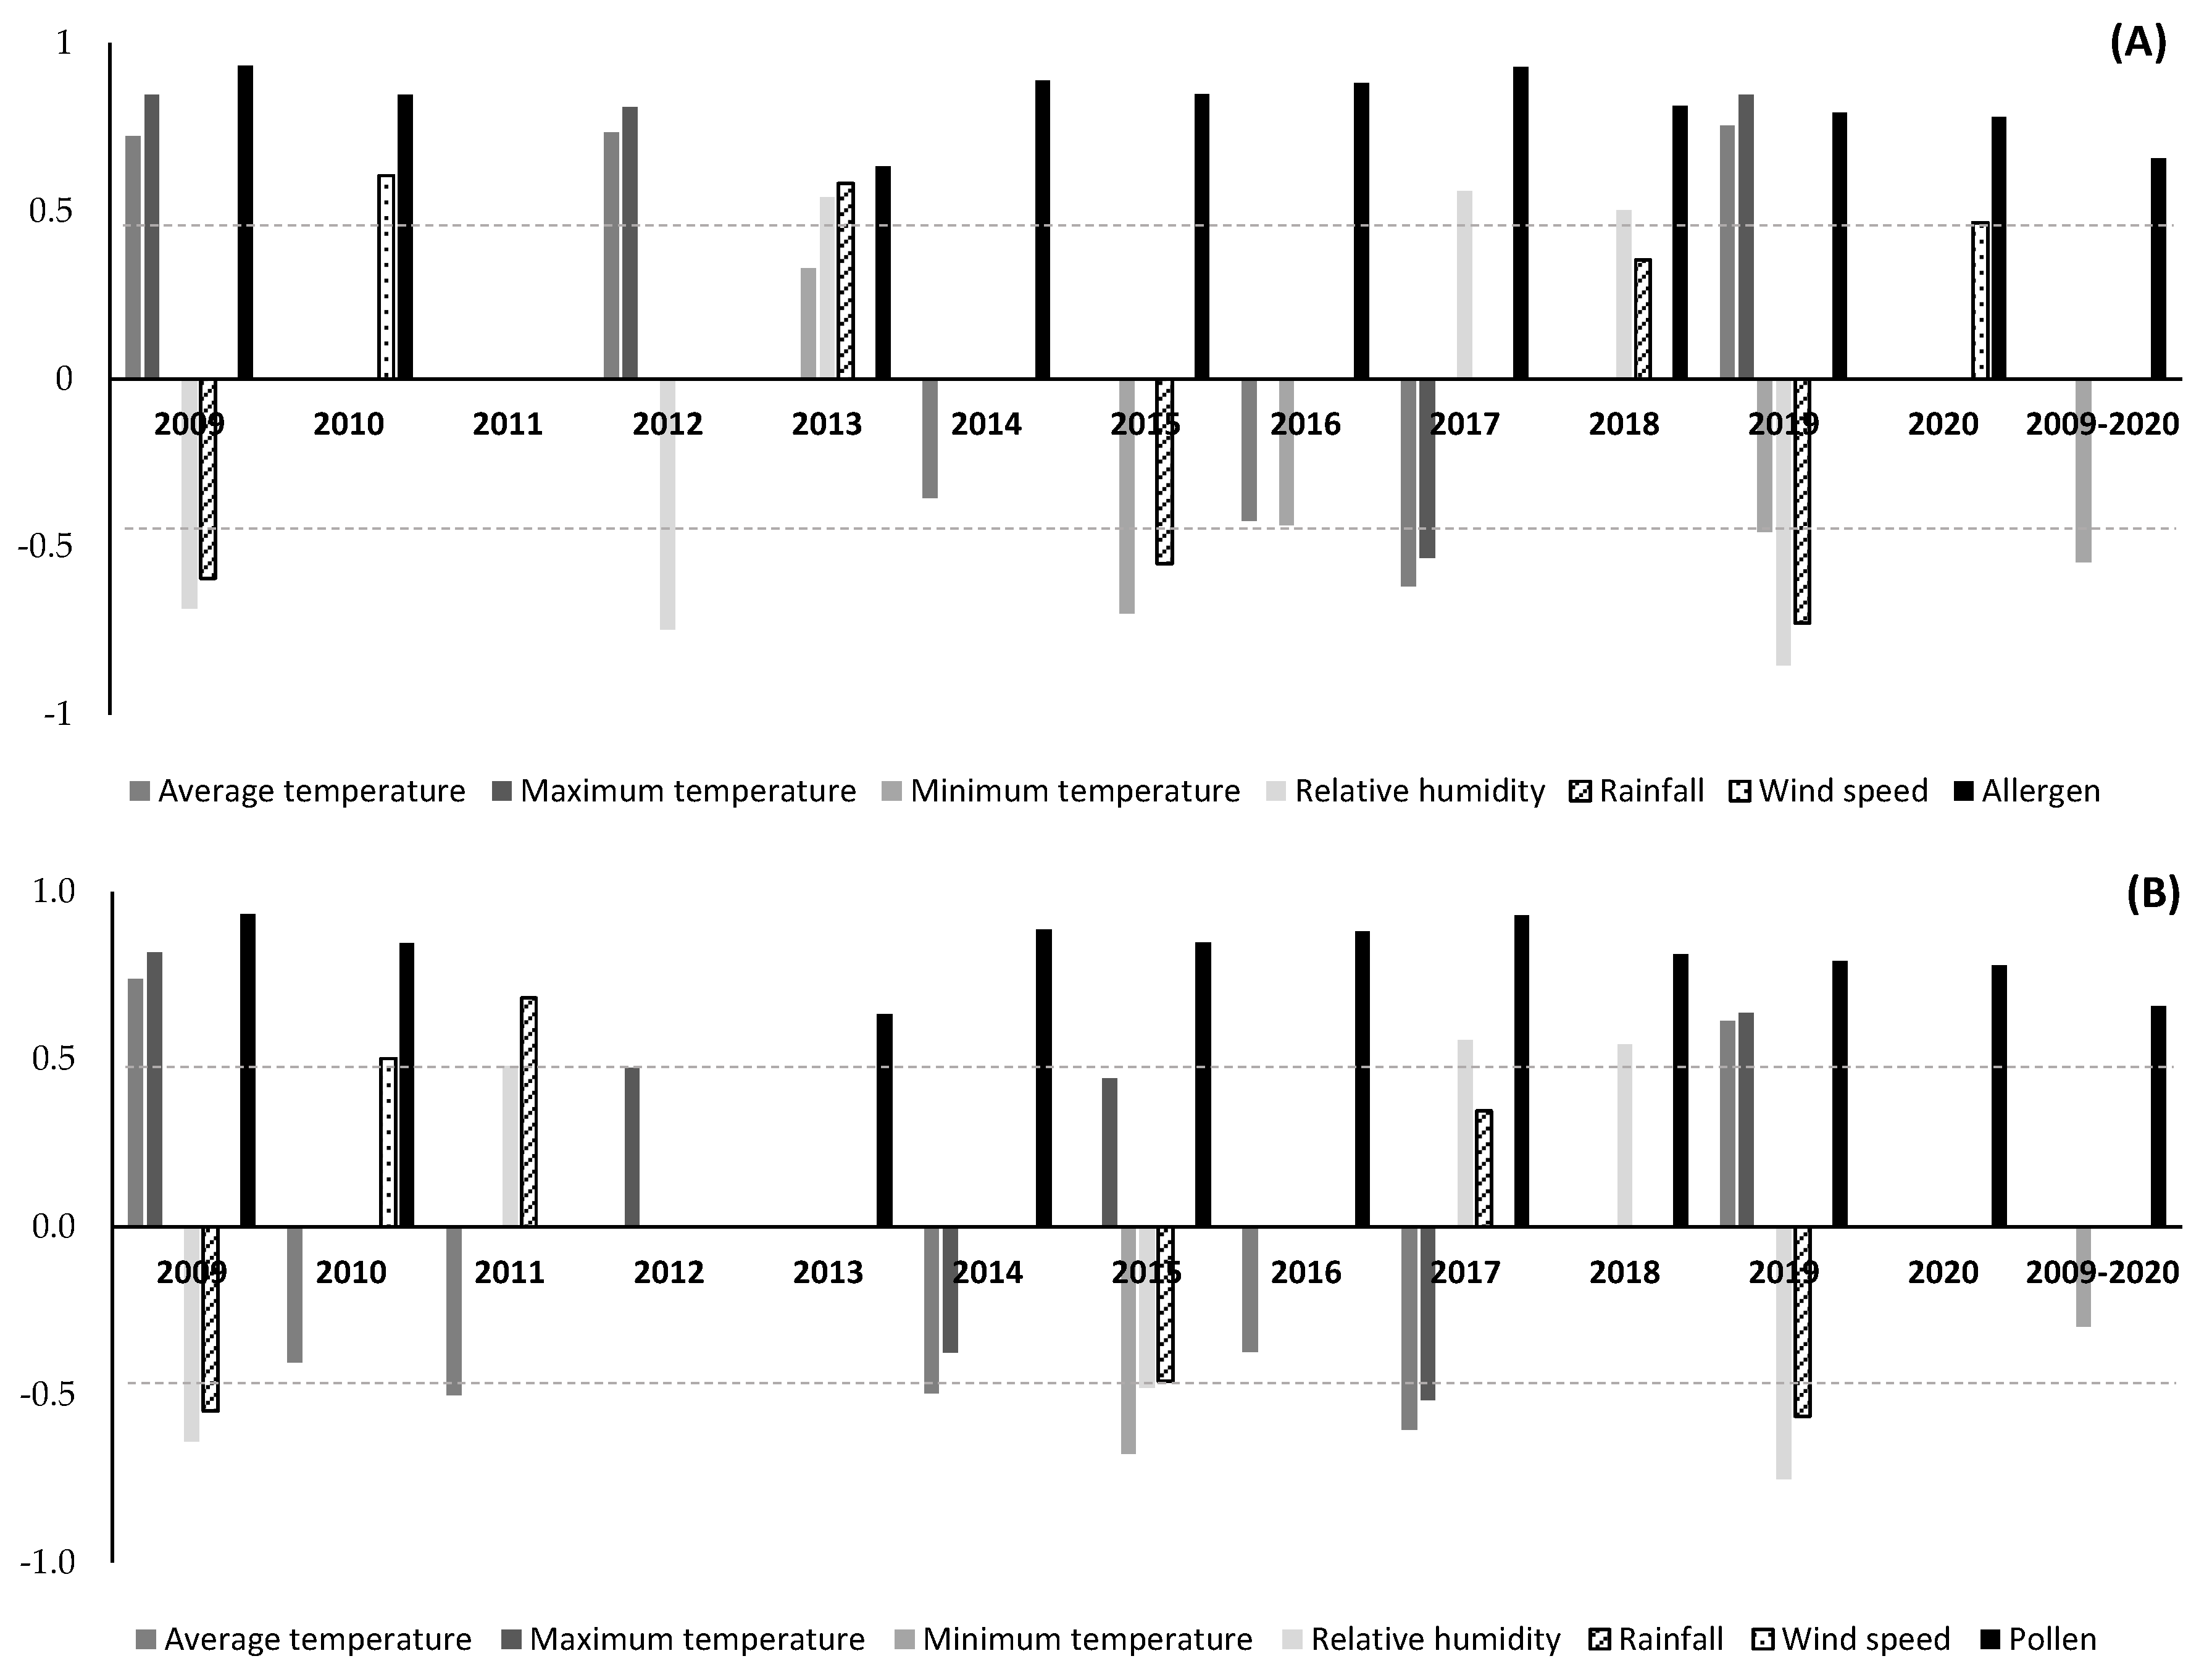
2.5.1. Correlation Analysis
2.5.2. Data Mining Algorithm: C5.0 Decision Trees and Rule-Based Models
- -
- TP: true positive
- -
- TN: true negative
- -
- FN: false negative
- -
- FP: false positive.
3. Results
4. Discussion
5. Conclusions
Author Contributions
Funding
Institutional Review Board Statement
Informed Consent Statement
Data Availability Statement
Conflicts of Interest
References
- Lo, F.; Bitz, C.M.; Battisti, D.S.; Hess, J.J. Pollen calendars and maps of allergenic pollen in North America. Aerobiologia 2019, 35, 613–633. [Google Scholar] [CrossRef]
- Bertin, R.I. Plant Phenology and Distribution in Relation to Recent Climate Change. J. Torrey Bot. 2008, 135, 126–146. [Google Scholar] [CrossRef]
- Gordo, O.; Sanz, J.J. Impact of climate change on plant phenology in Mediterranean ecosystems. Glob. Chang. Biol. 2010, 16, 1082–1106. [Google Scholar] [CrossRef]
- Fernández-González, F.; Loidi, J.; Moreno, J.C. Impacts on Plant Biodiversity. Impacts of Climatic Change in Spain; Cambio Climático: Impactos, Vulnerabilidad y Adaptación. Ministerio para la Transición Ecológica y el Reto Demográfico. Gobierno de España. 2005, pp. 179–242. Available online: https://www.miteco.gob.es/es/cambio-climatico/temas/impactos-vulnerabilidad-adaptacion/05_Impacts%20on%20plant%20biodiversity_ing_tcm30-178519.pdf (accessed on 26 July 2022).
- Cariñanos, P.; Ruiz-Peñuela, S.; Valle, A.M.; de la Guardia, C. Assessing pollination disservices of urban street-trees: The case of London-plane tree (Platanus x hispanica Mill. ex Münchh). Sci. Total Environ. 2020, 737, 139722. [Google Scholar] [CrossRef] [PubMed]
- Castroviejo, S.; Aedo, C.; Cirujano, S.; Laínz, M.; Montserrat, P.; Morales, R.; Muñoz Garmendia, F.; Navarro, C.; Paiva, J.; Soriano, C. (Eds.) Flora Ibérica 2. In Real Jardín Botánico; CSIC: Madrid, Spain, 1990. [Google Scholar]
- Cennamo, P.; Cafasso, D. Molecular markers as a tool for the identification of hybrid plane trees. Delpinoa 2002, 44, 89–94. [Google Scholar]
- McBride, J. The world’s urban forests. In History, Composition, Design, Function and Management. Future City; Springer: Cham, Switzerland, 2017; Volume 8. [Google Scholar]
- Pauleit, S.; Jones, N.; Garcia-Martin, G.; Garcia-Valdecantos, J.L.; Rivière, L.M.; Vidal-Beaudet, L.; Bodson, M.; Randrup, T.B. Tree establishment practice in towns and cities–results from a European survey. Urban For. Urban Green 2002, 1, 83–96. [Google Scholar] [CrossRef]
- Fernández-González, M.; Guedes, A.; Abreu, I.; Rodríguez-Rajo, F.J. Pla A_1 Aeroallergen Immunodetection Related to the Airborne Platanus Pollen Content. Sci. Total Environ. 2013, 463–464, 855–860. [Google Scholar] [CrossRef]
- Iglesias, I.; Rodríguez-Rajo, F.J.; Méndez, J. Behavior of Platanus hispanica Pollen, an Important Spring Aeroallergen in Northwestern Spain. J. Investig. Allergol. Clin. Immunol. 2007, 17, 145–156. [Google Scholar]
- Alcázar, P.; Cariñanos, P.; De Castro, C.; Guerra, F.; Moreno, C.; Domínguez-Vilches, E.; Galán, C. Airborne Plane-Tree (Platanus hispanica) Pollen Distribution in the City of Córdoba, South-Western Spain, and Possible Implications on Pollen Allergy. J. Investig. Allergol. Clin. Immunol. 2004, 14, 238–243. [Google Scholar]
- Sánchez-Reyes, E.; De La Cruz, D.R.; Sanchís-Merino, M.E.; Sánchez-Sánchez, J. First Results of Platanus Pollen Airborne Content in the Middle-West of the Iberian Peninsula. Aerobiologia 2009, 25, 209–215. [Google Scholar] [CrossRef]
- Nowak, M.; Szymanśka, A.; Grewling, Ł. Allergic Risk Zones of Plane Tree Pollen (Platanus Sp.) in Poznan. Postep. Derm. Alergol. 2012, 29, 156–160. [Google Scholar]
- Oteros, J.; Galán, C.; Alcázar, P.; Domínguez-Vilches, E. Quality Control in Bio-Monitoring Networks, Spanish Aerobiology Network. Sci. Total Environ. 2013, 443, 559–565. [Google Scholar] [CrossRef] [PubMed]
- Asher, M.I.; Weiland, S.K. The International Study of Asthma and Allergies in Childhood. Clin. Exp. Allergy 1998, 28, 52–66. [Google Scholar] [CrossRef]
- Nicolaou, N.; Siddique, N.; Custovic, A. Allergic Disease in Urban and Rural Populations: Increasing Prevalence with Increasing Urbanization. Allergy Eur. J. Allergy Clin. Immunol. 2005, 60, 1357–1360. [Google Scholar] [CrossRef] [PubMed]
- Bosch-Cano, F.; Bernard, N.; Sudre, B.; Gillet, F.; Thibaudon, M.; Richard, H.; Badot, P.M.; Ruffaldi, P. Human Exposure to Allergenic Pollens: A Comparison between Urban and Rural Areas. Environ. Res. 2011, 111, 619–625. [Google Scholar] [CrossRef]
- Subiza, J.; Cabrera, M.; Valdivieso, R.; Subiza, J.L.; Jerez, M.; Jimenez, J.A.; Narganes, M.J.; Subiza, E. Seasonal Asthma Caused by Airborne Platanus Pollen. Clin. Exp. Allergy 1994, 24, 1123–1129. [Google Scholar] [CrossRef]
- Varela, S.; Subiza, J.; Subiza, J.L.; Rodríguez, R.; García, B.; Jerez, M.; Jiménez, J.A.; Panzani, R. Platanus Pollen as an Important Cause of Pollinosis. J. Allergy Clin. Immunol. 1997, 100, 748–754. [Google Scholar] [CrossRef] [PubMed]
- D’Amato, G. Airborne Paucimicronic Allergen-Carrying Particles and Seasonal Respiratory Allergy. Allergy Eur. J. Allergy Clin. Immunol. 2001, 56, 1109–1111. [Google Scholar] [CrossRef]
- D’Amato, G. Effects of Climatic Changes and Urban Air Pollution on the Rising Trends of Respiratory Allergy and Asthma. Multidiscip. Respir. Med. 2011, 6, 28–37. [Google Scholar] [CrossRef]
- Fernández-González, M.; Ribeiro, H.; Pereira, J.R.S.; Rodríguez-Rajo, F.J.; Abreu, I. Assessment between Platanus Pollen and Pla a 1 Allergen in Two Cities of North-Western Iberian Peninsula. Aerobiologia 2019, 35, 463–475. [Google Scholar] [CrossRef]
- D’Amato, G.; Cecchi, L.; Bonini, S.; Nunes, C.; Annesi-Maesano, I.; Behrendt, H.; Liccardi, G.; Popov, T.; Van Cauwenberge, P. Allergenic Pollen and Pollen Allergy in Europe. Allergy Eur. J. Allergy Clin. Immunol. 2007, 62, 976–990. [Google Scholar] [CrossRef] [PubMed]
- Gonianakis, M.I.; Baritaki, M.A.; Neonakis, I.K.; Gonianakis, I.M.; Kypriotakis, Z.; Darivianaki, E.; Bouros, D.; Kontou-Filli, K. A 10-Year Aerobiological Study (1994–2003) in the Mediterranean Island of Crete, Greece: Trees, Aerobiologic Data, and Botanical and Clinical Correlations. Allergy Asthma Proc. 2006, 27, 371–377. [Google Scholar] [CrossRef] [PubMed]
- Álvarez-López, S.; Fernández-González, M.; González-Fernández, E.; Garrido, A.; Rodríguez-Rajo, J. Tree Allergen Pollen-Related Content as Pollution Source in the City of Ourense (NW Spain). Forests 2020, 11, 1129. [Google Scholar] [CrossRef]
- Rodríguez-Rajo, F.J.; Jato, V.; González-Parrado, Z.; Elvira-Rendueles, B.; Moreno-Grau, S.; Vega-Maray, A.; Fernández-González, D.; Asturias, J.A.; Suárez-Cervera, M. The Combination of Airborne Pollen and Allergen Quantification to Reliably Assess the Real Pollinosis Risk in Different Bioclimatic Areas. Aerobiologia 2011, 27, 1–12. [Google Scholar] [CrossRef]
- Asturias, J.A.; Ibarrola, I.; Bartolomé, B.; Ojeda, I.; Malet, A.; Martínez, A. Purification and Characterization of Pla a 1, a Major Allergen from Platanus acerifolia Pollen. Allergy Eur. J. Allergy Clin. Immunol. 2002, 57, 221–227. [Google Scholar] [CrossRef] [PubMed]
- Asturias, J.A.; Ibarrola, I.; Eraso, E.; Arilla, M.C.; Martínez, A. The Major Platanus acerifolia Pollen Allergen Pla a 1 Has Sequence Homology to Invertase Inhibitors. Clin. Exp. Allergy 2003, 33, 978–985. [Google Scholar] [CrossRef]
- Enrique, E.; Alonso, R.; Bartolomé, B.; San Miguel-Moncín, M.; Bartra, J.; Fernández-Parra, B.; Tella, R.; Asturias, J.A.; Ibarrola, I.; Martínez, A.; et al. IgE Reactivity to Profilin in Platanus acerifolia Pollen-Sensitized Subjects with Plant-Derived Food Allergy. J. Investig. Allergol. Clin. Immunol. 2004, 14, 335–342. [Google Scholar]
- Lauer, I.; Miguel-Moncin, M.S.; Abel, T.; Foetisch, K.; Hartz, C.; Fortunato, D.; Cistero-Bahima, A.; Vieths, S.; Scheurer, S. Identification of a Plane Pollen Lipid Transfer Protein (Pla a 3) and Its Immunological Relation to the Peach Lipid-Transfer Protein, Pru p 3. Clin. Exp. Allergy 2007, 37, 261–269. [Google Scholar] [CrossRef]
- Alcázar, P.; Galán, C.; Torres, C.; Domínguez-Vilches, E. Detection of Airborne Allergen (Pla a 1) in Relation to Platanus Pollen in Córdoba, South Spain. Ann. Agric. Environ. Med. 2015, 22, 96–101. [Google Scholar] [CrossRef]
- Sedghy, F.; Sankian, M.; Moghadam, M.; Ghasemi, Z.; Mahmoudi, M.; Varasteh, A.R. Impact of Traffic-Related Air Pollution on the Expression of Platanus Orientalis Pollen Allergens. Int. J. Biometeorol. 2017, 61, 1–9. [Google Scholar] [CrossRef]
- Fernández-González, D.; González-Parrado, Z.; Vega-Maray, A.M.; Valencia-Barrera, R.M.; Camazón-Izquierdo, B.; De Nuntiis, P.; Mandrioli, P. Platanus Pollen Allergen, Pla a 1: Quantification in the Atmosphere and Influence on a Sensitizing Population. Clin. Exp. Allergy 2010, 40, 1701–1708. [Google Scholar] [CrossRef] [PubMed]
- Miralles, J.C.; Caravaca, F.; Guillén, F.; Lombardero, M.; Negro, J.M. Cross-Reactivity between Platanus Pollen and Vegetables. Allergy Eur. J. Allergy Clin. Immunol. 2002, 57, 146–149. [Google Scholar] [CrossRef] [PubMed]
- Enrique, E.; Cisteró-Bahíma, A.; Bartolomé, B.; Alonso, R.; San Miguel-Moncín, M.M.; Bartra, J.; Martínez, A. Platanus acerifolia Pollinosis and Food Allergy. Allergy Eur. J. Allergy Clin. Immunol. 2002, 57, 351–356. [Google Scholar] [CrossRef]
- San Miguel-Moncín, M.; Krail, M.; Scheurer, S.; Enrique, E.; Alonso, R.; Conti, A.; Cisteró-Bahíma, A.; Vieths, S. Lettuce Anaphylaxis: Identification of a Lipid Transfer Protein as the Major Allergen. Allergy Eur. J. Allergy Clin. Immunol. 2003, 58, 511–517. [Google Scholar] [CrossRef]
- Bartra, J.; Sastre, J.; Del Cuvillo, A.; Montoro, J.; Jáuregui, I.; Dávila, I.; Ferrer, M.; Mullol, J.; Valero, A. From Pollinosis to Digestive Allergy. J. Investig. Allergol. Clin. Immunol. 2009, 19, 3–10. [Google Scholar] [CrossRef][Green Version]
- González-Parrado, Z.; Fernández-González, D.; Camazón, B.; Valencia-Barrera, R.M.; Vega-Maray, A.M.; Asturias, J.A.; Monsalve, R.I.; Mandrioli, P. Molecular Aerobiology—Plantago Allergen Pla l 1 in the Atmosphere. Ann. Agric. Environ. Med. 2014, 21, 282–289. [Google Scholar] [CrossRef][Green Version]
- Ziello, C.; Sparks, T.H.; Estrella, N.; Belmonte, J.; Bergmann, K.C.; Bucher, E.; Brighetti, M.A.; Damialis, A.; Detandt, M.; Galán, C.; et al. Changes to Airborne Pollen Counts across Europe. PLoS ONE 2012, 7, e34076. [Google Scholar] [CrossRef]
- Martínez-Cortizas, A.; Pérez-Alberti, A. Atlas Climático de Galicia; Xunta de Galicia: A Coruña, Spain, 1999; ISBN 8445326112. [Google Scholar]
- Hirst, J.M. An Automatic Volumetric Spore Trap. Ann. Appl. Biol. 1952, 39, 257–265. [Google Scholar] [CrossRef]
- Galán, C.; Cariñanos, P.; Alcázar, P.; Domínguez, E. Spanish Aerobiology Network (REA): Management and Quality Manual; University of Córdoba Publication Service: Córdoba, Spain, 2007; 61p. [Google Scholar]
- Galán, C.; Ariatti, A.; Bonini, M.; Clot, B.; Crouzy, B.; Dahl, A.; Fernandez-González, D.; Frenguelli, G.; Gehrig, R.; Isard, S.; et al. Recommended Terminology for Aerobiological Studies. Aerobiologia 2017, 33, 293–295. [Google Scholar] [CrossRef]
- Andersen, T.B. A Model to Predict the Beginning of the Pollen Season. Grana 1991, 30, 269–275. [Google Scholar] [CrossRef]
- Vara, A.; Fernández-González, M.; Aira, M.J.; Rodríguez-Rajo, F.J. Fraxinus Pollen and Allergen Concentrations in Ourense (South-Western Europe). Environ. Res. 2016, 147, 241–248. [Google Scholar] [CrossRef] [PubMed]
- Tegart, L.J.; Johnston, F.H.; Arriagada, N.B.; Workman, A.; Dickinson, J.L.; Green, B.J.; Jones, P.J. ‘Pollen potency’: The relationship between atmospheric pollen counts and allergen exposure. Aerobiologia 2021, 37, 825–841. [Google Scholar] [CrossRef]
- Takahashi, Y.; Ohashi, T.; Nagoya, T.; Sakaguchi, M.; Yasueda, H.; Nitta, H. Possibility of Real-Time Measurement of an Airborne Cryptomeria Japonica Pollen Allergen Based on the Principle of Surface Plasmon Resonance. Aerobiologia 2001, 17, 313–318. [Google Scholar] [CrossRef]
- Moreno-Grau, S.; Aira, M.J.; Elvira-Rendueles, B.; Fernández-González, M.; Fernández-González, D.; García-Sánchez, A.; Martínez-García, M.J.; Moreno, J.M.; Negral, L.; Vara, A.; et al. Assessment of the Olea Pollen and Its Major Allergen Ole e 1 Concentrations in the Bioearosol of Two Biogeographical Areas. Atmos. Environ. 2016, 145, 264–271. [Google Scholar] [CrossRef]
- Arilla, M.C.; González-Rioja, R.; Ibarrola, I.; Mir, A.; Monteseirín, J.; Conde, J.; Martínez, A.; Asturias, J.A. A Sensitive Monoclonal Antibody-Based Enzyme-Linked Immunosorbent Assay to Quantify Parietaria Judaica Major Allergens, Par j 1 and Par j 2. Clin. Exp. Allergy 2006, 36, 87–93. [Google Scholar] [CrossRef] [PubMed]
- Arilla, M.C.; Eraso, E.; Ibarrola, I.; Algorta, J.; Martínez, A.; Asturias, J.A. Monoclonal Antibody-Based Method for Measuring Olive Pollen Major Allergen Ole e 1. Ann. Allergy Asthma Immunol. 2002, 89, 83–89. [Google Scholar] [CrossRef]
- SEAIC (Sociedad Española de Alergología e Inmunología Clínica). Recuentos de Pólenes en España. Available online: https://www.polenes.com/home (accessed on 1 September 2022).
- R Core Team R: A Language and Environment for Statistical Computing; R Foundation for Statistical Computing: Viena, Austria, 2020.
- Maimon, O.; Rokach, L. Data Mining and Knowledge Discovery Handbook, 2nd ed.; Springer: Berlin/Heidelberg, Germany, 2010. [Google Scholar] [CrossRef]
- González-Fernández, E.; Álvarez-López, S.; Garrido, A.; Fernández-González, M.; Rodríguez-Rajo, F.J. Data Mining Assessment of Poaceae Pollen Influencing Factors and Its Environmental Implications. Sci. Total Environ. 2022, 815, 152874. [Google Scholar] [CrossRef] [PubMed]
- Maimon, O.; Rokach, L. Introduction to Supervised Methods. In Data Mining and Knowledge Discovery Handbook; Maimon, O., Rokach, L., Eds.; Springer: Boston, MA, USA, 2005. [Google Scholar] [CrossRef]
- Zhao, L.; Lee, S.; Jeong, S.P. Decision Tree Application to Classification Problems with Boosting Algorithm. Electronics 2021, 10, 1903. [Google Scholar] [CrossRef]
- Pang, S.-L.; Gong, J.-Z. C5.0 Classification Algorithm and Application on Individual Credit Evaluation of Banks. Syst. Eng. Theory Pract. 2009, 29, 94–104. [Google Scholar] [CrossRef]
- Cai, F.; Shao, C.; Zhang, Y.; Shi, G.; Bao, Z.; Bao, M.; Zhang, J. Two FD homologs from London plane (Platanus acerifolia) are associated with floral initiation and flower morphology. Plant Sci. 2021, 310, 110971. [Google Scholar] [CrossRef]
- Li, J.; Li, Y.C.; Zhang, Z.; Li, Y.; Wang, C.Y. The dispersion characteristics of airborne pollen in the Shijiazhuang (China) urban area and its relationship with meteorological factors. Aerobiologia 2018, 34, 89–104. [Google Scholar] [CrossRef]
- Adams-Groom, B.; Skjøth, C.A.; Baker, M.; Welch, T.E. Modelled and observed surface soil pollen deposition distance curves for isolated trees of Carpinus betulus, Cedrus atlantica, Juglans nigra and Platanus acerifolia. Aerobiologia 2017, 33, 407–416. [Google Scholar] [CrossRef]
- Siniscalco, C.; Caramiello, R.; Migliavacca, M.; Busetto, L.; Mercalli, L.; Colombo, R.; Richardson, A.D. Models to predict the start of the airborne pollen season. Int. J. Biometeorol. 2015, 59, 837–848. [Google Scholar] [CrossRef] [PubMed]
- Frenguelli, G.; Spieksma, F.T.M.; Bricchi, E.; Romano, B.; Mincigrucci, G.; Nikkels, A.H.; Dankaart, W.; Ferranti, F. The Influence of Air Temperature on the Starting Dates of the Pollen Season of Alnus and Populus. Grana 1991, 30, 196–200. [Google Scholar] [CrossRef]
- Galán, C.; García-Mozo, H.; Cariñanos, P.; Alcázar, P.; Domínguez-Vilches, E. The Role of Temperature in the Onset of the Olea Europaea L. Pollen Season in Southwestern Spain. Int. J. Biometeorol. 2001, 45, 8–12. [Google Scholar] [CrossRef] [PubMed]
- Tedeschini, E.; Rodríguez-Rajo, F.J.; Caramiello, R.; Jato, V.; Frenguelli, G. The Influence of Climate Changes in Platanus Spp. Pollination in Spain and Italy. Grana 2006, 45, 222–229. [Google Scholar] [CrossRef]
- Maya-Manzano, J.M.; Fernández-Rodríguez, S.; Monroy-Colín, A.; Silva-Palacios, I.; Tormo-Molina, R.; Gonzalo-Garijo, Á. Allergenic Pollen of Ornamental Plane Trees in a Mediterranean Environment and Urban Planning as a Prevention Tool. Urban For. Urban Green. 2017, 27, 352–362. [Google Scholar] [CrossRef]
- Bogawski, P.; Grewling, Ł.; Dziób, K.; Sobieraj, K.; Dalc, M.; Dylawerska, B.; Pupkowski, D.; Nalej, A.; Nowak, M.; Szymańska, A.; et al. Lidar-Derived Tree Crown Parameters: Are They New Variables Explaining Local Birch (Betula Sp.) Pollen Concentrations? Forests 2019, 10, 1154. [Google Scholar] [CrossRef]
- Ponchia, G.; Simeoni, S.; Zanin, G. Influence of Winter Pruning on Ornamental Plants Grown in Two Kinds of Container. Acta Hortic. 2010, 881, 581–584. [Google Scholar] [CrossRef]
- Lara, B.; Rojo, J.; Fernández-González, F.; Pérez-Badia, R. Prediction of Airborne Pollen Concentrations for the Plane Tree as a Tool for Evaluating Allergy Risk in Urban Green Areas. Landsc. Urban Plan. 2019, 189, 285–295. [Google Scholar] [CrossRef]
- Cariñanos, P.; Casares-Porcel, M.; de la Guardia, C.D.; Aira, M.J.; Belmonte, J.; Boi, M.; Elvira-Rendueles, B.; De Linares, C.; Fernández-Rodriguez, S.; Maya-Manzano, J.M.; et al. Assessing Allergenicity in Urban Parks: A Nature-Based Solution to Reduce the Impact on Public Health. Environ. Res. 2017, 155, 219–227. [Google Scholar] [CrossRef] [PubMed]
- Jianan, X.; Zhiyun, O.; Hua, Z.; Xiaoke, W.; Hong, M. Allergenic Pollen Plants and Their Influential Factors in Urban Areas. Acta Ecol. Sin. 2007, 27, 3820–3827. [Google Scholar] [CrossRef]
- Masullo, M.; Mariotta, S.; Torrelli, L.; Graziani, E.; Anticoli, S.; Mannino, F. Respiratory Allergy to Parietaria Pollen in 348 Subjects. Allergol. Immunopathol. 1996, 24, 3–6. [Google Scholar]
- Marks, G.B.; Colquhoun, J.R.; Girgis, S.T.; Hjelmroos Koski, M.; Treloar, A.B.A.; Hansen, P.; Downs, S.H.; Car, N.G. Thunderstorm Outflows Preceding Epidemics of Asthma during Spring and Summer. Thorax 2001, 56, 468–471. [Google Scholar] [CrossRef]
- Pulimood, T.B.; Corden, J.M.; Bryden, C.; Sharples, L.; Nasser, S.M. Epidemic Asthma and the Role of the Fungal Mold Alternaria Alternata. J. Allergy Clin. Immunol. 2007, 120, 610–617. [Google Scholar] [CrossRef]
- Knox, R.B.; Suphioglu, C.; Taylor, P.; Desai, R.; Watson, H.C.; Peng, J.L.; Bursill, L.A. Major Grass Pollen Allergen Lol p 1 Binds to Diesel Axhaust Particles: Implications for Asthma and Air Pollution. Clin. Exp. Allergy 1997, 27, 246–251. [Google Scholar] [CrossRef]
- Solomon, W.R.; Burge, H.A.; Muilenberg, M.L. Allergen Carriage by Atmospheric Aerosol. I. Ragweed Pollen Determinants in Smaller Micronic Fractions. J. Allergy Clin. Immunol. 1983, 72, 443–447. [Google Scholar] [CrossRef]
- De Weerd, N.A.; Bhalla, P.L.; Singh, M.B. Aeroallergens and Pollinosis: Molecular and Immunological Characteristics of Cloned Pollen Allergens. Aerobiologia 2002, 18, 87–106. [Google Scholar] [CrossRef]
- Rodríguez-Rajo, F.J.; Fdez-Sevilla, D.; Stach, A.; Jato, V. Assessment between Pollen Seasons in Areas with Different Urbanization Level Related to Local Vegetation Sources and Differences in Allergen Exposure. Aerobiologia 2010, 26, 1–14. [Google Scholar] [CrossRef]
- Cabrera, M.; Martínez-Cócera, C.; Fernández-Caldas, E.; Carnés Sánchez, J.; Boluda, L.; Tejada, J.; Subiza, J.L.; Subiza, J.; Jerez, M. Trisetum Paniceum (Wild Oats) Pollen Counts and Aeroallergens in the Ambient Air of Madrid, Spain. Int. Arch. Allergy Immunol. 2002, 128, 123–129. [Google Scholar] [CrossRef]
- Rantio-Lehtimaki, A.; Viander, M.; Koivikko, A. Airborne Birch Pollen Antigens in Different Particle Sizes. Clin. Exp. Allergy 1994, 24, 23–28. [Google Scholar] [CrossRef] [PubMed]
- Moreno-Grau, S.; Elvira-Rendueles, B.; Moreno, J.; García-Sánchez, A.; Vergara, N.; Asturias, J.A.; Arilla, M.C.; Ibarrola, I.; Seoane-Camba, J.A.; Suárez-Cervera, M. Correlation between Olea Europaea and Parietaria Judaica Pollen Counts and Quantification of Their Major Allergens Ole e 1 and Par j 1-Par j 2. Ann. Allergy, Asthma Immunol. 2006, 96, 858–864. [Google Scholar] [CrossRef] [PubMed]
- Fernández-González, D.; Rodríguez-Rajo, F.J.; González-Parrado, Z.; Valencia-Barrera, R.M.; Jato, V.; Moreno-Grau, S. Differences in Atmospheric Emissions of Poaceae Pollen and Lol p 1 Allergen. Aerobiologia 2011, 27, 301–309. [Google Scholar] [CrossRef]
- de Weger, L.A.; Bergmann, K.C.; Rantio-Lehtimäki, A.; Dahl, Å.; Buters, J.; Déchamp, C.; Belmonte, J.; Thibaudon, M.; Cecchi, L.; Besancenot, J.P.; et al. Impact of Pollen. In Allergenic Pollen; Sofiev, M., Bergmann, K.C., Eds.; Springer: Dordrecht, Germany, 2013; pp. 161–215. [Google Scholar]
- Lee, S.W.; Yon, D.K.; James, C.C.; Lee, S.; Koh, H.Y.; Sheen, Y.H.; Han, M.Y.; Sugihara, G. Short-term effects of multiple outdoor environmental factors on risk of asthma exacerbations: Age-stratified time-series analysis. J. Allergy Clin. Immunol. 2019, 144, 1542–1550. [Google Scholar] [CrossRef] [PubMed]
- Steckling-Muschack, N.; Mertes, H.; Mittermeier, I.; Schutzmeier, P.; Becker, J.; Bergmann, K.-C.; Böse-O’reilly, S.; Buters, J.; Damialis, A.; Heinrich, J.; et al. A systematic review of threshold values of pollen concentrations for symptoms of allergy. Aerobiologia 2021, 37, 395–424. [Google Scholar] [CrossRef]
- Faber, M.A.; Van Gasse, A.L.; Decuyper, I.I.; Sabato, V.; Hagendorens, M.M.; Mertens, C.; Bridts, C.H.; De Clerck, L.S.; Ebo, D.G. Cross-Reactive Aeroallergens: Which Need to Cross Our Mind in Food Allergy Diagnosis? J. Allergy Clin. Immunol. Pract. 2018, 6, 1813–1823. [Google Scholar] [CrossRef] [PubMed]
- Skypala, I.J.; Asero, R.; Barber, D.; Cecchi, L.; Diaz Perales, A.; Hoffmann-Sommergruber, K.; Pastorello, E.A.; Swoboda, I.; Bartra, J.; Ebo, D.G.; et al. Non-Specific Lipid-Transfer Proteins: Allergen Structure and Function, Cross-Reactivity, Sensitization, and Epidemiology. Clin. Transl. Allergy 2021, 11, e12010. [Google Scholar] [CrossRef]
- Suárez-Cervera, M.; Asturias, J.A.; Vega-Maray, A.; Castells, T.; López-Iglesias, C.; Ibarrola, I.; Arilla, M.C.; Gabarayeva, N.; Seoane-Camba, J.A. The Role of Allergenic Proteins Pla a 1 and Pla a 2 in the Germination of Platanus Acerifolia Pollen Grains. Sex. Plant Reprod. 2005, 18, 101–112. [Google Scholar] [CrossRef]
- Valero, A.L.; Rosell, E.; Amat, P.; Sancho, J.; Roig, J.; Piulats, J.; Malet, A. Hipersensibilidad a Polen de Platanus Acerifolia: Deteccion de Las Fracciones Alergenicas. Alergol. Immunol. Clin. 1999, 14, 220–226. [Google Scholar]
- Cecchi, L.; D’Amato, G.; Ayres, J.G.; Galan, C.; Forastiere, F.; Forsberg, B.; Gerritsen, J.; Nunes, C.; Behrendt, H.; Akdis, C.; et al. Projections of the Effects of Climate Change on Allergic Asthma: The Contribution of Aerobiology. Allergy Eur. J. Allergy Clin. Immunol. 2010, 65, 1073–1081. [Google Scholar] [CrossRef]
- Levetin, E.; Van de Water, P. Changing Pollen Types/Concentrations/Distribution in the United States: Fact or Fiction? Curr. Allergy Asthma Rep. 2008, 8, 418–424. [Google Scholar] [CrossRef] [PubMed]
- Cecchi, L.; D’Amato, G.; Annesi-Maesano, I. Climate Change and Outdoor Aeroallergens Related to Allergy and Asthma: Taking the Exposome into Account. Allergy Eur. J. Allergy Clin. Immunol. 2020, 75, 2361–2363. [Google Scholar] [CrossRef] [PubMed]
- Qiu, T.; Song, C.; Zhang, Y.; Liu, H.; Vose, J.M. Urbanization and climate change jointly shift land surface phenology in the northern mid-latitude large cities. Remote Sens. Environ. 2020, 236, 111477. [Google Scholar] [CrossRef]
- Li, X.; Zhou, Y.; Meng, L.; Asrar, G.; Sapkota, A.; Coates, F. Characterizing the relationship between satellite phenology and pollen season: A case study of birch. Remote Sens. Environ. 2019, 222, 267–274. [Google Scholar] [CrossRef]
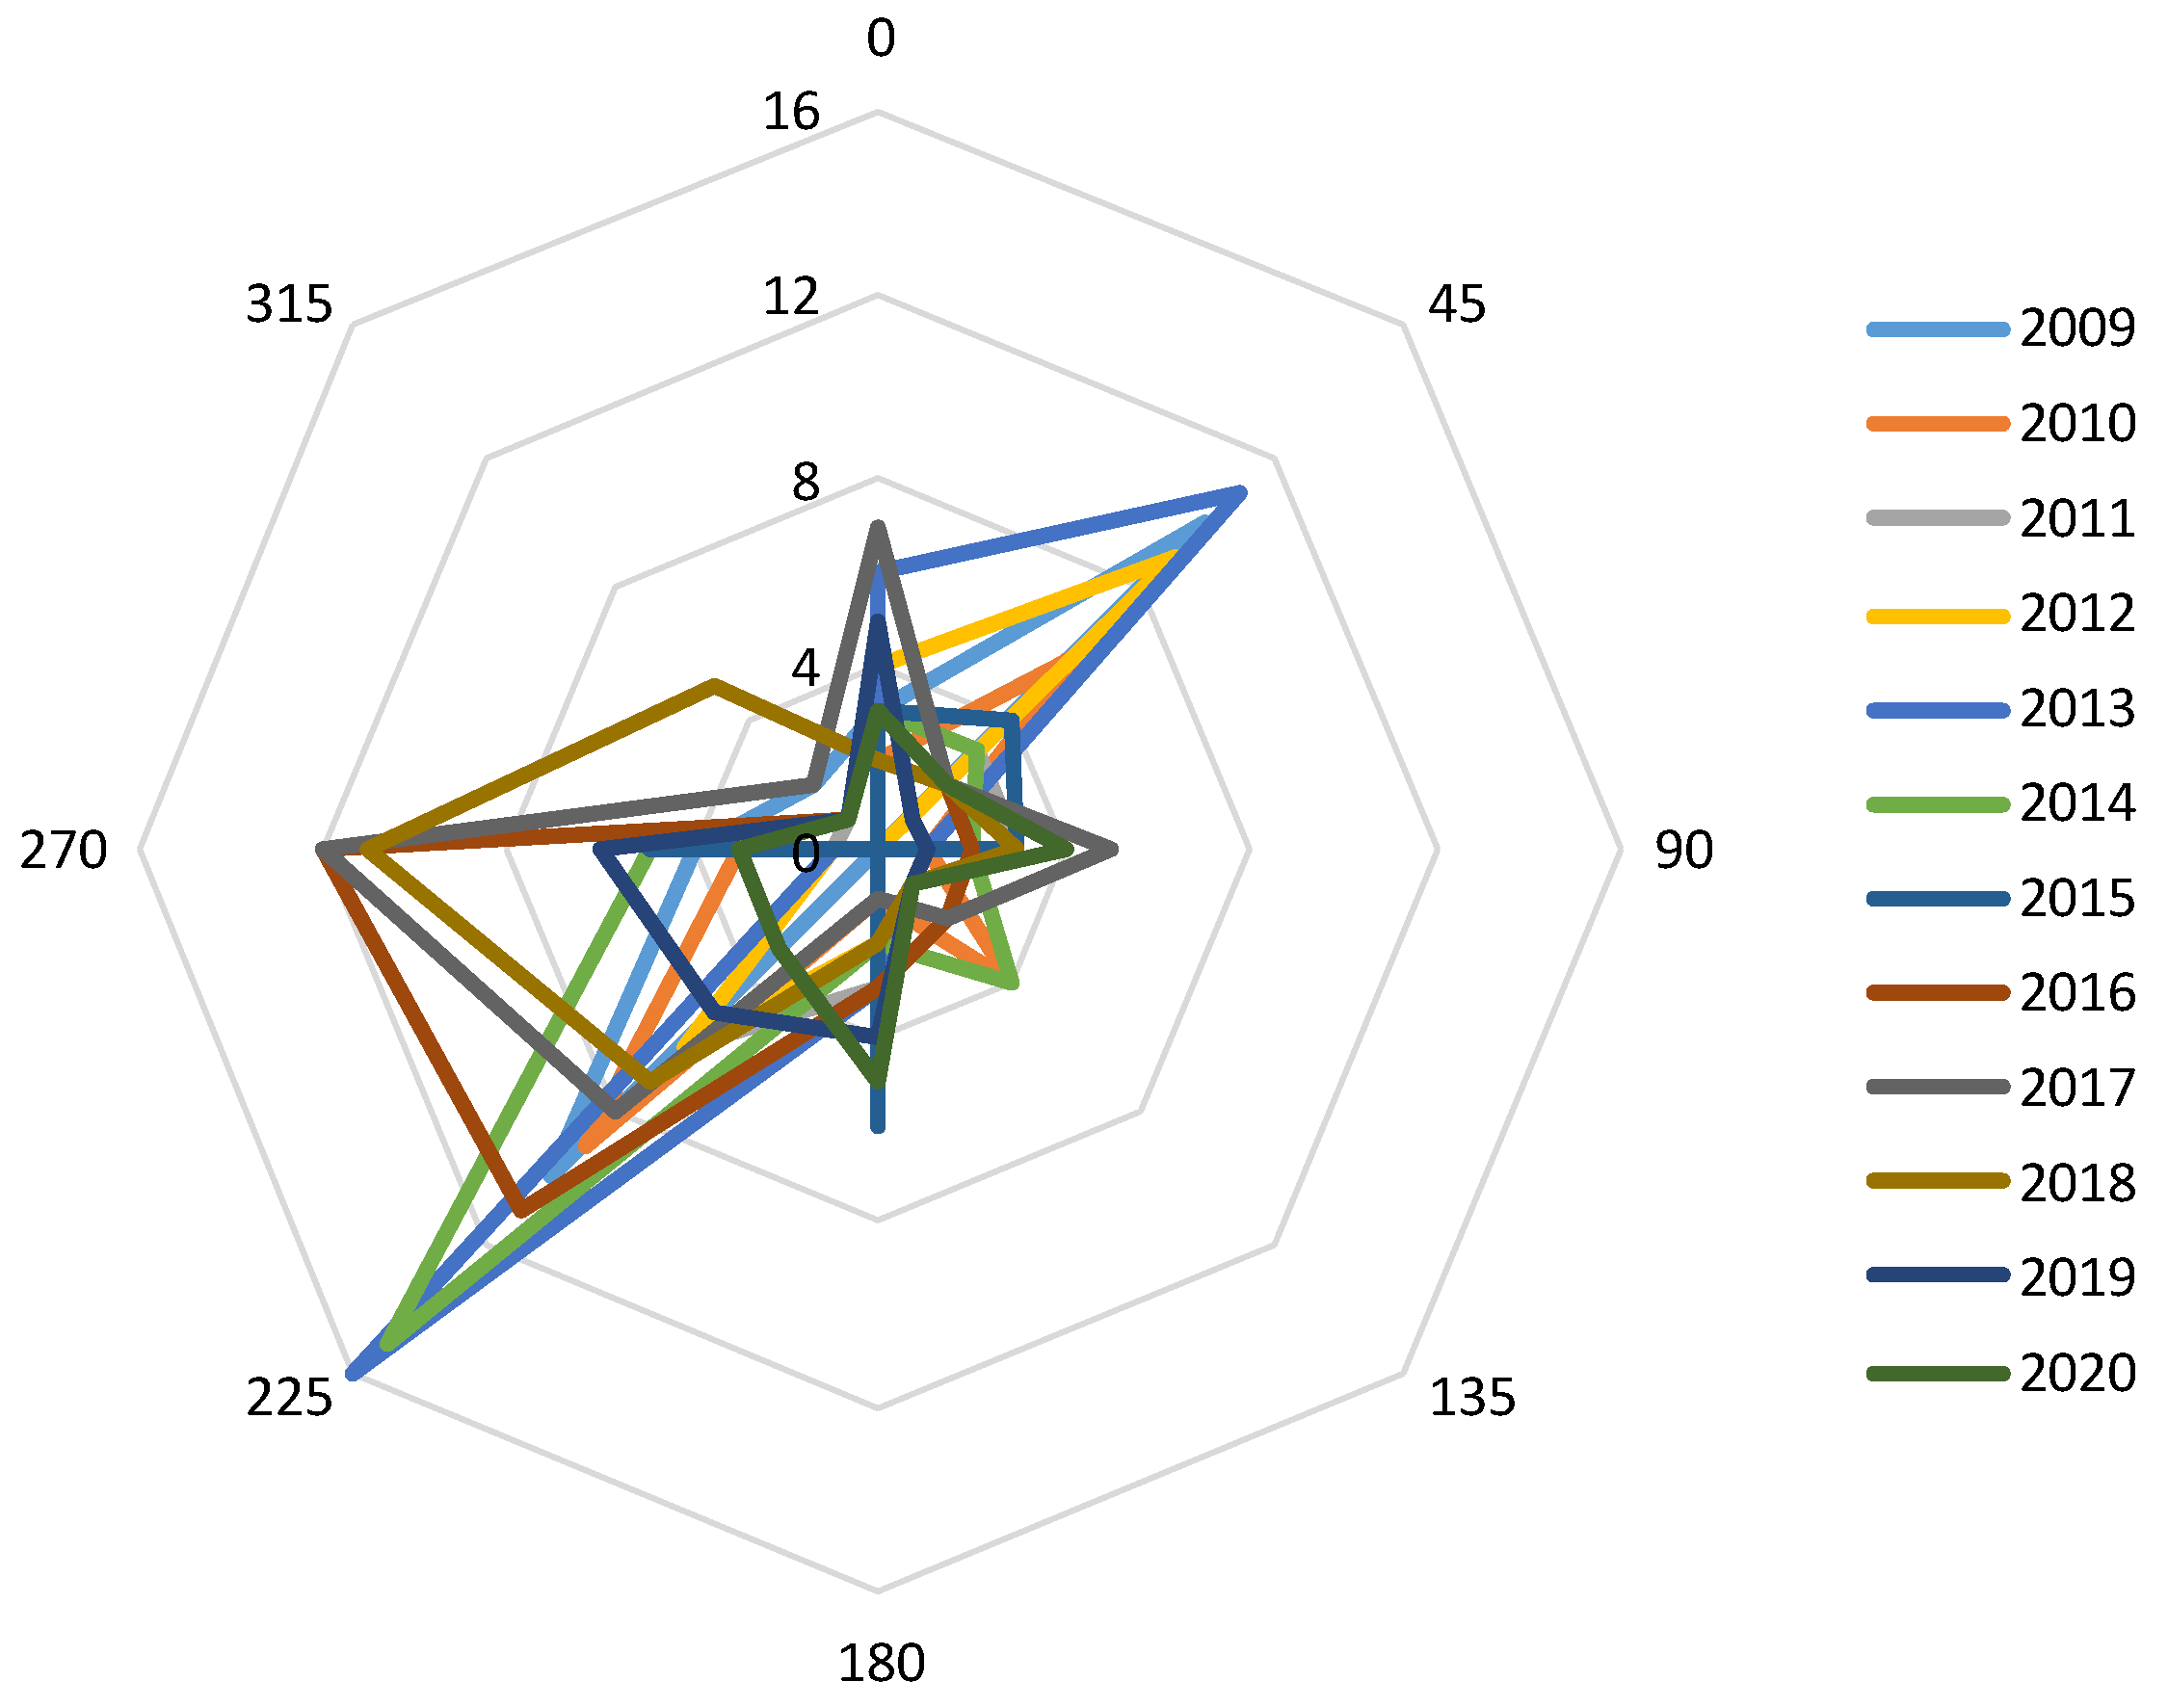
- Damialis, A.; Gioulekas, D.; Lazopoulou, C.; Balafoutis, C.; Vokou, D. Transport of airborne pollen into the city of Thessaloniki: The effects of wind direction, speed and persistence. Int. J. Biometeorol. 2005, 49, 139–145. [Google Scholar] [CrossRef]
- Aira, M.J.; Rodríguez-Rajo, F.J.; Fernández-González, M.; Jato, V. Airborne Pollen of Ornamental Tree Species in the NW of Spain. Environ. Monit. Assess. 2011, 173, 765–775. [Google Scholar] [CrossRef] [PubMed]
- Dąbrowska-Zapart, K.; Chłopek, K.; Niedźwiedź, T. The Impact of Meteorological Conditions on the Concentration of Alder Pollen in Sosnowiec (Poland) in the Years 1997–2017. Aerobiologia 2018, 34, 469–485. [Google Scholar] [CrossRef] [PubMed]
- Ziska, L.H.; Makra, L.; Harry, S.K.; Bruffaerts, N.; Hendrickx, M.; Coates, F.; Saarto, A.; Thibaudon, M.; Oliver, G.; Damialis, A.; et al. Temperature-Related Changes in Airborne Allergenic Pollen Abundance and Seasonality across the Northern Hemisphere: A Retrospective Data Analysis. Lancet Planet. Health 2019, 3, e124–e131. [Google Scholar] [CrossRef]
- IPCC. Calentamiento Global de 1.5 °C; IPCC: New York, NY, USA, 2019; ISBN 9789291693511. [Google Scholar]
- Chuine, I.; Cour, P.; Rousseau, D.D. Selecting Models to Predict the Timing of Flowering of Temperate Trees: Implications for Tree Phenology Modelling. Plant Cell Environ. 1999, 22, 1–13. [Google Scholar] [CrossRef]
- Ruiz-Valenzuela, L.; Aguilera, F. Trends in Airborne Pollen and Pollen-Season-Related Features of Anemophilous Species in Jaen (South Spain): A 23-Year Perspective. Atmos. Environ. 2018, 180, 234–243. [Google Scholar] [CrossRef]


| 2009 | 2010 | 2011 | 2012 | 2013 | 2014 | 2015 | 2016 | 2017 | 2018 | 2019 | 2020 | 2009–2020 | |
|---|---|---|---|---|---|---|---|---|---|---|---|---|---|
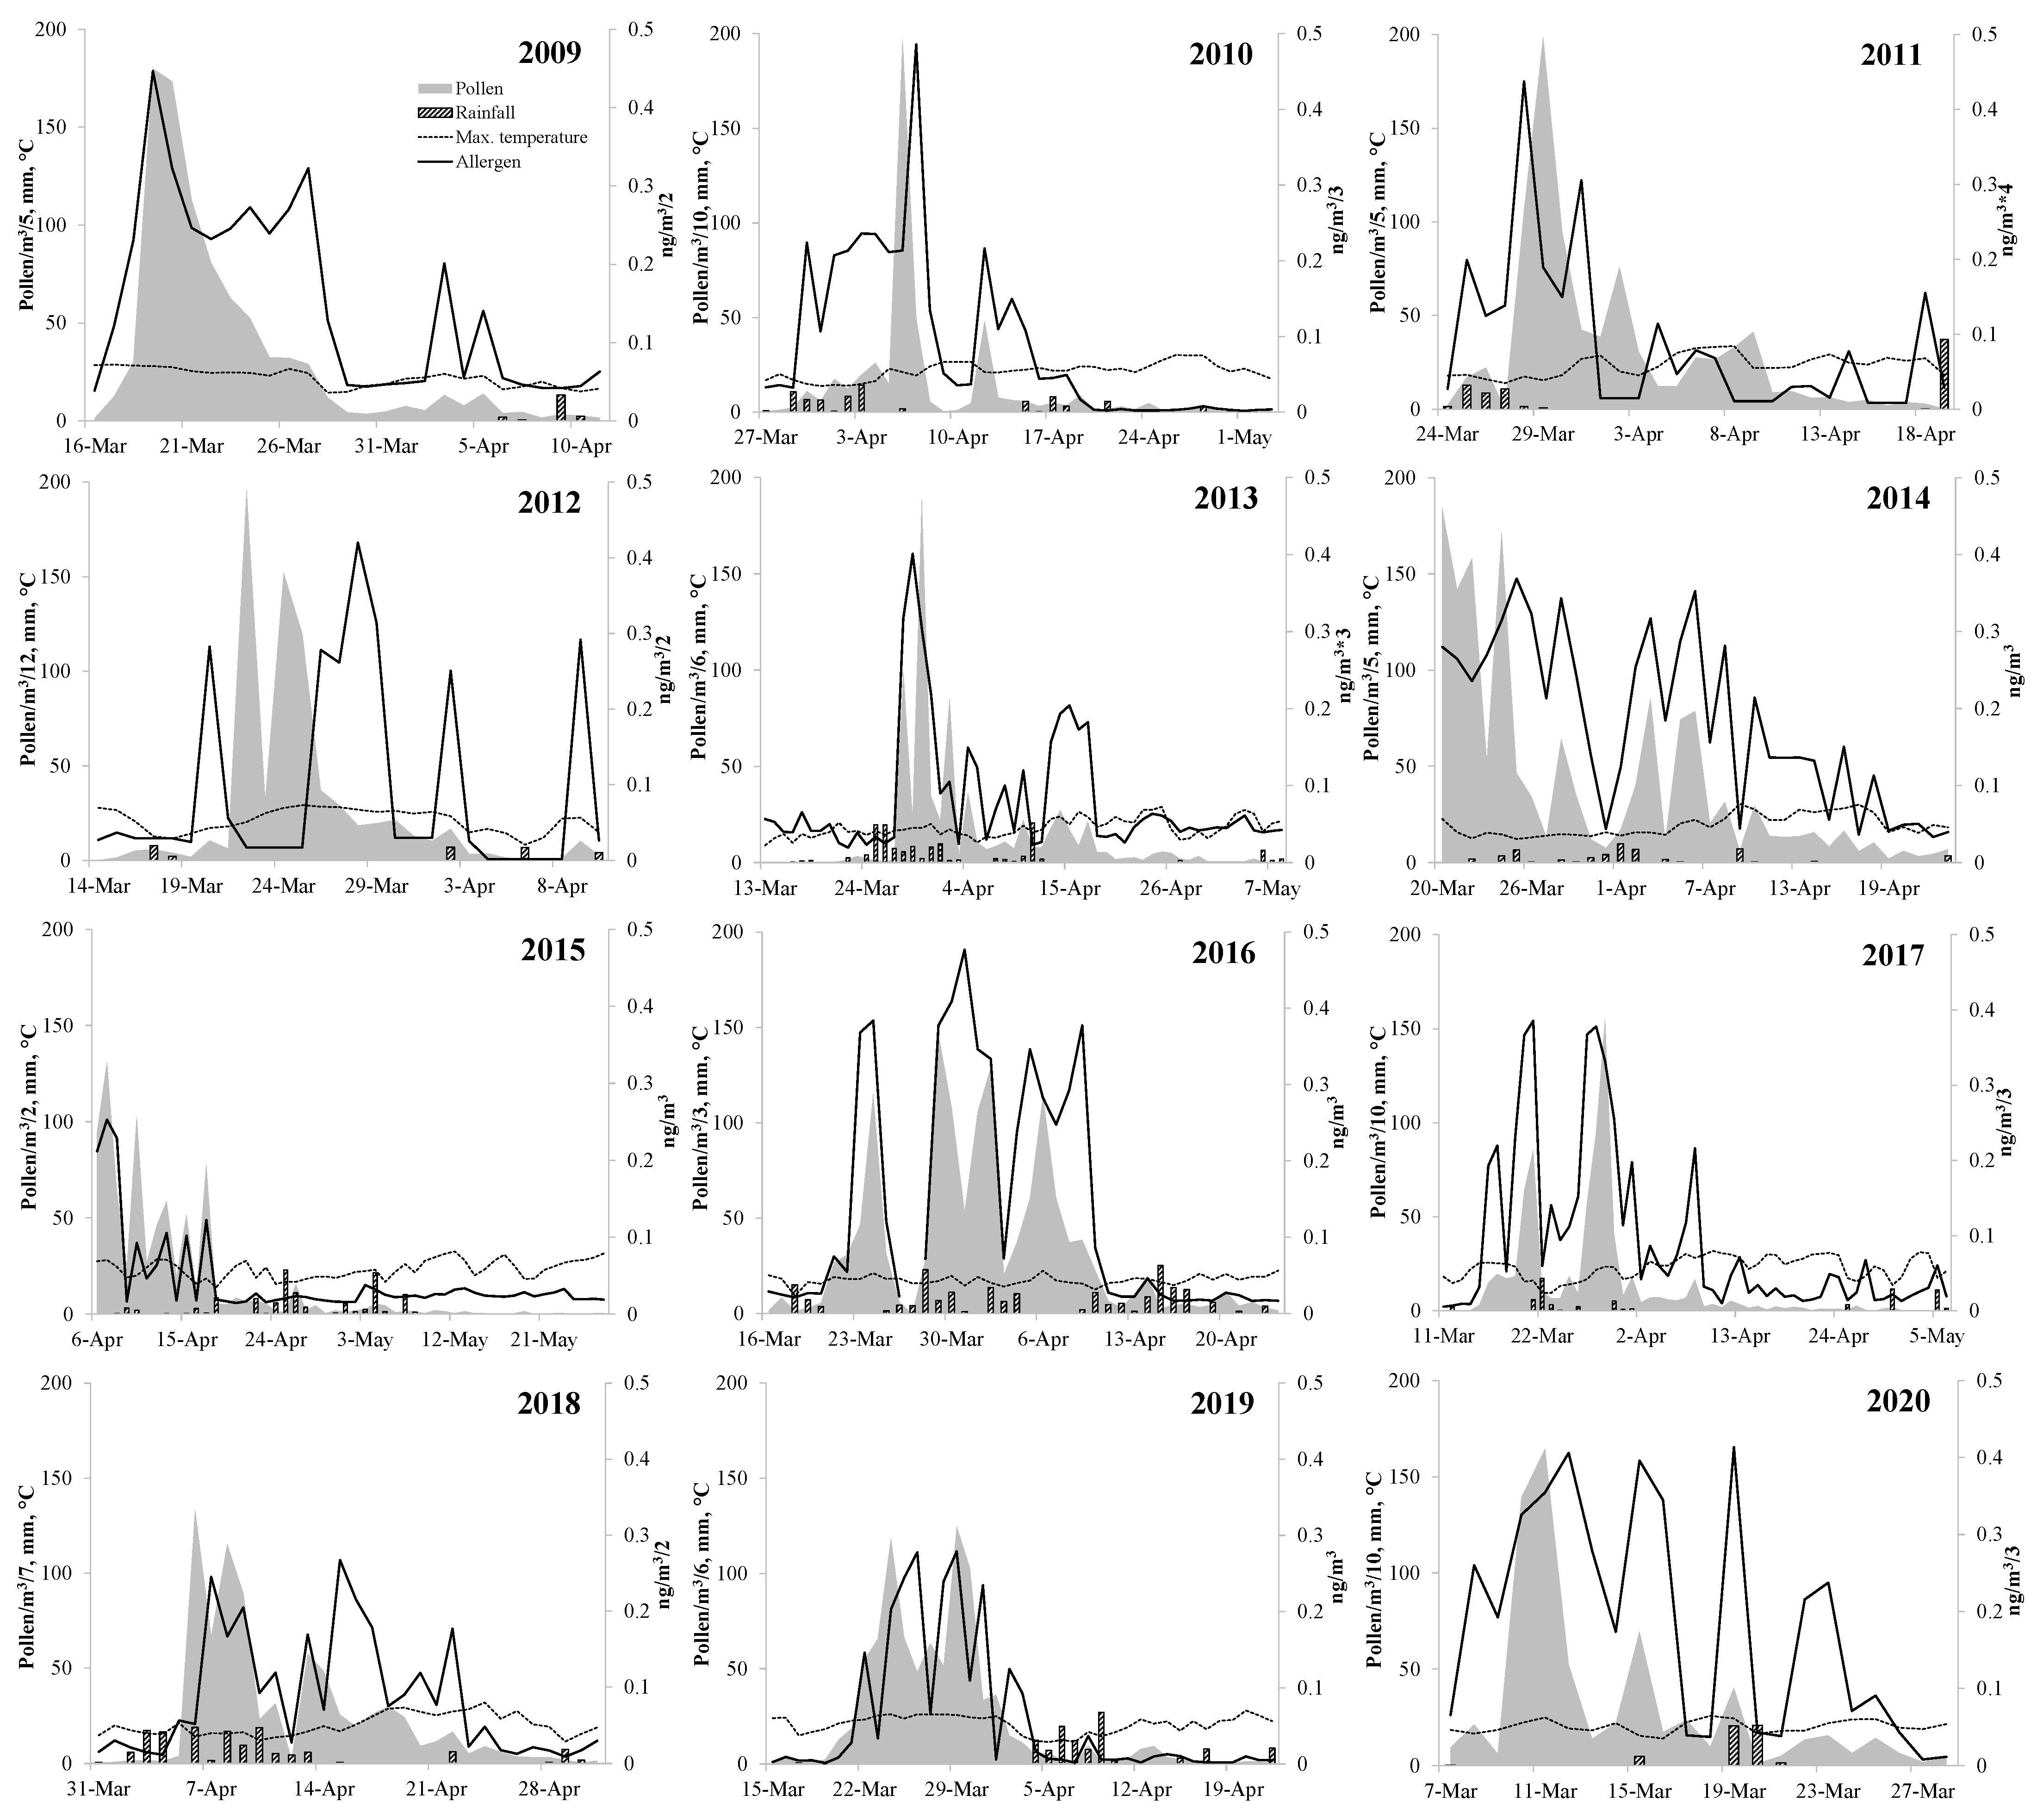
| Start (day) | 18-Mar | 30-Mar | 25-Mar | 19-Mar | 28-Mar | 20-Mar | 28-Mar | 21-Mar | 16-Mar | 6-Apr | 21-Mar | 7-Mar | 22-Mar |
| End (day) | 14-Apr | 24-Apr | 14-Apr | 9-Apr | 5-May | 23-Apr | 17-Apr | 24-Apr | 20-Apr | 8-May | 13-Apr | 28-Mar | 19-Apr |
| Length (days) | 28 | 26 | 21 | 22 | 39 | 35 | 21 | 35 | 36 | 33 | 24 | 22 | 29 |
| APIn (pollen) | 4401 | 4664 | 4069 | 8452 | 4252 | 7160 | 9848 | 3909 | 7290 | 5399 | 5128 | 6552 | 5927 |
| Mean (pollen/m3) | 157 | 179 | 203 | 384 | 109 | 205 | 469 | 115 | 203 | 164 | 214 | 298 | 225 |
| Peak (pollen/m3) | 900 | 1970 | 992 | 2347 | 1138 | 921 | 2323 | 438 | 1549 | 932 | 747 | 1644 | 1325 |
| Peak date (day) | 19-Mar | 6-Apr | 29-Mar | 22-Mar | 30-Mar | 20-Mar | 30-Mar | 29-Mar | 29-Mar | 6-Apr | 29-Mar | 11-Mar | 26-Mar |
| Allergen (ng) | 7.765 | 9.437 | 0.521 | 4.791 | 1.293 | 6.365 | 3.361 | 5.300 | 13.927 | 5.170 | 2.180 | 12.125 | 6.020 |
| Mean (ng/m3) | 0.311 | 0.363 | 0.025 | 0.218 | 0.033 | 0.182 | 0.160 | 0.156 | 0.387 | 0.157 | 0.091 | 0.551 | 0.219 |
| Peak (ng/m3) | 0.893 | 1.458 | 0.109 | 0.840 | 0.134 | 0.369 | 0.277 | 0.477 | 1.157 | 0.535 | 0.279 | 1.239 | 0.647 |
| Peak date (day) | 19-Mar | 7-Apr | 28-Mar | 28-Mar | 29-Mar | 25-Mar | 2-Apr | 30-Mar | 21-Mar | 15-Apr | 29-Mar | 19-Mar | 28-Mar |
| PAP (ng/pollen) | 0.0018 | 0.0020 | 0.0001 | 0.0006 | 0.0003 | 0.0009 | 0.0003 | 0.0014 | 0.0019 | 0.0010 | 0.0004 | 0.0019 | 0.0010 |
| Thresholds (Pollen/m3) | Thresholds (ng/m3) | ||||||
|---|---|---|---|---|---|---|---|
| moderate | high | moderate | high | ||||
| 51–130 | >130 | 0.279–0.463 | >0.463 | ||||
| Risk (days) | |||||||
| Pollen | Allergen | Pollen and allergen | Total days | ||||
| moderate | high | moderate | high | moderate | high | ||
| 2009 | 3 | 10 | 3 | 9 | 6 | 19 | 25 |
| 2010 | 8 | 7 | 5 | 9 | 13 | 16 | 29 |
| 2011 | 4 | 11 | 0 | 0 | 4 | 11 | 15 |
| 2012 | 4 | 11 | 0 | 7 | 4 | 18 | 22 |
| 2013 | 9 | 7 | 0 | 0 | 9 | 7 | 16 |
| 2014 | 11 | 15 | 9 | 0 | 20 | 15 | 35 |
| 2015 | 5 | 13 | 0 | 0 | 5 | 13 | 18 |
| 2016 | 10 | 10 | 10 | 1 | 20 | 11 | 31 |
| 2017 | 11 | 13 | 6 | 11 | 17 | 24 | 41 |
| 2018 | 4 | 13 | 6 | 2 | 10 | 15 | 25 |
| 2019 | 5 | 11 | 1 | 0 | 6 | 11 | 17 |
| 2020 | 5 | 13 | 0 | 12 | 5 | 25 | 30 |
| Average 2009–2020 | 7 | 11 | 3 | 4 | 10 | 15 | 25 |
| Observed Class | |||
|---|---|---|---|
| high-allergen | moderate-allergen | ||
| Predicted Class | high-allergen | Correctly classified | Misclassified |
| high allergen cases | cases | ||
| 141 | 100 | ||
| moderate-allergen | Misclassified | Correctly classified | |
| cases | moderate allergen cases | ||
| 13 | 84 | ||
Publisher’s Note: MDPI stays neutral with regard to jurisdictional claims in published maps and institutional affiliations. |
© 2022 by the authors. Licensee MDPI, Basel, Switzerland. This article is an open access article distributed under the terms and conditions of the Creative Commons Attribution (CC BY) license (https://creativecommons.org/licenses/by/4.0/).
Share and Cite
Álvarez-López, S.; Fernández-González, M.; Sánchez Espinosa, K.C.; Amigo, R.; Rodríguez-Rajo, F.J. London Plane Tree Pollen and Pla A 1 Allergen Concentrations Assessment in Urban Environments. Forests 2022, 13, 2089. https://doi.org/10.3390/f13122089
Álvarez-López S, Fernández-González M, Sánchez Espinosa KC, Amigo R, Rodríguez-Rajo FJ. London Plane Tree Pollen and Pla A 1 Allergen Concentrations Assessment in Urban Environments. Forests. 2022; 13(12):2089. https://doi.org/10.3390/f13122089
Chicago/Turabian StyleÁlvarez-López, Sabela, María Fernández-González, Kenia Caridad Sánchez Espinosa, Rubén Amigo, and Francisco Javier Rodríguez-Rajo. 2022. "London Plane Tree Pollen and Pla A 1 Allergen Concentrations Assessment in Urban Environments" Forests 13, no. 12: 2089. https://doi.org/10.3390/f13122089
APA StyleÁlvarez-López, S., Fernández-González, M., Sánchez Espinosa, K. C., Amigo, R., & Rodríguez-Rajo, F. J. (2022). London Plane Tree Pollen and Pla A 1 Allergen Concentrations Assessment in Urban Environments. Forests, 13(12), 2089. https://doi.org/10.3390/f13122089