Article

Application and Accuracy of Unmanned Aerial Survey Imagery after Salvage Logging in Different Terrain Conditions

1
Department of Forest Engineering, Faculty of Forestry and Wood Technology, University of Zagreb, Svetošimunska cesta 23, 10000 Zagreb, Croatia
2
Department of Forest Protection and Wildlife Management, Faculty of Forestry and Wood Technology, University of Zagreb, Svetošimunska cesta 23, 10000 Zagreb, Croatia
*
Authors to whom correspondence should be addressed.
Forests 2022, 13(12), 2054; https://doi.org/10.3390/f13122054
Submission received: 21 September 2022 / Revised: 7 November 2022 / Accepted: 30 November 2022 / Published: 2 December 2022
(This article belongs to the Section Forest Operations and Engineering)

Abstract

:
The accuracy of the positioning of the data collected by remote sensing platforms is of great importance in forest and wildlife surveys, salvage logging, soil disturbances after felling operations, fire risk management and many other forestry-based research. The significance of bark beetles in silver fir and Norway spruce stands is an essential factor that can affect the increase in biomass quantity and the reduction of its quality. Due to an Ips typographus (L.) outbreaks in the central part of Croatia from 2016 to 2021, salvage logging was performed in an area of 11,940 ha, with terrain slopes varying from 0 to 172.83%. Two plots of similar sizes (<5 ha) and different terrain conditions (flat vs. sloped terrain) were chosen and were measured in June 2022. Measurements included a total station, a real-time kinematic (RTK) GNSS (Global Navigation Satellite System) terrestrial receiver and an unmanned aerial system (UAS) in order to determine the accuracy of a digital terrain model (DEM) generated by a photogrammetric UAS. In total, 175 checkpoints were marked in the field. Four different GCP (Ground Control Point) classes (5, 10, 15 and 20) were used to compare validation points acquired from the original point clouds, imagery and orthophotos to the reference positions. This study showed that, in terms of a forest area recognition after conducted salvage logging, the use of 10 GCPs for terrain evaluation is necessary even in small areas below 5 ha and regardless of terrain slope.

1. Introduction

Silver fir (Abies alba Mill.) and Norway spruce (Picea abies (L.) H Karsten) together amount to 11.8% of the total growing stock of Croatia and are, at the same time, the most common conifer tree species. Both species prevail in the forests of Gorski Kotar and Lika, which represent a significant ecological base for the most forested areas of the Republic of Croatia [1]. The damage caused by the effects of climate extremes (windstorms, heavy wet snow, ice storms etc.) leads to the outbreak of bark beetles which, as secondary pests, have favourable conditions for their development and a sudden increase in population [2]. Of the total volume of Norway spruce on the national level, 80% of the timber volume is in the highest DBH (Diameter-at Breast-Height) class, which is at the same time a high age for Norway spruce and a sign that these spruce forests are old and physiologically weak [3]. The significance of bark beetles in silver fir and Norway spruce stands is an essential factor that can affect the increase in biomass quantity and the reduction of its quality. Ips typographus (L.) is the most dangerous insect in European coniferous forests [4]. The main host of the spruce bark beetle is Norway spruce, the most common conifer of northern Europe and mountainous areas of central, southern and Western Europe [5]. Tomljanović et al. [6] state that forest disturbances such as bark beetles, windstorms or snowstorms directly affect the regeneration, biodiversity and productivity of the stands.
Mapping forest areas affected by natural disasters is a challenging and time-consuming task with high risks. Remote sensing is used on such occasions to provide valuable information on surface conditions. The use of unmanned aerial systems (UAS) enables fast and accurate data in forest and wildlife surveys [7,8,9,10,11], salvage logging [12,13], soil disturbances after felling operations [14,15] and fire risk management [16]. Mokroš et al. [13] state that the use of the global navigation satellite systems (GNSS) and remote sensing techniques seem to be suitable for the early-stage estimation of the extent of the disturbance. Miller et al. [17] report that satellite technology has advanced significantly, but legal limitations in using commercial satellite imagery and UAVs bring restrictions in scientific research.
Quality assurance of survey-grade global positioning is often overlooked or not understood and perceived uncertainties can be misleading [18]. The commercially available GNSS and multi-sensors integrated navigation systems are mainly focused on loose and tight integration strategies [19] where dense forest canopy and difficult terrain conditions bring more challenges during surveys. Mostly, 2–3 GCPs are considered a minimum (depending on the processing software in use), and some software tutorials [20,21,22] even state that 5–10 GCPs are usually enough even for large projects. Still, the same tutorials highlight that, if the topography of the area is complex, more GCPs will lead to more accurate reconstruction. On the other hand, some authors report that using GCPs is time-consuming and expensive. Therefore, they propose direct georeferencing without the need for any GCPs [23,24,25].
This study aims to evaluate the accuracy of a digital terrain model (DEM) generated by a photogrammetric UAS using a high-quality control, i.e., a total station and a GNSS-RTK device in a cut-block area after salvage logging, enforced by a bark-beetle outbreak. In addition, the purpose of this study is to show the possibility of using an engineering surveying method, i.e., a total station in forest research, a method that is rarely used in forestry surveys and with a distance measurement accuracy of a standard mode prism 2 mm + 2 ppm. The influence of the number of GCPs was investigated in the context of two different terrains, and the applicability of terrestrial measurements for determining the size of the salvage logging area.

2. Materials and Methods

2.1. Study Area

The study areas (Figure 1) are located in Gorski Kotar, Croatia, Plot 1, Sunger (φ 45°20′28″ N and 45°20′16″ N and λ 14°47′00″ E and 14°47′24″ E); and Plot 2, Carevići (φ 45°25′14′’ N and 45°25′12″ N and λ 15°00′03″ E and 15°00′14″ E).
The salvage logging in these two plots was performed in 2017 after a bark-beetle outbreak which, in the period from 2016 to 2021, affected 11,939.93 ha in the Gorski, Kotar, area and resulted in 262,927 m3 of cut timber in salvage logging. Due to an Ips typographus outbreak, a total of 3595 m3 of Norway spruce was cut in the study area which consists of two plots. The area of Plot 1 (Sunger) amounts to 4.549 ha, with a range of terrain slopes between 0.04%–2.47%, and a mean value of 1.32 ± 0.47%, while the area of Plot 2 (Carevići) is 3.057 ha, with a range of terrain slopes between 0.71%–46.93%, and a mean value of 17.52 ± 7.93%. Similar in size and tree species composition, these two plots differ in terrain characteristics, where Plot 1 is flat (771–775 m.a.s.l.—meters above sea level) and Plot 2 undulating (469–514 m.a.s.l.).

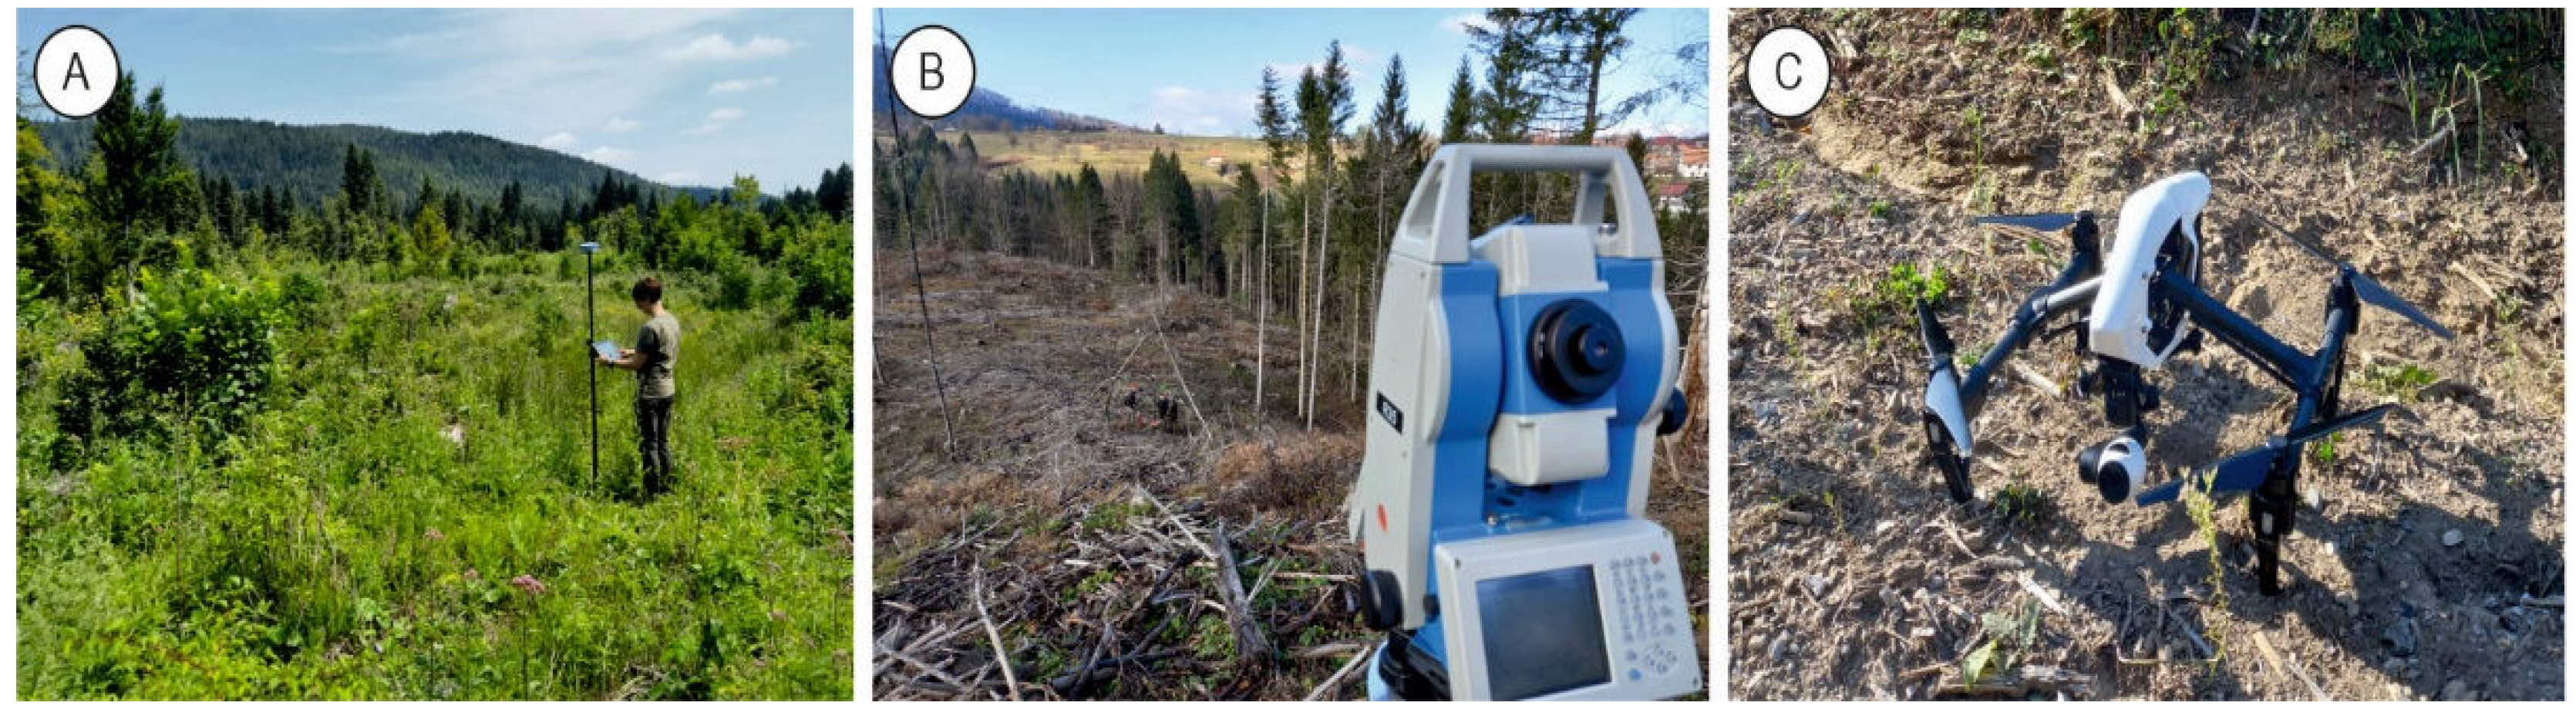
2.2. Used Equipment and Softvare

The measurements were made in June 2022 with a total station STONEX TS R35 WINCE, an RTK GNSS STONEX S900A terrestrial receiver and a UAS DJI Inspire 1 V2.0 (Figure 2), whose characteristics are shown in Table 1. The GCP and validation points were designed in orange cross-shaped cca 50 × 50 cm targets marked on the ground with an orange tree-marker spray. The coordinates of 175 GCP and validation points were measured using the GNSS-RTK device, and in order to increase the accuracy of the measurement, the occupy point (physical point where the total station is setup) and the backsight point (point that determines heading in a survey) were recorded by the arithmetic mean of three 10-s independent measurements [26]. The total station was used with a varying prism height of 2.0.–4.6 m depending on the visibility in the terrain. The differential correction data were gained using a real-time connection with the Croatian real-time positioning service, CROPOS. CROPOS has a declared accuracy of ±2 cm [27]. A total of 5, 10, 15 and 20 ground control points (GCPs) were established for the UAS accuracy evaluation on both plots. GCPs were used solely for the georeferencing and were not used in the final accuracy analysis with validation points [28]. A DJI Inspire 1 V2 UAV (unmanned aerial vehicle) with activated GLONAS+GPS technology was used. This is a rotary wing aircraft (quadcopter) controlled by a ground remote control. The aircraft was equipped with a Zenmuse X3 camera which is mounted on a 3-axis gimbal. This 20 mm (35 mm format equivalent; f/2.8) camera has a 12 MP sensor and can provide a ground sample distance (GSD) of 3.0 cm/pixel at the 70 m AGL flight altitude. The shutter speed of the camera can vary from 8-1/8000 s. For flight programming, the DJI GS Pro app was used. The shooting angle was parallel to the main path and a hover & capture mode at point methodology was used. The front and side overlap was 80% where the camera was at an angle of 90° according to the field. For photogrammetric work (point clouds, 3D models and orthophoto maps), Pix4D mapper was used. Altogether, 454 aerial images for Plot 1 and 373 images for Plot 2 were captured for processing.

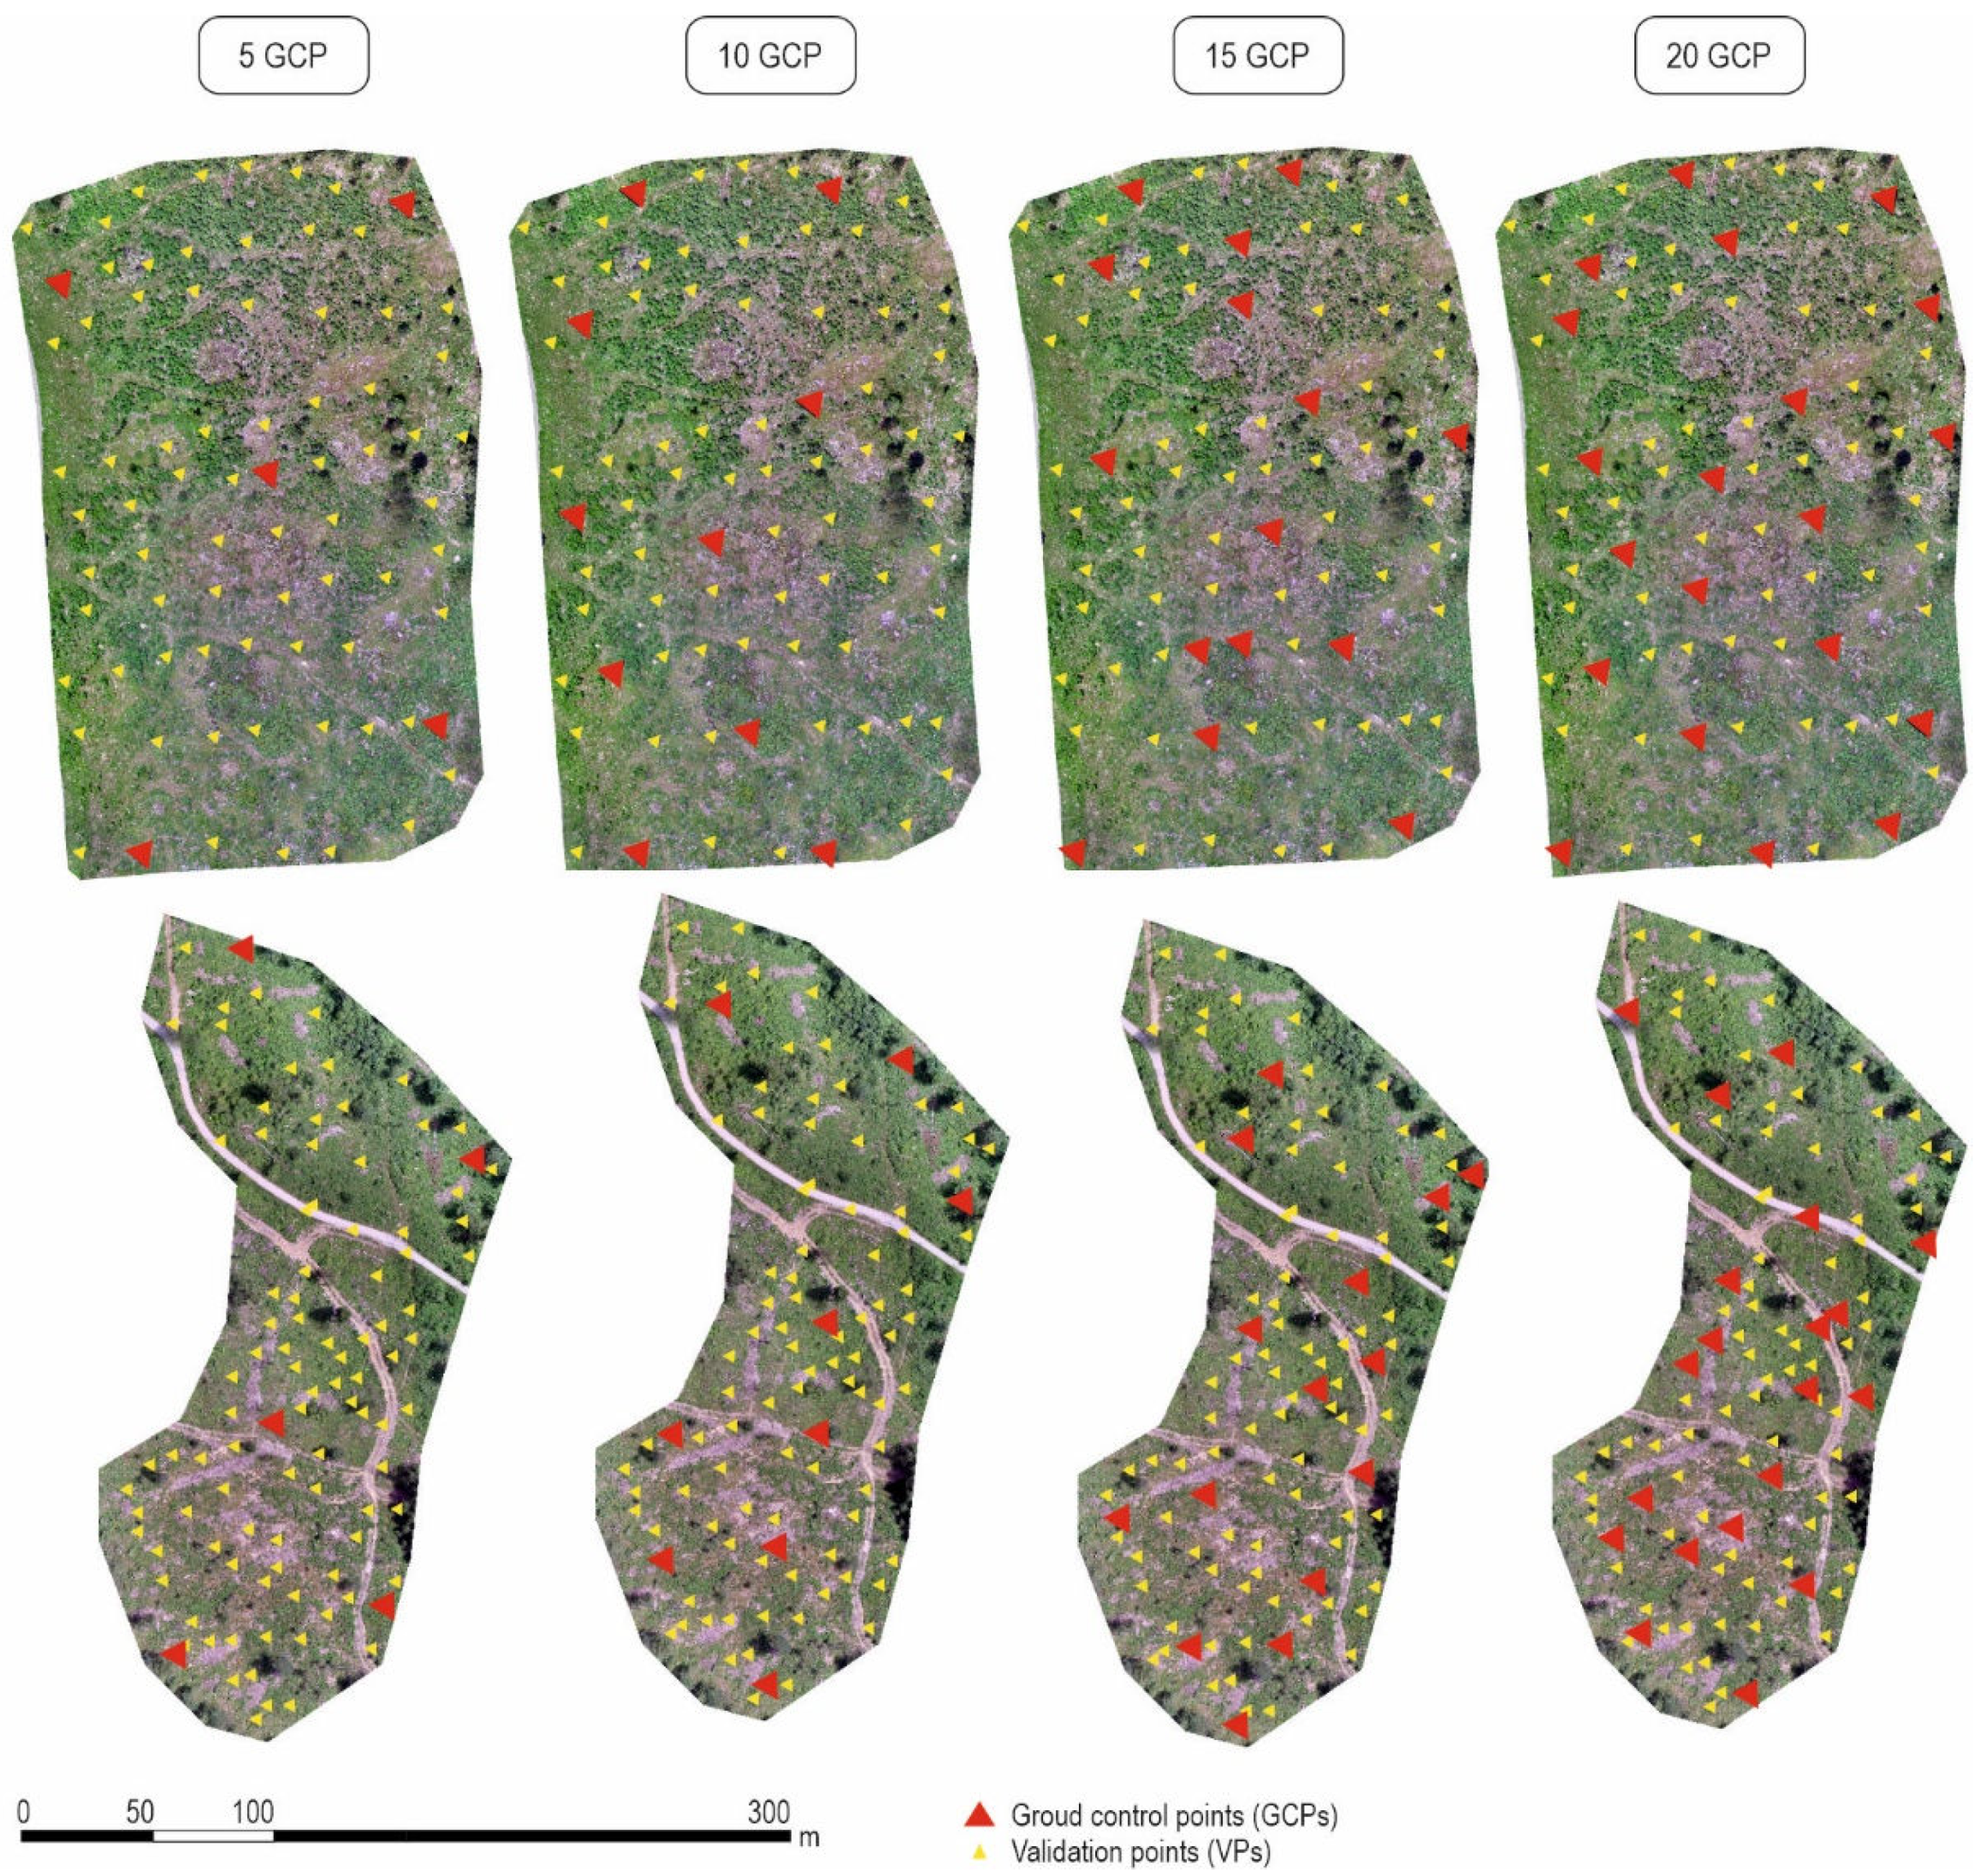
2.3. Evaluation Methods
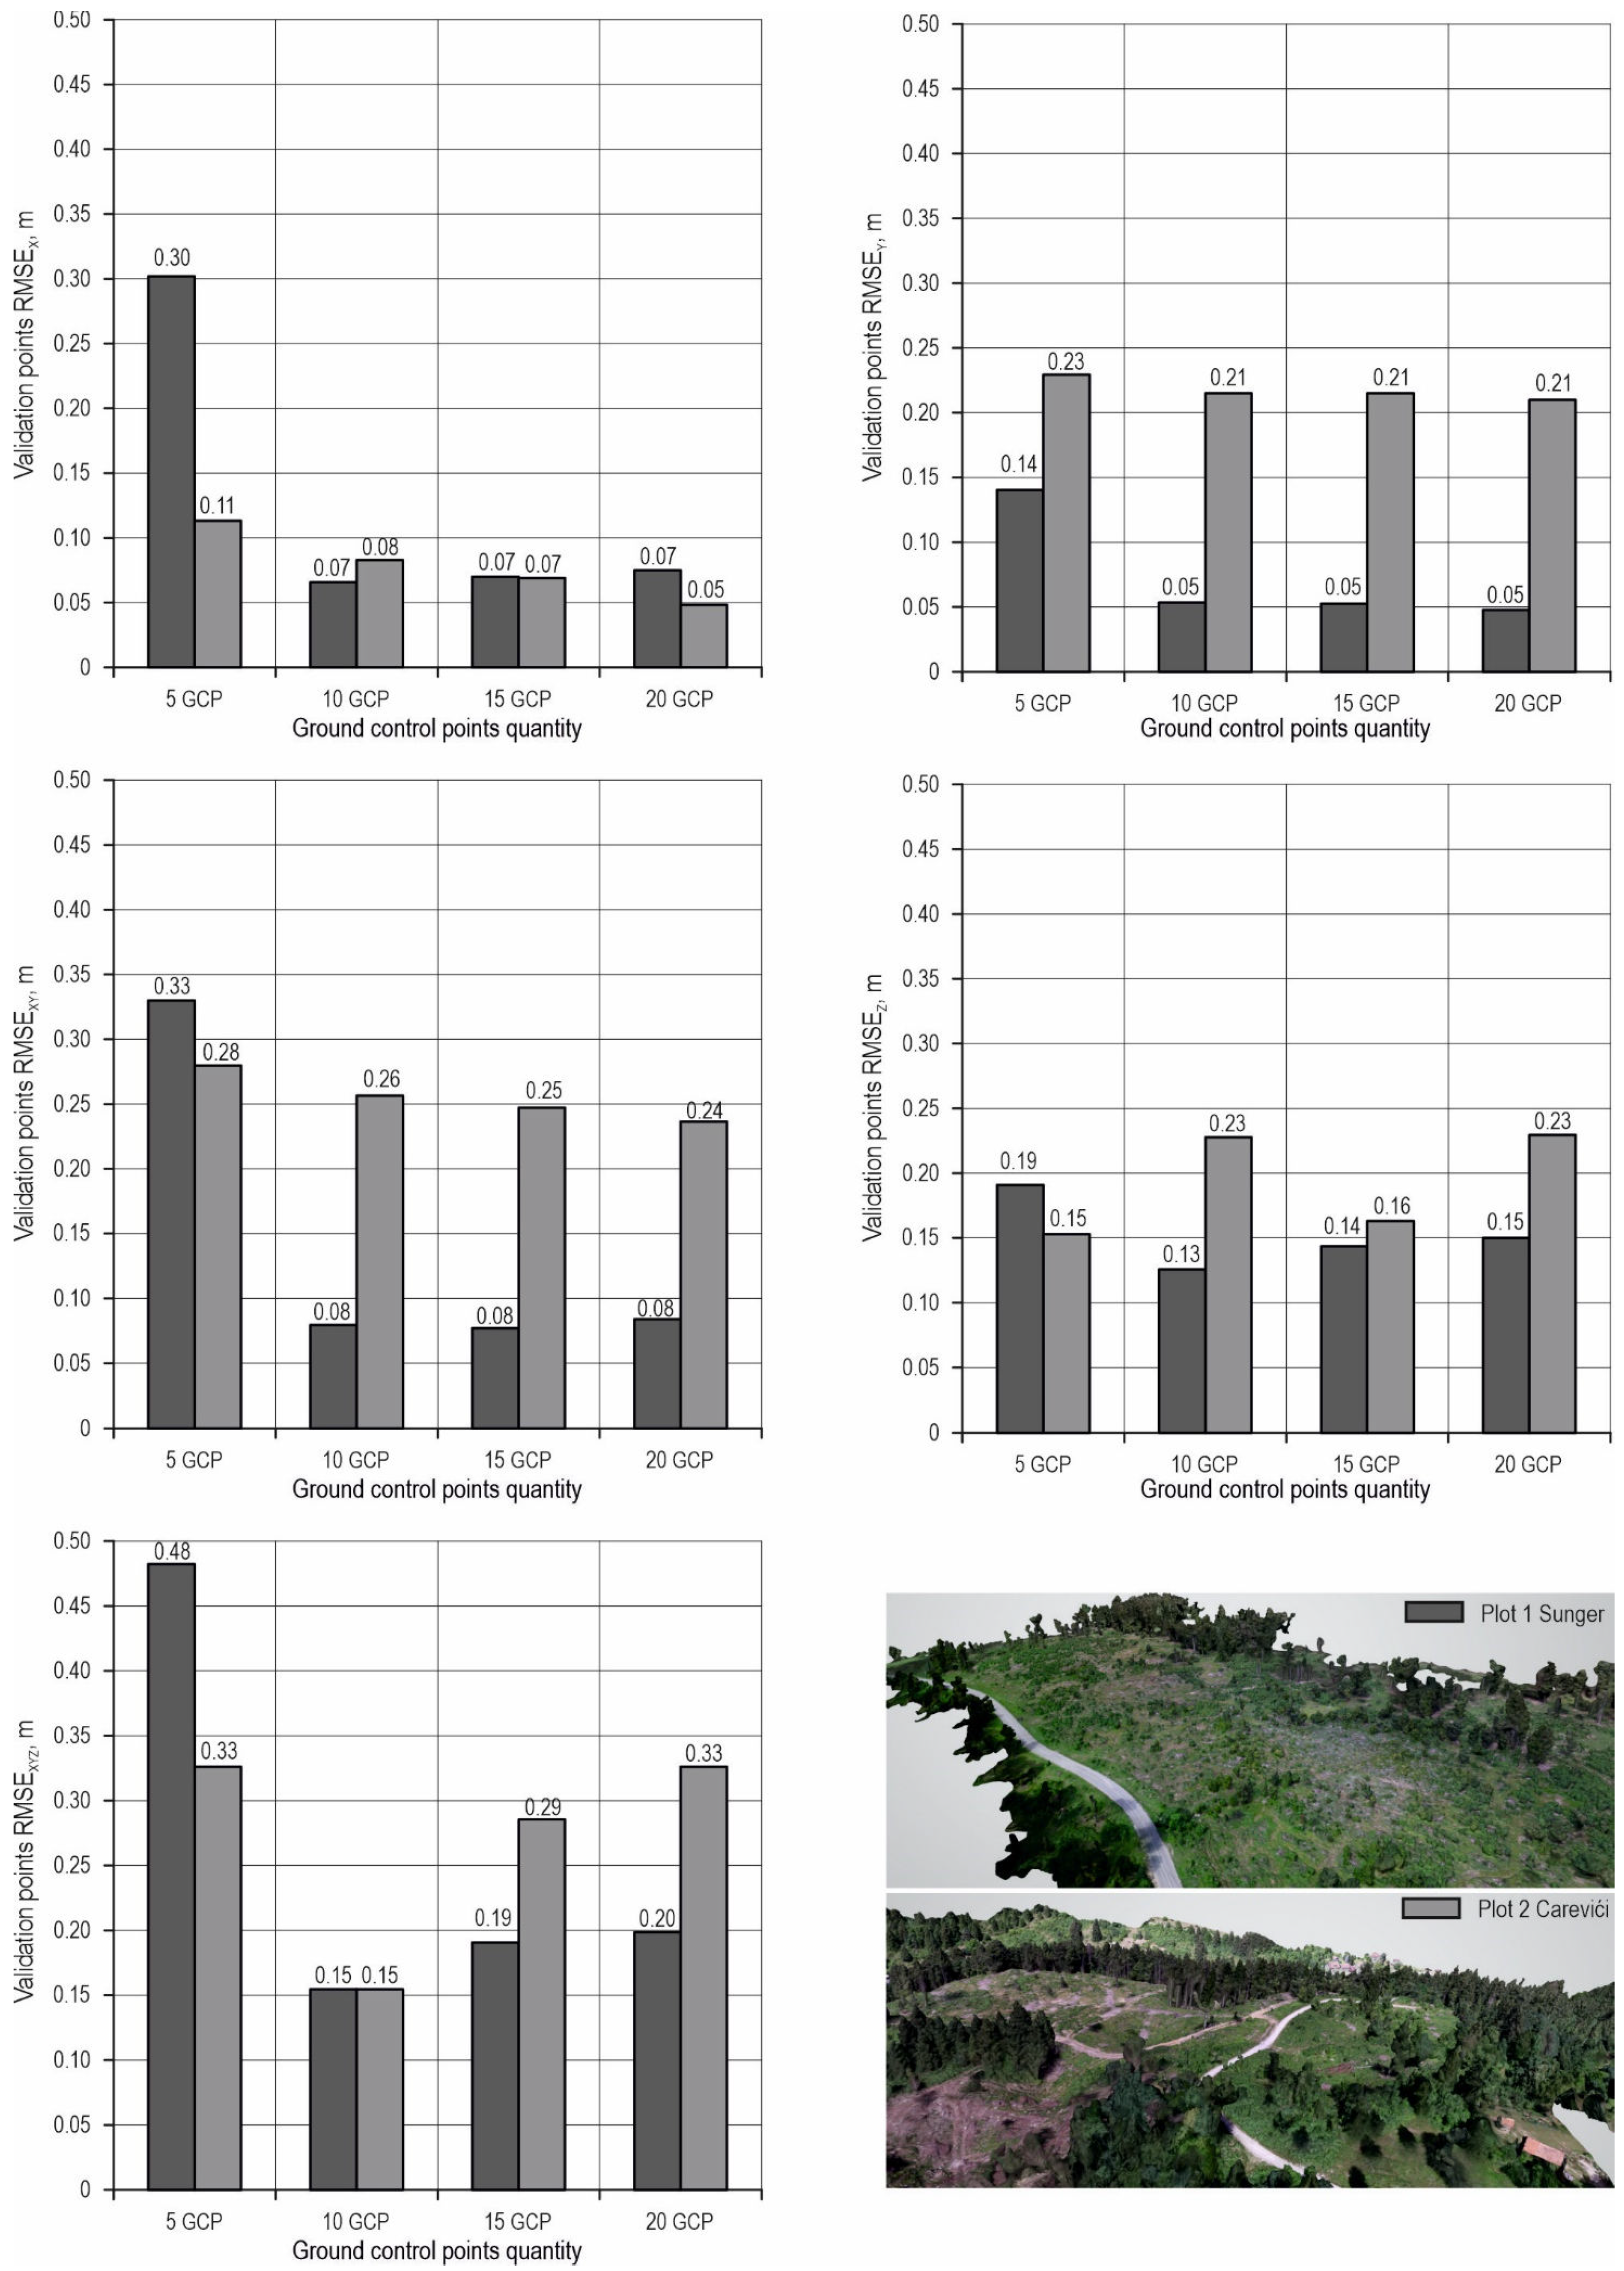
The goal of this study was to investigate the accuracy of a DEM generated by a photogrammetric UAS in two different cut-block areas after salvage logging, enforced by an Ips typographus outbreak. The evaluation of point cloud and orthomosaics accuracy was performed using 71, 66, 61 and 56 validation points on Plot 1, depending on the number of the used GCPs and 94, 89, 84 and 79 validation points on Plot 2, also varying due to a different number of GCPs in each analysis. After using each set of randomly chosen GCPs, i.e., 5, 10, 15 and 20, the accuracy of dense point clouds was evaluated using ArcGIS 10.1 and QGIS 3.16 software. Points were identified as centres of orange crosses (Figure 3). x and y coordinates were gained using identification that resulted in point shape file layers, while z coordinates were assigned using 2D coordinates and a DEM raster.
Four GCP configuration classes in the UAS image processing were used (Figure 4). Each configuration represents a different number of used GCPs and a different location in the UAS image processing.
The root mean square error was calculated for the coordinates of validation points gained from the orthophotos, point clouds and original imagery [28,29,30,31].
R M S E x = i = 1 n Δ x i 2 n
R M S E y = i = 1 n Δ y i 2 n
R M S E z = i = 1 n Δ z i 2 n
where Δxi, Δyi and Δzi are differences between the reference coordinates and the coordinates gained from the UAS photogrammetric survey, while n is the number of points in each set.
R M S E x y = R M S E x 2 + R M S E y 2
R M S E x y z = R M S E x 2 + R M S E y 2 + R M S E z 2
Positional error Δp was used to analyse within-group variability [19] for the horizontal position of each validation point on both plots:
Δ p i = Δ x i 2 + Δ y i 2
Positional error gives a distance between the point position, i.e., validation points gained by a photogrammetric UAS survey, and the reference position. The interquartile range (IQR) × 1.5 was used in box-plot whiskers to show the variability of different GCP classes.

3. Results

The root mean square horizontal and vertical errors were calculated for Plots 1 and 2, depending on five variations in the number of used GCPs 5, 10, 15 and 20 (Figure 4 and Figure 5) on the area below five hectares after a salvage logging. The highest decline in error was between 5 GCPs and 10 GCPs on both plots. After the use of 10 GCPs, the increase in accuracy on Plot 1 was between 4 and 9 mm in the x coordinate and 1 and 5 mm in the y coordinate, and on Plot 2 it was between 14 and 34 mm in the x coordinate and below 5 mm in the y coordinate. On the other hand, the error in the z coordinate did not decrease with the rise of the used GCPs. On Plot 1, the lowest error was recorded at 10 GCPs RMSEz = 0.1255 m, after which it inclined for 2 and 3 mm for 15 and 20 GCPs, respectively. In Plot 2 the error in the z value was also the lowest at 10 GCPs at RMSEz = 0.1546 m, after which it inclined for 8 and 7 mm again for 15 and 20 GCPs, respectively.
All checkpoints were recorded by a total station and an RTK GNSS terrestrial receiver, and the x, y and z coordinates of 175 points on both plots were analysed (Table 2). The error for all three coordinates was below 1 cm, apart from the y coordinate in Plot 2.
Error in all three coordinates without using any GCPs is shown in Table 3. Expectedly, the highest error was in the z coordinate on Plot 2 (RMSEz = 15.0400 m) where the terrain is undulating, and the terrain slope varies from 0.71% to 46.93%. The lowest error was recorded in the x coordinate on Plot 1 (x = 0.4983 m).
The positional error of both plots is shown in Figure 6. Generally, the increase in the number of GCPs used for the alignment of original images reduced the positional error. In Plot 1, median values were Δp5GCP = 0.2305 m, Δp10GCP = 0.0403 m, Δp15GCP = 0.0562 m and Δp20GCP = 0.0424 m. Plot 2 followed a similar pattern with one exception—GCP class with ten points, Δp5GCP = 0.1500 m, Δp10GCP = 0.2220 m, Δp15GCP = 0.0817 m and Δp20GCP = 0.0507 m. This one exception in Plot 2 can be explained by difficulties connected to the identification of points depending on the level of zoom on relatively scarce point clouds brought by using a different tree-marker spray in Plot 2.

4. Discussion

There are many possibilities and benefits in using UASs in forest ecosystem research. When there is a need to identify damaged sites, especially after climatic extremes or bark-beetle outbreaks, the use of UASs has shown to be crucial for the harvesting management of salvage logging or in more specific pre-harvest, post-harvest and post-disturbance inventories when timely and accurate data are needed [6]. Researchers highlight that the use of UASs, which performances are constantly improving, will eventually replace the need for people in the field, thus reducing the price and time for surveying and reducing risks, especially in damaged sites with high-risk control. Effective management and integrated forest protection must successfully limit the increase of trees destroyed by bark beetles after extreme weather conditions [32]. In the forests of silver fir and Norway spruce, bark-beetle outbreaks represent a significant biotic factor in the last ten-year period.
The influence of the number and the position of GCPs has been studied widely. Generally, the number of used GCPs varies from 4 to 20, regardless of the studied area size. The area size is usually defined as small (<10 ha) [33], middle-sized (<100 ha) [32,34] and large (>100 ha) [28,29,34] in different fields of research, which usually correlates to land cover, and also varies but from an environmental point of view which may be related to the study of quarry sites and mining areas [29,30], urban areas [35,36], agriculture [37] and forests [28,38]. Forests are somewhat different from the rest as they are dense canopy; they still bring the biggest challenges in both aerial surveys and terrestrial surveying methods.
Placement of the GCPs requires a clear view of the sky to minimise GPS error due to the forest canopy and during postprocessing corrections [39], which, in this research, was possible due to a conducted salvage logging operation. Two plots of similar size (<5 ha) and different terrain conditions were measured using a total station, an RTK GNSS terrestrial receiver and a UAS in June 2022, in the same weather conditions and approximately the same hours of flight (from 11 to 14 h) and flight height (70 m). Totally, 175 checkpoints were marked in the field with an orange tree-marker spray. Four different GCP classes (5, 10, 15 and 20) were used to compare validation points acquired from the original point clouds, imagery and orthophotos to the reference positions. Generally, the values in RMSE decreased as the quantity of the GCPs increased, which is most visible in the horizontal accuracy (Figure 4) analysis and follows previous research [30,35,36]. The vertical variations in RMSE were recorded despite the increase in the number of GCPs [30,35,37]. The evaluation of the point cloud and the orthomosaic accuracy without the use of GCPs showed higher RMSE (still <4 m) and were just above 15 m for horizontal and vertical positions, respectively. The RMSE of all points recorded by a total station and an RTK GNSS receiver showed small variations, mostly below 7 mm horizontally and vertically, with one exception: RMSE y = 14 mm in Plot 2. Plot 2 was more challenging in terms of terrain survey due to the undulating terrain with slopes ranging from 0.71% to 46.93%, but also in the identification of marked checkpoints in the field, i.e., orange crosses (Figure 3). In Plot 2, we used a different tree-marker spray (EU production) than the locally produced one which was used in Plot 1, and the visibility of the centre of the crosses on Plot 2 were much lower. In addition, during the measurements with a total station and an RTK GNSS terrestrial receiver, one should pay special attention to the vertical position of the prism and the mapper, as deviations will bring errors in measurements.
UAS do provide on-demand, highly precise data with subcentimeter resolution for forestry research [17]. The same authors stated a great potential in PPK-derived (Postprocessing Kinematic) data in applied research and forest management situations without any use of GCPs. Also, they concluded that highly representative datasets provide the means to conduct tree measurements, which was, in their case, performed at an oak plantation of 207.29 m2 and a flat terrain.
The practicality of UAS in large areas after natural disturbances can be questioned together with the use of GCPs for georeferencing, but the most important question in such situations is to what extent of accuracy do foresters need in certain situations. This research showed that without using GCPs, root mean square errors for x and y coordinates were below 1 m in even terrains at Plot 1 (RMSEx = 0.4983 m and RMSEy = 0.7117 m) and below 4 m in sloped terrains at Plot 2 (RMSEx = 0.9313 m and RMSEy = 3.2359 m), while the z coordinate showed higher error on both plots, but was still smaller on even terrains (Plot 1 RMSEz = 2.6362 m and Plot 2 RMSEz = 15.0400 m). The level of accuracy desired would obviously be a function of the forest management issue under consideration, as some issues may require more highly accurate and precise estimates of areas. Again, some researchers question the time-efficiency component associated with the use of GCPs in applied forestry research [17]. This research was conducted in two days and merely because of waiting for the same weather conditions and approximately the same hours of UAS flights, i.e., from 11 h to 14 h. Recent forest-based accuracy assessments of UAS positions do not use total station as a high-quality control; the use of total station is often connected to agricultural [37] or quarry surveys [31,40]. In this research, we used both an RTK GNSS terrestrial receiver and a total station, which is in accordance to previous recommendations which stipulate that points on the ground need to be measured with at least state-of-the-art GNSS-RTK technology or engineering surveying methods based on total stations [41].

5. Conclusions

Unfortunately, climatic extremes can be expected in the near future, and with them bark-beetle outbreaks will usually follow in the period of one to three years after the extreme. The development of UASs will improve their performance and area of application for the same or lower price to ensure competitiveness, which will help in surveying disturbed forest areas. This study showed that in terms of an area recognition after salvage logging, the use of GCPs for original point clouds, imagery and orthophotos evaluation will bring more accuracy in area recognition, even in areas below five hectares. The placement of GCPs in a terrain can be time-consuming if many GCPs will be in use; still these results showed that 10 GCPs would be sufficient to gain accuracy. The use of 10 GCPs in this research gave RMSEx = 0.07 to 0.08 m on flat and sloped terrains (Plots 1 and 2), respectively, while RMSEy = 0.05 to 0.21 m. The highest error was recorded in the z coordinate, where RMSEz = 0.13 to 0.23 m in Plots 1 and 2, respectively. With the use of more GCPs, errors in x, y and z coordinates can be additionally reduced, but minimally.

Author Contributions

Conceptualization, A.Đ.; methodology, A.Đ.; software, K.T.; validation, K.T. and I.P.; formal analysis, A.Đ.; investigation, I.P.; resources, M.F.; data curation, D.J. and I.Ž.; writing—original draft preparation, A.Đ.; writing—review and editing, K.T.; visualization, I.P.; supervision, A.Đ.; project administration, A.Đ.; funding acquisition, A.Đ. All authors have read and agreed to the published version of the manuscript.

Funding

This research was funded by the Croatian Science Foundation under the project “Quantity and structure of fir and spruce biomass in changed climatic conditions” (UIP-2019-04-7766).

Acknowledgments

The authors wish to thank the Faculty of Forestry and Wood Technology at the University of Zagreb for all their support during this research.

Conflicts of Interest

The authors declare no conflict of interest.

References

  1. Čavlović, J. Prva Nacionalna Inventura Šuma Republike Hrvatske. Ministry of Regional Development, Forestry and Water Management; University of Zagreb, Faculty of Forestry and Wood Wechnology: Zagreb, Croatia, 2010; pp. 1–300. [Google Scholar]
  2. Netherer, S.; Nopp-Mayr, U. Predisposition assessment systems (PAS) as supportive tools in forest management–rating of site and stand-related hazards of bark beetle infestation in the High Tatra Mountains as an example for system application and verification. For. Ecol. Manag. 2005, 207, 99–107. [Google Scholar] [CrossRef]
  3. Matić, S. The impact of site changes and management methods on dieback of common spruce (Picea abies Karst.) in Croatia. Croat. J. For. Eng. 2011, 32, 7–16. [Google Scholar]
  4. Grégoire, J.-C.; Evans, H.F. Damage and control of Bawbilt organisms—An overview. In Bark and Wood Boring Insects in Living Trees in Europe, A Synthesis; Lieutier, F., Day, K.R., Battisti, A., Grégoire, J.-C., Evans, H.F., Eds.; Kluwer Academic Publishers: Dordrecht, UK, 2004; pp. 19–37. [Google Scholar]
  5. Brus, D.J.; Hengeveld, G.M.; Walvoort, D.J.J.; Goedhart, P.W.; Heidema, A.H.; Nabuurs, G.J.; Gunia, K. Statistical mapping of tree species over Europe. Eur. J. For. Res. 2012, 131, 145–157. [Google Scholar] [CrossRef]
  6. Tomljanović, K.; Đuka, A.; Franjević, M.; Jurjević, L.; Matak, I.; Ugarković, D.; Balenović, I. Application of UAS for monitoring of forest ecosystems—A review of experience and knowledge. Croat. J. For. Eng. 2022, 43, 487–504. [Google Scholar] [CrossRef]
  7. Hillman, S.; Wallace, L.; Lucieer, A.; Reinke, K.; Turner, D.; Jones, S. A comparison of terrestrial and UAS sensors for measuring fuel hazard in a dry sclerophyll forest. Int. J. Appl. Earth Obs. 2021, 95, 102261. [Google Scholar] [CrossRef]
  8. Schiefer, F.; Kattenborn, T.; Frick, A.; Frey, J.; Schall, P.; Koch, B.; Schmidtlein, S. Mapping forest tree species in high resolution UAV-based RGB-imagery by means of convolutional neural networks. ISPRS J. Photogramm. Remote Sens. 2020, 170, 205–215. [Google Scholar] [CrossRef]
  9. Tang, L.; Shao, G. Drone remote sensing for forestry research and practices: Review article. J. For. Res. 2015, 26, 791–797. [Google Scholar] [CrossRef]
  10. Tomljanović, K.; Nosek, H.; Pernar, R.; Grubešić, M. Mogućnosti primjene lakih bespilotnih letjelica u prebrojavanju krupne divljači. Šumarski List 2018, 142, 621–626. [Google Scholar] [CrossRef]
  11. Balenović, I.; Liang, X.; Jurjević, L.; Hyyppä, J.; Seletković, A.; Kukko, A. Hand-held personal laser scanning–current status and perspectives for forest inventory application. Croat. J. For. Eng. 2021, 42, 165–183. [Google Scholar] [CrossRef]
  12. Hycza, T.; Ciesielski, M.; Zasada, M.; Bałazy, R. Application of black-bridge satellite imagery for the spatial distribution of salvage cutting in stands damaged by wind. Croat. J. For. Eng. 2019, 40, 125–138. [Google Scholar]
  13. Mokroš, M.; Výbošťok, J.; Merganič, J.; Hollaus, M.; Barton, I.; Koreň, M.; Tomaštík, J.; Čerňava, J. Early stage forest windthrow estimation based on unmanned aircraft system imagery. Forests 2017, 8, 306. [Google Scholar] [CrossRef] [Green Version]
  14. Talbot, B.; Astrup, R. A review of sensors, sensor-platforms and methods used in 3D modelling of soil displacement after timber harvesting. Croat. J. For. Eng. 2021, 42, 149–164. [Google Scholar] [CrossRef]
  15. Talbot, B.; Nowell, T.; Berg, S.; Astrup, R.; Routa, J.; Väätäinen, K.; Ala-Ilomäki, J.; Lindeman, H.; Prinz, R. Continuous surface assessments of wheel rutting compared to discrete point measurements—do the benefits justify the efforts? In Proceedings of the Nordic-Baltic Conference on Forest Operations for the Future, Elsinore, Denmark, 22–24 September 2020. [Google Scholar]
  16. Pradeep, G.S.; Danumah, J.H.; Nikhil, S.; Prasad, M.K.; Patel, N.; Mammen, P.C.; ARajaneesh, V.O.; Ajin, R.S.; Kuriakose, S.L. Forest fire risk zone mapping of Eravikulam National Park in India: A comparison between frequency ratio and analytic hierarchy process methods. Croat. J. For. Eng. 2022, 43, 199–217. [Google Scholar] [CrossRef]
  17. Miller, Z.M.; Hupy, J.; Chandrasekaran, A.; Shao, G.; Fei, S. Application of postprocessing kinematic methods with UAS remote sensing in forest ecosystems. J. For. 2021, 119, 454–466. [Google Scholar] [CrossRef]
  18. Rydlund, P.H., Jr.; Densmore, B.K. Methods of practice and guidelines for using survey-grade global navigation satellite systems (GNSS) to establish vertical datum in the United States Geological Survey: US Geological Survey Techniques and Methods, book 11, chap. In US Geological Survey Techniques and Methods; Book 11; USGS: Reston, VA, USA, 2012; 102 p. [Google Scholar]
  19. Li, T.; Georgy, J.; Syed, Z.; Goodall, C. Real-time navigation system for ultra-tight integration of GNSS and multi-sensors. In Proceedings of the 26th International Technical Meeting of the Satellite Division of the Institute of Navigation, Nashville, TN, USA, 16–20 September 2013; pp. 2269–2275. [Google Scholar]
  20. QGIS Tutorials and Tips. Available online: https://www.qgistutorials.com/en/ (accessed on 17 May 2022).
  21. PIX4Dmapper Video Tutorials-Pix4D Support. Available online: https://support.pix4d.com/hc/en-us/articles/360031682092-PIX4Dmapper-video-tutorials (accessed on 11 May 2022).
  22. ArcGIS Tutorials—ArcMap Documentation. Available online: https://desktop.arcgis.com/en/arcmap/latest/get-started/introduction/arcgis-tutorials.htm (accessed on 1 June 2022).
  23. Cramer, M.; Stallmann, D.; Haala, N. Direct georeferencing using GPS/inertial exterior orientations for photogrammetric applications. Int. Arch. Photogramm. Remote Sens. 2000, 33, 198–205. [Google Scholar]
  24. Skaloud, J. Direct georeferencing in aerial photogrammetric mapping. Photogramm. Eng. Remote Sen. 2002, 68, 207–210. [Google Scholar]
  25. Pfeifer, N.; Glira, P.; Briese, C. Direct georeferencing with on board navigation components of light weight UAV platforms. Int. Arch. Photogramm. Remote Sens. Spat. Inf. Sci 2012, 39, 487–492. [Google Scholar] [CrossRef] [Green Version]
  26. Mihelič, J.; Robek, R.; Kobal, M. Determining bulk factors for three subsoils used in forest engineering in Slovenia. Croat. J. For. Eng. 2022, 43, 303–311. [Google Scholar] [CrossRef]
  27. Ciprijan, M.; Marijanović, M. 2018: Unaprjeđenje hrvatskoga pozicijskog sustava (CROPOS) povezivanjem s europskim globalnim satelitskim sustavom GALILEO. In Proceedings of the Fifth CROPOS Conference, University of Zagreb Faculty of Geodesy Zagreb, Zagreb, Croatia, 30 November 2018; pp. 27–32. [Google Scholar]
  28. Tomaštík, J.; Mokroš, M.; Surový, P.; Grznárová, A.; Merganič, J. UAV RTK/PPK method—An optimal solution for mapping inaccessible forested areas? Remote Sens. 2019, 11, 721. [Google Scholar] [CrossRef] [Green Version]
  29. Sanz-Ablanedo, E.; Chandler, J.H.; Rodríguez-Pérez, J.R.; Ordóñez, C. Accuracy of unmanned aerial vehicle (UAV) and SfM photogrammetry survey as a function of the number and location of ground control points used. Remote Sens. 2018, 10, 1606. [Google Scholar] [CrossRef] [Green Version]
  30. Villanueva, J.K.S.; Blanco, A.C. Optimization of ground control point (GCP) configuration for unmanned aerial vehicle (UAV) survey using structure from motion (SFM). Int. Arch. Photogramm. Remote Sens. Spat. Inf. Sci. 2019, 42, 167–174. [Google Scholar] [CrossRef] [Green Version]
  31. Nguyen, Q.L.; Goyal, R.; Cao, X.C.; Bui, N.Q.; Bui, X.N.; Bui, K.L. Flight height of UAV and its influence on the precise digital elevation model at complex terrain. Inżynieria Miner. 2020, 1, 179–186. [Google Scholar] [CrossRef]
  32. Kärvemo, S.; Rogell, B.; Schroeder, M. Dynamics of spruce bark beetle infestation spots: Importance of local population size and landscape characteristics after a storm disturbance. For. Ecol. Manag. 2014, 334, 232–240. [Google Scholar] [CrossRef]
  33. He, F.; Zhou, T.; Xiong, W.; Hasheminnasab, S.M.; Habib, A. Automated aerial triangulation for UAV-based mapping. Remote Sens. 2018, 10, 1952. [Google Scholar] [CrossRef]
  34. Küng, O.; Strecha, C.; Beyeler, A.; Zufferey, J.C.; Floreano, D.; Fua, P.; Gervaix, F. The accuracy of automatic photogrammetric techniques on ultra-light UAV imagery. ISPRS Int. Arch. Photogramm. Remote Sens. Spat. Inf. Sci. 2012, XXXVII-1/C22, 125–130. [Google Scholar] [CrossRef] [Green Version]
  35. Tahar, K.N. An evaluation of different number of ground control points un unmanned aerial vehicle photogrammetric block. ISPRS Int. Arch. Photogramm. Remote Sens. Spat. Inf. Sci. 2013, XL-2/W2, 27–29. [Google Scholar]
  36. Awasthi, B.; Karki, S.; Regmi, P.; Dhami, D.S.; Thapa, S.; Panday, U.S. Analyzing the effect of distribution pattern and number of GCPs on overall accuracy of UAV photogrammetric results. In Proceedings of the UASG 2019, Roorkee, India, 6–7 April 2019; UASG 2019; Lecture Notes in Civil Engineering. Springer: Cham, Switzerland, 2019; Volume 51. [Google Scholar] [CrossRef]
  37. Agüera-Vega, F.; Carvajal-Ramírez, F.; Martínez-Carricondo, P. Assessment of photogrammetric mapping accuracy based on variation ground control points number using unmanned aerial vehicle. Measurement 2017, 98, 221–227. [Google Scholar] [CrossRef]
  38. Reilly, S.; Clark, M.L.; Bentley, L.P.; Matley, C.; Piazza, E.; Oliveras Menor, I. The potential of multispectral imagery and 3D point clouds from unoccupied aerial systems (UAS) for monitoring forest structure and the impacts of wildfire in mediterranean-climate forests. Remote Sens. 2021, 13, 3810. [Google Scholar] [CrossRef]
  39. Harwin, S.; Lucieer, A. Assessing the accuracy of georeferenced point clouds produced via multi-view stereopsis from unmanned aerial vehicle (UAV) imagery. Remote Sens. 2012, 4, 1573–1599. [Google Scholar] [CrossRef] [Green Version]
  40. Nguyen, Q.L.; Bui, X.N.; Cao, X.C.; Le, V.C. An approach of mapping quarries in Vietnam using low-cost Unmanned Aerial Vehicles. Inżynieria Miner. 2019, 21, 2148–2262. [Google Scholar] [CrossRef]
  41. Gerke, M.; Przybilla, H.J. Accuracy analysis of photogrammetric UAV image blocks: Influence of onboard RTK-GNSS and cross flight patterns. Photogramm. Fernerkund. Geoinf. (PFG) 2016, 1, 17–30. [Google Scholar] [CrossRef]
Figure 1. Study area (A) Plot 1—Sunger and (B) Plot 2—Carevići.
Forests 13 02054 g001
Figure 2. Equipment used in the research: (A) RTK GNSS STONEX S900A terrestrial receiver, (B) STONEX TS R35 WINCE total station and (C) UAS DJI Inspire 1 V2.
Forests 13 02054 g002
Figure 3. Identification of checkpoint centres using orange tree-marker spray.
Forests 13 02054 g003
Figure 4. Variations in the number of GCPs in Plot 1 and Plot 2.
Forests 13 02054 g004
Figure 5. Horizontal and vertical RMSE on Plots 1 and 2.
Forests 13 02054 g005
Figure 6. Positional error in Plots 1 and 2.
Forests 13 02054 g006
Table 1. Technical specification of the used equipment.
Total Station Stonex R35RTK GNSS Receiver Stonex S900ADJI Inspire 1
ANGLE
MEASUREMENT
(angle units)
DEG 360°/GON 400/MIL 6.400Gimbal Zenmuse X3. Angular Vibration Range ±0.03°; Controllable Range Pitch: −90° to + 30°
Pan: ±320°
GPS: L1 C/A, L1C, L1P, L2C, L2P, L5DJI Inspire 1
Gimbal Zenmuse X3. Angular Vibration Range ±0.03°; Controllable Range Pitch: −90° to + 30°
Pan: ±320°
GLONASS: L1 C/A, L1P, L2C, L2P
BEIDOU: B1, B2, B3
GALILEO: E1, E5a, E5b
QZSS: L1 C/A, L1C, L2C, L5
SBAS: L1, L5
DISTANCE
MEASUREMENT RANGE
Standard mode prism
3.000 m
Max Transmitting Distance up to 5 km.3–4 Km in urban environment
Up to 10 Km with optimal conditions
Max Transmitting Distance up to 5 km.
Long mode prism
5.000 m
DISTANCE
MEASUREMENT
ACCURACY
Standard mode prism
2 mm + 2 ppm
GPS Hovering Accuracy: Vertical: 0.5 m
Horizontal: 2.5 m
Fixed RTK Horizontal
(8 mm + 1 ppm RMS)
Long mode prism
2 mm + 2.5 ppm
Fixed RTK Vertical
(15 mm + 1 ppm RMS)
GPS Hovering Accuracy: Vertical: 0.5 m
Horizontal: 2.5 m
LASER PLUMMET
(laser type)
635 nm
semiconductor laser
Operating Frequency 5.725–5.825 GHz & 2.400–2.483 GHz2.1 + EDR, V4.0
POWER SUPPLY
(battery)
7.4 V/3.400 mAh Li-ionRechargeable and replaceable TB48, 5700 mAh, 22,8 V, 12,996 Wh2 rechargeable and replaceable
7.2 V—3400 mAh
Intelligent lithium batteries
Operating Frequency 5.725–5.825 GHz & 2.400–2.483 GHz
POWER SUPPLY
(working time
(angle + distance meas.)
Up to 5 hDepending on the intensity of the flight approximately 18 minUp to 12 h (2 batteries hot swap)Rechargeable and replaceable TB48, 5700 mAh, 22.8 V, 129.96 Wh
PHYSICAL
SPECIFICATION
(dimensions)
206 × 203 × 360 mm438 × 451 × 301 mmɸ 157 mm × 76 mmDepending on the intensity of the flight approximately 18 min
PHYSICAL
SPECIFICATION
(Weight including
Battery and tribrach)
6.1 kgTake-off Weight 3060 g (including propellers, battery and Zenmuse X3 camera)1.19 kg (with one battery)
1.30 kg (with two batteries)
438 × 451 × 301 mm
Table 2. Root mean square error of all 175 checkpoints recorded by a total station and an RTK GNSS terrestrial receiver.
RMSEPlot 1Plot 2
RMSEx0.05180.0585
RMSEy0.03090.1412
RMSEz0.07460.0453
Table 3. Root mean square error without the use of GCPs.
RMSEPlot 1Plot 2
RMSEx0.49830.9313
RMSEy0.71173.2359
RMSEz2.636215.0400
Publisher’s Note: MDPI stays neutral with regard to jurisdictional claims in published maps and institutional affiliations.

