Abstract
The observed climate change determines the silvicultural and productive perspectives of the different species. The use of stand growth simulators, which are important tools for predicting future tree growth, requires verified and consistent data, such as length of forest growing season (FGS). The aim of this study is to determine the current and future FGS on the territory of Poland, which has a highly variable transition climate between maritime and continental types. The analysis is based on the WorldClim grid dataset corrected with the constructed model based on the FGS derived from 245 meteorological stations covering the whole territory of the country. In addition, predictions of changes in FGS depending on different climate scenarios were considered. The results show that the inclusion of geographical location components, i.e., longitude, latitude and especially altitude, is important for the correction of FGS calculated on the basis of raster datasets such as WorldClim. The prediction of climatic changes shows a significant increase in FGS duration in Poland, ranging from 18 to 52 days, mainly affecting the mountainous regions with the shortest actual FGS.
1. Introduction
Climate change, which is currently being observed worldwide, can be considered one of the greatest challenges of the 20th century [1,2]. The question of possible and desirable human actions and responsibility for the future state of the entire planet is becoming a very important social and economic issue [3]. Undoubtedly, these changes also have a huge impact on all living organisms, including woody plant species, which play a key role in the formation of forest ecosystems [4]. The consequences of the observed increase in greenhouse gas concentrations include an increasing number of extreme events such as droughts, strong winds or floods [5,6,7,8,9] with associated increased tree mortality [10] and changes in the species composition of forest communities [11]. In addition, a steady increase in air temperature has been observed, leading to an earlier start and a later end of the growing season [12,13,14,15] and thus to increased growth of stands [16,17], as well as to a shift in the distribution limits of species, especially in mountainous regions [18,19]. Considering the need to anticipate conditions for the existence and growth of forest communities for at least several decades, it is essential to use specific climate change models that are progressively reviewed, verified and updated [20,21].
Given the observed and predicted climate change, determining the silvicultural and productive perspectives of trees of different species is currently of great importance [16]. The growth process of trees depends on a variety of factors, including not only species and age but also properties of soil and climate as well as competition between trees that can be modified by targeted silviculture treatments. Therefore, empirical or physiological growth models that integrate a large number of interconnected detailed models are now frequently used to predict growth. They allow the simulation of changes that occur under changing external conditions at different levels—not only for entire forest communities, but also for specific stands or even individual trees. The role of such so-called growth simulators is increasing in modern forestry, and among the many existing solutions, the model SILVA [22], together with its successors such as the growth simulator ‘Simulátor biodynamiky lesa’ (SIBYLA) [23,24] can be considered one of the most fundamental. However, to function properly, such simulators need verified and consistent climate data.
Climatic changes, especially temperature increases, that affect the length of the growing season are crucial for phenological phases and assimilate accumulation [25,26,27,28,29,30], as well as for growth and reproductive processes that provide the potential for dispersal of different species [31,32]. Studies on variation in growing season length have been conducted at global [12,33], continental [13,34,35] and regional [36] scales. Western Europe, which is strongly influenced by oceanic air masses, appears to be relatively homogeneous in terms of climate [14]. Eastern Europe, on the other hand, is characterised by a pronounced climatic transition due to the alternating influx of air masses with continental and oceanic characteristics. Therefore, a country such as Poland, which can be characterised by a climate between maritime and continental types [15], is well-suited for the evaluation of climate grid model data for the purpose of modelling changes in the duration of the growing season.
One of the most commonly analysed bioclimatic indicators is the length of the so-called ‘thermal’ or ‘meteorological’ growing season (MGS), which reflects the time during which plant development can theoretically take place [36] and is considered when the average daily air temperature exceeds a threshold of 5 °C [15,33,37]. In contrast, the so-called forest vegetation period or forest growing season (FGS), understood as the period of intensive tree vegetation, seems to be more important for the development and growth of trees and stands [38,39,40]. Only a few countries maintain a network of stations at which phenological observations are conducted that allow the beginning and end of the growing season for individual plant species to be precisely determined according to a set criterion [41]. In many regions where no such observations are made or the number of phenological stations is small, the length of the FGS is determined on the basis of the thermal criterion with a threshold value of daily mean air temperature ≥ 10 °C. Despite the usefulness of the FGS for the analysis of phenological phases in forest communities, it has only been used in a limited number of studies [42,43]. On the other hand, instead of MGS, FGS was considered more suitable for analysing the vegetation of forest communities and was included in forest growth simulators such as SILVA and SIBYLA as a crucial parameter for growth prediction procedures [22,23].
In order to determine the length of the MGS or FGS, it is necessary to have sufficiently long observation series of daily mean temperature values. In practise, this condition is only met by a limited number of climatic and synoptic stations, although there are methods that allow the length of MGS or FGS to be estimated on the basis of monthly records [44]. To determine the length of MGS or FGS on a regional or global scale, it is currently very common to use spatial models in the form of processed thematic grid datasets, of which the WorldClim service is a good example [45]. The high-resolution WorldClim datasets provided are based on a few large databases of weather measurements. However, the integration of various datasets from many countries led to numerous simplifications of such models, which are the result of repeated steps of data aggregation, subsetting, cross-validating and interpolating [45,46,47], to obtain the final, global continuous model, describing the average, smoothed values of temperature, precipitation or bioclimatic indicators over large areas. The WorldClim service provides not only climate data based on observations from 1970 to 2000, but also projections of their changes based on different climate scenarios, both older (CMIP5) and more recent (CMIP6) [20,21]. These datasets have already been successfully used in various studies on the productivity of forest-forming species [48,49].
The objectives of this study are: (a) to determine the length of the forest growing season (FGS) on the territory of Poland based on raster data from the WorldClim service, and to create a model allowing the identification and correction of FGS prediction errors based on a comparison with FGS calculated directly from meteorological stations, and (b) to evaluate FGS changes in Poland in the perspective of 2100, based on raster data from the WorldClim service according to the main climate change scenarios.
The achievement of the above objectives may provide the basis for the use of global and regional grid data for the analysis of changes in FGS duration in regions with intermediate climate zones.
2. Materials and Methods
As the study refers to several different methods for determining forest growing season (FGS), we have consequently denoted all the different FGS’s in the study with index letters (FGSy, FGSr, FGSg, FGSc and FGSp) indicating the approach used in each case.
All calculations and statistical analysis was performed within R statistic software environment [50], version 4.2.2.
2.1. Determination of FGSy and FGSr Based on Data from Meteorological Stations
In order to determine the most accurate, ‘real’ length of the forest growing season (FGSr) for the period 1970–2000, the verified and consistent measurement data from meteorological stations, which were provided by the Polish Institute of Meteorology and Water Management—National Research Institute (IMGW-PIB) and distributed through dedicated server (https://dane.imgw.pl/, accessed on 1 September 2022) were used. The data were accessed directly via the R software extension, the Climate package [51]. First, the values of average daily air temperatures were collected for all available 319 meteorological stations in Poland. The resulting dataset was checked for errors, i.e., duplicate entries, incorrect zero values and incoherent station names as well as any incomplete entries that were insufficient for the calculation of the FGS for certain years. After excluding 9 stations due to errors and 40 stations with less than 10 complete years of measurements in the period 1970–2000, the value of ‘yearly’ forest growing season (FGSy) for each specific year in the period 1970–2000 was derived for 245 weather stations with available daily mean air temperature data. The traditional method of determining the FGS is based on identifying the date on which the air temperature exceeds a threshold of 10 °C for a given number of days. Unfortunately, this definition can raise serious doubts in the case of missing data; moreover, its usefulness may be limited if the selected threshold is exceeded several times. Therefore, we used an original method to determine the beginning and end of the growing season, based on fitting individual polynomial models. This approach makes it possible to eliminate some of the problems mentioned above. It is less complcated and more resistant to possible data deficiencies, remaining logically consistent with the definition itself. To determine the FGSy as accurately as possible for each calendar year between 1970 and 2000, a 4th degree polynomial was fitted to predict the average daily air temperatures on consecutive days of the year for each meteorological station (Figure 1). Using the intercept of the fitted polynomial with the value of 10 °C, the beginning and end of the period when the air temperature permanently exceeded the threshold of 10 °C was determined and consequently the FGSy was calculated (Figure 1).
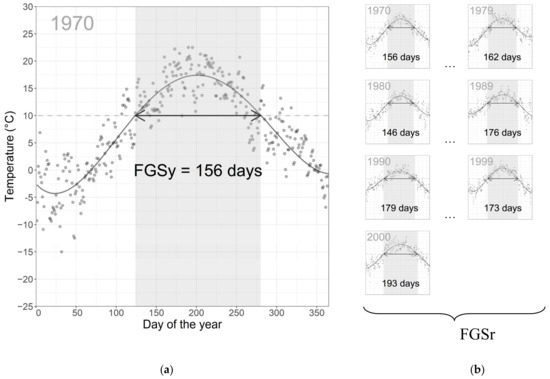
Figure 1.
Graphical illustration of the method of determining the ‘yearly’ length of the forest growing season (FGSy) for the station BIERUŃ STARY in year 1970 on the basis of mean daily air temperatures (a) and an illustrative diagram of the calculation of the ‘real’ length of the forest growing season (FGSr) for the period 1970–2000 (b).
The arithmetic mean of the FGSy for the period 1970–2000, which accurately reflects the period for which grid data are available on the WorldClim website, was then calculated for each station, giving the FGSr value:
2.2. Determination of FGSg Based on Grid Data
To evaluate the duration of the forest growing season countrywide, the study used the global, high-resolution grid model CRU-TS 4.03 [52], downscaled with WorldClim 2.1 [45] and made publicly available by the WorldClim service (www.worldclim.org, accessed on 1 September 2022). Climatological data, covering monthly mean air temperatures over the period 1970–2000 at a spatial resolution of 30 seconds (~1 km2) were used. In order to achieve comparability of WorldClim model data with meteorological stations data, the ‘raw-grid’ length of the forest growing season (FGSg) was calculated based on the course of mean monthly air temperature values in consecutive months of the year [44,53,54,55]. FGSg was calculated as the difference between the day of the end (d2) and the day of the beginning (d1) of the period when the mean temperature was above the threshold of 10 °C, determined according to the following formulas:
The m1 and m2 are numbers of months preceding the temperature crossing the 10 °C threshold, tm1 and tm2 are the mean temperatures of these months, and m1+1, m2+1, tm1+1 and tm2+1 are number of following months and their temperatures, respectively (Figure 2).
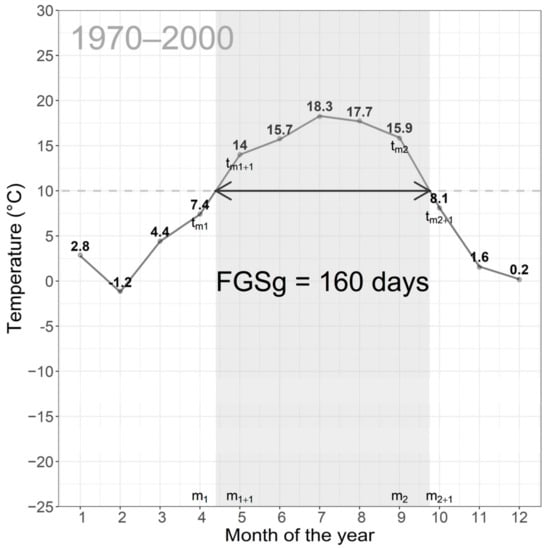
Figure 2.
Graphical illustration of the method of determining the length of the ‘raw-grid’ forest growing season (FGSg) for the BIERUŃ STARY meteorological station on the basis of average monthly air temperature values for the period 1970–2000, obtained from the WorldClim grid dataset.
2.3. Determination of FGSc Based on Correction Model
In order to develop the most accurate model of FGS changes for the whole country, the absolute error of FGSg values obtained from the WorldClim grid dataset over the multi-year period 1970–2000 for 245 meteorological stations was assessed by calculating the difference between the FGSg and FGSr values. A correction model was then developed, using the general additive modelling approach (GAM) [56], in which FGSg error was considered as the dependent variable, while variables describing geographical location, i.e., latitude, longitude and altitude, were used as independent variables. Model fitting and diagnostics, including inspection of model residuals and verification of correct degrees of freedom and reported p-values, were performed using mgcv [57] and mgcViz [58] packages of the R statistic software [50]. The influence of each dependent variable on FGSg error was summarised on dedicated graphs. Finally, a correction was applied to the FGSg values according to the developed GAM correction model, resulting in ‘corrected-grid’ forest growing season (FGSc) values. Finally, the results were presented it the form of map, showing the error of the original FGSg and the corrected values of FGSc in Poland.
2.4. Determination of FGSp Based on Climate Change Scenarios
The WorldClim 2.1 service provides up-to-date datasets of CMIP6 downscaled and calibrated future climate projections. The available data are monthly values of minimum temperature, maximum temperature and precipitation processed for 23 global climate models (GCMs) and four common socio-economic pathways (SSPs): 126, 245, 370 and 585 [21], averaged for 20-year periods (2021–2040, 2041–2060, 2061–2080, 2081–2100).
To represent future changes in FGS as accurately as possible, the MPI-ESM1-2-HR model was used for the years 2081–2100 in four variants of climate scenarios, namely SSP1-2.6, SSP2-4.5, SSP3-7.0 and SSP5-8.5 [21]. Based on the averaging of the layers describing the maximum and minimum temperatures in each month, the changes in average temperatures for the period 2081–2100 were estimated according to the scenarios SSP1-2.6, SSP2-4.5, SSP3-7.0 and SSP5-8.5. Then, following the same procedure as for the 1970–2000 data and applying the developed GAM correction model, the future values of the ‘predicted’ forest growing season (FGSp) in Poland were calculated. Finally, the results of the predicted FGSp were presented in the form of a graph as well as in the form of maps, allowing an assessment of the changes in the values and distribution of FGSg, FGSc and FGSp in Poland for the period 2081–2100, according to the climate change scenarios SSP1-2.6, SSP2-4.5, SSP3-7.0 and SSP5-8.5.
3. Results
3.1. Assessing the Accuracy of WorldClim Data for Determining the FGS in the Period 1970–2000
The comparison of FGSr and FGSg shows a strong relationship between them (Figure 3a), although the shape of the actual relationship (red line) is clearly different from the theoretical relationship (grey line). This indicates that FGSg is characterised by a negative systematic error, which is generally lowest for FGSr in the range of 130 to 160 days. It is worth noting that the prediction of FGSg based on grid data for a large area such as Poland can have an error of up to 20 days in mountainous areas.
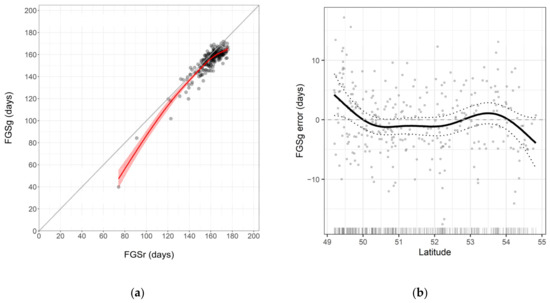
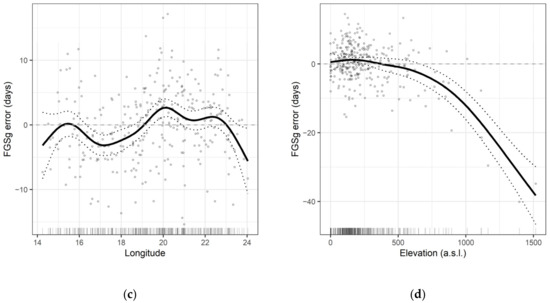
Figure 3.
Relationship between FGSg calculated from WorldClim 2.1 grid dataset and FGSr calculated from measurements from 245 meteorological stations for the period 1970–2000 (a) and associated error of FGSg determination, according to the developed GAM correction model (b–d).
The constructed GAM regression model to correct for the FGSg highlights the influence of each geographical factor, i.e., latitude, longitude and altitude, on the FGSg error (Figure 3b–d). When the longitude changes from west to east, the sign of the FGSg error changes a few times. On the other hand, the sign of the FGSg error gradually changes from positive to negative with increasing latitude, although the error is close to zero in a large area of central Poland. Up to an altitude of about 500 m above sea level, the FGSg error is close to zero, while above 500 m above sea level the negative FGSg error increases significantly with altitude.
A synthetic spatial representation of the constructed GAM correction model taking into account longitude, latitude and height above sea level is shown by the map with the FGSg error isolines (Figure 4). The maximum negative error of the model reaches −22 days in the highest parts of the Tatra Mountains and −10 days in the north and east of Poland.
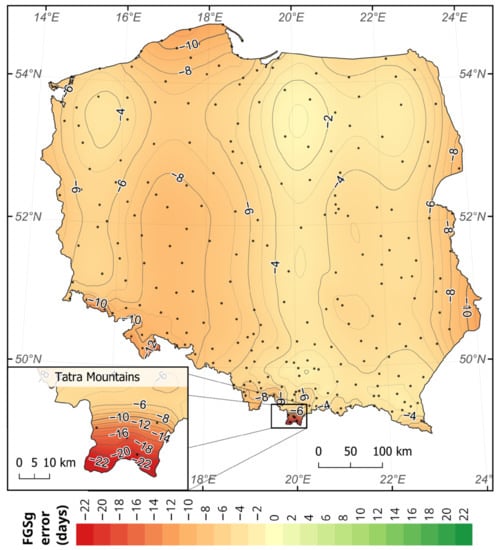
Figure 4.
Error of the determination of FGSg in Poland based on data from the WorldClim service assessed using the correction model, based on a comparison with FGSr, determined from measurements from 245 meteorological stations (black dots).
The FGSg errors found (Figure 4) justified the need to apply the correction model GAM to the WorldClim service data and obtain corrected FGSc values (Figure 5).
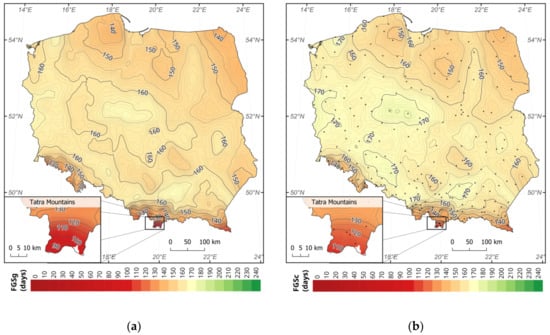
Figure 5.
FGSg in Poland for 1970–2000 based on data from WorldClim 2.1 (a) and FGSc, obtained after applying correction model based on a comparison with FGSr, determined from measurements from 245 meteorological stations (black dots) (b).
The mean value of FGSg in the period 1970–2000 in Poland was 155.9 days and after correction increased to 161.4 days (FGSc), while FGSr, calculated on the basis of data from meteorological stations, was 159.3 days. As a result of the corrections made, the predicted value of FGSc in Poland increased by 5.5 days on average. The highest FGSc value was recorded in the northwestern part and in the central zone of Poland, where it exceeded 170 days. In the northern part of the country, however, FGSc value ranged between 145 and 150 days (Figure 5b). In the southern mountainous regions, FGSc decreased rapidly with altitude, from 160 to 110 days.
3.2. Forecast of Changes of FGS According to Climate Scenarios
For all CMIP6 scenarios examined, the length of the FGSp in Poland will increase significantly. Under scenario SSP1-2.6, the projected FGSp in Poland in 2100 will be 179.4 days on average, while the projected FGSp values for scenarios SSP2-4.5, SSP3-7.0 and SSP5-8.5 will be 190.1, 204.0 and 213.2 days, respectively (Figure 6). The projected increase in FGS is thus 18.0 days (SSP1-2.6), 28.7 days (SSP2-4.5), 42.6 days (SSP3-7.0) or 51.8 days (SSP5-8.5).
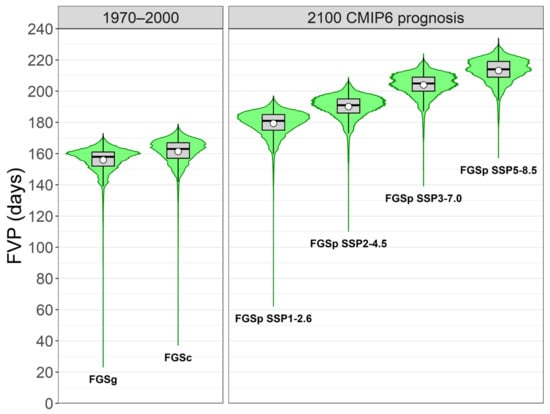
Figure 6.
Box-plot charts reflecting values of FGS (grey boxes) with corresponding distributions (green area) and the mean value (white dot) calculated on the basis of WorldClim grid datasets: for the period of 1970–2000 calculated directly (FGSg), with correction model applied (FGSc) and according to tested CMIP6 climatic scenarios for the year 2100 (FGSp).
The analysis of the spatial distribution of the change in FGSp values indicates that under all four climate scenarios analysed, the greatest increase in FGSp values will be observed in the areas that currently have the shortest growing season. This is also reflected in a significant increase in the minimum FGSp value and a change in its distribution for each climate scenario analysed (Figure 6). The final result of the analyses are maps showing the predicted FGSp length in 2100 on the territory of Poland, based on the application of the correction model GAM to four current CMIP6 climate scenarios. The spatial distribution of FGSp values for the individual scenarios is very similar; only the FGSp values change (Figure 7). The highest FGSp value characterises the lowland belt running from the northwestern part of Poland towards the southeast. In contrast, the smallest FGSp values are characteristic of the uplands and mountainous regions.
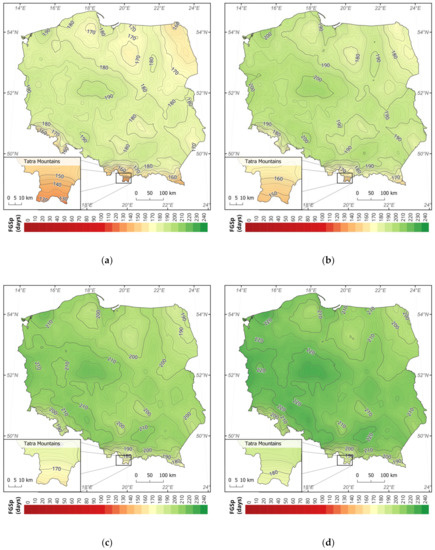
Figure 7.
Projected forest growing season (FGSp) in Poland in 2100 based on data from WorldClim 2.1 for analysed CMIP6 climate scenarios SSP1-2.6 (a), SSP2-4.5 (b), SSP3-7.0 (c) and SSP5-8.5 (d).
4. Discussion
4.1. Usefullness of WorldClim Grid Dataset for FGS Determination
The results obtained show the high utility of raster datasets for predicting the length of FGS over large areas. This confirms the observations of other authors who recommend their use in the absence of data from regular meteorological observations, especially at regional or larger scales [59]. It should be noted, however, that the length of the FGS at the local scale, estimated from the WorldClim service raster datasets, may be subject to a relatively high error. The introduced correction model allowed isolating and mitigating the influence of longitude, latitude and altitude on the inaccuracy of the raster data. In the transition zone between oceanic and continental climate, where Poland is located, the error in FGS determination defined by longitude shows strong spatial variability in direction and sign. In turn, the FGS error associated with latitude reaches positive values on average in southern Poland and gradually decreases to negative values in northern Poland. The largest inaccuracies in determining FGS from WorldClim data are associated with altitude. The higher the terrain and the lower the temperature, the greater is the inaccuracy of the FGS estimate and the more systematically is the FGS underestimated. From a latitudinal perspective, the shortening of the growing season and the associated FGS error is much smaller than the error due to elevation changes, caused by the difference in temperature gradients in these two profiles.
Climate change prediction based on the WorldClim service data allows the predictions of average changes in climate parameters over large areas. The developed correction model shows that locally, the FGS can deviate strongly from the values of the FGS calculated from raster datasets. Similar spatial differences are to be expected for future projections of FGS changes. Therefore, projections of FGS changes should take into account the model that locally corrects the raster values. However, it seems necessary to periodically review and update the correction model, depending on the realistically observed changes in FGS.
In practise, grid datasets are increasingly used for analyses covering entire countries or regions [60,61]. The study confirms that for determination of the long-term value of FGS, monthly resolution data can successfully be used. Although grid models are based on measurements from numerous meteorological stations and on established methodological standards for measuring and calculating individual indicators, grid data may differ from values obtained on the basis of direct measurements at meteorological stations. Replacing them with grid data is therefore generally justified when data from meteorological stations are not available. For example, an analysis of data from the CRU data over Poland shows that the error of grid data increases in the west–east profile [62]. Another argument for the cautious use of raster data is model inaccuracies resulting from the use of imperfect algorithms. An example of this is the apparent discontinuity and abrupt change in FGS values that occurs in Poland at 52° N latitude, even though there are no natural geographic factors that could explain such a phenomenon (Figure 8). The use of verification and regional correction of grid data seems to be very justified, especially for areas characterised by a sparse network of weather stations.
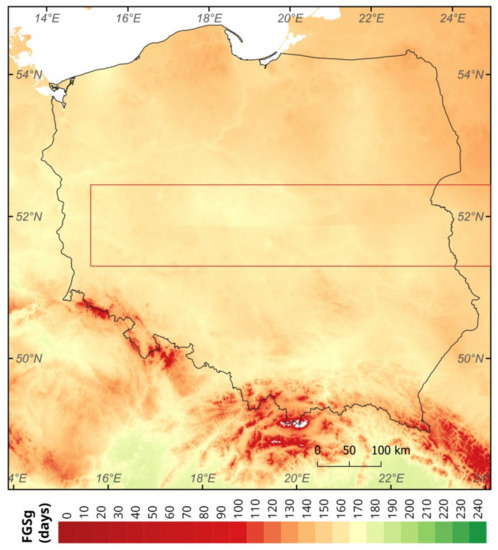
Figure 8.
Visible discontinuity of FGSg calculated from WorldClim 2.1 dataset in Poland, associated with latitude 52° N.
4.2. Observed and Projected Changes of the Growing Season
The length of the meteorological growing season (MGS), based on the thermal criterion of 5 °C, and its global changes have been the subject of numerous studies [1,6,12,13,14,33,34,35,36,37]. They show that MGS has become longer by about 10–20 days in the Northern Hemisphere in recent decades. The length of the forest growing season (FGS) has been studied much less frequently, although it reflects the phenological condition of woody species and is therefore an important indicator of tree and stand development and is used in growth simulators [22,23].
In Poland, some available studies show clearly distinct changes of climate, i.e., earlier start of the vegetation thermal season, shorter thermal winter with more frequent episodic cold periods, a rise in temperature, increased sunshine duration in spring and summer, and an increase in spring precipitation alleviating the deficit of water in warm season [63]. Similar to MGS [64,65], a steady increase in FGS length has been observed in recent decades in lowlands [43], uplands [66] and mountains [42]. Consequently, these changes are part of a general trend of MGS changes in Europe. In the period 2001–2009, the MGS in Poland lengthened by an average of 8 days, compared to the period 1971-2000, and some studies suggest that it will be another 14 to 22 days longer by 2050, depending on the climate scenario [65]. Our results, regarding the extension of the FGS to 2100, are consistent with these projections of change in MGS, but the longer time horizon used seems more appropriate for inferring changes for tree and stand growth conditions. According to the most ‘optimistic’ scenario SSP1-2.6, referred to as the ’sustainability’ stage [21], the projected increase in FGS duration in Poland will reach an average of 18 to 179.4 days by 2100. In contrast, according to the most ‘pessimistic’ scenario SSP5-8.5, referred to as the ’fossil fuel development’ stage [21], the FGS will increase by almost 52 days on average, exceeding 213 days. Our predictions are in line with available studies, where increase of MGS by 2090 is estimated to rise on average by 40–60 days in eastern Poland, while in the western part it will be longer by even 70–90 days [15]. Although all tested scenarios show that an increase in the growing season will be slightly larger for western Poland than the eastern part of the country, the assumed changes are associated more with altitude than with longitude.
The realisation of each tested climate scenario will undoubtedly have a huge impact on forest communities [67]. The response of trees to increasing temperature trends in Europe primarily leads to an earlier onset of FGS [42,68], by an average of 4.6 days/1 °C, rather than to its later end, by an average of 2.4 days/1 °C [30]. The duration of the FGS depends strongly on the topography of the terrain. At the foot of hills, the FGS is shortened by about 8 days per 100 m of altitude [42]. The results obtained indicate that the increase in FGS will be particularly high in mountainous areas, where the FGS is currently shortest. These areas will therefore be the most affected by the changes, although some authors have already noted that the grid data included in services such as WorldClim have greater errors in mountainous regions, characterised by different orography [62]. On the other hand, some studies show that the extension of the growing season itself is not as important as the increase in air temperature associated with the availability of water during the growing season of plants [69]. However, the length of the MGS and the FGS are biologically and economically important, as they affect biomass production and the associated carbon sequestration [70,71,72,73]. The acceleration of the first phenological appearances [1,25,26] observed for many years in the case of rapid cooling during the foliage and flowering phase can lead to significant losses in stands, especially in younger stands, but also in forest crops and nurseries, especially above 600 m above sea level [74].
4.3. Expected Consequences of Changes in the Length of the Growing Season
Climate warming and the associated lengthening of MGS and FGS contribute significantly to the increased plant growth and higher stocking of forest stands observed in many European countries [49,75]. In contrast, a likely negative effect of the increasing water deficit could be the increased death of stands of various species—primarily Norway spruce and currently also Scots pine [76,77]. Our research shows the direction and extent of changes in the FGS resulting from climate warming and corresponds well with observations that in recent decades early spring tends to start earlier, while autumn and winter usually start later [1,55,67]. Observed changes can have very serious biological consequences. For many species, a significant northward shift in distribution limits can be observed, as well as a change in climatic zones in the mountains [18,78]. These changes can affect entire forest communities, i.e., lead to a reduction in boreal forest area [78,79]. Our results, indicating expected dynamic climate changes in the mountain regions, confirm such observations and are consistent with the results of other studies [76,80]. These events can be expected to intensify and ultimately lead to the decline of some species on the one hand [5,7,11], but also create opportunity for the expansion of other species [31] on the other. One of the most important current challenges is to make efforts to increase the sustainability of forest ecosystems [3]. Although observed climate change trends may lead to local loss of biodiversity [32], one of the most important actions to increase the stability of forest communities is to increase their biodiversity [81,82].
5. Conclusions
The most accurate predictions of important bioclimatic indicators, such as the length of the forest growing season (FGS), can be achieved on the basis of direct measurements at meteorological stations. However, since such data are often lacking, gridded data are commonly used. Similar to previous studies, there is a close correlation between the length of the FGS obtained from daily measurements at meteorological stations and the length of the FGS derived based on the monthly average temperature calculated for a multi-year period. This confirms that it is advisable to use readily available global grid data such as WorldClim to determine the FGS, which can be considered as a crucial indicator of the woody plant growth process. Grid data are of great value for characterizing climate and studying its changes at regional and global scales, but can have large errors locally, especially in areas with rich orography. The results of the study show that it is possible to correct these data, as demonstrated by the use of the correction model to increase the accuracy of the assessment of FGS. It is highly desirable to correct the grid data, especially for areas with large elevation differences, as the associated error was relatively high.
The use of thematic grid layers of the WorldClim service dedicated to current climate scenarios provides the possibility to predict future changes of various climate indicators, such as FGS. Taking Poland as an example, with its transitional climate between maritime and continental, it was shown that the prediction of climatic changes associated with the changes in greenhouse gas concentrations considered in the current CMIP6 scenarios (SSP1-2.6, SSP2-4.5, SSP3-7.0 and SSP5-8.5) indicates a significant increase in FGS duration across the country, ranging from 18 to 52 days. In each of the main climate scenarios studied, the areas with the most unfavourable vegetation conditions at present, i.e., the mountainous areas, will be most affected by the projected climate changes. The realisation of the projected changes in FGS will certainly have a significant impact on the existence, species composition and productivity of existing and future forest communities.
Author Contributions
Conceptualization, B.W. and S.W.; methodology, B.W.; software, B.W.; validation, B.W.; formal analysis, B.W.; investigation, B.W.; resources, B.W.; data curation, B.W.; writing—original draft preparation, B.W. and S.W.; writing—review and editing, B.W. and S.W.; visualization, B.W.; supervision, B.W.; project administration, B.W.; funding acquisition, B.W. All authors have read and agreed to the published version of the manuscript.
Funding
Conceptualization was performed during a one-month internship of Bogdan Wertz to Slovakia, which was supported by the scholarship fund of the University of Agriculture in Krakow.
Data Availability Statement
Not applicable.
Acknowledgments
The authors would like to thank Marek Fabrika from the Technical University of Zvolen in Slovakia for inspiring thoughts on the importance of the study topic.
Conflicts of Interest
The authors declare no conflict of interest. The financial supporters had no role in the design of the study, in the collection, analyses or interpretation of data, in the writing of the manuscript, or in the decision to publish the results.
References
- Menzel, A.; Fabian, P. Growing season extended in Europe. Nature 1999, 397, 659. [Google Scholar] [CrossRef]
- Hanewinkel, M.; Cullmann, D.A.; Schelhaas, M.J.; Nabuurs, G.J.; Zimmermann, N.E. Climate change may cause severe loss in the economic value European forest land. Nat. Clim. Chang. 2013, 3, 203–207. [Google Scholar] [CrossRef]
- Milad, M.; Schaich, H.; Bürgi, M.; Konold, W. Climate change and nature conservation in Central European forests: A review of consequences, concepts and challenges. For. Ecol. Manag. 2011, 261, 829–843. [Google Scholar] [CrossRef]
- Parks, C.G.; Bernier, P. Adaptation of forests and forest management to changing climate with emphasis on forest health: A review of science, policies and practices. For. Ecol. Manag. 2010, 259, 657–659. [Google Scholar] [CrossRef]
- Allen, C.D.; Macalady, A.K.; Chenchouni, H.; Bachelet, D.; McDowell, N.; Vennetier, M.; Kitzberger, T.; Rigling, A.; Breshears, D.D.; (Ted)Hogg, E.H.; et al. A global overview of drought and heat-induced tree mortality reveals emerging climate change risks for forests. For. Ecol. Manag. 2010, 259, 660–684. [Google Scholar] [CrossRef]
- Frich, P.; Alexander, L.V.; Della-Marta, P.; Gleason, B.; Haylock, M.; Tank Klein, A.M.G.; Peterson, T. Observed coherent changes in climatic extremes during the second half of the twentieth century. Clim. Res. 2002, 19, 193–212. [Google Scholar] [CrossRef]
- Williams, A.P.; Allen, C.D.; Macalady, A.K.; Griffin, D.; Woodhouse, C.A.; Meko, D.M.; Swetnam, T.W.; Rauscher, S.A.; Seager, R.; Grissino-Mayer, H.D.; et al. Temperature as a potent driver of regional forest drought stress and tree mortality. Nat. Clim. Chang. 2013, 3, 292–297. [Google Scholar] [CrossRef]
- Waltari, E.; Schroeder, R.; Mcdonald, K.; Anderson, R.P.; Carnaval, A. Bioclimatic variables derived from remote sensing: Assessment and application for species distribution modelling. Methods Ecol. Evol. 2014, 5, 1033–1042. [Google Scholar] [CrossRef]
- Anderson-Teixeira, K.J.; Miller, A.D.; Mohan, J.E.; Hudiburg, T.W.; Duval, B.D.; DeLucia, E.H. Altered dynamics of forest recovery under a changing climate. Glob. Chang. Biol. 2013, 19, 2001–2021. [Google Scholar] [CrossRef]
- Lebourgeois, F.; Rathgeber, C.B.K.; Ulrich, E. Sensitivity of French temperate coniferous forests to climate variability and extreme events (Abies alba, Picea abies and Pinus sylvestris). J. Veg. Sci. 2010, 21, 364–376. [Google Scholar] [CrossRef]
- Bertini, G.; Amoriello, T.; Fabbio, G.; Piovosi, M. Forest growth and climate change: Evidences from the ICP-Forests intensive monitoring in Italy. IForest 2011, 4, 262–267. [Google Scholar] [CrossRef]
- Parmesan, C.; Yohe, G. A globally coherent fingerprint of climate change impacts across natural systems. Nature 2003, 421, 37–42. [Google Scholar] [CrossRef] [PubMed]
- Cornes, R.C.; van der Schrier, G.; Squintu, A.A. A reappraisal of the thermal growing season length across Europe. Int. J. Climatol. 2019, 39, 1787–1795. [Google Scholar] [CrossRef]
- Menzel, A.; Jakobi, G.; Ahas, R.; Scheifinger, H.; Estrella, N. Variations of the climatological growing season (1951–2000) in Germany compared with other countries. Int. J. Climatol. 2003, 23, 793–812. [Google Scholar] [CrossRef]
- Graczyk, D.; Kundzewicz, Z.W. Changes of temperature-related agroclimatic indices in Poland. Theor. Appl. Climatol. 2016, 124, 401–410. [Google Scholar] [CrossRef]
- Spiecker, H. Overview of Recent Growth Trends in European Forests. In Forest Growth Responses to the Pollution Climate of the 21st Century; Springer: Dordrecht, The Netherlands, 1999; Volume 116, pp. 33–46. [Google Scholar] [CrossRef]
- Pretzsch, H. Forest Dynamics, Growth and Yield; Springer: Berlin/Heidelberg, Germany, 2010; ISBN 978-3-540-88306-7. [Google Scholar]
- Lenoir, J.; Gégout, J.C.; Marquet, P.A.; De Ruffray, P.; Brisse, H. A significant upward shift in plant species optimum elevation during the 20th century. Science 2008, 320, 1768–1771. [Google Scholar] [CrossRef]
- Küchler, M.; Küchler, H.; Bedolla, A.; Wohlgemuth, T. Response of Swiss forests to management and climate change in the last 60 years. Ann. For. Sci. 2015, 72, 311–320. [Google Scholar] [CrossRef]
- Meinshausen, M.; Smith, S.J.; Calvin, K.; Daniel, J.S.; Kainuma, M.L.T.; Lamarque, J.; Matsumoto, K.; Montzka, S.A.; Raper, S.C.B.; Riahi, K.; et al. The RCP greenhouse gas concentrations and their extensions from 1765 to 2300. Clim. Chang. 2011, 109, 213–241. [Google Scholar] [CrossRef]
- Meinshausen, M.; Nicholls, Z.R.J.; Lewis, J.; Gidden, M.J.; Vogel, E.; Freund, M.; Beyerle, U.; Gessner, C.; Nauels, A.; Bauer, N.; et al. The shared socio-economic pathway (SSP) greenhouse gas concentrations and their extensions to 2500. Geosci. Model Dev. 2020, 13, 3571–3605. [Google Scholar] [CrossRef]
- Pretzsch, H.; Biber, P.; Durskı, J.; Ďurský, J.; Durskı, J. The single tree-based stand simulator SILVA: Construction, application and evaluation. For. Ecol. Manage. 2002, 162, 3–21. [Google Scholar] [CrossRef]
- Fabrika, M. Simulátor Biodynamiky Lesa SIBYLA. Koncepcia, Konštrukcia a Programové Riešenie; Habilitacná práca; Technická univerzita vo Zvolene: Zvolen, Slovakia, 2005. [Google Scholar]
- Fabrika, M.; Ďurský, J. Implementing tree growth models in Slovakia. In Sustainable Forest Management: Growth Models for Europe; Hasenauer, H., Ed.; Springer: Berlin/Heidelberg, Germany, 2006; pp. 315–341. ISBN 3540260986. [Google Scholar]
- Chmielewski, F.M.; Rötzer, T. Response of tree phenology to climate change across Europe. Agric. For. Meteorol. 2001, 108, 101–112. [Google Scholar] [CrossRef]
- Schwartz, M.D.; Ahas, R.; Aasa, A. Onset of spring starting earlier across the Northern Hemisphere. Glob. Chang. Biol. 2006, 12, 343–351. [Google Scholar] [CrossRef]
- Fu, Y.H.; Piao, S.; Op de Beeck, M.; Cong, N.; Zhao, H.; Zhang, Y.; Menzel, A.; Janssens, I.A. Recent spring phenology shifts in western Central Europe based on multiscale observations. Glob. Ecol. Biogeogr. 2014, 23, 1255–1263. [Google Scholar] [CrossRef]
- Kolářová, E.; Nekovář, J.; Adamík, P. Long-term temporal changes in central European tree phenology (1946−2010) confirm the recent extension of growing seasons. Int. J. Biometeorol. 2014, 58, 1739–1748. [Google Scholar] [CrossRef]
- Danielewska, A.; Urbaniak, M.; Olejnik, J. Growing season length as a key factor of cumulative net ecosystem exchange overthe pine forest ecosystems in Europe. Int. Agrophysics 2015, 29, 129–135. [Google Scholar] [CrossRef]
- Menzel, A. Trends in phenological phases in Europe between 1951 and 1996. Int. J. Biometeorol. 2000, 44, 76–81. [Google Scholar] [CrossRef]
- Iverson, L.R.; Prasad, A.M.; Matthews, S.N.; Peters, M.P. Lessons Learned While Integrating Habitat, Dispersal, Disturbance, and Life-History Traits into Species Habitat Models Under Climate Change. Ecosystems 2011, 14, 1005–1020. [Google Scholar] [CrossRef]
- McKenney, D.W.; Pedlar, J.H.; Lawrence, K.; Campbell, K.; Hutchinson, M.F. Potential Impacts of Climate Change on the Distribution of North American Trees. Bioscience 2007, 57, 939–948. [Google Scholar] [CrossRef]
- Linderholm, H.W.; Walther, A.; Chen, D. Twentieth-century trends in the thermal growing season in the Greater Baltic Area. Clim. Chang. 2008, 87, 405–419. [Google Scholar] [CrossRef]
- Ahas, R.; Aasa, R.; Menzel, A.; Fedotova, V.G.; Scheifinger, H. Changes in European spring phenology. Int. J. Climatol. 2002, 22, 1727–1738. [Google Scholar] [CrossRef]
- Xu, L.; Myneni, R.B.; Chapin, F.S.; Callaghan, T.V.; Pinzon, J.E.; Tucker, C.J.; Zhu, Z.; Bi, J.; Ciais, P.; Tømmervik, H.; et al. Temperature and vegetation seasonality diminishment over northern lands. Nat. Clim. Chang. 2013, 3, 581–586. [Google Scholar] [CrossRef]
- Cui, L.; Shi, J.; Ma, Y. A Comparison of Thermal Growing Season Indices for the Northern China during 1961-2015. Adv. Meteorol. 2017, 2017, 6718729. [Google Scholar] [CrossRef]
- Linderholm, H.W. Growing season changes in the last century. Agric. For. Meteorol. 2006, 137, 1–14. [Google Scholar] [CrossRef]
- Seeman, J.Y.; Chirkov, I.; Lomas, J.; Primault, B. Agrometeorology; Springer: Berlin/Heidelberg, Germany; New York, NY, USA, 1979. [Google Scholar]
- Duursma, R.A.; Landsberg, J.; Sands, P. Physiological ecology of forest production: Principles, processes, and models. Tree Physiol. 2011, 31, 680–681. [Google Scholar] [CrossRef]
- Primault, B. Temperature data used to determine a theoretical start to forest tree growth in spring. Theor. Appl. Climatol. 1992, 45, 139–143. [Google Scholar] [CrossRef]
- Dittmar, C.; Elling, W. Phenological phases of common beech (Fagus sylvatica L.) and their dependence on region and altitude in southern germany. Eur. J. For. Res. 2006, 125, 181–188. [Google Scholar] [CrossRef]
- Durło, G. Leśny okres wegetacyjny na obszarze LKP Lasy Beskidu Śląskiego. Sylwan 2010, 154, 577–584. [Google Scholar]
- Dragańska, E.; Szwejkowski, Z.; Cymes, I.; Panfil, M. Charakterystyka leśnego okresu wegetacyjnego w Polsce na podstawie wybranego scenariusza zmian klimatu. Sylwan 2017, 161, 303–311. [Google Scholar]
- Kossowska-Cezak, U.; Martyn, D.; Olszewski, K.; Kopacz−Lembowicz, M. Meteorologia i Klimatologia. Pomiary, Obserwacje, Opracowania; PWN: Warszawa, Poland, 2000. [Google Scholar]
- Fick, S.E.; Hijmans, R.J.; Fick, S.E. WorldClim 2: New 1-km spatial resolution climate surfaces for global land areas. Int. J. Climatol. 2017, 37, 4302–4315. [Google Scholar] [CrossRef]
- Wango, T.J.L.; Musiega, D.; Mundia, C.N. Assessing the Suitability of the WorldClim Dataset for Ecological Studies in Southern Kenya. J. Geogr. Inf. Syst. 2018, 10, 643–658. [Google Scholar] [CrossRef][Green Version]
- Cerasoli, F.; D’Alessandro, P.; Biondi, M. WorldClim 2.1 versus WorldClim 1.4: Climatic niche and grid resolution affect between-version mismatches in Habitat Suitability Models predictions across Europe. Ecol. Evol. 2022, 12, e8430. [Google Scholar] [CrossRef]
- Liang, J.; Crowther, T.W.; Picard, N.; Wiser, S.; Zhou, M.; Alberti, G.; Schulze, E.D.; McGuire, A.D.; Bozzato, F.; Pretzsch, H.; et al. Positive biodiversity-productivity relationship predominant in global forests. Science 2016, 354, aaf8957. [Google Scholar] [CrossRef]
- Brandl, S.; Mette, T.; Falk, W.; Vallet, P.; Rötzer, T.; Pretzsch, H. Static site indices from different national forest inventories: Harmonization and prediction from site conditions. Ann. For. Sci. 2018, 75, 59. [Google Scholar] [CrossRef]
- Team, R.C. R: A Language and Environment for Statistical Computing 2022; R Foundation for Statistical Computing: Vienna, Austria, 2022. [Google Scholar]
- Czernecki, B.; Glogowski, A.; Nowosad, J. Climate: An R package to access free in-situ meteorological and hydrological datasets for environmental assessment. Sustainability 2020, 12, 394. [Google Scholar] [CrossRef]
- Harris, I.; Jones, P.D.; Osborn, T.J.; Lister, D.H. Updated high-resolution grids of monthly climatic observations—the CRU TS3.10 Dataset. Int. J. Climatol. 2014, 34, 623–642. [Google Scholar] [CrossRef]
- Tomczyk, A.M.; Szyga–Pluta, K. Period of Intense Vegetation in Poland in the Years 1966–2015. Badania Fizjogr. Ser. A Geogr. Fiz. 2018, 9, 239–248. [Google Scholar] [CrossRef]
- Tomczyk, A.M.; Szyga-Pluta, K. Variability of thermal and precipitation conditions in the growing season in Poland in the years 1966–2015. Theor. Appl. Climatol. 2019, 135, 1517–1530. [Google Scholar] [CrossRef]
- Czernecki, B.; Miętus, M. The thermal seasons variability in Poland, 1951–2010. Theor. Appl. Climatol. 2017, 127, 481–493. [Google Scholar] [CrossRef]
- Hastie, T.J.; Tibshirani, R.J. Generalized additive models. Gen. Addit. Model. 2017, 4, 249–307. [Google Scholar]
- Wood, S.N. Fast stable restricted maximum likelihood and marginal likelihood estimation of semiparametric generalized linear models. J. R. Stat. Soc. Ser. B Stat. Methodol. 2011, 73, 3–36. [Google Scholar] [CrossRef]
- Fasiolo, M.; Nedellec, R.; Goude, Y.; Wood, S.N. Scalable visualisation methods for modern Generalized Additive Models. J. Comput. Graph. Stat. 2018, 29, 78–86. [Google Scholar] [CrossRef]
- Haylock, M.R.; Hofstra, N.; Klein Tank, A.M.G.; Klok, E.J.; Jones, P.D.; New, M. A European daily high-resolution gridded data set of surface temperature and precipitation for 1950–2006. J. Geophys. Res. Atmos. 2008, 113, 20119. [Google Scholar] [CrossRef]
- Muñoz, E.; Álvarez, C.; Billib, M.; Arumí, J.L.; Rivera, D. Comparison of Gridded and Measured Rainfall Data for Basin-scale Hydrological Studies. Chil. J. Agric. Res. 2011, 71, 459–468. [Google Scholar] [CrossRef][Green Version]
- Schamm, K.; Ziese, M.; Becker, A.; Finger, P.; Meyer-Christoffer, A.; Schneider, U.; Schröder, M.; Stender, P. Global gridded precipitation over land: A description of the new GPCC First Guess Daily product. Earth Syst. Sci. Data 2014, 6, 49–60. [Google Scholar] [CrossRef]
- Chojnacka-Ożga, L.; Ożga, W.; Bolibok, L. Ocena przydatności danych gridowych w badaniach dendroklimatologicznych. Stud. I Mater. CEPL W Rogowie R. 2016, 18, 71–79. [Google Scholar]
- Kożuchowski, K.; Degirmendžić, J. Contemporary changes of climate in Poland: Trends and variation in thermal and solar conditions related to plant vegetation. Polish J. Ecol. 2005, 53, 283–297. [Google Scholar]
- Tomczyk, A.M.; Szyga-Pluta, K. Okres wegetacyjny w Polsce w latach 1971-2010. Prz. Geogr. 2016, 88, 75–86. [Google Scholar] [CrossRef]
- Nieróbca, A.; Kozyra, J.; Żyłowska, K.; Wróblewska, E. Changing length of the growing season in Poland. Woda-Sr. -Obsz. Wiej. 2013, 13, 81–94. [Google Scholar]
- Kijowska, M. Charakterystyka okresu wegetacyjnego w Szymbarku w latach 1968–2009. Rocz. Świętokrzyski. Ser. B Nauk. Przyr. 2010, 31, 29–43. [Google Scholar]
- Tylkowski, J. The variability of climatic vegetative seasons and thermal resources at the polish baltic sea coastline in the context of potential composition of coastal forest communities. Balt. For. 2015, 21, 73–82. [Google Scholar]
- Feliksik, E.; Wilczyński, S.; Durło, G. Variability of air temperatures of the temperate climatic belt of the Beskid Sądecki mountains in the period 1971-2000 as exemplified by the climatological station in Kopciowa. EJPAU Ser. For. 2001, 4, 1–17. [Google Scholar]
- Allen, C.D.; Breshears, D.D.; Mcdowell, N.G.; Allen, C.; Breshears, D.D.; Mcdowell, N.G. On underestimation of global vulnerability to tree mortality and forest die-off from hotter drought in the Anthropocene. Ecosphere 2015, 6, 1–55. [Google Scholar] [CrossRef]
- De Wergifosse, L.; André, F.; Goosse, H.; Caluwaerts, S.; de Cruz, L.; de Troch, R.; Van Schaeybroeck, B.; Jonard, M. CO2 fertilization, transpiration deficit and vegetation period drive the response of mixed broadleaved forests to a changing climate in Wallonia. Ann. For. Sci. 2020, 77, 70. [Google Scholar] [CrossRef]
- Kauppi, P.E.; Ciais, P.; Högberg, P.; Nordin, A.; Lappi, J.; Lundmark, T.; Wernick, I.K. Carbon benefits from Forest Transitions promoting biomass expansions and thickening. Glob. Chang. Biol. 2020, 26, 5365. [Google Scholar] [CrossRef]
- Wang, Y.; Shen, X.; Tong, S.; Zhang, M.; Jiang, M.; Lu, X. Aboveground Biomass of Wetland Vegetation Under Climate Change in the Western Songnen Plain. Front. Plant Sci. 2022, 13, 2068. [Google Scholar] [CrossRef]
- Song, X.; Li, F.; Harrison, S.P.; Luo, T.; Arneth, A.; Forrest, M.; Hantson, S.; Lasslop, G.; Mangeon, S.; Ni, J.; et al. Vegetation biomass change in China in the 20th century: An assessment based on a combination of multi-model simulations and field observations. Environ. Res. Lett. 2020, 15, 094026. [Google Scholar] [CrossRef]
- Feliksik, E.; Durło, G. Climatological characterisation of the area of the Carpathian Regional Gene Bank in the Wisła Forest District. Dendrobiology 2004, 51, 43–51. [Google Scholar]
- Socha, J.; Tyminska-Czabanska, L.; Grabska, E.; Orzeł, S. Site index models for main forest-forming tree species in poland. Forests 2020, 11, 301. [Google Scholar] [CrossRef]
- Bałazy, R.; Zasada, M.; Ciesielski, M.; Waraksa, P.; Zawiła-Niedźwiecki, T. Forest dieback processes in the Central European Mountains in the context of terrain topography and selected stand attributes. For. Ecol. Manag. 2019, 435, 106–119. [Google Scholar] [CrossRef]
- Hunziker, S.; Begert, M.; Scherrer, S.C.; Rigling, A.; Gessler, A. Below Average Midsummer to Early Autumn Precipitation Evolved Into the Main Driver of Sudden Scots Pine Vitality Decline in the Swiss Rhône Valley. Front. For. Glob. Chang. 2022, 5, 103. [Google Scholar] [CrossRef]
- Garamvölgyi, Á.; Hufnagel, L. Impacts of climate change on vegetation distribution No. 1: Climate change induced vegetation shifts in the palearctic region. Appl. Ecol. Environ. Res. 2013, 11, 79–122. [Google Scholar] [CrossRef]
- Pickell, P.D.; Hermosilla, T.; Coops, N.C.; Masek, J.G.; Franks, S.; Huang, C. Monitoring anthropogenic disturbance trends in an industrialized boreal forest with Landsat time series. Remote Sens. Lett. 2014, 5, 783–792. [Google Scholar] [CrossRef]
- Chakraborty, A. Mountains as vulnerable places: A global synthesis of changing mountain systems in the Anthropocene. GeoJournal 2019, 86, 585–604. [Google Scholar] [CrossRef]
- Loreau, M.; Naeem, S.; Inchausti, P.; Bengtsson, J.; Grime, J.P.; Hector, A.; Hooper, D.U.; Huston, M.A.; Raffaelli, D.; Schmid, B.; et al. Ecology: Biodiversity and ecosystem functioning: Current knowledge and future challenges. Science 2001, 294, 804–808. [Google Scholar] [CrossRef]
- Yachi, S.; Loreau, M. Biodiversity and ecosystem productivity in a fluctuating environment: The insurance hypothesis. Proc. Natl. Acad. Sci. USA 1999, 96, 1463–1468. [Google Scholar] [CrossRef]
Publisher’s Note: MDPI stays neutral with regard to jurisdictional claims in published maps and institutional affiliations. |
© 2022 by the authors. Licensee MDPI, Basel, Switzerland. This article is an open access article distributed under the terms and conditions of the Creative Commons Attribution (CC BY) license (https://creativecommons.org/licenses/by/4.0/).