Article

Tree-Ring Stable Carbon Isotope-Based Mean Maximum Temperature Reconstruction in Northwest China and Its Connection with Atmospheric Circulations

1
Institute of Global Environmental Change, Xi’an Jiaotong University, Xi’an 710049, China
2
College of Bioscience and Engineering, Xingtai University, Xingtai 054001, China
3
State Key Laboratory of Loess and Quaternary Geology, Institute of Earth Environment, Chinese Academy of Sciences, Xi’an 710061, China
4
CAS Center for Excellence in Quaternary Science and Global Change, Xi’an 710061, China
5
School of Human Settlements and Civil Engineering, Xi’an Jiaotong University, Xi’an 710049, China
*
Author to whom correspondence should be addressed.
Forests 2022, 13(11), 1815; https://doi.org/10.3390/f13111815
Submission received: 6 September 2022 / Revised: 22 October 2022 / Accepted: 27 October 2022 / Published: 31 October 2022
(This article belongs to the Special Issue Forest Climate Change Revealed by Tree Rings and Remote Sensing)

Abstract

:
The inter-annual stable carbon isotope ratio (δ13C) of three tree-ring cores of P. euphratica (Populus euphratica Oliv.) was determined from Ejina Oasis in Northwest China. A robust and representative δ13C chronology is generated from the three δ13C series using an arithmetic mean method. After eliminating the influence of the δ13C from elevated atmospheric carbon dioxide (CO2) concentration, we obtained a carbon isotopic discrimination (Δ13C) chronology. According to the significant correlation between the tree-ring Δ13C and instrumental data, we reconstructed the mean maximum temperature anomalies from previous December to current September (TDS) for the period 1901–2011. The reconstruction explained 43.6% of the variance over the calibration period. Three high-temperature periods (1929–1965, 1972–1974, and 1992–2006) and three low-temperature periods (1906–1926, 1966–1968, and 1975–1991) were found in the reconstructed series. Comparisons between the reconstructed TDS and the observed mean temperature from previous December to current September in Anxi meteorological station and the temperature index in north-central China demonstrated the reconstructed TDS has the advantage of reliability and stability. The significant spatial correlation declared that the reconstruction has a broad spatial representation and can represent the temperature variation characteristics in a wide geographical area. In addition, we found that the area of Ejina Oasis is smaller (larger) when the mean maximum temperature is higher (lower), which may be due to a conjunction effect of natural and anthropogenic activities. Significant periodicities and correlations suggested that the TDS variations in Ejina Oasis were regulated by solar radiation and atmospheric circulations at the interannual and interdecadal time scales.

1. Introduction

With climate change, frequent and diverse climate disasters have a marked impact on Chinese society, people’s production and life, and lead to serious harm and huge economic losses [1]. To reduce the loss of climate disasters in the future, the process and mechanism of climate change need to be understood in different regions. However, the limited observational records have limited the deepening understanding of the processes and mechanisms of regional climate change. Therefore, the other proxy data should be directly utilized to study paleoclimate change. Among all climate proxies, tree-ring stable carbon isotopes have been widely used in regional climate response and reconstructions due to high accuracy, strong continuity, and sensitivity to environmental fluctuations [2,3,4,5,6,7,8,9,10].
The influence of regional climate factors on carbon assimilation and carbon transport processes and pathways during wood formation can be more clearly understood by the stable carbon isotope composition of tree rings [11]. However, the response between stable carbon isotopes of tree rings and climate elements is different on different regions and tree species [12]. In China, the tree-ring δ13C from Sabina przewalskii Kom. in the Northeast of Tibetan Plateau and from Pinus tabulaeformis Carr. in Qinling could record the mean temperature [4,13], the tree-ring δ13C from Pinus tabulaeformis Carr. in semi-arid regions of North-Central China mainly reflected the self-calibrating Palmer drought severity index [9], and the tree-ring δ13C from Cryptomeria japonica var. sinensis Miquel in the humid regions of Southeast China is more sensitive to the mean maximum temperature and relative humidity [3,5]. So, more research needs to be done.
The Ejina Oasis is located in the core region of the Gobi Desert and is the natural ecological barrier in Northwest China. It plays a decisive role in ecological balance and social stability and economic development in Northwest China. In recent years, the ecological environment is deteriorating, and dust weather occurred frequently in Ejina Oasis because of global climate change. At present, the climate and hydrological change in Ejina oasis and its surrounding areas have attracted the attention of many researchers and relevant government departments. Some studies have been conducted to explore the response of tree-ring width [14] and stable oxygen and carbon isotope ratio [15] to climatic and hydrological changes, even some reconstruction have be done by tree-ring width [16,17] and stable oxygen isotope ratio [18] in Ejina Oasis and nearby areas. However, no reconstructed studies have investigated mean maximum temperature variation using the stable carbon isotope ratios (δ13C) of P. euphratica in the Ejina Oasis in Northwest China.
Atmospheric circulation was used to refer to the general circulation of the Earth and regional movements of air around areas of high and low pressure. It was corresponded to large-scale wind systems arranged in several east-west belts that encircle the Earth, which have a large impact on climate variability and is likely to influence the frequency of extreme temperature [19]. Atmospheric circulation could affect the regional distributions of temperature in the European countries [20] and the mean maximum temperature in Northeast and Northwest of China [21,22]. However, little is known about whether atmospheric circulation have affected mean maximum temperature variations in the Ejina Oasis, mainly because of the shortness of the instrumental records. Therefore, it is necessary to reconstruct the mean maximum temperature and investigate possible links between the reconstructed and large-scale atmospheric circulations in the Ejina Oasis in Northeast China.
The purposes of this study were (1) to analyze the variation characteristics of the δ13C series from P. euphratica tree-ring in Ejina Oasis, (2) to reconstruct a seasonal mean maximum temperature anomalies over the past 111 years by tree-ring carbon isotopic discrimination (Δ13C) in Ejina Oasis, (3) to investigate possible links between the reconstructed temperature and large-scale atmospheric circulations and to further understand the spatial and temporal characteristics of the mean maximum temperature in the study area.

2. Materials and Methods

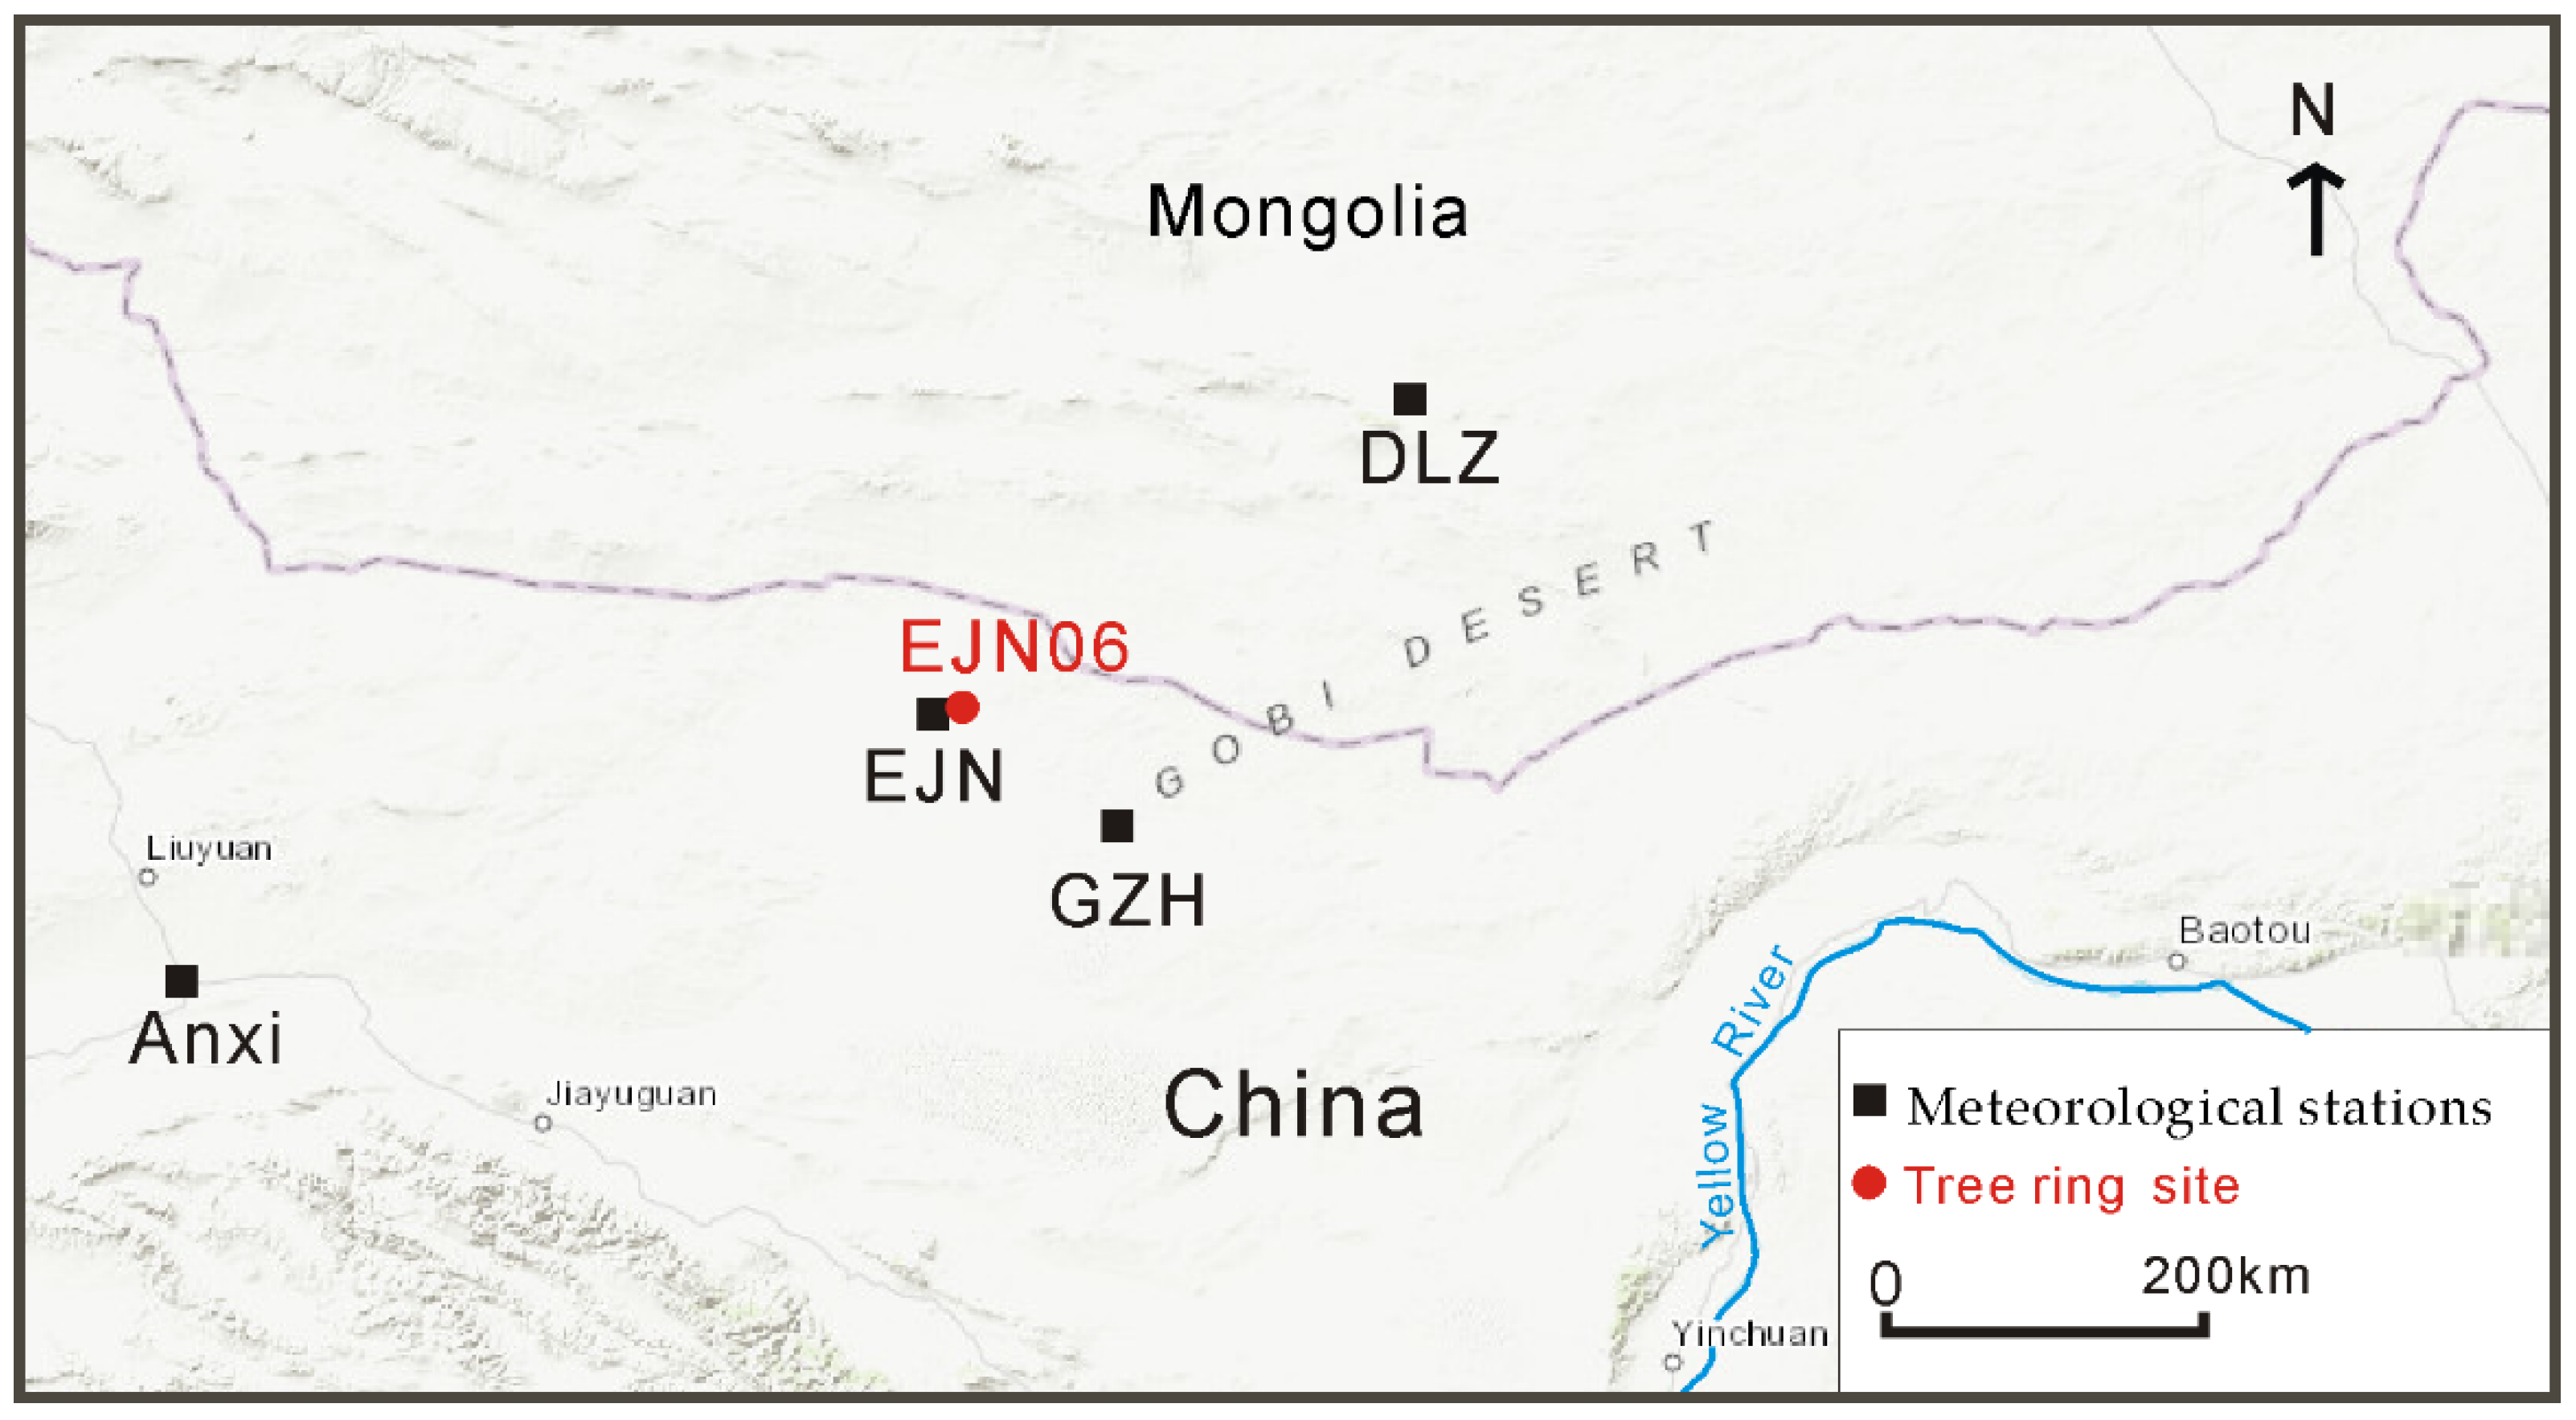
2.1. The Study Site and Sampling

Ejina Oasis (39.87°–42.78° N, 97.16°–103.12° E) is the largest oasis in the lower reaches of Heihe River [18] and has an area of around 703 km2, with an altitude of 898–1958 m. The Heihe River, which spans more than 820 km, originates in the section of the Qilian Mountains. It is the only water source for the Ejina River in the lower reaches and the main recharge water source for the riparian phreatic aquifer [23]. Ejina oasis is located in the heart of the Gobi Desert and is steered by the strong Siberian (Mongolia-Siberian) high pressure in winter and the westerlies in Summer, with a typical temperate continental climate. There was plenty of light, little rain, strong winds, and frequent disastrous sandstorm weather. Most of the land is desert in Ejina Oasis, with gray-brown desert soil, serious salinization, desertification, and wind erosion. The riparian P. euphratica forest is the only natural tree in Ejina Oasis, which is the second largest distribution area of P. euphratica forest in China, behind the Tarim River, and is also one of the three remaining P. euphratica forest areas in the world [14].
Based on the International Tree-Ring Database (ITRDB) standard, a group of P. euphratica cores was collected in 2011, from a sandy site that was far from the Ejina river, and was named EJN06 (41.99° N, 101.25° E, altitude 923 m) (Figure 1). There was sparse vegetation and less competition at the sampling site. The canopy coverage was 40% and each tree was away from the other more than 20 m, with mean tree height 22 m and mean crown width 7.2 m. The samples were dried, surfaced, polished, cross-dated, and then measured to within 0.01 mm using Lintab 6 measuring system.

2.2. The Developing of Stable Carbon Isotope Chronology

Based on the accurate dating, three cores (06-01B, 06-03B, and 06-04A) from three trees, with long tree age, clear boundary, and no abnormal growth, were selected for the cellulose δ13C analyses of tree-ring. According to the characteristics of phenology and physiological ecology of P. euphratica in Ejina, the age of the young trees was less than 10 years [24]. Meanwhile, Kang (1970) have found that the age range of young P. euphratica is between 1 and 15a [25]. Therefore, to eliminate the effects of juvenile effect of tree-ring δ13C [26], each core was separately analyzed for the period 1901–2011, removing at least 15 years from each core that had grown before 1901. The cores were divided into thin segments using a scalpel year by year. After drying, the α-cellulose of the annual ring was extracted by chlorination, bleaching, alkali washing, and other processes using the Jayme-Wise procedure. Then the α-cellulose was homogenized and freeze-dried [4,5,27]. The ratio of 13C to 12C was determined by an elements analysis instrument (Flash 2000) and a stable isotope mass spectrometer (Delta V Advantage). And the analytical results were expressed as δ13C, and tree-ring δ13C was calculated from the following equation:
δ13C = (Rsp/Rsd − 1) ×1000
where Rsp and Rsd are the ratios of 13C to 12C in the sample and standard, respectively.
Some studies have shown that the CO2 concentration has been a marked rise in the atmosphere since the industrial revolution owing to the massive use of fossil fuels [28], which cause tree-ring δ13C change. This change is not related to climate, so the effect of rising atmospheric CO2 concentration should be eliminated when the researchers study past climate using tree-ring δ13C. Three methods can be utilized to adjust the tree-ring carbon isotope: ∆13C [29], δ13C calibration [30] and δ13C cor + 0.006‰ ppmv−1 [13]. Considering consistency and possibility in the following analysis, the ∆13C method was used in this study.
The δ13C values from ice core measurements and direct atmospheric monitoring were used as the atmospheric δ13C reference values [29], then tree-ring ∆13C was obtained by solving the following equation:
13C = (δ13Ca − δ13C tree)/(1 − δ13Ctree/1000)
where δ13Ca and δ13Ctree are the δ13C values of the atmospheric CO2 and tree-ring, respectively. The δ13C values of the atmosphere from 2004 to 2011 were obtained by the linear trend extrapolating from the existing values (1970–2003).

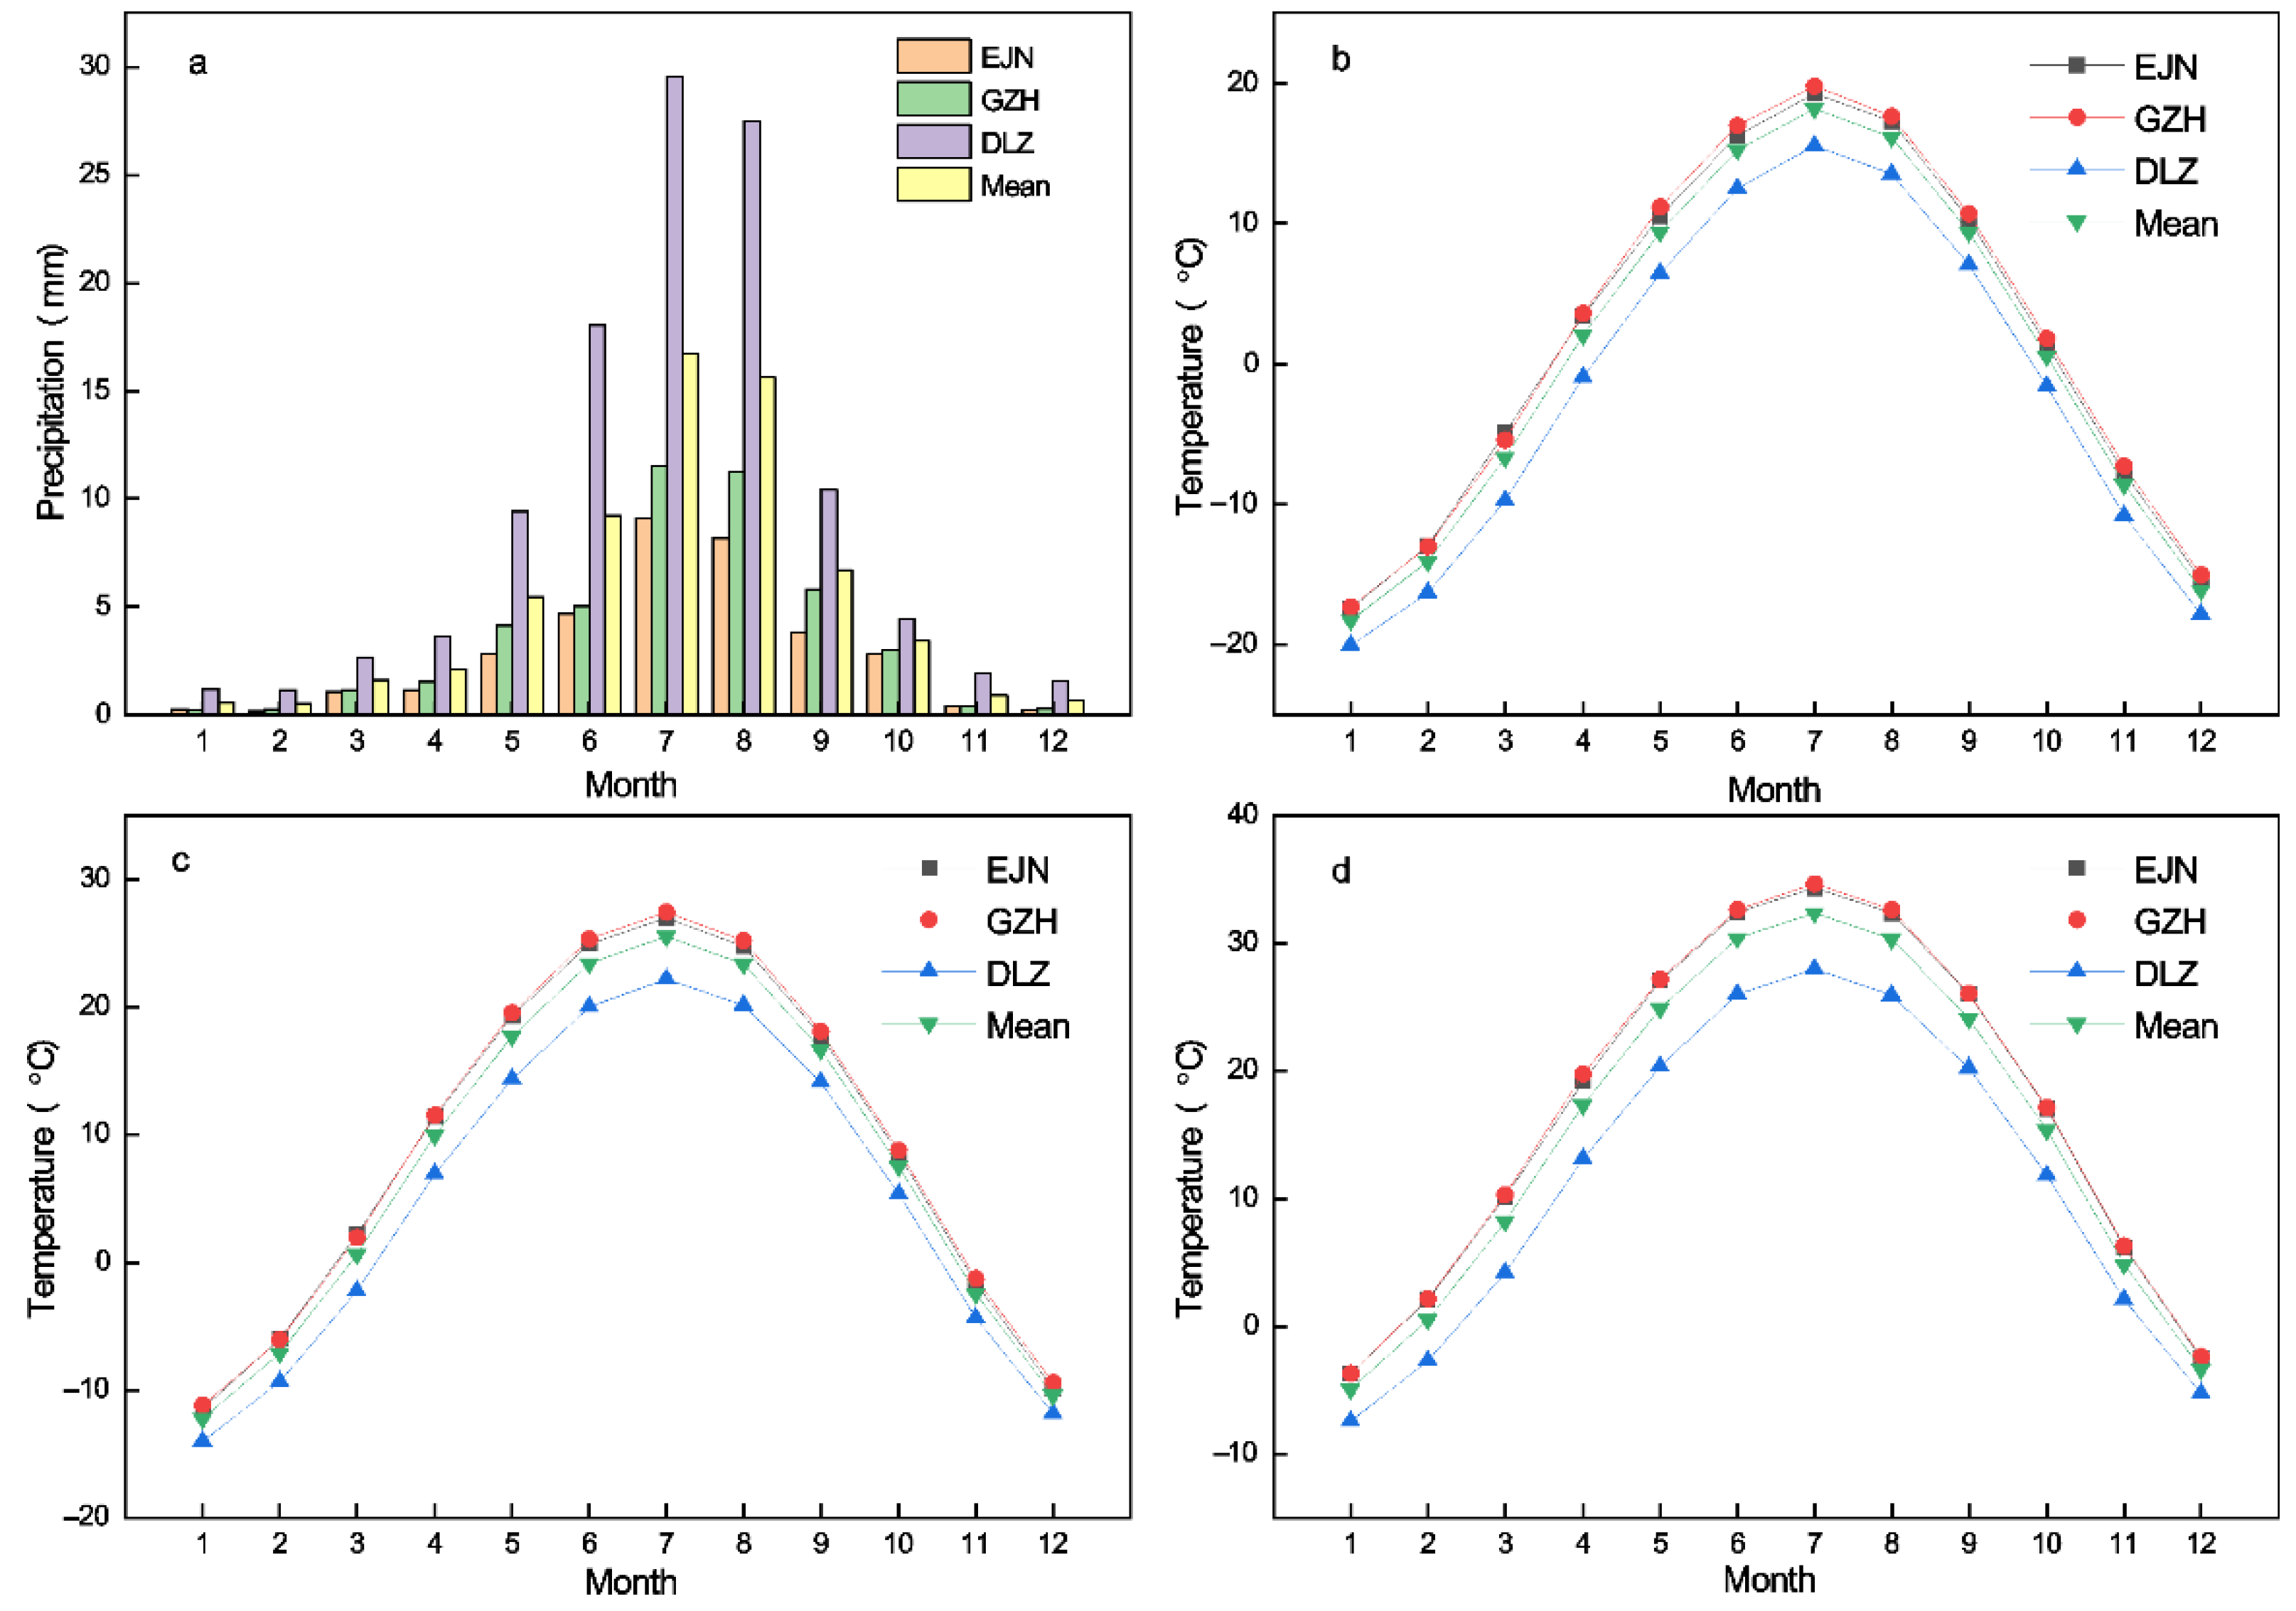
2.3. Climatic and Ejina Oasis Area Data

The observed data from three meteorological stations around the sampling site were selected: Ejina (EJN: 41.95° N, 101.06° E, 940.5 m a.s.l., 1959–2011) and Guaizihu (GZH, 41.36° N, 102.36° E, altitude: 960 m a.s.l. 1959–2011) from China, Dalanzadgad (DLZ, 104°25′ E, 43°35′ N, 1465 m a.s.l., 1973–2011) from Mongolia (Figure 2). The monthly mean temperature, mean minimum temperature, mean maximum temperature, and total precipitation of each station were used to carry out the climate responses. The observed meteorological data of EJN and GZH were collected from the China Meteorological Data Service Centre (CMDSC) (http://data.cma.cn/en) (accessed on 7 May 2022). And the observed data of DLZ were calculated by daily data from National Centers for Environmental Information (https://www.ncei.noaa.gov/maps-and-geospatial-products) (accessed on 7 May 2022). Considering the continuity and accuracy of the data from DLZ station, the meteorological data were selected during the observation period 1973–2011. The homogeneity and randomness of the observed data were tested by the standard methods [31]. The results showed that the meteorological data from these stations were available for further climate analysis. Meanwhile, the monthly patterns of the four climate factors showed a similar variation rule in all the meteorological stations (Figure 2). To reduce the impact of small-scale noise and random factors from a single station and better understand the regional climate characteristics [32,33], the final regional climate data, which were applied for further response analyses, were the simple arithmetic mean of the data from three stations.
Long-term observed mean temperature records from the Anxi (40.53° N, 95.77° E, 1177 m a.s.l., 1939–2011) meteorological station, roughly 460 km southwest of the sampling site, were ideal observational evidence for the reconstruction. The observed meteorological data of Anxi station were derived from http://climexp.knmi.nl/ (accessed on 16 May 2022 during the period 1939–1988 and from the CMDSC (http://data.cma.cn/en) (accessed on 16 May 2022) during the period 1989–2011.
To investigate possible links between the reconstructed temperature and large-scale atmospheric circulations, we also estimated the relationship between the reconstructed series and the atmospheric circulations data. The Global-SST ENSO index was collected from http://research.jisao.washington.edu/data_sets/globalsstenso/(accessed on 8 July 2022). The sunspots number were from http://www.sidc.be/silso/datafiles (accessed on 8 July 2022). The North Atlantic Oscillation (NAO) index [34], the Pacific Decadal Oscillation (PDO) index [35], the Arctic Oscillation (AO) index [36] (such as, warm season AO Surface Air Temperature index (AOTI), and Summer AO Sea Level Pressure index (AOPI)were downloaded from National Centers for Environmental Information (https://www.ncei.noaa.gov/access/paleo-search/) (accessed on 8 July 2022).
To understand the influence of temperature change on the oasis area, the reconstructed series was compared with the inter-annual area variations of Ejina Oasis for the period 1963–2012. And the area series of Ejina oasis was derived using Getdata software (http://getdata-graph-digitizer.com/) (accessed on 15 July 2022) and the published graphs from a previous paper [37].

2.4. Statistical Methods

The relationship between the tree-ring ∆13C and climate data was examined by correlation function analysis during the observation period. Considering that the growth of trees is affected by the climate of the previous and current year [38], climate variables from the previous April to current October and seasonal combinations were selected to identify the climatic effects on the tree-ring ∆13C of P. euphratica in the study region. The transfer function was established by the simple linear regression model. The consistency between the reconstructed and observed temperature data was verified via the statistical parameters [39], which included sign test (S1, S2), reduction of error (RE), and product means (t). The stability and reliability of the transfer function were assessed by Bootstrap [40] and Jackknife [41] statistical methods.
In addition, to reveal the spatial-temporal representativeness of the mean maximum temperature anomalies reconstruction, spatial correlations between both the reconstructed and observed mean maximum temperature with the globally gridded mean maximum temperature from the CRU TS4.05 network were conducted using the KNMI Climate Explorer (http://climexp.knmi.nl) (accessed on 8 July 2022) throughout 1974–2011. Due to being especially helpful for short time series, the multitaper method (MTM) was selected to perform the periodicity analysis in our reconstruction [42]. To previous TDS changes, the high (low) temperature year was defined as those years that the mean maximum temperature anomalies value was larger (smaller) than mean + σ. After an 11-year moving average, the periods of high (low) temperature were defined as the time interval with a larger (smaller) mean maximum temperature anomalies value than the mean of the total reconstruction series and spanned at least three years and often more.

3. Results

3.1. Statistical Analysis of Stable Carbon Isotope Chronology

The correlation coefficients (r) among the three sandy-site cellulose δ13C series were significant at the 0.01 level over a 111-year common period (Table 1), which indicates that the tree-ring δ13C variation pattern of each series has a good consistency. In order to reflect regional representation, the arithmetic average of the tree-ring δ13C data from three cores were used as the regional tree-ring δ13C chronology, then the regional tree-ring ∆13C chronology was established and applied in paleoclimate reconstruction. For the common period, the mean values of tree-ring δ13C and ∆13C were −25.806‰ (a scale from −27.706‰–−24.815‰) and 18.187‰ (17.492‰–19.011‰), with variable coefficients of −0.022 and 0.016 (Table 2), respectively. The first-order autocorrelation coefficients were 0.881 and 0.577, with standard deviations of 0.575 and 0.291 (Table 2), respectively.

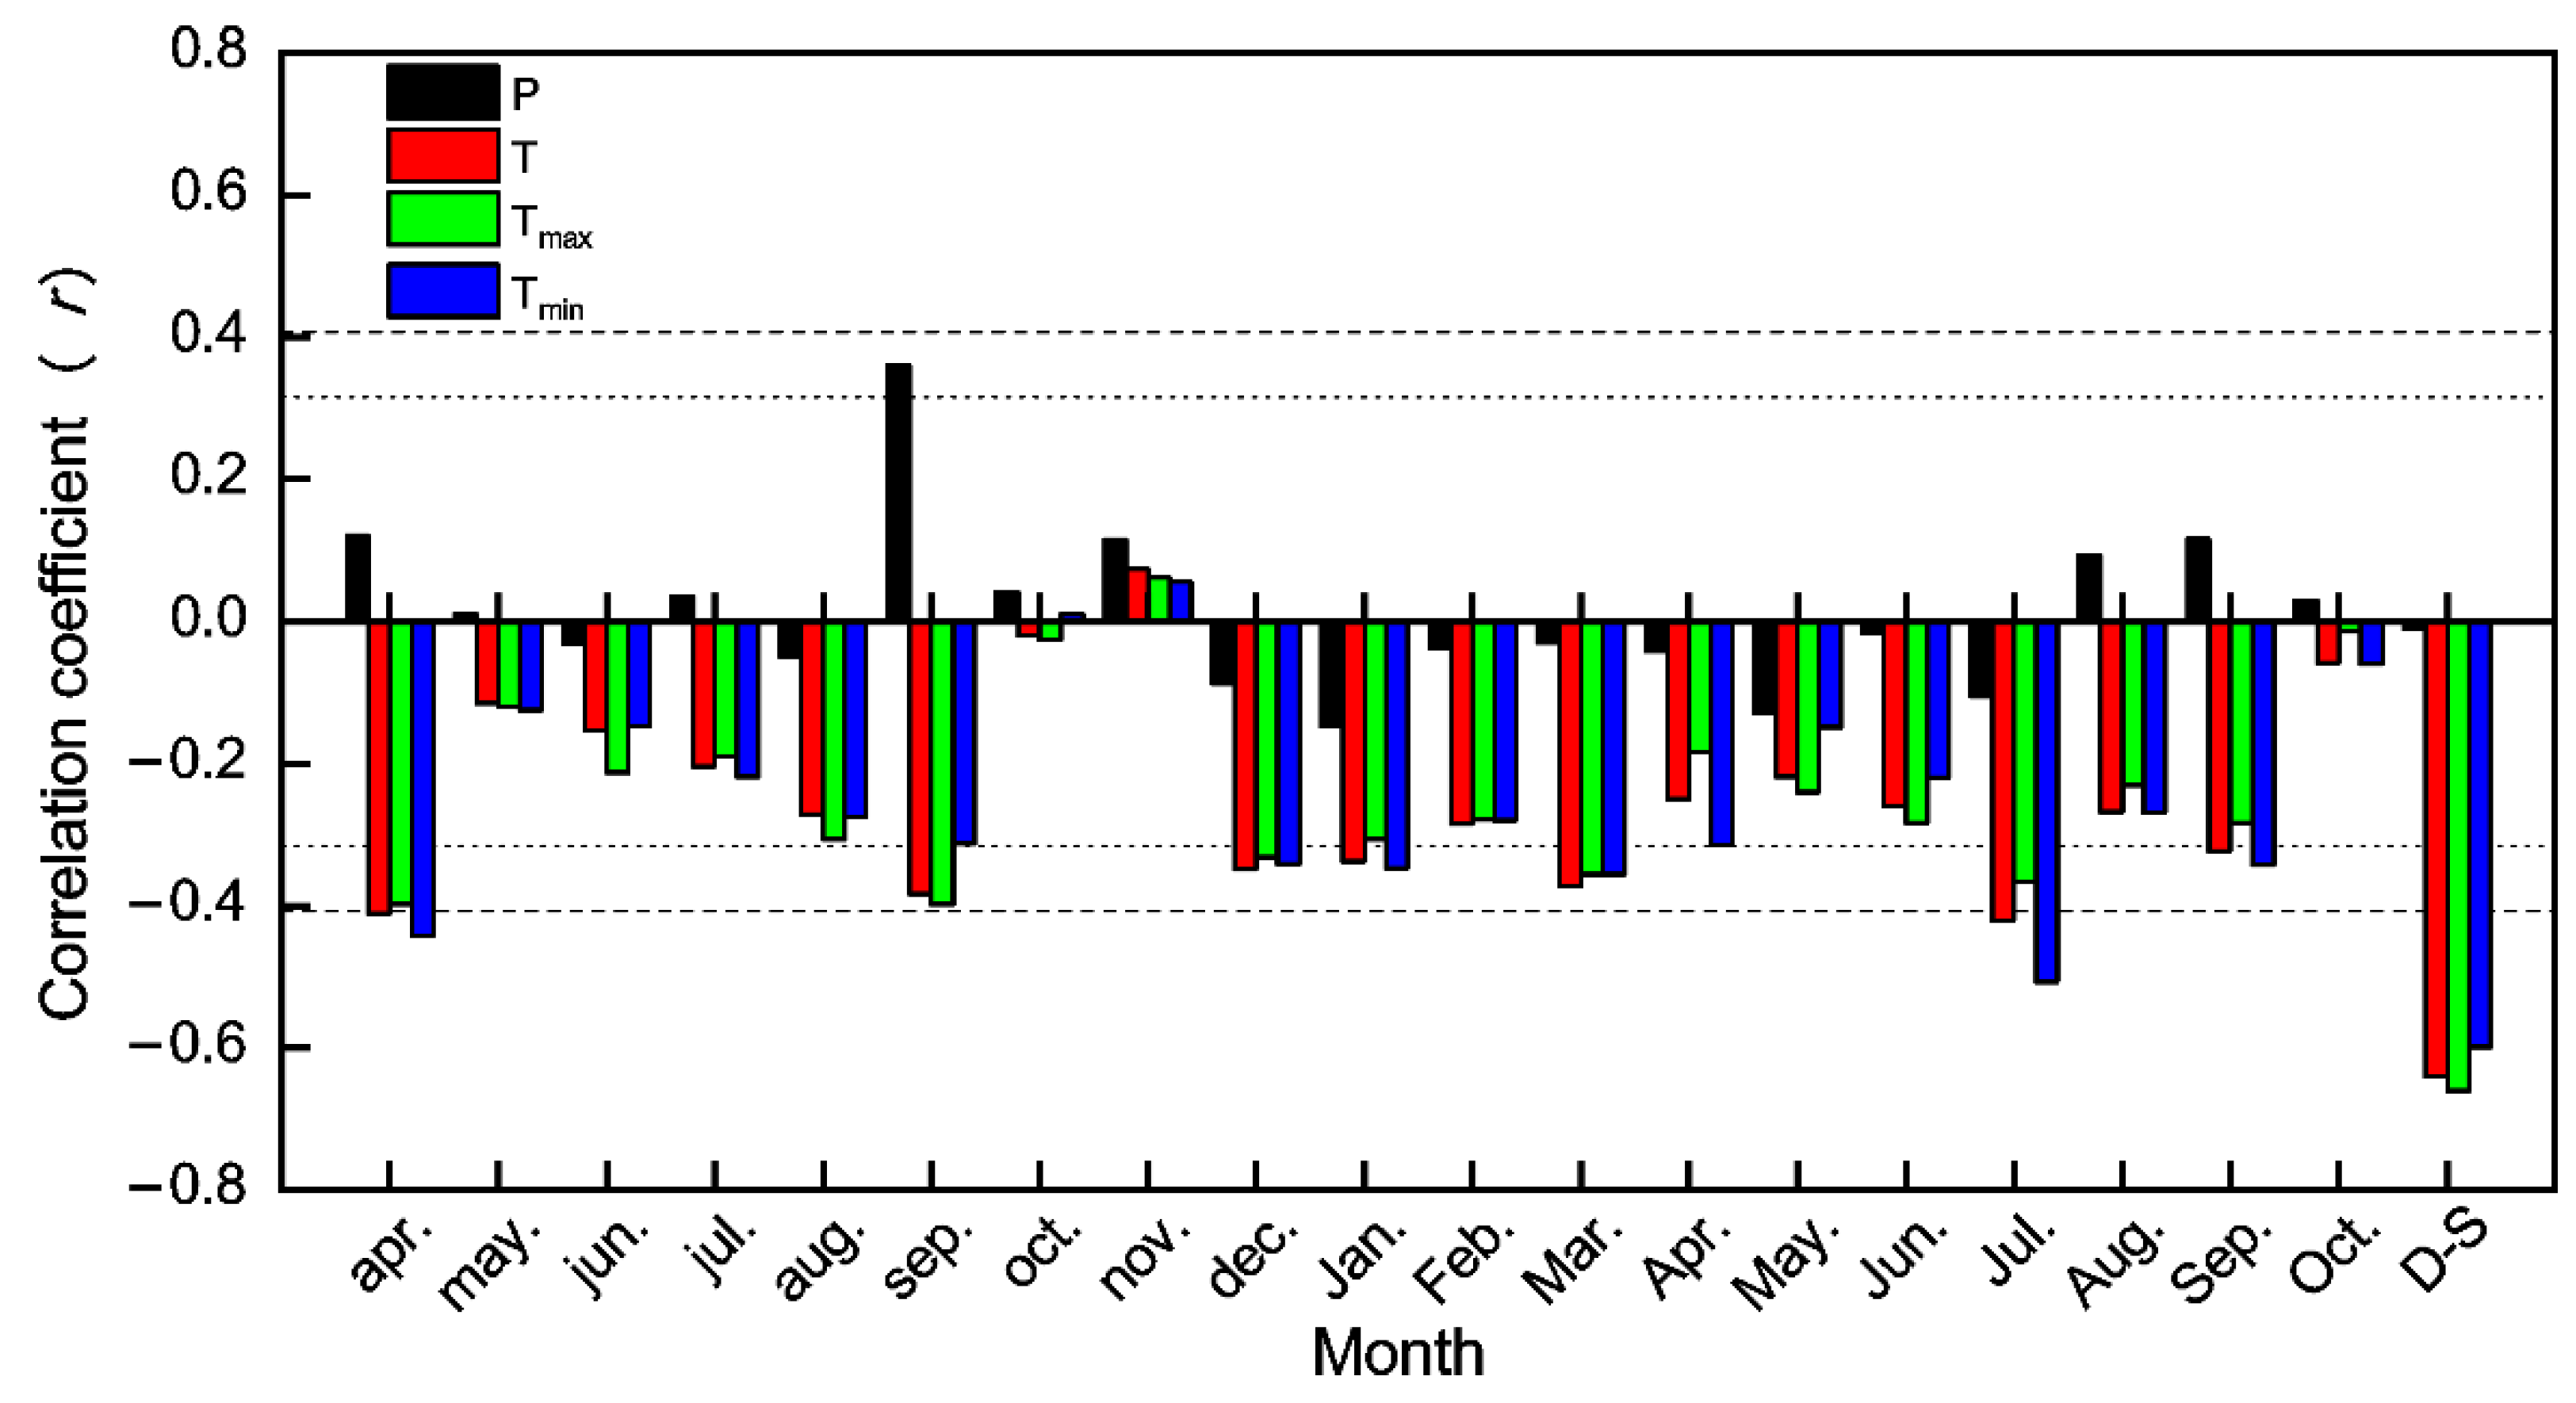
3.2. Climate Response of Tree-Ring Stable Carbon Isotope

Overall, the ∆13C chronology was negatively correlated with meteorological factors in most months, except for a few months (Figure 3). The ∆13C chronology showed a significantly positive correlation with precipitation in September (p < 0.05) and significantly negative correlations with mean temperature in April (p < 0.01), September (p < 0.05) and December (p < 0.05) of the previous year, and January (p < 0.05), March (p < 0.05) and July (p < 0.05) of the current year. There were significant negative correlations between the ∆13C chronology and mean maximum temperature in April (p < 0.05), September (p < 0.05) and December (p < 0.05) of the previous year, and March (p < 0.05) and July (p < 0.01) of the current year. Significant negative correlations were also found for the ∆13C chronology and mean minimum temperature in April (p < 0.01) and December (p < 0.05) of the previous year, and January (p < 0.05), March (p < 0.05), July (p < 0.01) and September (p < 0.05) of the current year (Figure 3). Considering that the seasonal climatic variations were often more regionally representative than monthly variations [43], the correlation coefficients were also calculated between the ∆13C chronology and seasonal climatic data from a combination of monthly data sets. Among all monthly combinations, the correlation between the ∆13C chronology and the mean maximum temperature from previous December to current September was the highest (r = −0.660, N = 38, p < 0.01), suggesting that the mean maximum temperature from previous December to current September is one of the most important limiting climate factors that influence tree-ring ∆13C.

3.3. Transfer Function and Verification

As shown in Figure 2, the temperature in DLZ was lower than that in EJN and GZH. Therefore, to avoid absolute temperature values deviation in reconstructing paleoclimate, the anomaly method was used to calculate the final regional climate data. Then the mean maximum temperature anomalies from previous December to current September (TDS) was selected for reconstruction in Ejina Oasis. The TDS was obtained by solving the following line transfer function:
TDS = −1.498 × ∆13C + 27.287
N = 38; r = 0.660; R2 = 0.436; R2adj = 0.420; F = 27.779; p < 0.0001; D/W = 1.993.
The TDS explains 43.6% of the instrumental variance during the period of 1974–2011, and it reduces to 42.0% considering the loss of freedom. The TDS reconstruction has similar variability to the instrumental data during 1974–2011 (Figure 4), with a high correlation coefficient of 0.660 (N = 38). The results showed RE is greater than zero and all other parameters were statistically significant at the 0.05 level, except S2 for the verification period from 1974 to 2011 (Table 3), indicating that the transfer function (3) is reliable and stable [39,43]. The Bootstrap and Jackknife results showed the similarity of the statistical values (such as r, R2, R2adj, F, p, and D/W) (Table 4) [44], indicating that the transfer function (3) reflects the real mean maximum temperature anomalies and is appropriate to reconstruct TDS.

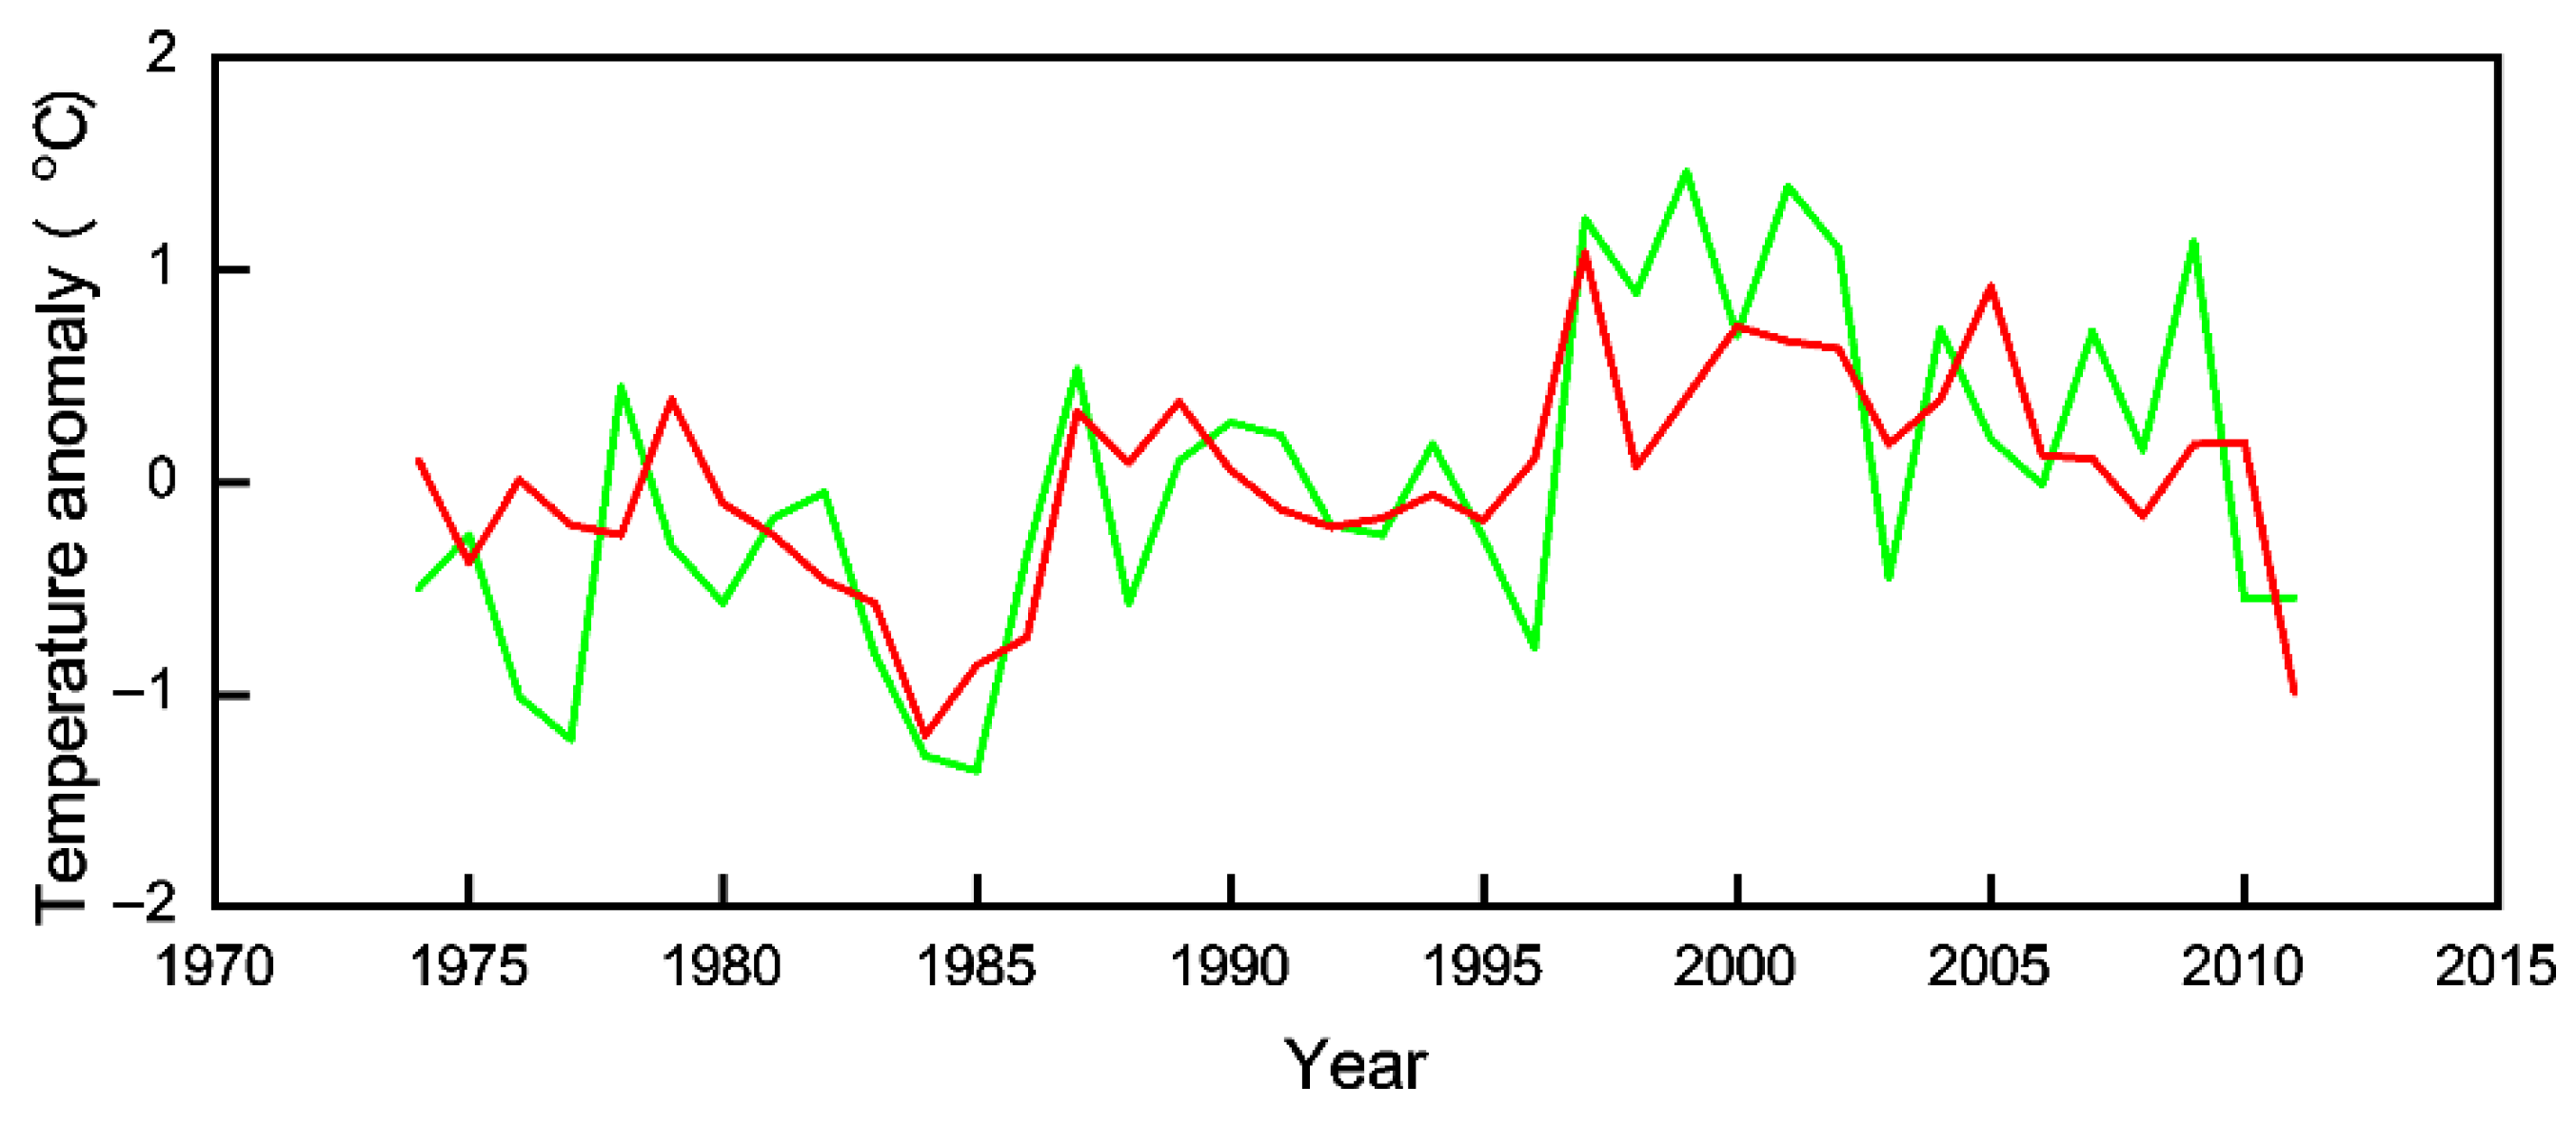
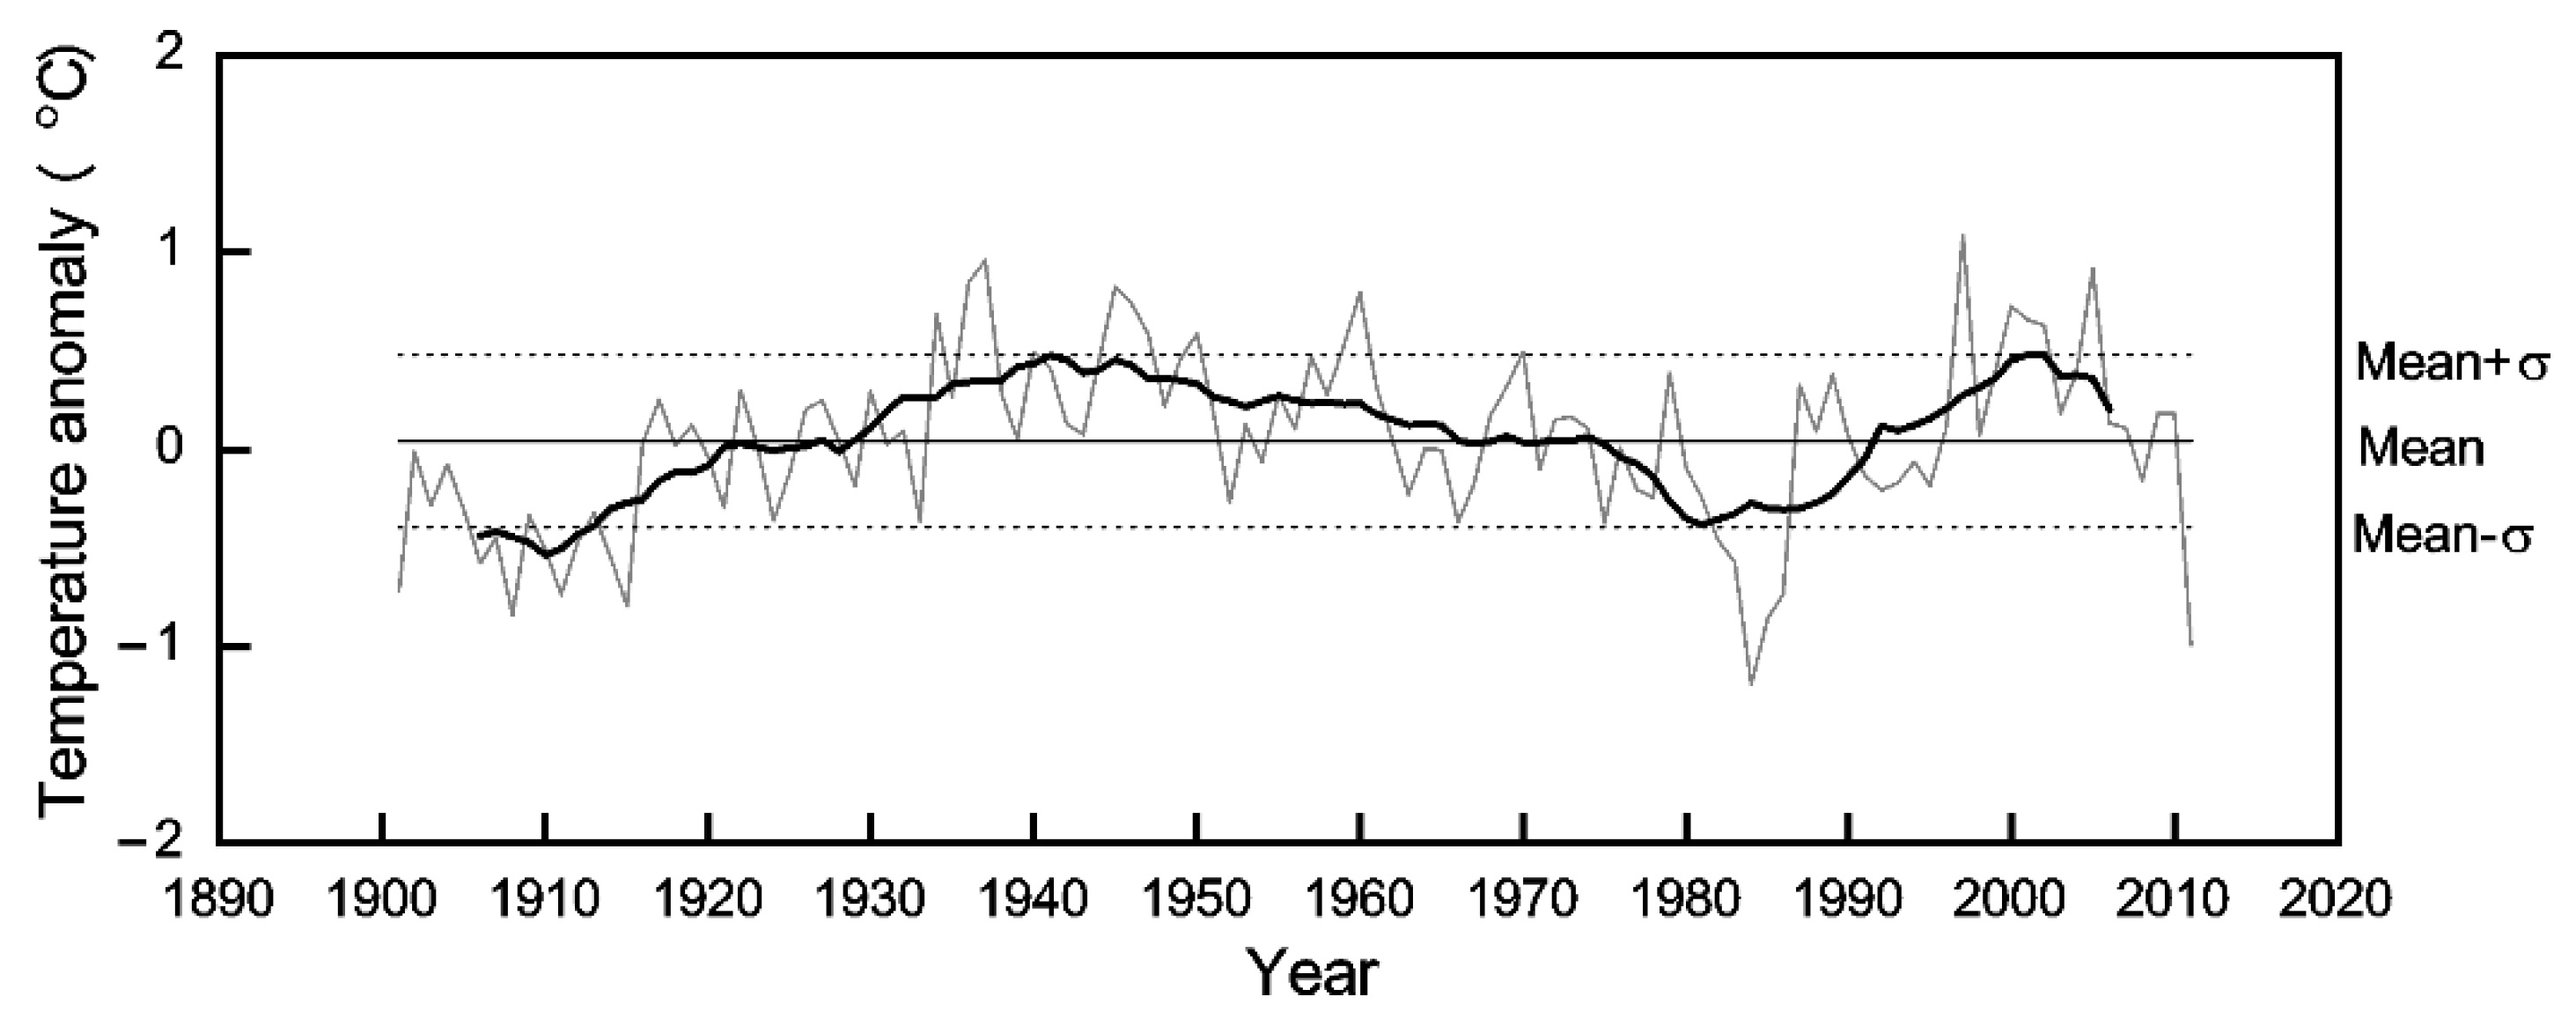
3.4. Mean Maximum Temperature Reconstruction

According to the function (3), the TDS in Ejina Oasis was reconstructed over the past 111 years (Figure 5). The mean TDS of the entire reconstruction was 0.044 °C and its standard deviation (σ) was 0.435 °C. The reconstructed TDS in the Ejina Oasis included several marked interannual and interdecadal fluctuations. On an annual scale, the reconstruction series consisted of 16 high-temperature years (14.42% of the total reconstruction series), 80 normal years (72.07%), and 15 low-temperature years (13.51%). The five highest temperature years were 1997, 1937, 2005, 1936 and 1945, and the five lowest temperature years were 1984, 2011, 1985, 1908 and 1915.
On a decadal scale, the multiyear continuous high- or low-temperature periods were analyzed for the past 111 years. There were three high-temperature periods lasting over three years: 1929–1965, 1972–1974, and 1992–2006; three low-temperature periods: 1906–1926, 1966–1968, and 1975–1991 (Figure 5). Among these periods, the longest existing high- and low-temperature periods were from 1929 to 1965 and from 1906 to 1926, respectively.

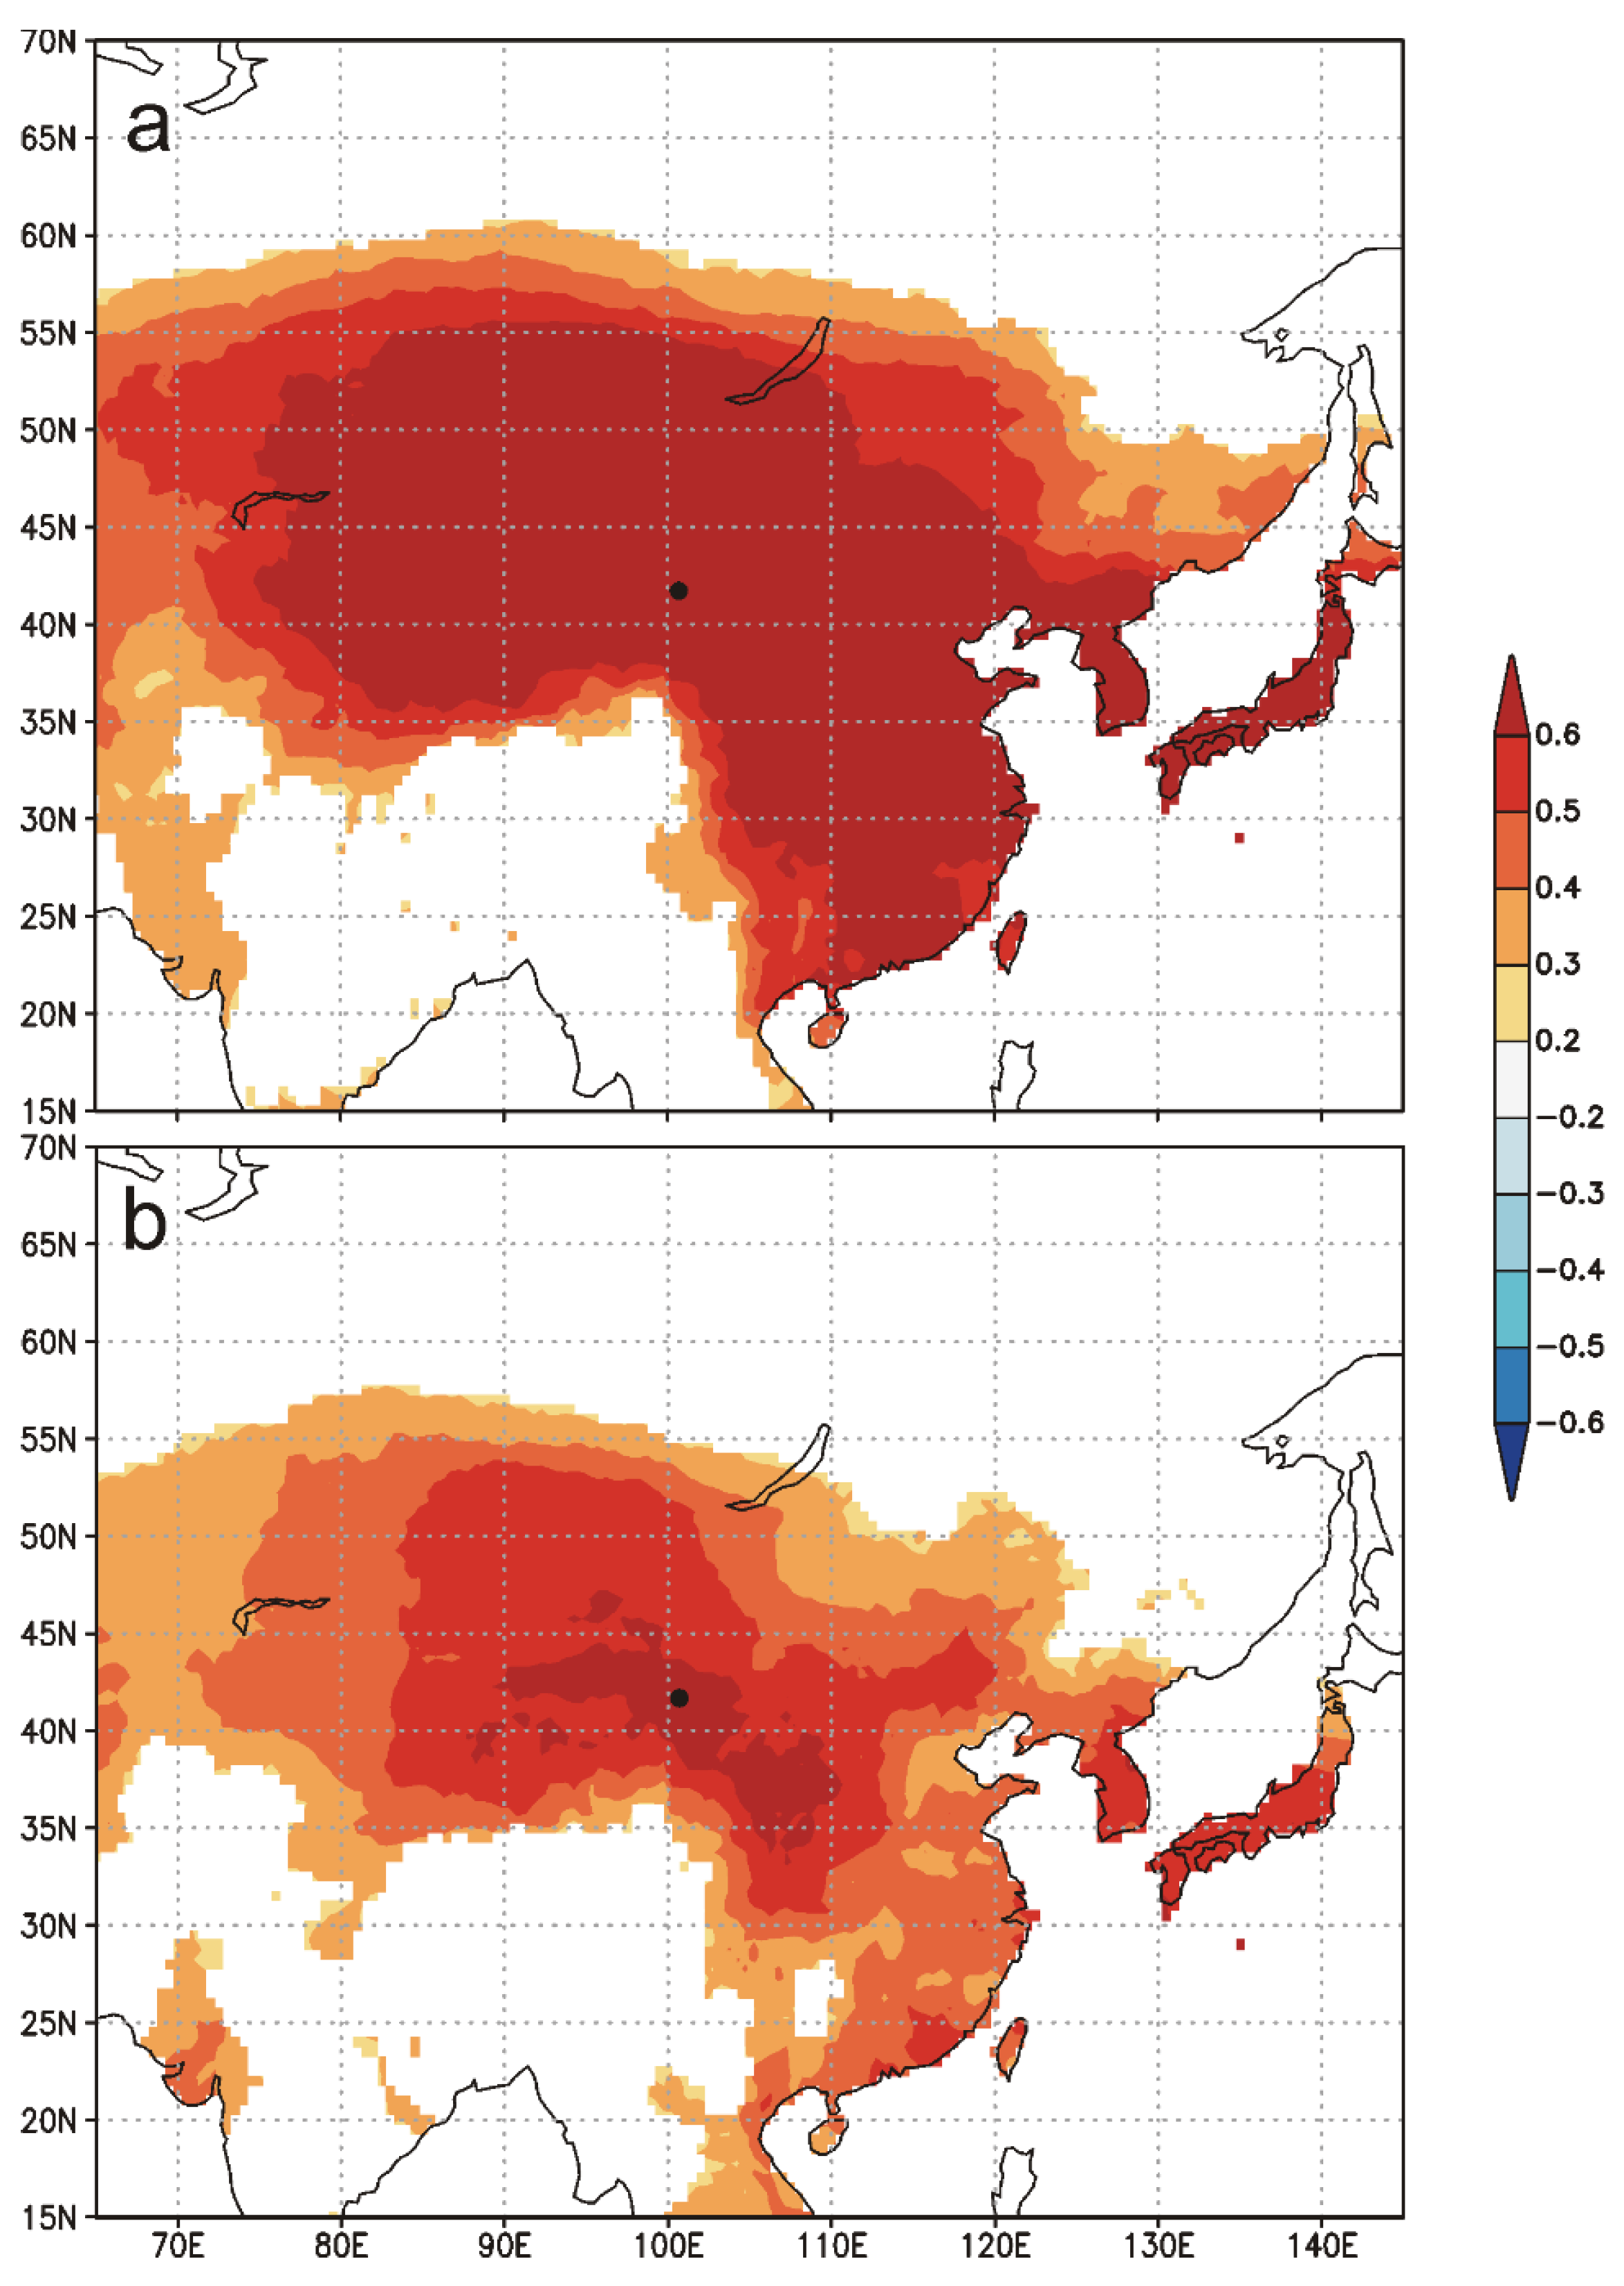
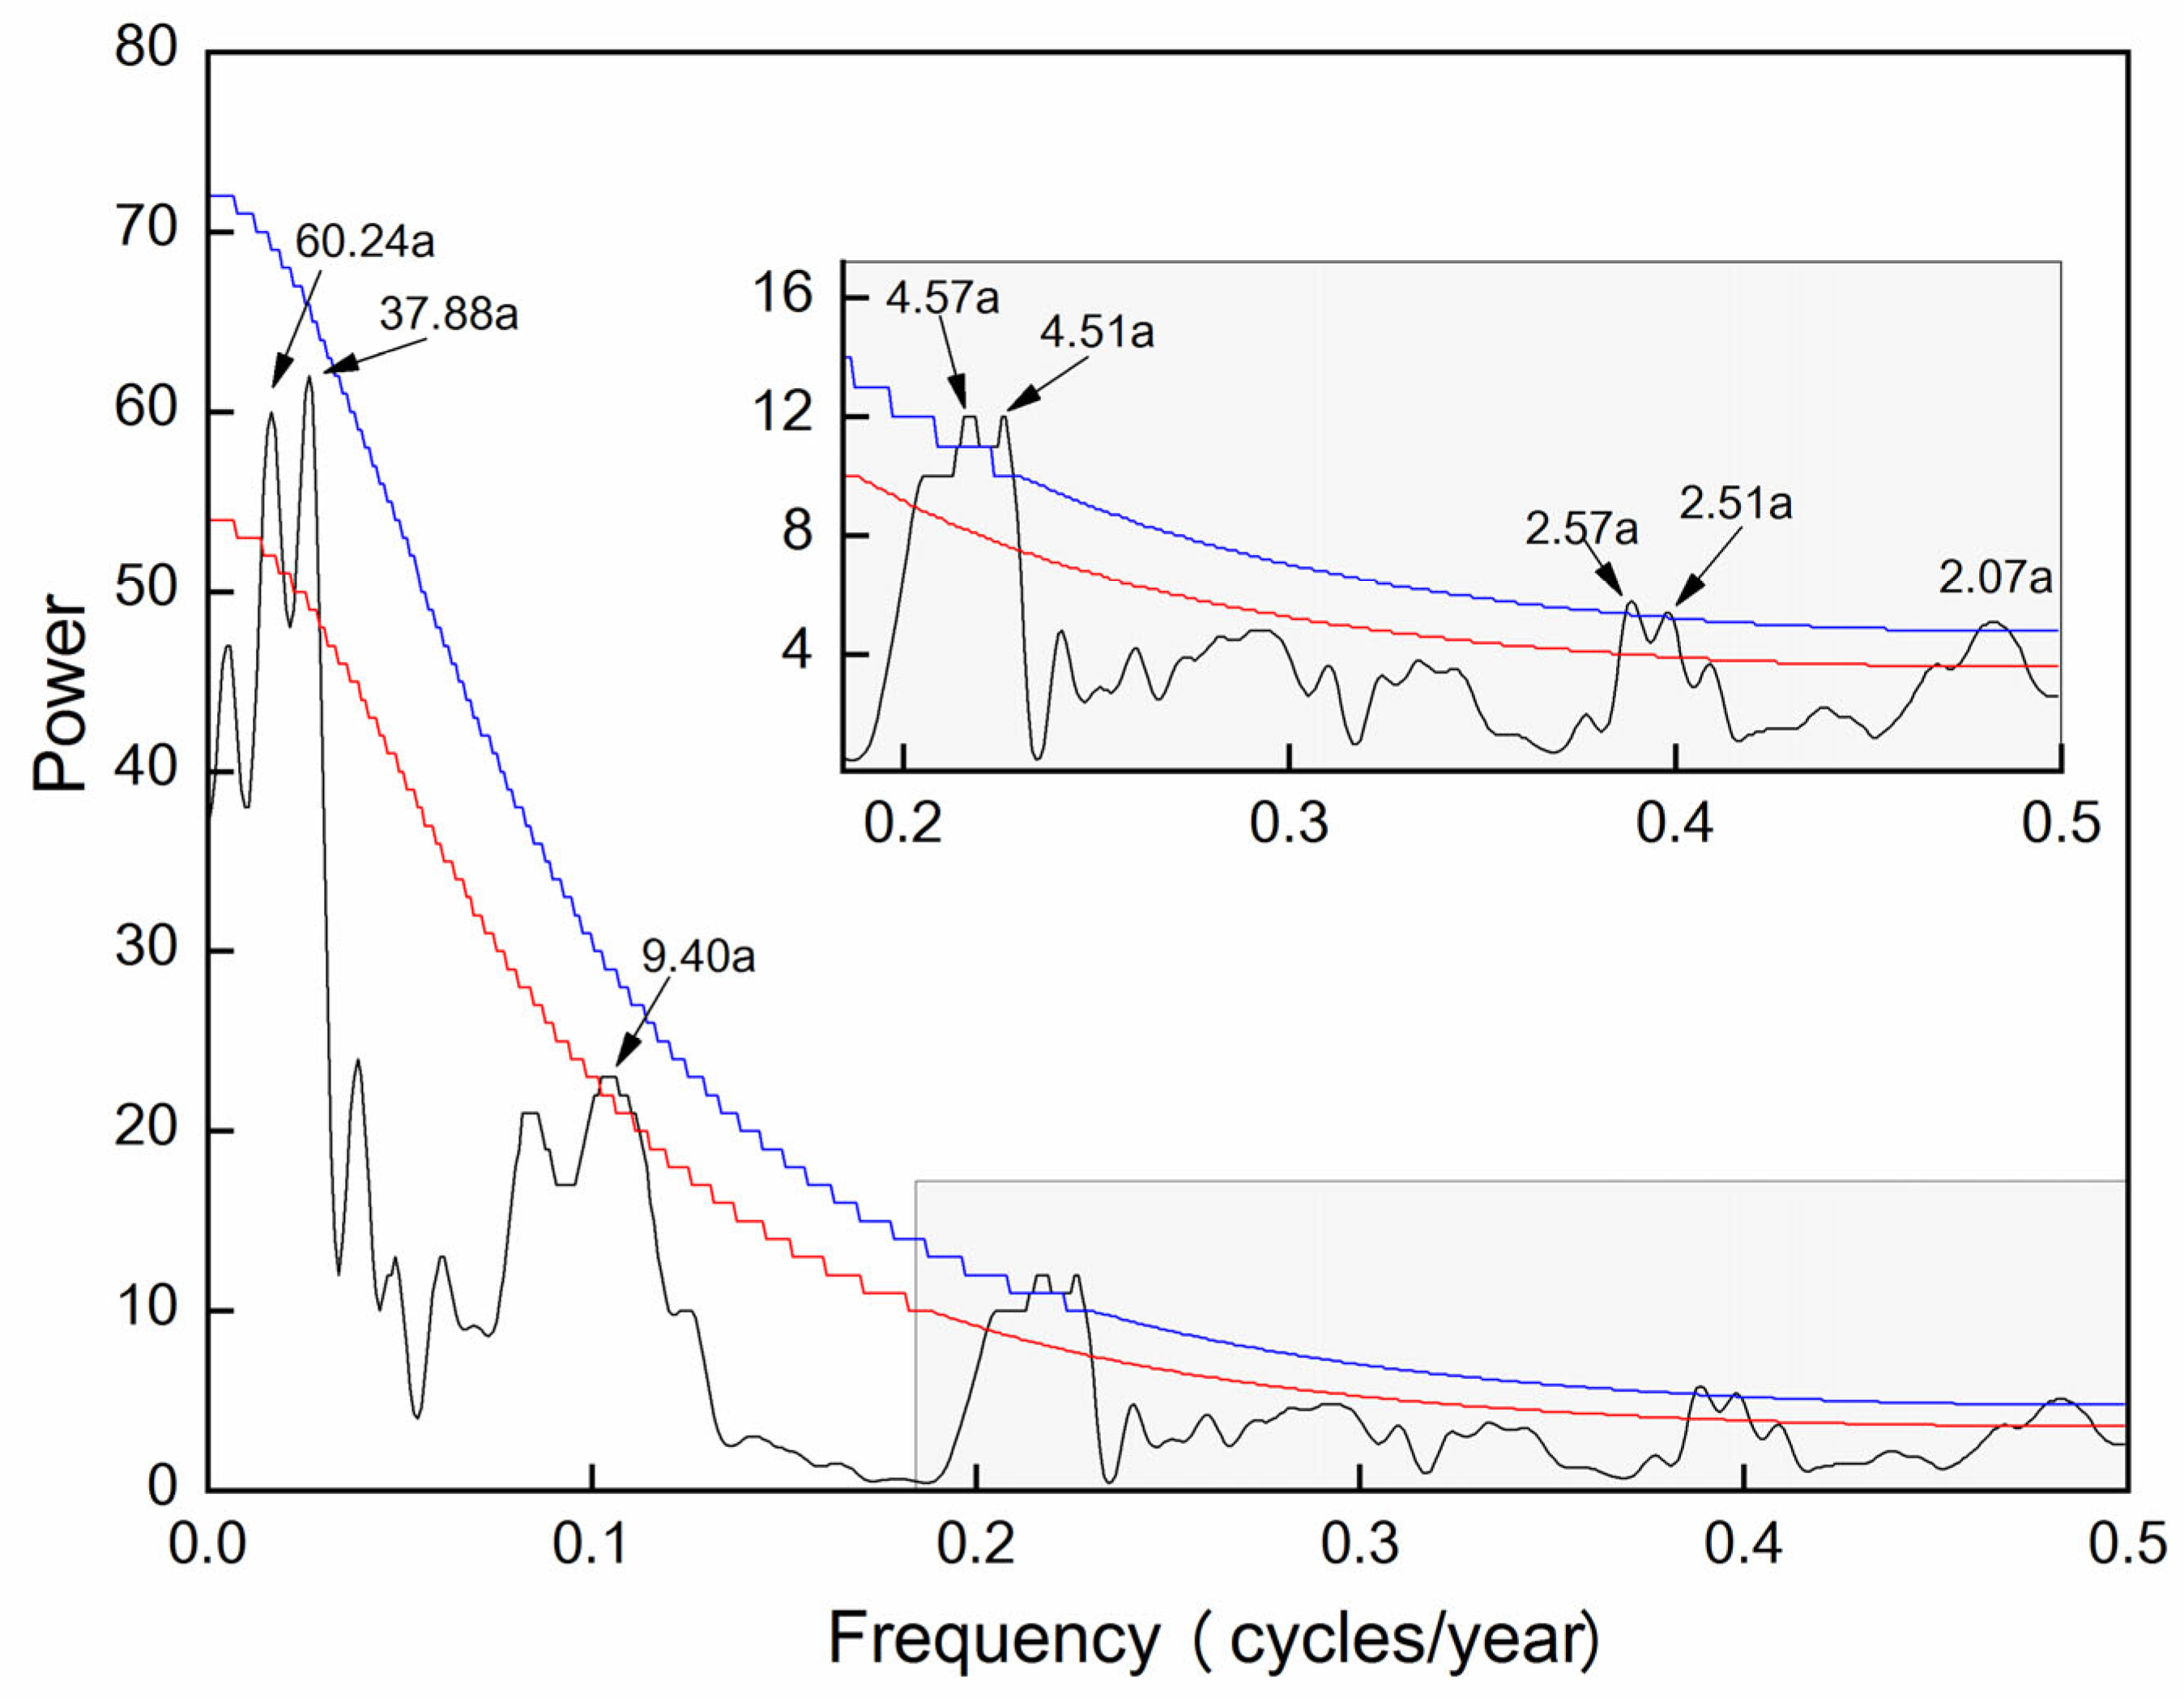
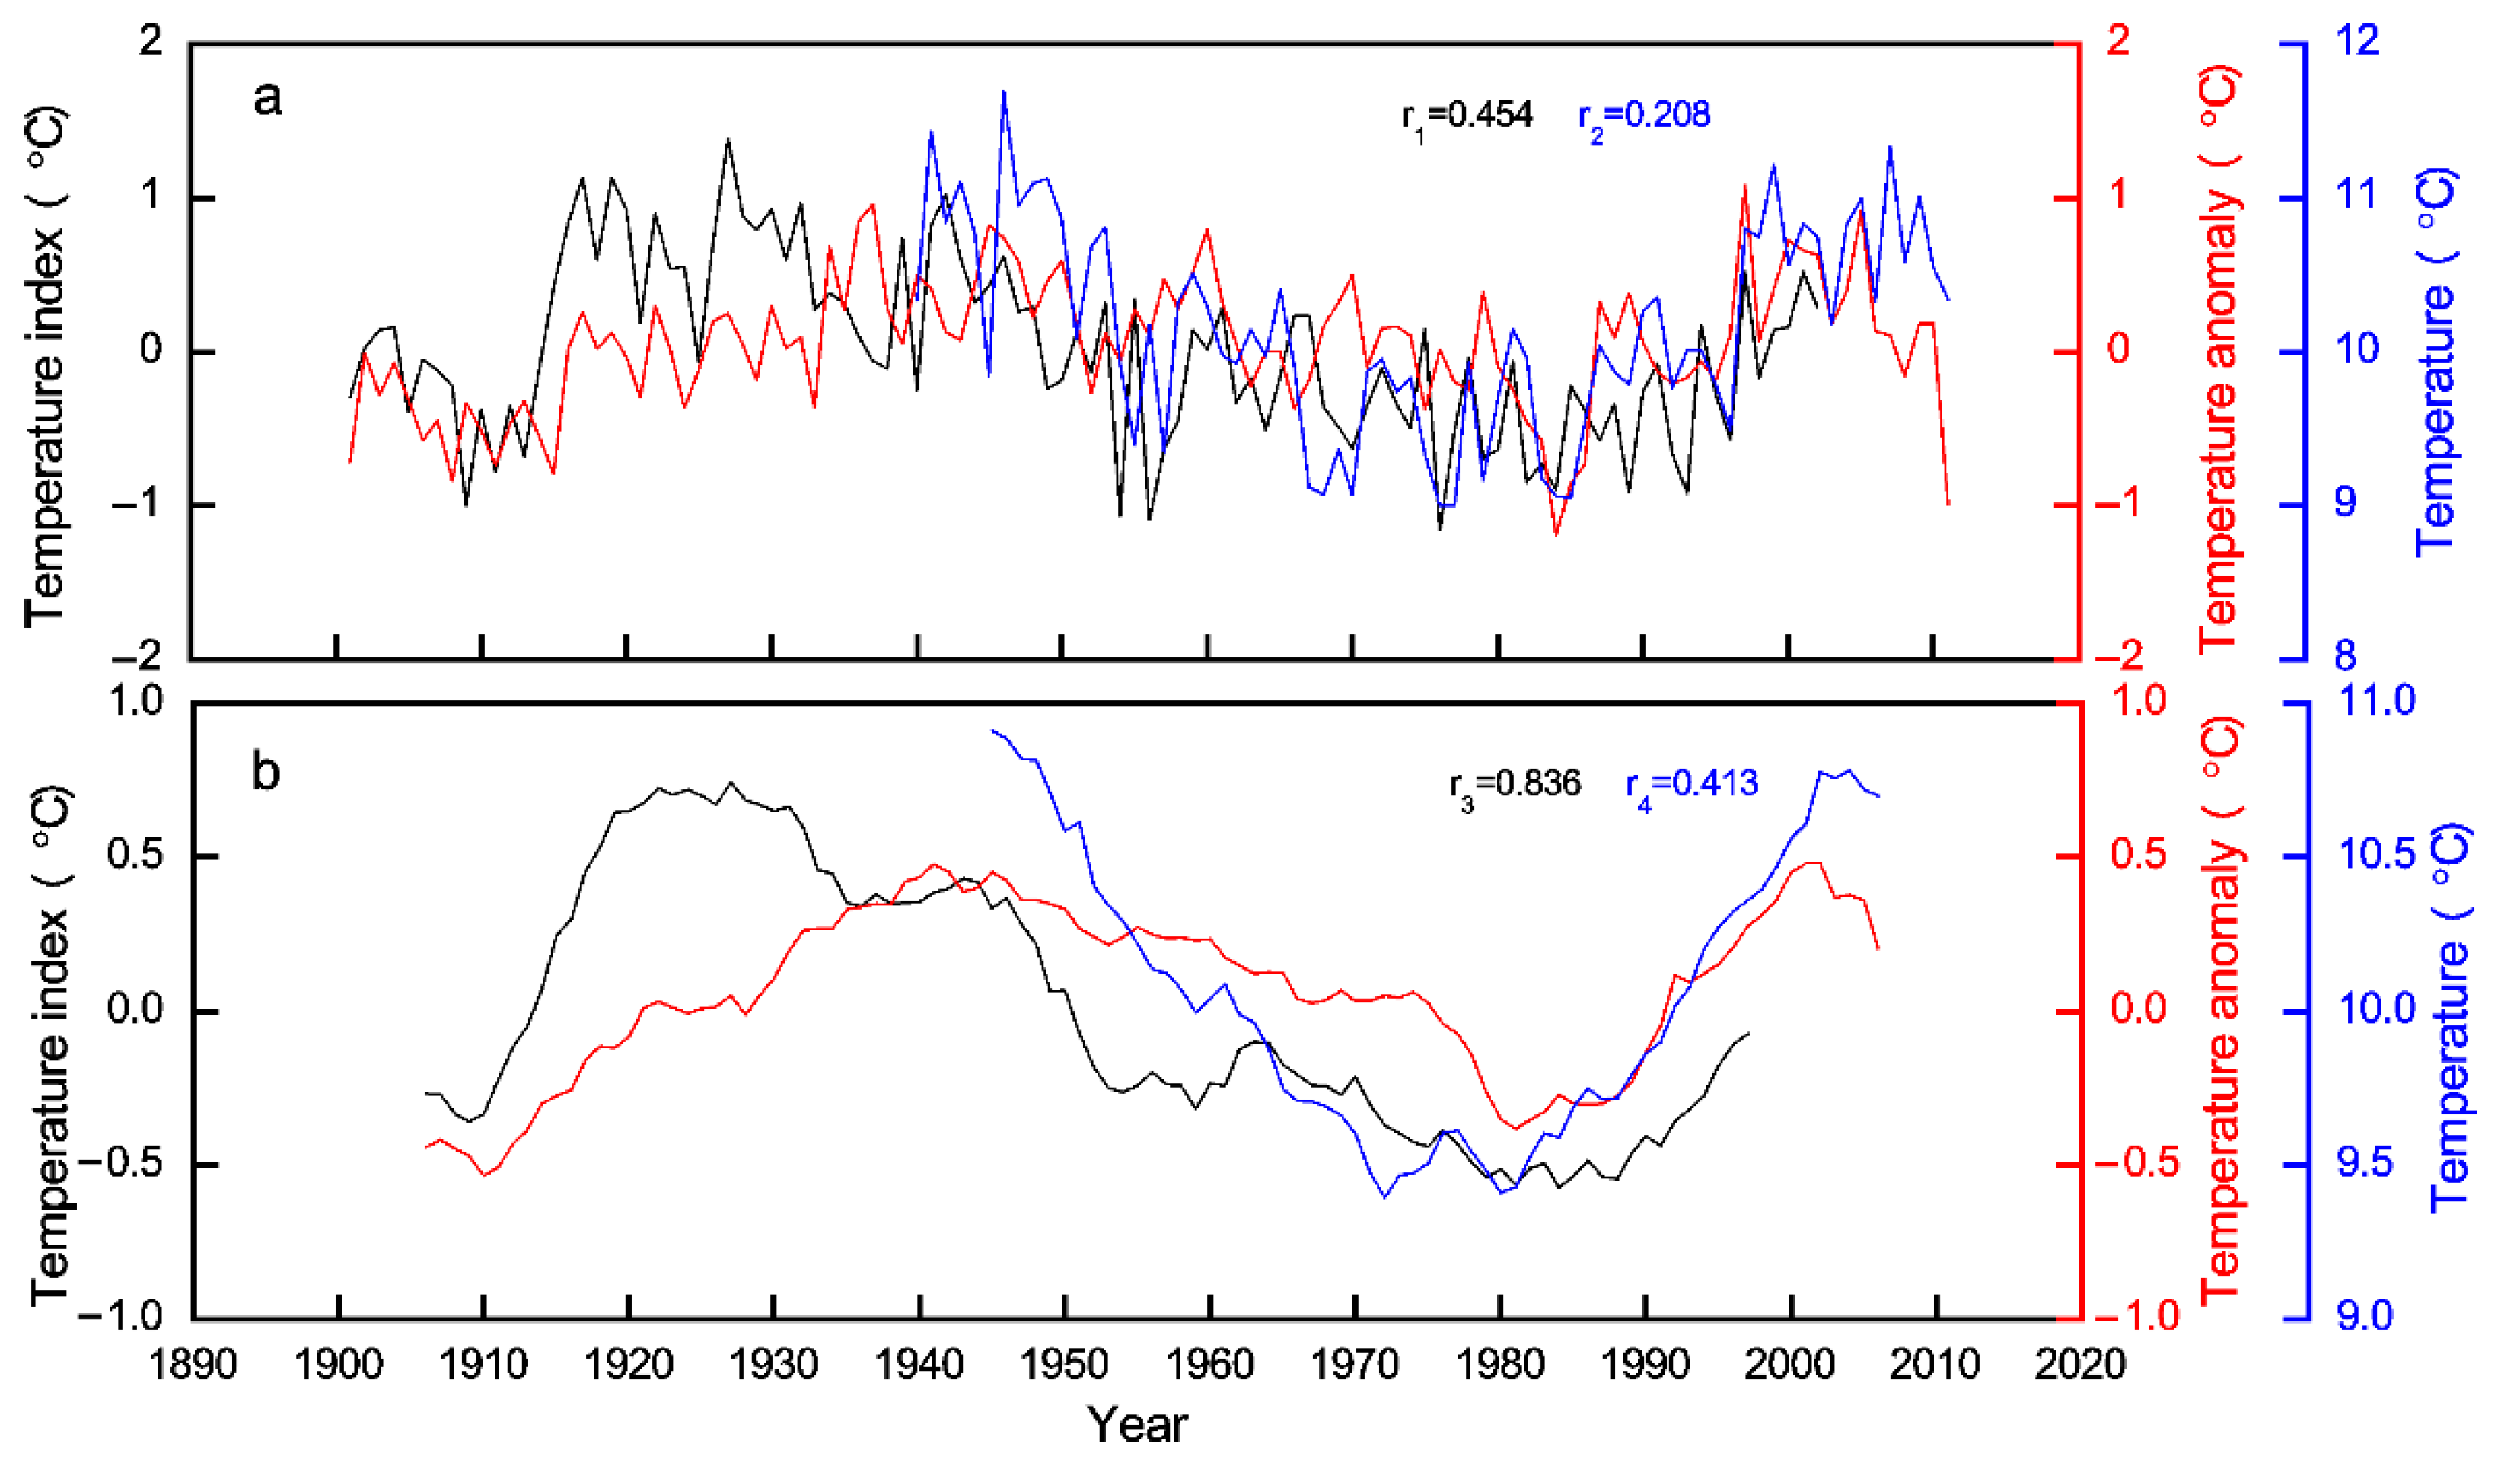
3.5. Spatial Representativeness and Periodicities

The spatial correlations indicated that the observed TDS was a significantly positive correlation with the TDS from many grid areas (p < 0.1). The dominant area appeared in central-south Japan, central-east China (including Loess Plateau), Mongolia Plateau, and surrounding areas according to the temperature field (Figure 6a). The reconstructed had followed a similar spatial correlative pattern, with lower correlation coefficient, and the fields of highest correlation over a large region in and around the core area of Mongolia Plateau and Chinese Loess Plateau (Figure 6b).
The MTM analysis showed that the TDS reconstruction exhibited some significant cycles (Figure 7) on interannual and interdecadal scales. Significant cycles were found at 60.24 (p < 0.05), 37.88 (p < 0.05), 9.40 (p < 0.05), 4.57 (p < 0.01), 4.51 (p < 0.01), 2.57 (p < 0.01), 2.51 (p < 0.01), and 2.07 (p < 0.01).

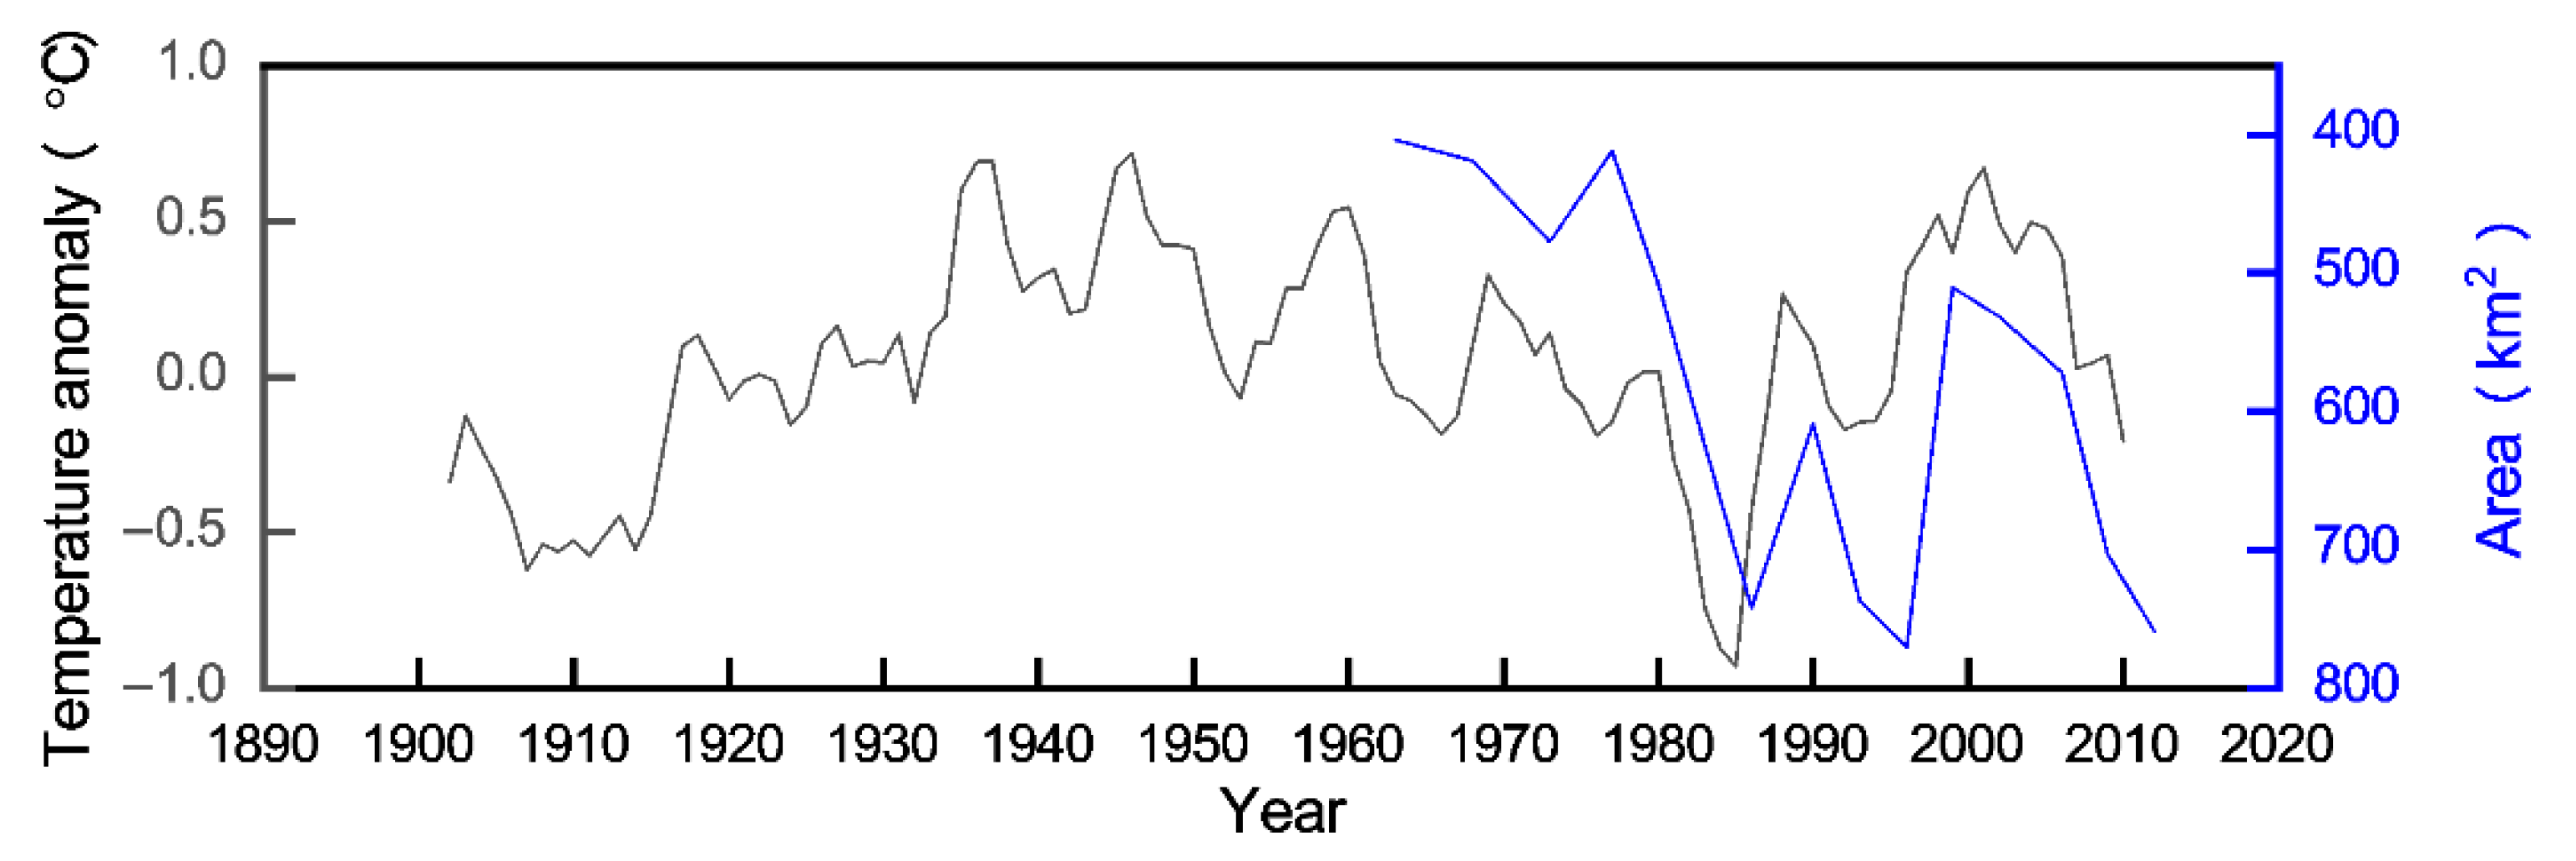
3.6. Comparison with the Ejina Oasis Area

As shown in Figure 8, the high mean maximum temperature has a good consistency with the small area of Ejina Oasis for the period 1963–2012, and vice versa.

4. Discussion

4.1. Chronology Characteristics of Stable Carbon Isotopes

The higher first-order autocorrelation coefficient and lower variance in tree-ring δ13C and ∆13C chronologies indicated that the hysteretic effect is obvious in tree-ring stable carbon isotope variation and suggested that the carbon isotopic fractionation in the previous year affect its fractionation in the current year. This was perhaps because the process of synthesizing organic matter through photosynthesis in the current year used part of organic matter stored in the plant from photosynthesis during the previous year [45]. These parameters (for example, first-order autocorrelation coefficient, standard deviation, variance) in the tree-ring ∆13C series were obviously lower than that in the tree-ring δ13C series, indicating that the annual values of stable carbon isotope in P. euphratica are more stable after removing the impact of increasing atmospheric CO2 concentration.

4.2. Relationship between Climate and Tree-Ring ∆13C

The ∆13C chronology showed remarkable correlations with meteorological factors in the growing season of the previous year (such as precipitation in September, mean temperature and maximum temperature in April and September, and mean minimum temperature in April), indicating that the photosynthesis of P. euphratica in the current year can utilize the organic matter stored in the plant in the previous year [45], then change the tree-ring ∆13C. The ∆13C chronology were remarkable negative correlations with temperature (such as mean temperature and minimum temperature in previous December and current January and March, mean maximum temperature in previous December and current March). A probable cause is extreme low temperature could cause freezing damage and affect the growth of trees and CO2 absorbent in the next year. Another possible reason is precipitation (snow) would increase when the temperature is relatively low in winter, which would be conducive to retaining more moisture in soil and impact on wood growth in the next year [46]. Soil moisture is the source water of trees, which is the main component of photosynthesis in the plant. Provided source water adequate resources are available, plants can use source water and CO2 to synthesize organic matter, and then the stable isotope fractionation is affected. There were remarkable negative correlations between the ∆13C chronology and the temperature in July and the mean minimum temperature in September of the current year. It may be that the increase in photosynthesis and the reduction in stomatal conductance (stomatal closure) could decrease the CO2 concentration of intercellular when the temperature was raised in the growing season, and then tree-ring ∆13C was moderated [47]. These results indicated that both temperature and precipitation have a physiological basis in affecting stable carbon isotope fractionation of P. euphratica in Ejina Oasis. In addition, the greatest significant negative correlation (p < 0.01) was found between the ∆13C chronology and the mean maximum temperature from previous December to current September (Figure 3), suggesting that the stable carbon isotope fractionation of P. euphratica in Ejina Oasis was primarily modified by mean maximum temperature.

4.3. Local and Regional Climate Characteristics

The TDS reconstruction series in our research showed both remarkable interannual and interdecadal variations and provided the foundation data for further study on long-term mean maximum temperature change in Ejina Oasis. To get a better sense of the regional representation of the TDS reconstruction series, spatial correlations between both the reconstructed and observed TDS and the globally gridded TDS from the CRU TS4.05 network were plotted. The observed mean temperature from Anxi station and the reconstructed temperature index in north-central China were used to make a comparison with the TDS reconstruction series [48].
The TDS reconstruction was significantly positively correlated with the observed mean temperature from previous December to current September in the Anxi meteorological station on the interannual scale, with r = 0.454 (p < 0.001,1940–2011). After 11-year moving average, the positive correlation coefficient was more notable (r = 0.836, p < 0.001, 1945–2006). Meanwhile, the TDS reconstruction series was also significantly positively correlated with the reconstructed temperature index in north-central China on the interannual scale [48] (r = 0.208, p = 0.003, 1901–2011). After 11-year moving average, the correlation coefficient was 0.413 (p < 0.001, 1906–2006). The variation pattern of the TDS reconstruction series was differences from the observed mean temperature from previous December to current September in Anxi meteorological station and the reconstructed temperature index in north-central China on the interannual and decadal scale (Figure 9a). This may be because the long-term observed records from the Anxi meteorological station and the reconstructed temperature index in north-central China were the mean temperature, and not the mean maximum temperature. However, the changing trend of three temperature series was similar to the observed on the decadal scale (Figure 9b). The spatial correlations indicated that the reconstructed TDS has significantly positive correlation with the TDS in the core area of Mongolia Plateau and Chinese Loess Plateau. These results indicated that the TDS reconstruction in the Ejina Oasis had a large regional representativeness.

4.4. Relationship with the Ejina Oasis Area

Ejina Oasis is a typical extreme arid desert oasis and is also an important ecological conservation redline line in the Heihe River basin, with a frail ecological environment in Northwest China. In recent decades, because of the influence of human activities and climate change [49], the area of Ejina oasis has greatly changed. To understand the influence of temperature change on the oasis area, we compared the reconstructed TDS series with the inter-annual area variations of Ejina Oasis [37]. These results showed that high (low) mean maximum temperature was a close correspondence with the small (large) area of Ejina Oasis (Figure 8). This correspondence can be simply explained as follows: when the maximum temperature is higher, evaporation will increase, and then water resources for human life and animal husbandry also become more stressed. Because surface runoff is the only water source in Ejina Oasis, the combined effect of natural drought and humanity’s overusing leads to a decrease in water runoff in Heihe and hard to penetrate the edge of the oasis, and result in growth dormancy or death of P. euphratica and sandy plants, so the area of Ejina Oasis is reducing.

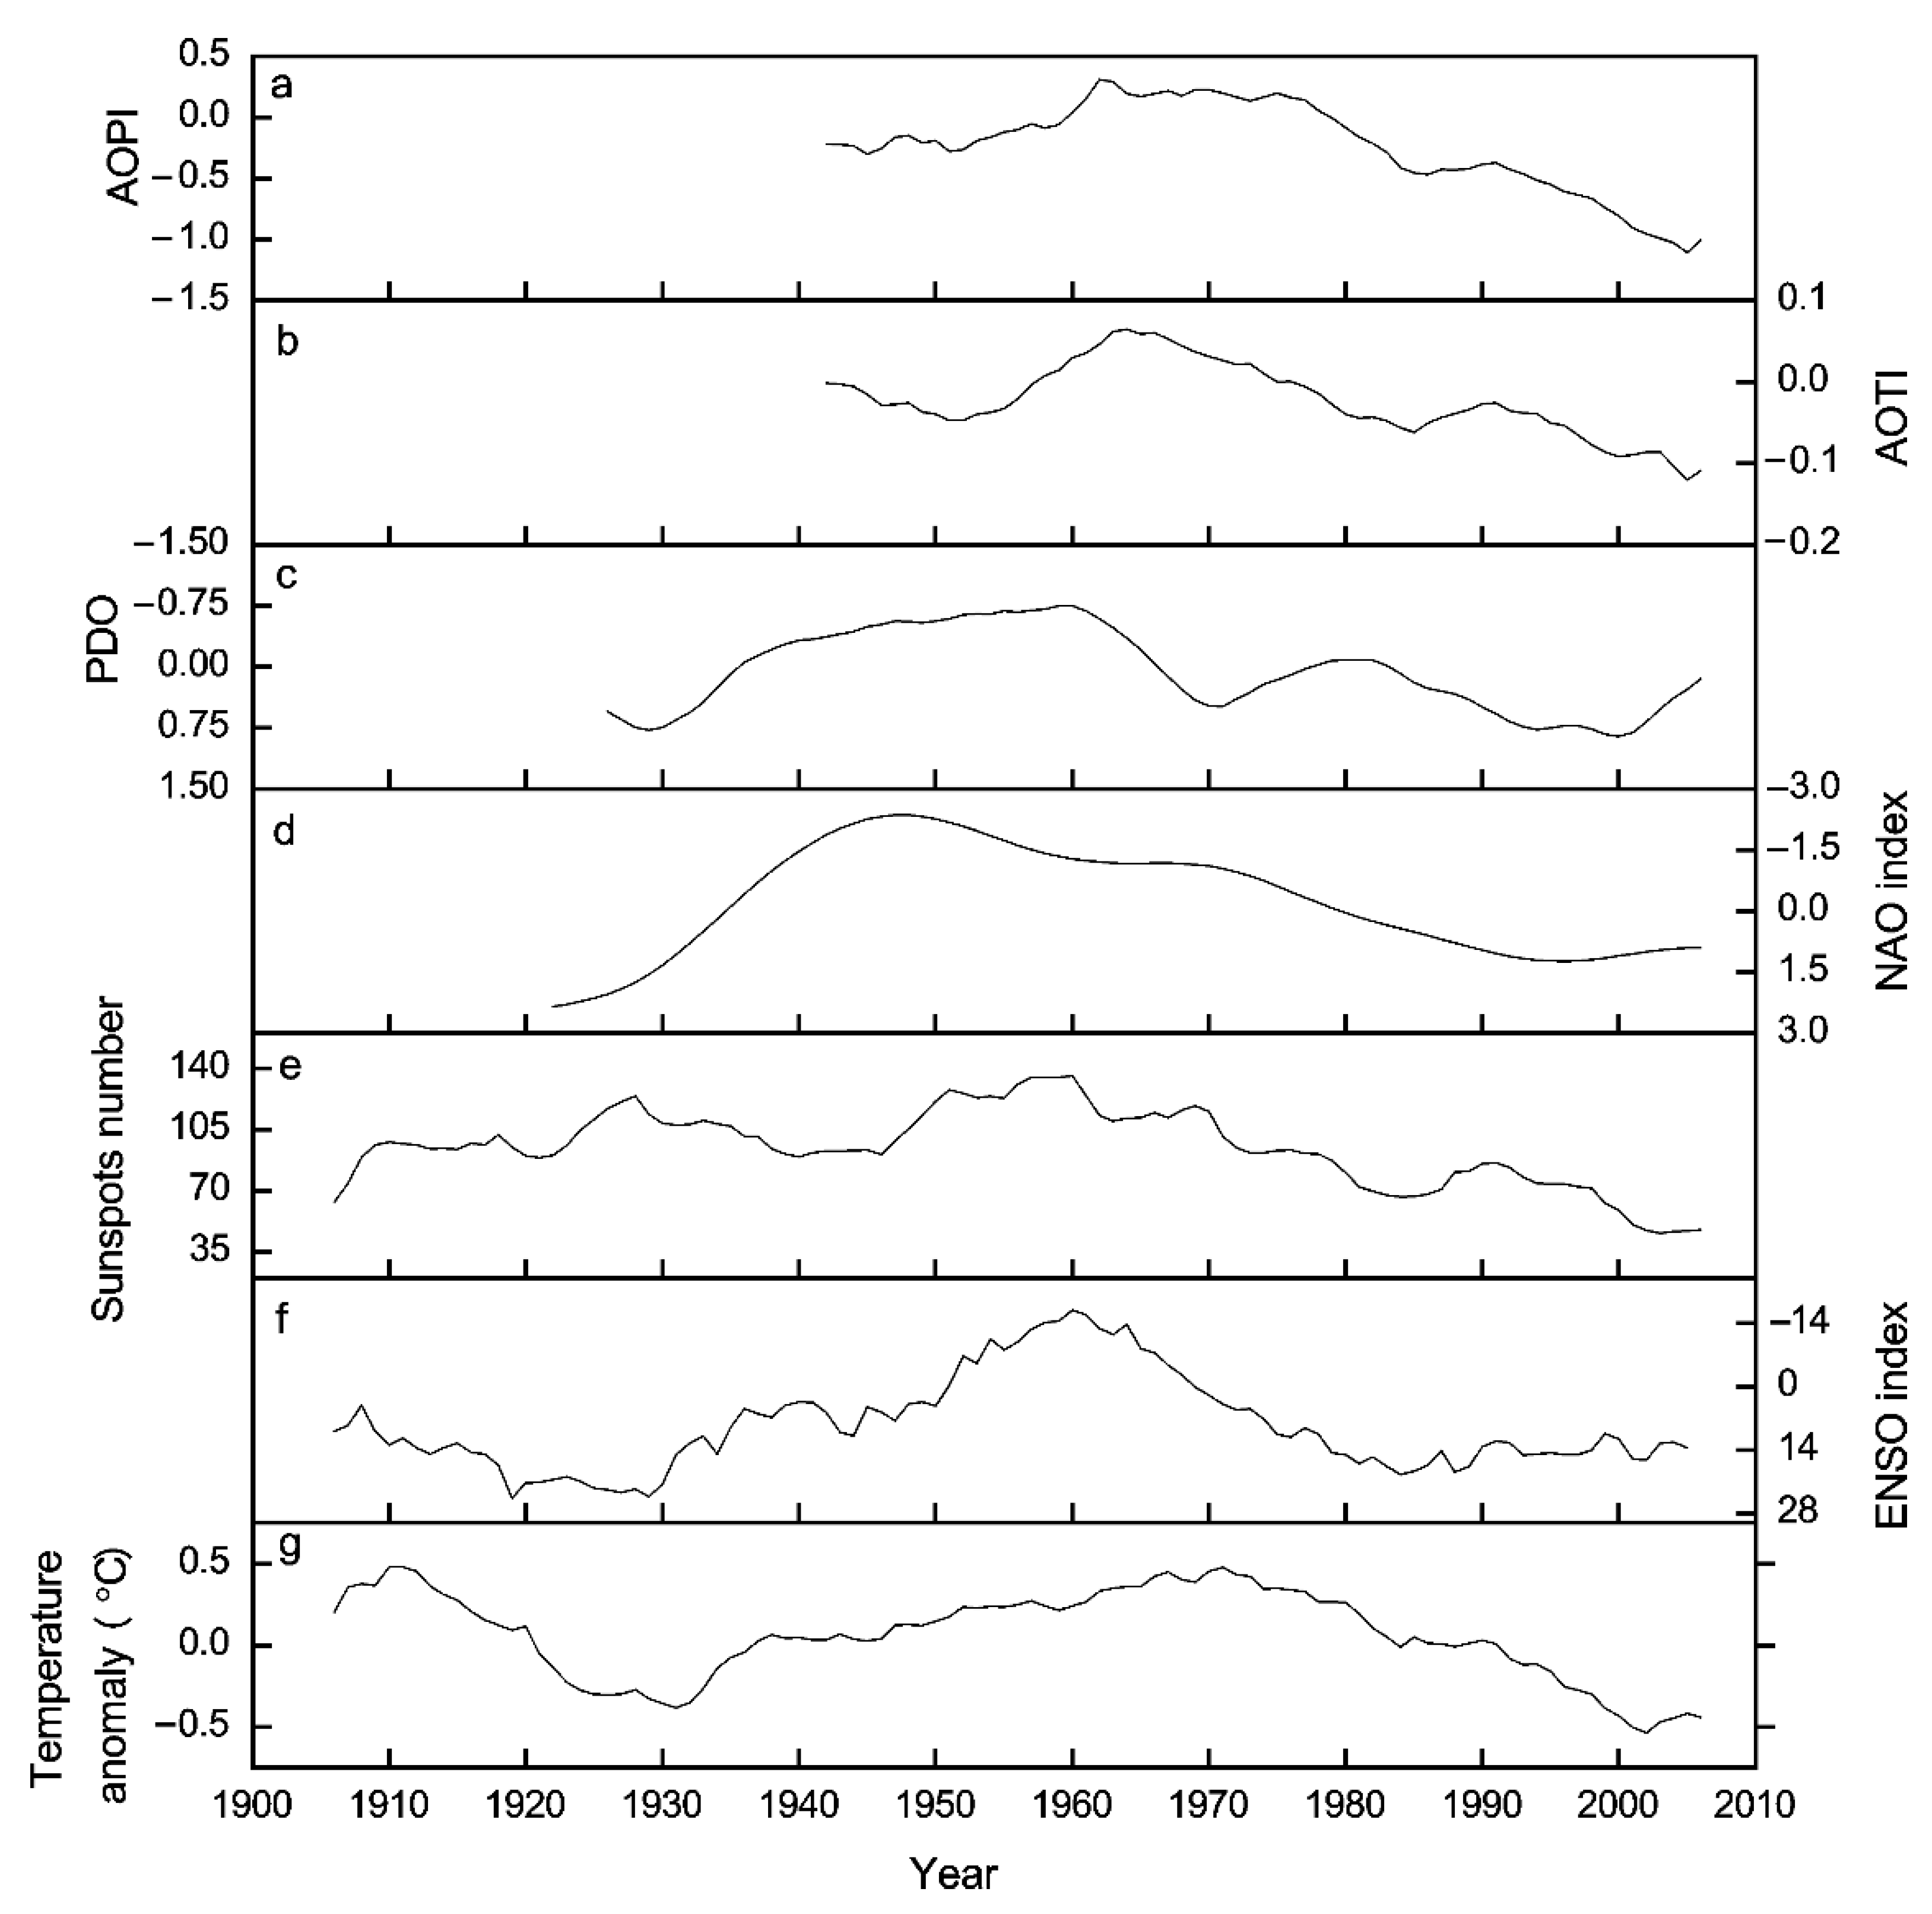
4.5. Linkages with Large Scale Atmospheric Circulations

The MTM analysis showed the TDS reconstruction series displays significant annual and decadal cycles (Figure 7). Similarity cycles have been widely found in tree-ring records in northern China [21,33,50,51,52]. These cycles implied that the other factors may have significant effects on the TDS changes in the Ejina oasis.
Significant high-frequency peaks of 2.07, 2.51, 2.57, 4.51, and 4.57 years were observed. These cycles were in the standard range of the 2–8-year ENSO cycle, which indicates that there were certain relations between the TDS variability and the ENSO [53,54]. The ENSO was a major control factor on the interannual climate variability of the northern part of China [55,56]. A significant negative correlation existed between the TDS series and the Global-SST ENSO index from November of the previous year, with r = −0.205 (p = 0.032, 1901–2011). After an 11-year moving average, the correlation coefficient is −0.533 (p < 0.001, 1906–2006). These results further confirmed that ENSO may affect the TDS in Ejina Oasis.
The 9.40-year cycle fell within the range of the 9–14 year sunspots cycle [57]; the 37.88-year cycle is possibly related to the 35-year solar cycle by the Lockyers [58] and the 60.24-year cycle may be coherent with the 50–80-year Lower Gleissberg cycles [59,60,61]. These cycles reflected the solar irradiance [59,62], which affects atmospheric circulation patterns in the stratosphere by adjusting vertical temperature and zonal wind [63]. The close relationship with solar irradiance was advocated by the positive correlation between the reconstructed TDS and the sunspots number from May to June of the current year on an interannual and interdecadal scale, with r = 0.363 (p <0.001, 1901–2011) and r = 0.441 (p < 0.001, 1906–2006), respectively. Meanwhile, the 60.24-year cycle was also likely to correspond to the 60-year Atlantic Multidecadal Oscillation (AMO) cycles [64]. Strong negative correlation between the reconstructed TDS series and the NAO index [34] on an interannual (r = −0.462, p < 0.001, 1901–1995) and interdecadal (r = −0.709, p < 0.01, 1906–1990) scale confirmed the TDS was likely affected by the atmospheric activity in North Atlantic.
In addition, the climate was mainly affected by Siberian High (Mongolian-Siberian High) in winter in Ejina Oasis. The Siberian High was a semi-permanent cold high pressure and had strong links to the PDO [65] and the AO [66]. Therefore, to understand the possible connection between the reconstructed TDS and both the PDO and AO, the correlation coefficients were calculated between reconstructed TDS and PDO [35], AOTI (warm season AO Surface Air Temperature index), and AOPI (Summer AO Sea Level Pressure index) [36]. The results showed the reconstructed TDS was significantly and negatively correlated with PDO, AOTI and AOPI on an interannual scale, with the correlation coefficients r = −0.306 (p < 0.01, 1901–1991), r = −0.427 (p < 0.01, 1901–1975) and r = −0.578 (p < 0.01, 1901–1975), respectively. On a decadal scale, the correlation coefficients were −0.581 (p < 0.01, 1906–1986), −0.856 (p < 0.001, 1906–1970) and −0.970 (p < 0.001, 1906–1970), respectively. On a decadal scale, the AOPI, AOTI, PDO, NAO index, sunspot number, ENSO index and the TDS reconstruction series showed some similar trends with different magnitudes (Figure 10). These results suggest that the TDS in the Ejina Oasis may be bound up with extensive atmosphere-sea interactions from the North Pacific and Arctic oceans.
The above results suggested that solar activity and atmospheric circulation may have a combined effect on the TDS. However, the complex influence mechanism needed further research.

5. Conclusions

In this study, three cores of P. euphratica were employed to develop a tree-ring cellulose ∆13C chronology in Ejina Oasis in Northwest China, and then the TDS series from 1901 to 2011 were reconstructed using a regression model, which explains 43.6% variance of observed regional mean maximum temperature. Statistical tests and analysis of model results showed that the transformation function has good repeatability and high reliability. The TDS series was significantly associated with the observed TDS in the Anxi meteorological station and the temperature index in north-central China on the interannual scale and showed a synchronous variation on the decadal scale. Spatial correlation implied that the TDS reconstruction captured the characteristics of the temperature change in a wide geographical area. Meanwhile, comparisons between the TDS reconstruction and the area of Ejina Oasis demonstrated the change of ecological environment is a result of combined effect from natural and anthropogenic activities. Significant periodicities and correlations suggested that the TDS may be constrained by the effect of combining solar activity and atmospheric circulations (such as ENSO, NAO, PDO, AOTI, and AOPI). It is no doubt this research could provide useful and high-resolution information about temperature variation in the past in the desert region of in Northwest China. And the reconstructed TDS is very useful for the prediction of regional climate and the protection of P. euphratica. However, to further understand the internal mechanism between regional temperature variation and large regional atmospheric circulations, more studies are needed in the future.

Author Contributions

Investigation, Y.W., Q.L. and X.D.; data analysis, Y.W. and H.S.; methodology, Q.L., Y.L. and Q.C.; software, C.S.; validation, Q.L., Y.L. and H.S.; investigation, Y.W. and X.D.; writing—original draft preparation, Y.W., Q.L., Y.L., X.D., C.S., H.S., Q.C. and X.L.; writing—review and editing, Y.W. and X.D.; visualization, C.S., H.S. and Q.C. All authors have read and agreed to the published version of the manuscript.

Funding

This research was funded by the National Natural Science Foundation of China (32061123008, 41991252, 42071026, 41888101, 41873021 and 42173080); the Chinese Academy of Sciences (XDB40000000); the STEP program (Grant No. 2019QZKK0101) and the science and technology planning projects from Xingtai Technology Bureau (2021ZZ026).

Institutional Review Board Statement

Not applicable.

Informed Consent Statement

Not applicable.

Data Availability Statement

Not applicable.

Conflicts of Interest

The authors declare no conflict of interest.

References

  1. Zhao, Y.; Guo, J.; Mao, K.; Xiang, Y.; Li, Y.; Han, J.; Wu, N. Spatio-temporal distribution of typical natural disasters and grain disaster losses in China from 1949 to 2015. Acta Geogr. Sin. 2017, 72, 1261–1276. [Google Scholar]
  2. Loader, N.; Young, G.; Grudd, H.; McCarroll, D. Stable carbon isotopes from Torneträsk, northern Sweden provide a millennial length reconstruction of summer sunshine and its relationship to Arctic circulation. Quat. Sci. Rev. 2013, 62, 97–113. [Google Scholar] [CrossRef]
  3. Zhao, X.; Zheng, Z.; Shang, Z.; Wang, J.; Cheng, R.; Qian, J. Climatic information recorded in stable carbon isotopes in tree rings of Cryptomeria fortunei, Tianmu Mountain, China. Dendrochronologia 2014, 32, 256–265. [Google Scholar] [CrossRef]
  4. Liu, Y.; Wang, Y.; Li, Q.; Song, H.; Linderholm, H.W.; Leavitt, S.W.; Wang, R.; An, Z. Tree-ring stable carbon isotope-based May–July temperature reconstruction over Nanwutai, China, for the past century and its record of 20th century warming. Quat. Sci. Rev. 2014, 93, 67–76. [Google Scholar] [CrossRef]
  5. Liu, Y.; Ta, W.; Li, Q.; Song, H.; Sun, C.; Cai, Q.; Liu, H.; Wang, L.; Hu, S.; Sun, J.; et al. Tree-ring stable carbon isotope-based April–June relative humidity reconstruction since ad 1648 in Mt. Tianmu, China. Clim. Dynam. 2018, 50, 1733–1745. [Google Scholar] [CrossRef]
  6. Li, D.; Fang, K.; Li, Y.; Chen, D.; Liu, X.; Dong, Z.; Zhou, F.; Guo, G.; Shi, F.; Xu, C.; et al. Climate, intrinsic water-use efficiency and tree growth over the past 150 years in humid subtropical China. PLoS ONE 2017, 12, e0172045. [Google Scholar] [CrossRef] [Green Version]
  7. Zeng, X.; Liu, X.; Treydte, K.; Evans, M.N.; Wang, W.; An, W.; Sun, W.; Xu, G.; Wu, G.; Zhang, X. Climate signals in tree-ring δ18O and δ13C from southeastern Tibet: Insights from observations and forward modelling of intra- to interdecadal variability. New Phytol. 2017, 216, 1104–1118. [Google Scholar] [CrossRef] [Green Version]
  8. Wang, W.; Liu, X.; Xu, G.; Zeng, X.; Wu, G.; Zhang, X.; Qin, D. Temperature signal instability of tree-ring δ 13 C chronology in the northeastern Qinghai–Tibetan Plateau. Glob. Planet. Chang. 2016, 139, 165–172. [Google Scholar] [CrossRef]
  9. Kang, S.; Loader, N.J.; Wang, J.; Qin, C.; Liu, J.; Song, M. Tree-Ring Stable Carbon Isotope as a Proxy for Hydroclimate Vari-ations in Semi-Arid Regions of North-Central China. Forests 2022, 13, 492. [Google Scholar] [CrossRef]
  10. Heinrich, I.; Touchan, R.; Liñán, I.D.; Vos, H.; Helle, G. Winter-to-spring temperature dynamics in Turkey derived from tree rings since AD 1125. Clim. Dyn. 2013, 41, 1685–1701. [Google Scholar] [CrossRef] [Green Version]
  11. Barbour, M.M.; Walcroft, A.S.; Farquhar, G.D. Seasonal variation in δ13C and δ18O of cellulose from growth rings of Pinus radiata. Plant Cell Environ. 2002, 25, 1483–1499. [Google Scholar] [CrossRef]
  12. Francey, R.J.; Farquhar, G. An explanation of 13C/12C variations in tree rings. Nature 1982, 297, 28–31. [Google Scholar] [CrossRef]
  13. Wang, W.; Liu, X.; Shao, X.; Leavitt, S.; Xu, G.; An, W.; Qin, D. A 200 year temperature record from tree ring δ13C at the Qaidam Basin of the Tibetan Plateau after identifying the optimum method to correct for changing atmospheric CO2 and δ13C. J. Geophys. Res. 2011, 116, 4022. [Google Scholar] [CrossRef]
  14. Liu, P.; Chen, F.; Gou, X.; Peng, J.; Huang, X. Establishment of Tree-ring Chronology and Response Analysis in Past 100 Years for Ejin Banner, Inner Mongolia. J. Desert Res. 2005, 25, 764–768. (In Chinese) [Google Scholar]
  15. Liu, X.; Wang, W.; Xu, G.; Zeng, X.; Wu, G.; Zhang, X.; Qin, D. Tree growth and intrinsic water-use efficiency of inland ri-parian forests in northwestern China: Evaluation via δ13C and δ18O analysis of tree rings. Tree Physiol. 2014, 34, 966–980. [Google Scholar] [CrossRef] [Green Version]
  16. Sun, J.; Liu, Y.; Cai, Q.; Park, W.K.; Li, B.; Shi, J.; Yi, L.; Song, H.; Li, Q. Climatic and hydrological changes of Ejin, Inner Mongolia, China during the past 233 years recorded in tree-rings of Populus euphratica. Quat. Sci. 2006, 26, 799–807. (In Chinese) [Google Scholar]
  17. Liu, P.; Chen, F.; Jin, L.; Gou, X.; Zhang, Y.; Peng, J. About 100-year reconstruction of spring stream flow based on tree ring in the lower reaches of Heihe Rive. Arid. Land Geogr. 2007, 50, 696–700. (In Chinese) [Google Scholar]
  18. Li, Q.; Liu, Y.; Meko, D.M.; Nakatsuka, T.; Pan, Y.; Song, H.; Liu, R.; Sun, C.; Fang, C. Water Resource Management Implica-tions for a Desert Oasis From Tree-Ring δ18O Variations in Populus Euphratica in Northwest China. Water Resour. Res. 2022, 58, e2022WR031953. [Google Scholar] [CrossRef]
  19. Photiadou, C. Extreme Precipitation and Temperature Responses to Circulation Patterns in Current Climate: Statistical Approaches. Ph.D. Thesis, Utrecht University, Utrecht, The Netherlands, 2015. [Google Scholar]
  20. Cantelaube, P.; Terres, J.; Doblas-Reyes, F.J. Climate variability influences on European agriculture. Analysis for winter wheat production. Clim. Res. 2004, 27, 135–144. [Google Scholar] [CrossRef]
  21. Liu, Y.; Wang, Y.; Li, Q.; Sun, J.; Song, H.; Cai, Q.; Zhang, Y.; Yuan, Z.; Wang, Z. Reconstructed May–July mean maximum temperature since 1745AD based on tree-ring width of Pinus tabulaeformis in Qianshan Mountain, China. Palaeogeogr. Palaeoclim. Palaeoecol. 2013, 388, 145–152. [Google Scholar] [CrossRef]
  22. Ren, J.; Liu, Y.; Song, H.; Ma, Y.; Li, Q.; Wang, Y.; Cai, Q. The historical reconstruction of the maximum temperature over the past 195 years, linxia region, gansu province—Based on the data from Picea purpurea. Mast. Quarter. Sci. 2014, 34, 1270–1279. (In Chinese) [Google Scholar]
  23. Peng, X.; Xiao, S.; Cheng, G.; Xiao, H.; Tian, Q.; Zhang, Q. Human activity impacts on the stem radial growth of Populus euphratica riparian forests in China’s Ejina Oasis, using tree-ring analysis. Trees 2017, 31, 379–392. [Google Scholar] [CrossRef]
  24. Yu, W. Characteristics of Phenology and Physiological Ecology of Populus euphratica Oliv. in Ejina; Beijing Forestry University: Bejing, China, 2012; pp. 27–28. (In Chinese) [Google Scholar]
  25. Kang, X. The restrictive factors and the development strategies of forest restoration of Populus euphratica Oliv. in Gansu. J. Desert Res. 1997, 17, 53–57. (In Chinese) [Google Scholar]
  26. Leavitt, S.W. Tree-ring C–H–O isotope variability and sampling. Sci. Total Environ. 2010, 408, 5244–5253. [Google Scholar] [CrossRef]
  27. Leavitt, S.W.; Long, A. Sampling strategy for stable carbon isotope analysis of tree rings in pine. Nature 1984, 311, 145–147. [Google Scholar] [CrossRef]
  28. Leavitt, S.W.; Lara, A. South American tree rings show declining δ13C trend. Tellus B 1994, 46, 152–157. [Google Scholar] [CrossRef]
  29. McCarroll, D.; Loader, N.J. Stable isotopes in tree rings. Quat. Sci. Rev. 2004, 23, 771–801. [Google Scholar] [CrossRef]
  30. Treydte, K.S.; Frank, D.C.; Saurer, M.; Helle, G.; Schleser, G.H.; Esper, J. Impact of climate and CO2 on a millennium-long tree-ring carbon isotope record. Geochim. Cosmochim. Acta 2009, 73, 4635–4647. [Google Scholar] [CrossRef]
  31. Easterling, D.R.; Peterson, T.C. A new method for detecting and adjusting for undocumented discontinuities in climatological time series. Int. J. Climatol. 1995, 15, 369–377. [Google Scholar] [CrossRef]
  32. Bao, G.; Liu, Y.; Liu, N.; Linderholm, H. Drought variability in eastern Mongolian Plateau and its linkages to the large-scale climate forcing. Clim. Dyn. 2014, 44, 717–733. [Google Scholar] [CrossRef]
  33. Chen, Z.J.; Zhang, X.L.; Cui, M.X.; He, X.Y.; Ding, W.H.; Peng, J.J. Tree-ring based precipitation reconstruction for the for-est-steppe ecotone in northern Inner Mongolia, China and its linkages to the Pacific Ocean variability. Glob. Planet. Chang. 2012, 86–87, 45–56. [Google Scholar] [CrossRef]
  34. Trouet, V.; Esper, J.; Graham, N.E.; Baker, A.; Scourse, J.D.; Frank, D.C. Persistent Positive North Atlantic Oscillation Mode Dominated the Medieval Climate Anomaly. Science 2009, 324, 78–80. [Google Scholar] [CrossRef] [Green Version]
  35. Biondi, F.; Gershunov, A.; Cayan, D.R. North Pacific decadal climate variability since 1661. J. Clim. 2001, 14, 5–10. [Google Scholar] [CrossRef]
  36. D’Arrigo, R.D.; Cook, E.R.; Mann, M.E.; Jacoby, G.C. Tree-ring reconstructions of temperature and sea-level pressure variability associated with the warm-season Arctic Oscillation since AD 1650. Geophys. Res. Lett. 2003, 30, 1549. [Google Scholar] [CrossRef]
  37. Xie, Y.; Jiang, H.; Xueqiang, W.; Ma, Z.; Chen, Y. Spatial-temporal changes of oases in Ejin Banner of the Heihe River Basin from 1963 to 2012. Arid. Land Geogr. 2014, 37, 776–792. (In Chinese) [Google Scholar]
  38. Fritts, H.C. Tree Rings and Climate; Blackburn Press: Caldwell, NJ, USA; Academic Press: London, UK, 2001; pp. 1–567. [Google Scholar]
  39. Fritts, H.C. Reconstructing Large-Scale Climatic Patterns from Tree-Ring Data; The University of Arizona Press: Tucson, AZ, USA, 1991; p. 286. [Google Scholar]
  40. Efron, B. Bootstrap Methods: Another Look at the Jackknife. Ann. Stat. 1979, 7, 1–26. [Google Scholar] [CrossRef]
  41. Mosteller, F.; Tukey, J.W. Data Analysis and Regression. A Second Course in Statistics; Addison-Wesley Series in Behavioral Science: Quantitative Methods, Reading; Addison-Wesley: Boston, MA, USA, 1977. [Google Scholar]
  42. Mann, M.E.; Lees, J.M. Robust estimation of background noise and signal detection in climatic time series. Clim. Chang. 1996, 33, 409–445. [Google Scholar] [CrossRef]
  43. Cook, E.R.; Meko, D.M.; Stahle, D.W.; Cleaveland, M.K. Drought reconstructions for the continental United States. J. Clim. 1999, 12, 1145–1162. [Google Scholar] [CrossRef]
  44. Durbin, J.; Watson, G.S. Testing for serial correlation in least squares regression. II. Biometrika 1951, 38, 159–179. [Google Scholar] [CrossRef]
  45. Porté, A.; Loustau, D. Seasonal and interannual variations in carbon isotope discrimination in a maritime pine (Pinus pinaster) stand assessed from the isotopic composition of cellulose in annual rings. Tree Physiol. 2001, 21, 861–868. [Google Scholar] [CrossRef] [Green Version]
  46. Lü, S.; Wang, X. Growth-climate response and winter precipitation reconstruction of Pinus sylvestris var. mongolicain A’li River of Greater Khingan Range. J. Northeast Normal Univ. Nat. Sci. Ed. 2014, 46, 110–116. (In Chinese) [Google Scholar]
  47. Farquhar, G.D.; Sharkey, T.D. Stomatal conductance and photosynthesis. Annu. Rev. Plant Physiol. 1982, 33, 317–345. [Google Scholar] [CrossRef]
  48. Yi, L.; Yu, H.; Ge, J.; Lai, Z.; Xu, X.; Qin, L.; Peng, S. Reconstructions of annual summer precipitation and temperature in north-central China since 1470 AD based on drought/flood index and tree-ring records. Clim. Chang. 2011, 110, 469–498. [Google Scholar] [CrossRef]
  49. Zhou, W.; Sun, Z.; Li, J.; Gang, C.; Zhang, C. Desertification dynamic and the relative roles of climate change and human activities in desertification in the Heihe River Basin based on NPP. J. Arid Land 2013, 5, 465–479. [Google Scholar] [CrossRef] [Green Version]
  50. Bao, G.; Liu, Y.; Linderholm, H.W. April-September mean maximum temperature inferred from Hailar pine (Pinus syl-vestris var. mongolica) tree rings in the Hulunbuir region, Inner Mongolia, back to 1868 AD. Palaeogeogr. Palaeoclimatol. Palaeoecol. 2012, 313, 162–172. [Google Scholar] [CrossRef]
  51. Liu, N.; Liu, Y.; Bao, G.; Bao, M.; Wang, Y.; Ge, Y.; Zhang, L.; Bao, W.; Tian, H. A tree-ring based reconstruction of summer relative humidity variability in eastern Mongolian Plateau and its associations with the Pacific and Indian Oceans. Palaeogeogr. Palaeoclim. Palaeoecol. 2015, 438, 113–123. [Google Scholar] [CrossRef]
  52. Liu, Y.; Wang, Y.; Li, Q.; Song, H.; Zhang, Y.; Yuan, Z.; Wang, Z. A tree-ring-based June-September mean relative humidity reconstruction since 1837 from the Yiwulü Mountain region, China. Int. J. Clim. 2015, 35, 1301–1308. [Google Scholar] [CrossRef]
  53. Allan, R.J.; Lindesay, J.A.; Parker, D.E. El Nino Southern Oscillation and Climatic Variability; CSIRO Publishing: Collingwood, Australia, 1996. [Google Scholar]
  54. Su, M.; Wang, H. Relationship and its instability of ENSO—Chinese variations in droughts and wet spells. Sci. China Ser. D Earth Sci. 2007, 50, 145–152. [Google Scholar] [CrossRef]
  55. Zhang, R.; Sumi, A.; Kimoto, M. A diagnostic study of the impact of El Niño on the precipitation in China. Adv. Atmos. Sci. 1999, 16, 229–241. [Google Scholar] [CrossRef]
  56. Lu, R.Y. Interannual variation of North China rainfall in rainy season and SSTs in the equatorial eastern Pacific. Chin. Sci. Bull. 2005, 50, 2069–2073. [Google Scholar] [CrossRef]
  57. Li, K. The shape of the sunspot cycle described by sunspot areas. Astron. Astrophys. 1999, 345, 1006–1010. [Google Scholar]
  58. Halberg, F.; Cornélissen, G.; Sothern, R.B.; Czaplicki, J.; Schwartzkopff, O. Thirty-five-year climatic cycle in heliogeophys-ics, psychophysiology, military politics, and economics. Izv. Atmos. Ocean. Phys. 2010, 46, 844–864. [Google Scholar] [CrossRef]
  59. Auer, G.; Piller, W.E.; Harzhauser, M. Two distinct decadal and centennial cyclicities forced marine upwelling intensity and precipitation during the late Early Miocene in central Europe. Clim. Past 2015, 11, 283–303. [Google Scholar] [CrossRef] [Green Version]
  60. Nagovitsyn, Y.A. Solar activity during the last two millennia: Solar patrol in ancient and medieval China. Geomagn. Aeron. 2001, 41, 680–688. [Google Scholar]
  61. Ogurtsov, M.G.; Nagovitsyn, Y.A.; Kocharov, G.E.; Jungne, R.H. Long-period cycles of the Sun’s activity recorded in direct solar data and proxies. Sol. Phys. 2002, 211, 371–394. [Google Scholar] [CrossRef]
  62. Fu, C.; Zheng, Z. Monsoon regions: The highest rate of precipitation changes observed from global data. Chin. Sci. Bull. 1998, 43, 662–666. [Google Scholar] [CrossRef]
  63. Balachandran, N.K.; Rind, D.; Lonergan, P.; Shindell, D. Effects of solar cycle variability on the lower stratosphere and the troposphere. J. Geophys. Res. Earth Surf. 1999, 104, 27321–27339. [Google Scholar] [CrossRef]
  64. Sutton, R.T.; Hodson, D.L.R. Atlantic Ocean Forcing of North American and European Summer Climate. Science 2005, 309, 115–118. [Google Scholar] [CrossRef]
  65. Li, C.; Wang, L.; Gu, W. Interannual time-scale relationship between Mongolia high and SST anomaly in the North Pacific in winter. Chin. J. Atmos. Sci. 2011, 35, 193–200. (In Chinese) [Google Scholar]
  66. Wu, B.; Wang, J. Possible impacts of winter Arctic Oscillation on Siberian high, the East Asian winter monsoon and sea-ice extent. Adv. Atmos. Sci. 2002, 19, 297–320. [Google Scholar]
Figure 1. Map showing the locations of the sampling site and the meteorological stations. Tree-ring sampling site (EJN06) is shown as red circle. Meteorological stations (EJN, GZH, DLZ and Anxi) are shown as solid black Squares.
Forests 13 01815 g001
Figure 2. Monthly total precipitation (a), mean minimum temperature (b), mean temperature (c) and mean maximum temperature (d) at EJN, GZH, DLZ stations.
Forests 13 01815 g002
Figure 3. Correlations of tree-ring ∆13C and monthly average meteorological data. Dotted/dashed line indicates the 95%/99% confidence level; D–S: Previous December to present September. P: Monthly total precipitation. T: mean temperature. Tmax: mean maximum temperature. Tmin: mean minimum temperature.
Forests 13 01815 g003
Figure 4. A comparison between the observed (green) and reconstructed (red) TDS.
Forests 13 01815 g004
Figure 5. Reconstructed TDS from 1901 to 2011 for the Ejina region (the bold line represents the 11-year moving average data).
Forests 13 01815 g005
Figure 6. Patterns of field correlation (p < 0.1). (a) Observed TDS with December–September CRU TS4.05 mean maximum temperature (the grid system is 0.5° × 0.5°); (b) Reconstructed TDS with December–September CRU TS4.05 temperature. Black dot represents sampling site.
Forests 13 01815 g006
Figure 7. Results of the MTM spectral density of the reconstruction. The red (blue) line is 95% (99%) confidence level.
Forests 13 01815 g007
Figure 8. Comparison between the reconstructed TDS (black) and the area (blue) of in Ejina oasis. Black line represents 3-year moving average reconstruction.
Forests 13 01815 g008
Figure 9. Comparison between the reconstructed TDS (red) and the observed (black) TDS of the Anxi station and the temperature index in north-central China (blue) [48]. (a) raw data; (b) 11-year average data. r1 and r3 represent correlation coefficients between the reconstructed TDS and the observed (black) TDS of the Anxi station on interannual and interdecadal scale, respectively; r2 and r4 represent correlation coefficients between the reconstructed TDS and the temperature index in north-central China on interannual and interdecadal scale, respectively.
Forests 13 01815 g009
Figure 10. A comparison of the AOPI (a), AOTI (b), PDO (c), NAO index (d), sunspot number (e), ENSO index (f) and the reconstructed TDS in this study (g). All curves are smoothed by an 11-year moving average.
Forests 13 01815 g010
Table 1. Correlation matrix of individual tree-ring δ13C series in 1901–2011.
Item06-01B06-03B06-04A
06-01B10.518 **0.539 **
06-03B 10.483 **
06-04A 1
** Significant at the 0.01 level (2-tailed).
Table 2. The statistics of tree-ring stable carbon isotope series.
Codenameδ13C13C
First-order autocorrelation0.8810.577
Minimum−27.706‰17.492‰
Maximum−24.813‰19.011‰
Mean−25.806‰18.187‰
Standard deviation0.5750.291
Variance0.3310.085
Skewness−0.7220.196
Kurtosis−0.0020.179
Coefficient of variation−0.0220.016
Table 3. Verification results of the canonical methods for the reconstruction.
PeriodS1S2tRE
1974–201126 *213.649 **0.436
S1 is the general sign test between observation and reconstruction that measures the association at all frequencies. S2 is made for the first differences, which reflects the high-frequency climatic variations. * Significant at the 0.05 level (2-tailed). ** Significant at the 0.01 level (2-tailed).
Table 4. Verification results of the Bootstrap and Jackknife methods.
Statistical ItemsCalibrationCalibration Bootstrap
(80 Iterations)
Jackknife
Mean (Interval)Mean (Interval)
r0.6600.66 (0.39–0.79)0.66 (0.62–0.68)
R20.4360.44 (0.15–0.62)0.44 (0.39–0.46)
R2adj0.4200.42 (0.13–0.61)0.42 (0.37–0.45)
σ0.5570.55 (0.43–0.65)0.57 (0.55–0.58)
F27.77930.33 (6.36–59.67)27.05 (21.89–30.05)
p0.0010.00 (0.00–0.02)0.00 (0.00–0.00)
D/W1.9931.92 (1.47–2.10)1.99 (1.67–2.19)
r: correlation coefficient; R2: squared multiple correlation; R2adj: adjusted squared multiple correlation; σ: standard error; F: F-value; p: p-value; D/W: Durbin-Watson value.
Publisher’s Note: MDPI stays neutral with regard to jurisdictional claims in published maps and institutional affiliations.

