Article

Conservation of Tree Species Richness in a Traditional Agroforestry Landscape in the Vhembe Biosphere Reserve, South Africa

by
Lucky Makhubele
1,2,*,
Paxie W. Chirwa
1,
Jonathan P. Sheppard
3,
Ratsodo P. Tshidzumba
1,2,
Mulugheta G. Araia
2 and
Hans-Peter Kahle
3
1
Forest Science Postgraduate Programme, Department of Plant and Soil Sciences, Faculty of Natural and Agricultural Sciences, University of Pretoria, 5-15 Plant Sciences Complex, Corner of Lynwood Rd and Roper St., Pretoria 0028, South Africa
2
Department of Forestry and Natural Resource Management, Fort Cox Agriculture and Forestry Training Institute, New College Admin, Middledrift 5685, South Africa
3
Chair of Forest Growth and Dendroecology, University of Freiburg, Tennenbacher Str. 4, 79106 Freiburg, Germany
*
Author to whom correspondence should be addressed.
Forests 2022, 13(11), 1766; https://doi.org/10.3390/f13111766
Submission received: 30 August 2022 / Revised: 13 October 2022 / Accepted: 25 October 2022 / Published: 27 October 2022
(This article belongs to the Section Forest Ecology and Management)

Abstract

:
Tree species richness is a critical element concerning trees on farms, on communal land and in protected areas to support biodiversity and socio-economic livelihoods in traditional agroforestry landscapes. Tree species richness is directly linked to the use of provisioning ecosystem services and to management practices in traditional agroforestry landscapes. The study aimed to investigate the link between socio-ecological and conservation strategies regarding tree species richness in traditional agroforestry landscapes. The study was conducted in the Damani, Thenzheni, Tshiombo and Tshipako villages located in Thulamela Municipality of the Vhembe Biosphere Reserve, South Africa. The data were collected using a mixed method approach combining forestry inventory and focus group discussion. The study recorded a total number of 126 tree species: 83 communal-land-hosted species, 68 species of trees on farms and 81 species in the protected areas. The indigenous species Englerophytum magalismontanum (Sond.) T.D.Penn. was the most cited (62%) by interviewees, with a primary use for wild fruits, followed by Pteleopsis myrtifolia (M.A. Lawson) Engl. & Diels. (57%) for fuelwood, Combretum molle R.Br. ex G.Don (36%) for traditional medicine and Albizia adianthifolia (Schumach.) W.F.Wight (12%) for fodder. Species richness was found to be commonly driven by provisioning ecosystem services with trees on farms and on communal land. Distance was found to be major driving factor of species richness in protected areas. This study found that the local people have no conservation strategy and practices targeting the enhancement of tree species richness in the traditional agroforestry landscape. This study advocates for the establishment of a conservation strategic framework for restoring tree species richness by targeting traditional agroforestry landscapes.

1. Introduction

The majority of people in Limpopo Province in South Africa depend on forest ecosystems for their daily livelihoods [1,2]. This close dependency on the forest ecosystem is largely influenced by socio-economic and cultural factors [1]. The Vhembe Biosphere Reserve (VBR) is one of the tropical climatic zones in Limpopo Province and is known for its few remaining forest patches and its richness of floristic diversity [3]. A larger portion of the population in the biosphere live in rural areas [2] and sustain their livelihoods by relying on provisioning ecosystem services (PES) such as the harvesting of natural resources for subsistence or commercial purposes [4]. The forest ecosystem itself is an epicentre of ecosystem services (ES) provision and species biodiversity [5]; nevertheless, the forest eco-system alone within human-dominated landscapes is not adequate to sustain biodiversity and ES provision simultaneously [5]. Multifunctional landscapes that incorporate production and biodiversity conservation objectives, especially those that have shaped the rural landscape over the longer term, can be defined as Traditional Agroforestry Landscapes (TAL); such areas, therefore, have become increasingly important in landscapes dominated by human activity [5,6].
Traditional Agroforestry Landscapes in VBR provide multiple services that are crucial for the sustenance and maintenance of the livelihood of communities. These include the provision of food, medicines, fuels, handcrafts and building materials [7]. However, the sustainability of PESs relies on the level of biodiversity retained in multifunctional agroforestry landscapes. In addition, supporting and regulating services are important in all associated ecosystems, such as protection (e.g., protection of soil and water) and landscape productivity (e.g., species biodiversity) in associated forest ecosystems within the region [8,9]. Moreover, TALs provide similar ecosystem services as the forest, such as the provisioning of non-timber forest products, regulating climate, supporting nutrients cycling and cultural services [10]. At the same time, TALs reduce the pressure on the few remaining adjacent intact forest ecosystems in the landscape [11]. Thus, the biodiversity in the TALs is fundamental to the livelihoods of the indigenous community [7]. Therefore, the protection and conservation of species biodiversity within these systems are indispensable for the sustenance of biodiversity and rural welfare [11].
The traditional agroforestry landscape is a historic landscape management practice that deliberately integrates multipurpose trees, shrubs, livestock, crops and horticulture crops in a single land management unit [12,13]. The benefits of TALs are well documented [9,10]; yet, from a research and development point of view, traditional agroforestry in South Africa is seldom recognised and promoted, nor applied. Little effort has been made in the study and promotion of traditional agroforestry in South Africa. In general, agroforestry information and research in South Africa is limited and fragmented in terms of functioning and dynamics [14,15].
South Africa’s agroforestry strategic framework primarily focuses on upscaling and promoting modern agroforestry systems rather than acknowledging and upholding traditional agroforestry practices [14]. Nonetheless, the framework emphasises support for rural agroforestry systems and emphasises the identification of indigenous tree species that can further be developed for integration in agroforestry applications [15]. The potential of agroforestry to improve people’s livelihoods while mitigating climate change and providing resilience to the environment has elicited its world adoptions [9]. Accounting for the benefits delivered by agroforestry systems, such as those reviewed by Sheppard et al. [10] alongside South Africa’s agroforestry strategic framework [15], there is a clear need to identify potential agroforestry interventions for testing and promotion in South Africa.
In developing and the least developed countries such as those found in southern Africa, approximately 20% of indigenous communities derive livelihoods and basic needs from trees and forests [10]. Billions of people around the world live within or in proximity to forests and depend on natural resources for survival [16]; agroforestry systems can supplement that necessity. A high dependence on natural resources affects both TALs and forests [14]. Similar to the global trends, the unprecedented rise of poverty and unemployment in rural communities of South Africa has undoubtedly enabled a huge reliance on natural resources for survival and the massive exploitation of PESs.
Millions of South Africans in areas of limited economic activities harvest fuelwood, wild food, medicines and other forest resources for both commercial and subsistence purposes [2,3,17]. Approximately ZAR 47 billion (USD 2.8 billion) per year of provisioning ecosystem resources are harvested for household consumption by the rural inhabitants of South Africa [3]. Furthermore, a huge dependency on forest resources by rural communities in South Africa is exerting more pressure on TALs, indigenous forests and woodlands [18]. However, the extent of resources used and the impact thereof on biodiversity within TALs are not well documented. The main objective of the study was to investigate the link between socio-ecological and conservation strategies on tree species richness in traditional agroforestry landscapes. The leading questions were: (i) Are there differences in tree species richness between different land uses within TALs? (ii) Is there a link between conservation strategies and tree species richness in TALs? (iii) Do socio-ecological factors have an impact on tree species richness in TALs?

2. Materials and Methods
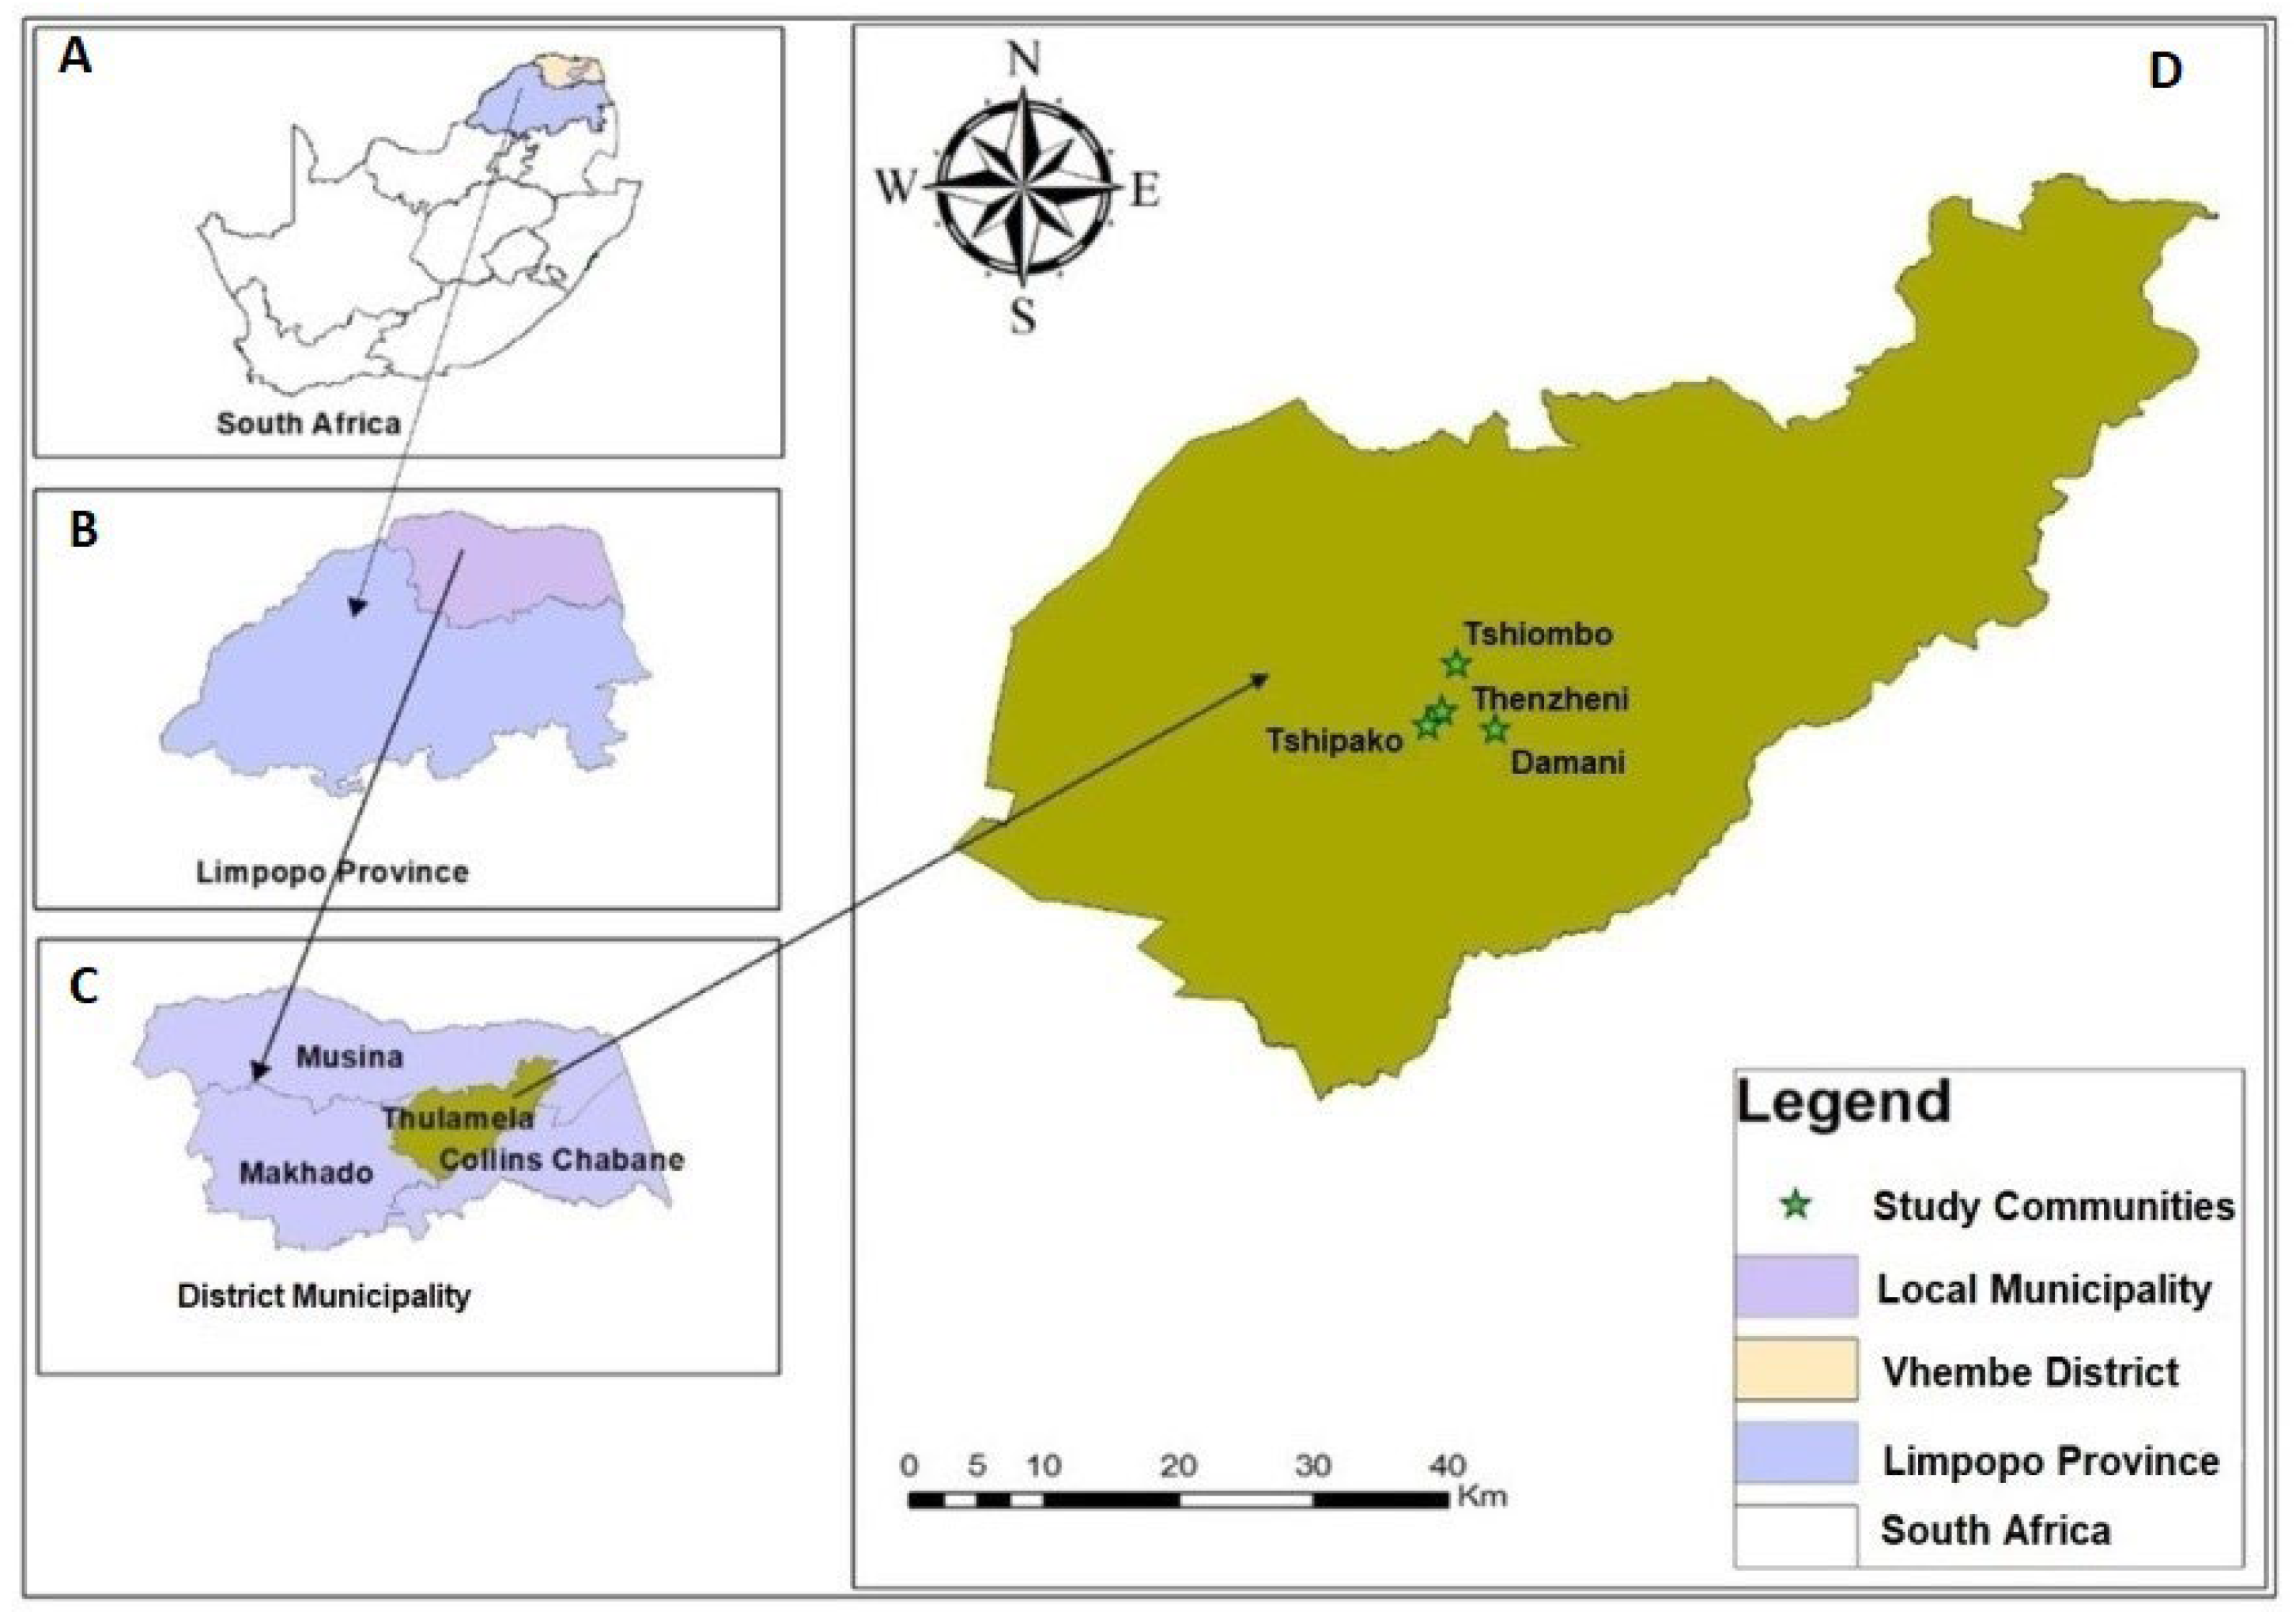
2.1. Study Area

The study area was conducted in the Thulamela local municipality in the south-eastern part of the Soutpansberg Mountain range in the Vhembe Biosphere Reserve (VBR), South Africa. The VBR was recognised and designated in 2009 by the United Nations Educational, Scientific and Cultural Organisation (UNESCO) [19]. The Soutpansberg Mountain range is classified as the centre for botanical endemism in southern Africa and the biodiversity hotspot of South Africa [20,21]. The study was conducted in four villages (Damani (22°50′45 S, 30°31′38 E), Thenzheni (22°49′54 S, 30°28′57 E), Tshiombo (22°48′30 S, 30°30′53 E) and Tshipako (22°51′14 S, 30°28′59 E)) located in Thulamela Municipality, Vhembe District, Limpopo province, which is part of the VBR (Figure 1). The study area is characterised by tropical climatic conditions with high annual precipitation, which favours both agriculture and forestry activities [22]. The traditional agroforestry landscape of the VBR consists of different agroforestry practices and land uses including alley cropping, home-gardens, windbreaks, silvopasture, trees on farms, live fences, protected areas, communal land use areas and forests [23]. The local people of VBR conserve indigenous tree species within and outside the homesteads. Such indigenous trees are commonly used for timber, medicine, wild fruits, fuelwood, fodder, wild food, timber, soil improvement, fencing and building materials [22].

2.2. Data Collection—Fieldwork

This study used mixed methods (quantitative and qualitative); this approach helped to understand the socioecological problems under investigation in depth [24,25]. The quantitative method was used to collect vegetation data through inventory [25]. The study sites were selected based on the premise that the study communities practice land management systems that fit with traditional agroforestry landscapes and were in proximity to the biodiversity hot spot of the Soutpansberg Mountain [26,27] in the VBR. Data collection was conducted in all four study communities during August 2021. In each community, three land-uses were identified: (i) trees located within farmed landscapes (hereafter, “trees on farms”), (ii) trees within communal lands and (iii) tribal protected areas (hereafter, “protected areas”). Three transects, each being 150 m long, were established 200 m apart along a linear transect in each land use. Five rectangular plots of 20 m × 10 m (200 m2) in each transect were established for inventory, with a sampling intensity of 10% [28]. The trees were categorised into three categories based on growth form and size: (i) a woody plant with a diameter at breast height (DBH, at 1.3 m) of greater than 5 cm and a total height greater than 2 m; (ii) a shrub with a DBH of less than 5 cm and a height of less than 2 m; (iii) seedlings which were counted in subplots. A calliper and diameter tape (for trees with a girth, >50 cm) were used to measure the DBH, and an electronic clinometer (Haglof, Sweden) was used to measure tree height. The first plot was marked randomly, and then the following plots were marked systematically along the transect line, 25 m apart, corresponding to the first plot. Within each rectangular plot, five 2 m × 2 m sub-plots were established for sampling; only the number of individuals, local names and scientific names were recorded.

2.3. Data Collection—Focus Group Discussion

The qualitative method was used to collect data through focus group discussions [29]. Focus Group Discussions (FGDs) were conducted to obtain more data that would help to understand the community members’ perceptions concerning tree species richness and conservation strategies. This allowed participants to provide a wide range of information. The FGD participants were a combined group of community leaders and community members. Four FGDs were conducted with four communities, Damani (n = 15), Tshipako (n = 23), Thenzheni (n = 16) and Tshiombo (n = 13). Each FGD session lasted for about 1 h. The leading questions were structured as follows: (i) What are the tree species used for fodder, fuelwood, traditional medicine and food? (ii) What are the conservation strategies for traditional agroforestry and other tree-based systems? Each participant was given an opportunity to discuss and raise questions under the facilitation of the researcher. The discussions from the FGDs were recorded for content analysis.

2.4. Vegetation Analysis

Plymouth Routines in Multivariate Ecological Research (PRIMER-e) software: (Version 7.0.21, Auckland, New Zealand) with add-on PERMANOVA+ was used to analyse the biological data. The permutation number to estimate the probabilities was set at 999 [30].

2.4.1. Species Richness in Different Land-Uses

The sampling effectiveness effort was tested to evaluate the sufficiency of sampling [31]; the sufficient sampling effort captures about ≥80% of estimated species richness [6]. The species richness estimate was performed using a bootstrapping technique [30]. Then, the species accumulation curve was computed to demonstrate the species richness; these indices compared the variety of species richness in different land-uses. To determine the significant difference in species richness among the land-uses, the Margalef index (d) for overall species richness was determined using the DIVERSE function in PRIMER-e [30]. The Margalef index was calculated as follows in Equation (1):
d = ( S 1 ) log N
where S = the species count, and N = the total number of individuals [32]. In a following step, the Euclidean distance sample plots were developed using the resemblance matrix of the Margalef index [6]. Based on the species richness data, significant differences in species richness among different land-uses (trees on farms, communal land and protected areas) were tested with permutation multivariate analysis of variance (PERMANOVA) [30]. Pairwise comparison tests with 999 PERMANOVA permutations and t statistics were conducted to assess the significance of difference between the land-use pairs “trees on farms × communal land, communal land × protected areas, trees on farms × protected areas” for species richness data. Additionally, species richness analysis and assemblage illustration among the land-uses were analysed using non-parametric multidimensional scaling (nMDS) in PRIMER-e using the Bray–Curtis dis/similarity index [33].

2.4.2. The Variance of Species Richness among Different Land-Uses

To assess the significance of variance among the land-uses, the homogeneity of dispersion (PERMDISP) was tested using the Bray–Curtis coefficient matrix with 999 permutations [30]. A pairwise comparison of land-uses was conducted to show variance between land-use groups. Then, a dissimilarity within-group means square was generated using the Bray–Curtis dis/similarity index in PERMDISP [30]. The principal component analysis (PCO) was used to test the homogeneity of variance among land-uses [30]. In this analysis, the distance among land-uses was obtained using the Euclidean distance.

2.4.3. Drivers of Species Richness in Different Land-Uses

The inter-correlations among the change drivers were tested using the Multicollinearity test of the correlation matrix in PRIMER-e Draftsman plot. The pairs of all variables’ correlation were below the threshold (|r| ≥ 0.95); therefore, they contain effectively different information and are not redundant [30]. Then, the link between the change drivers and land-uses was tested using distance-based linear modelling (DISTLM) and distance-based redundancy analysis (dbRDA) [6]. A dbRDA plot obtained from PERMANOVA using DISTLM was used to visualise the patterns of the DISTLM results.

2.4.4. Species Richness Distribution in Different Land-Uses

Significant species richness distribution differences among the land-uses were tested using analysis of similarities (ANOSIM), and similarities percentages analysis (SIMPER) was used to identify dominant tree species (cut of 70%) and the abundance contribution to each land-use. The tests were conducted using the Bray–Curtis dis/similarity index [32]. Then, the dominance of each tree species (top 30) was visualised in shade plots.

2.5. Social-Ecological Data Analysis—Focus Group Discussion

To understand the perceptions of the local people and the community leadership and the use and management of the tree species richness in TALs, a comprehensive qualitative analysis of focus group discussion data was performed. The focus group discussion participants and the informants’ consensus on utility categories were analysed using fidelity level [34] and were calculated as follows in Equation (2):
F L = ( I p I u ) ×   100 %
where FL = fidelity level, Ip = number of participants that cited the principal use of the species and Iu = total number of participants that cited the species for any purpose.
Content analysis was performed for the themes or subjects discussed with participants [35]. The categorising of themes or subjects was carried out through manifest analysis [36]. The variability and reliability were assessed through a crossing evaluation of the participant’s responses.

3. Results

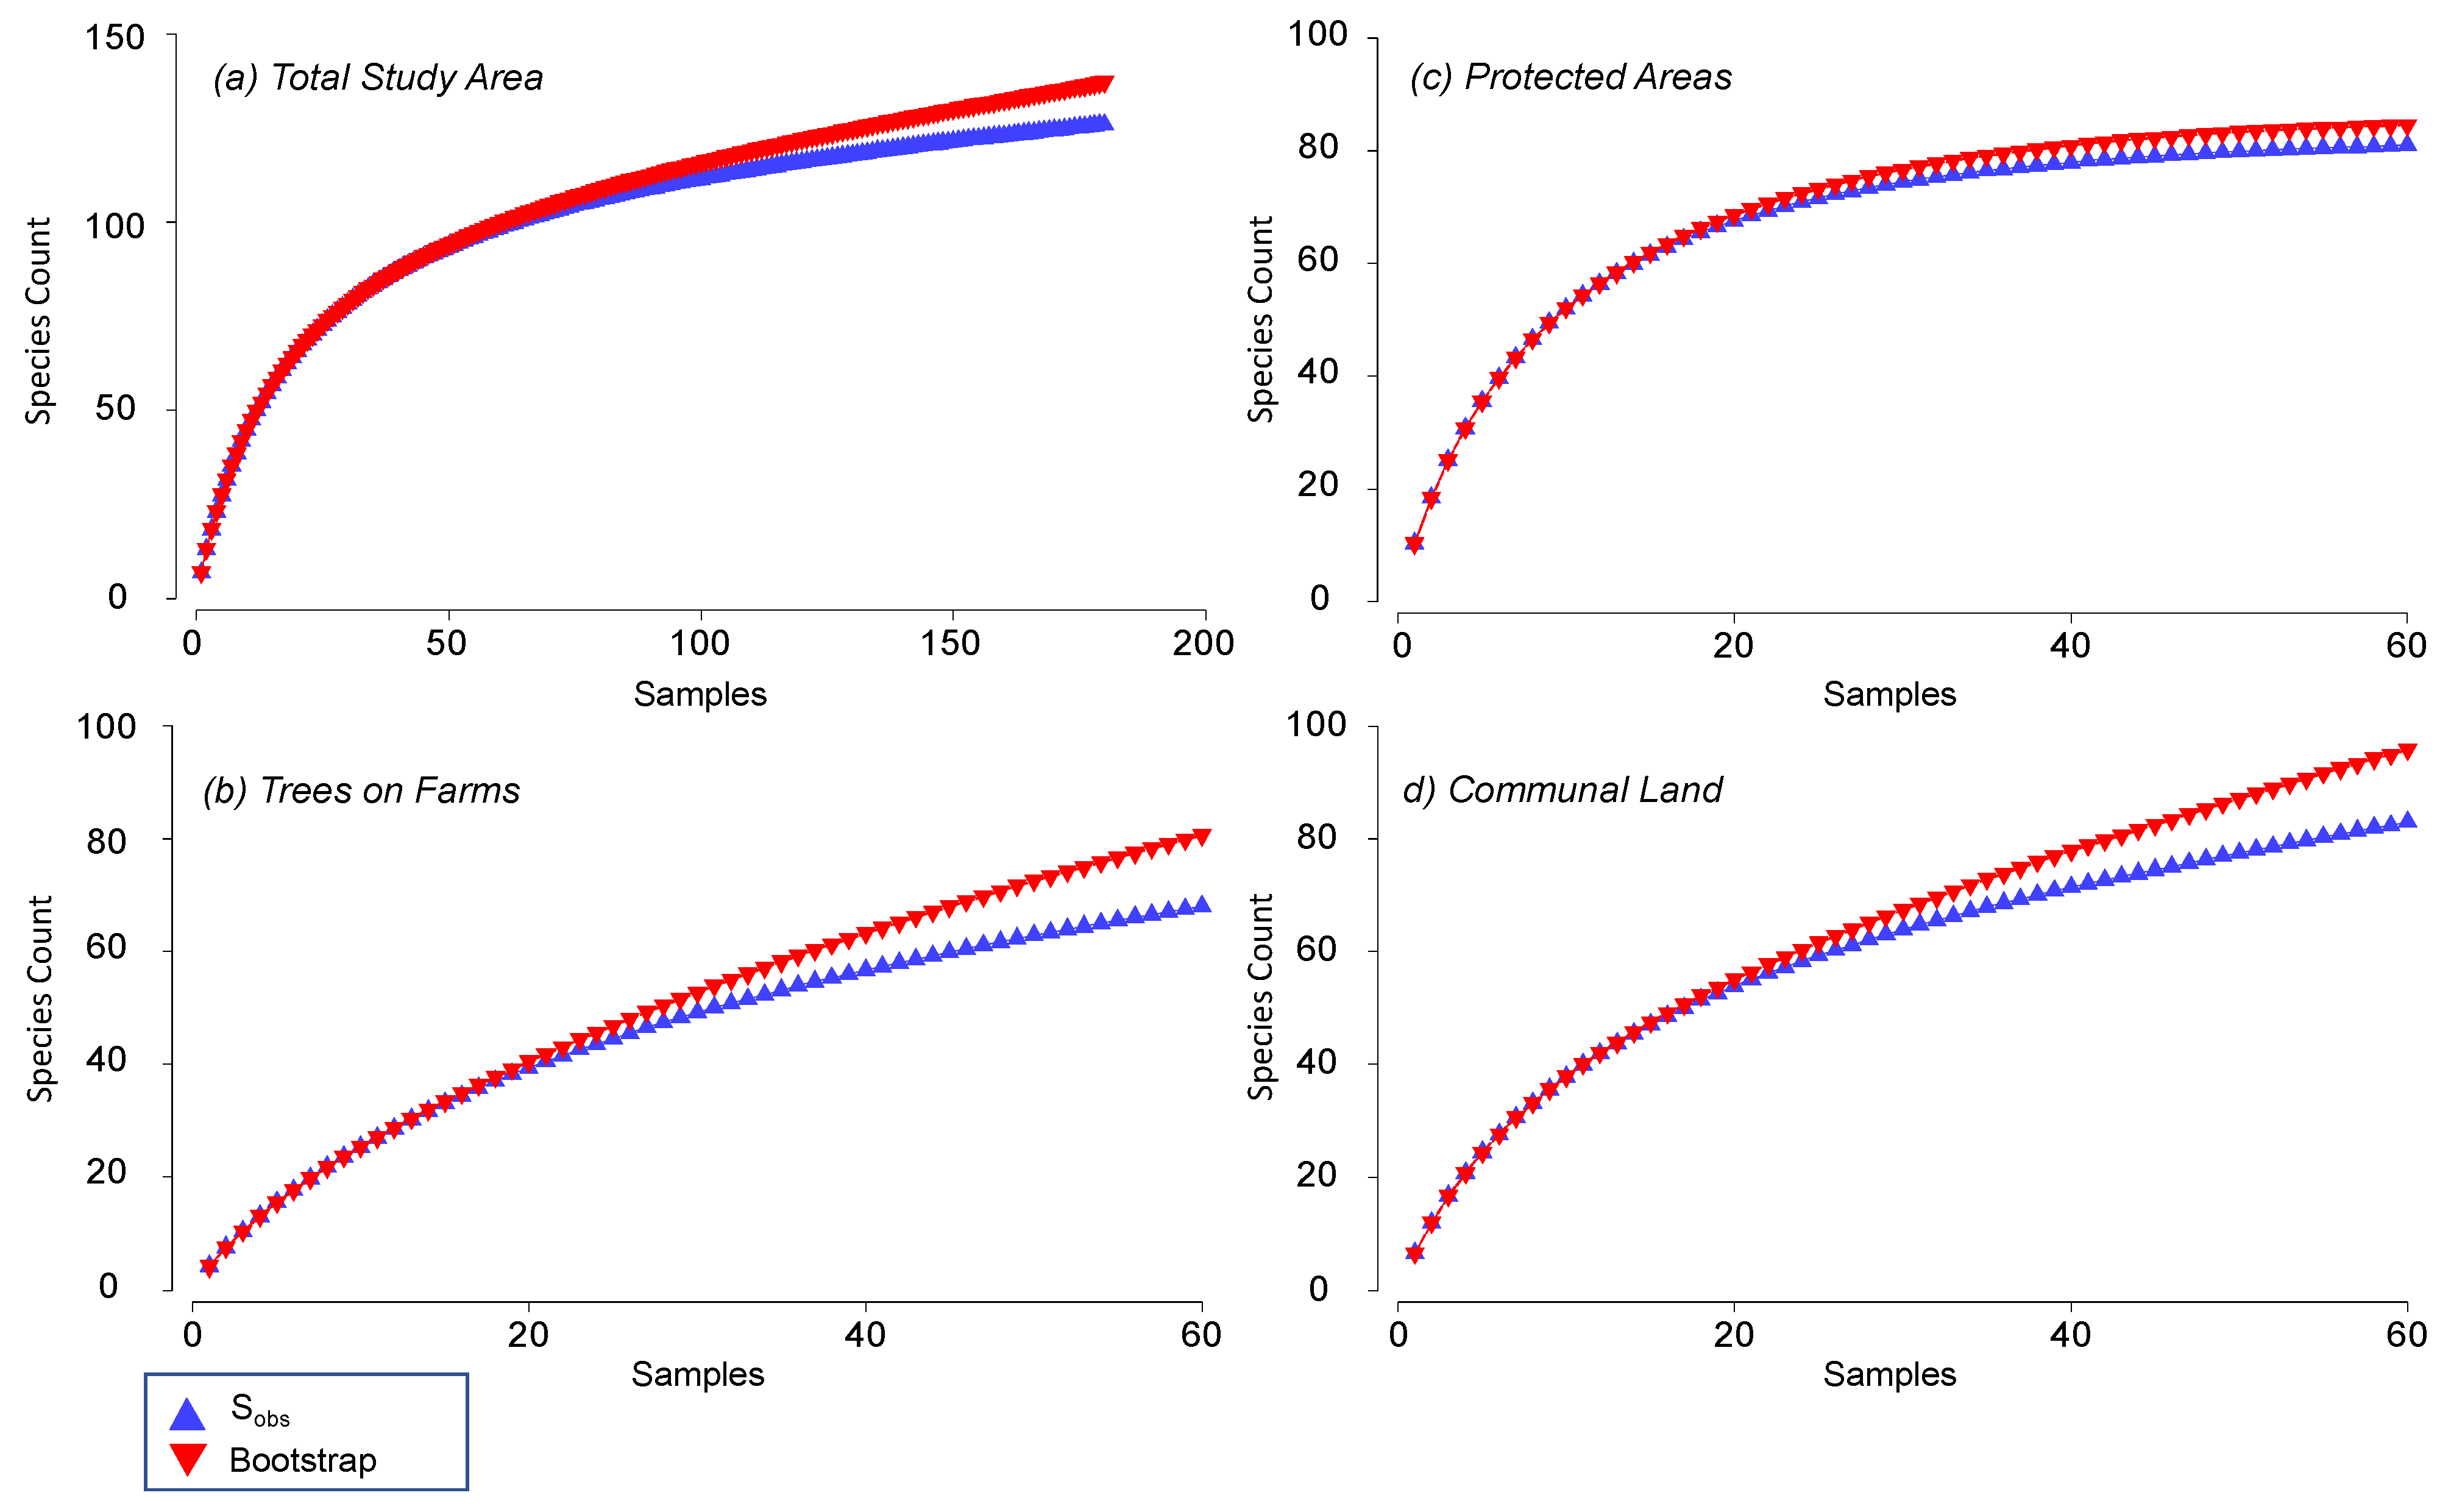
3.1. Species Richness in Different Land-Uses

A total of 2716 individual trees were recorded, of which 636 were trees on farms, 853 were individual trees on communal land and 1227 were in protected areas. Significant differences among the study villages were tested using analysis of similarities (ANOSIM); the results were statistically not significant (p > 0.5). Therefore, the different land uses were compared. The bootstrapped species accumulation curve demonstrated that the species sampling captured the full range of species within the defined land-use categories (Figure 2).
This study recorded a total number of 126 tree species, of which communal land, farms and the protected areas hosted 83, 68 and 81 species, respectively (Table 1). The sampling effectiveness of the whole study was calculated as 92% of the effort, and in each land-use, trees on farms, communal land and protected areas were individually 84%, 87% and 96%.
The PERMANOVA test detected a significant difference in species richness among land-uses (F18.015; p ≤ 0.001), while there were no significant differences among the villages (F1.9945; p = 0.016) (Table 2). Then, a pairwise comparison was conducted to compare the species richness significance difference between the land-uses. The species richness significantly differed across all the land-uses (Trees on farms and Communal land, t = 4.5 ,   p 0.05 ; Trees on farms and Protected areas, t = 5.5 ,   p 0.05 ; and Communal land and Protected areas, t = 2.3 ,   p 0.05 ). The average similarity showed that there was a high similarity between the communal land and protected areas (25%), followed by a medium-level similarity (21%) between trees on farms and communal land and a low average similarity between trees on farms and protected areas (17%) (Table 3).
Figure 3 shows the result of the nMDS tree species richness assemblage. Distinct clustering can be seen between categories, showing a limited overlap for trees on farms and protected areas, while the communal land shares species with both categories.

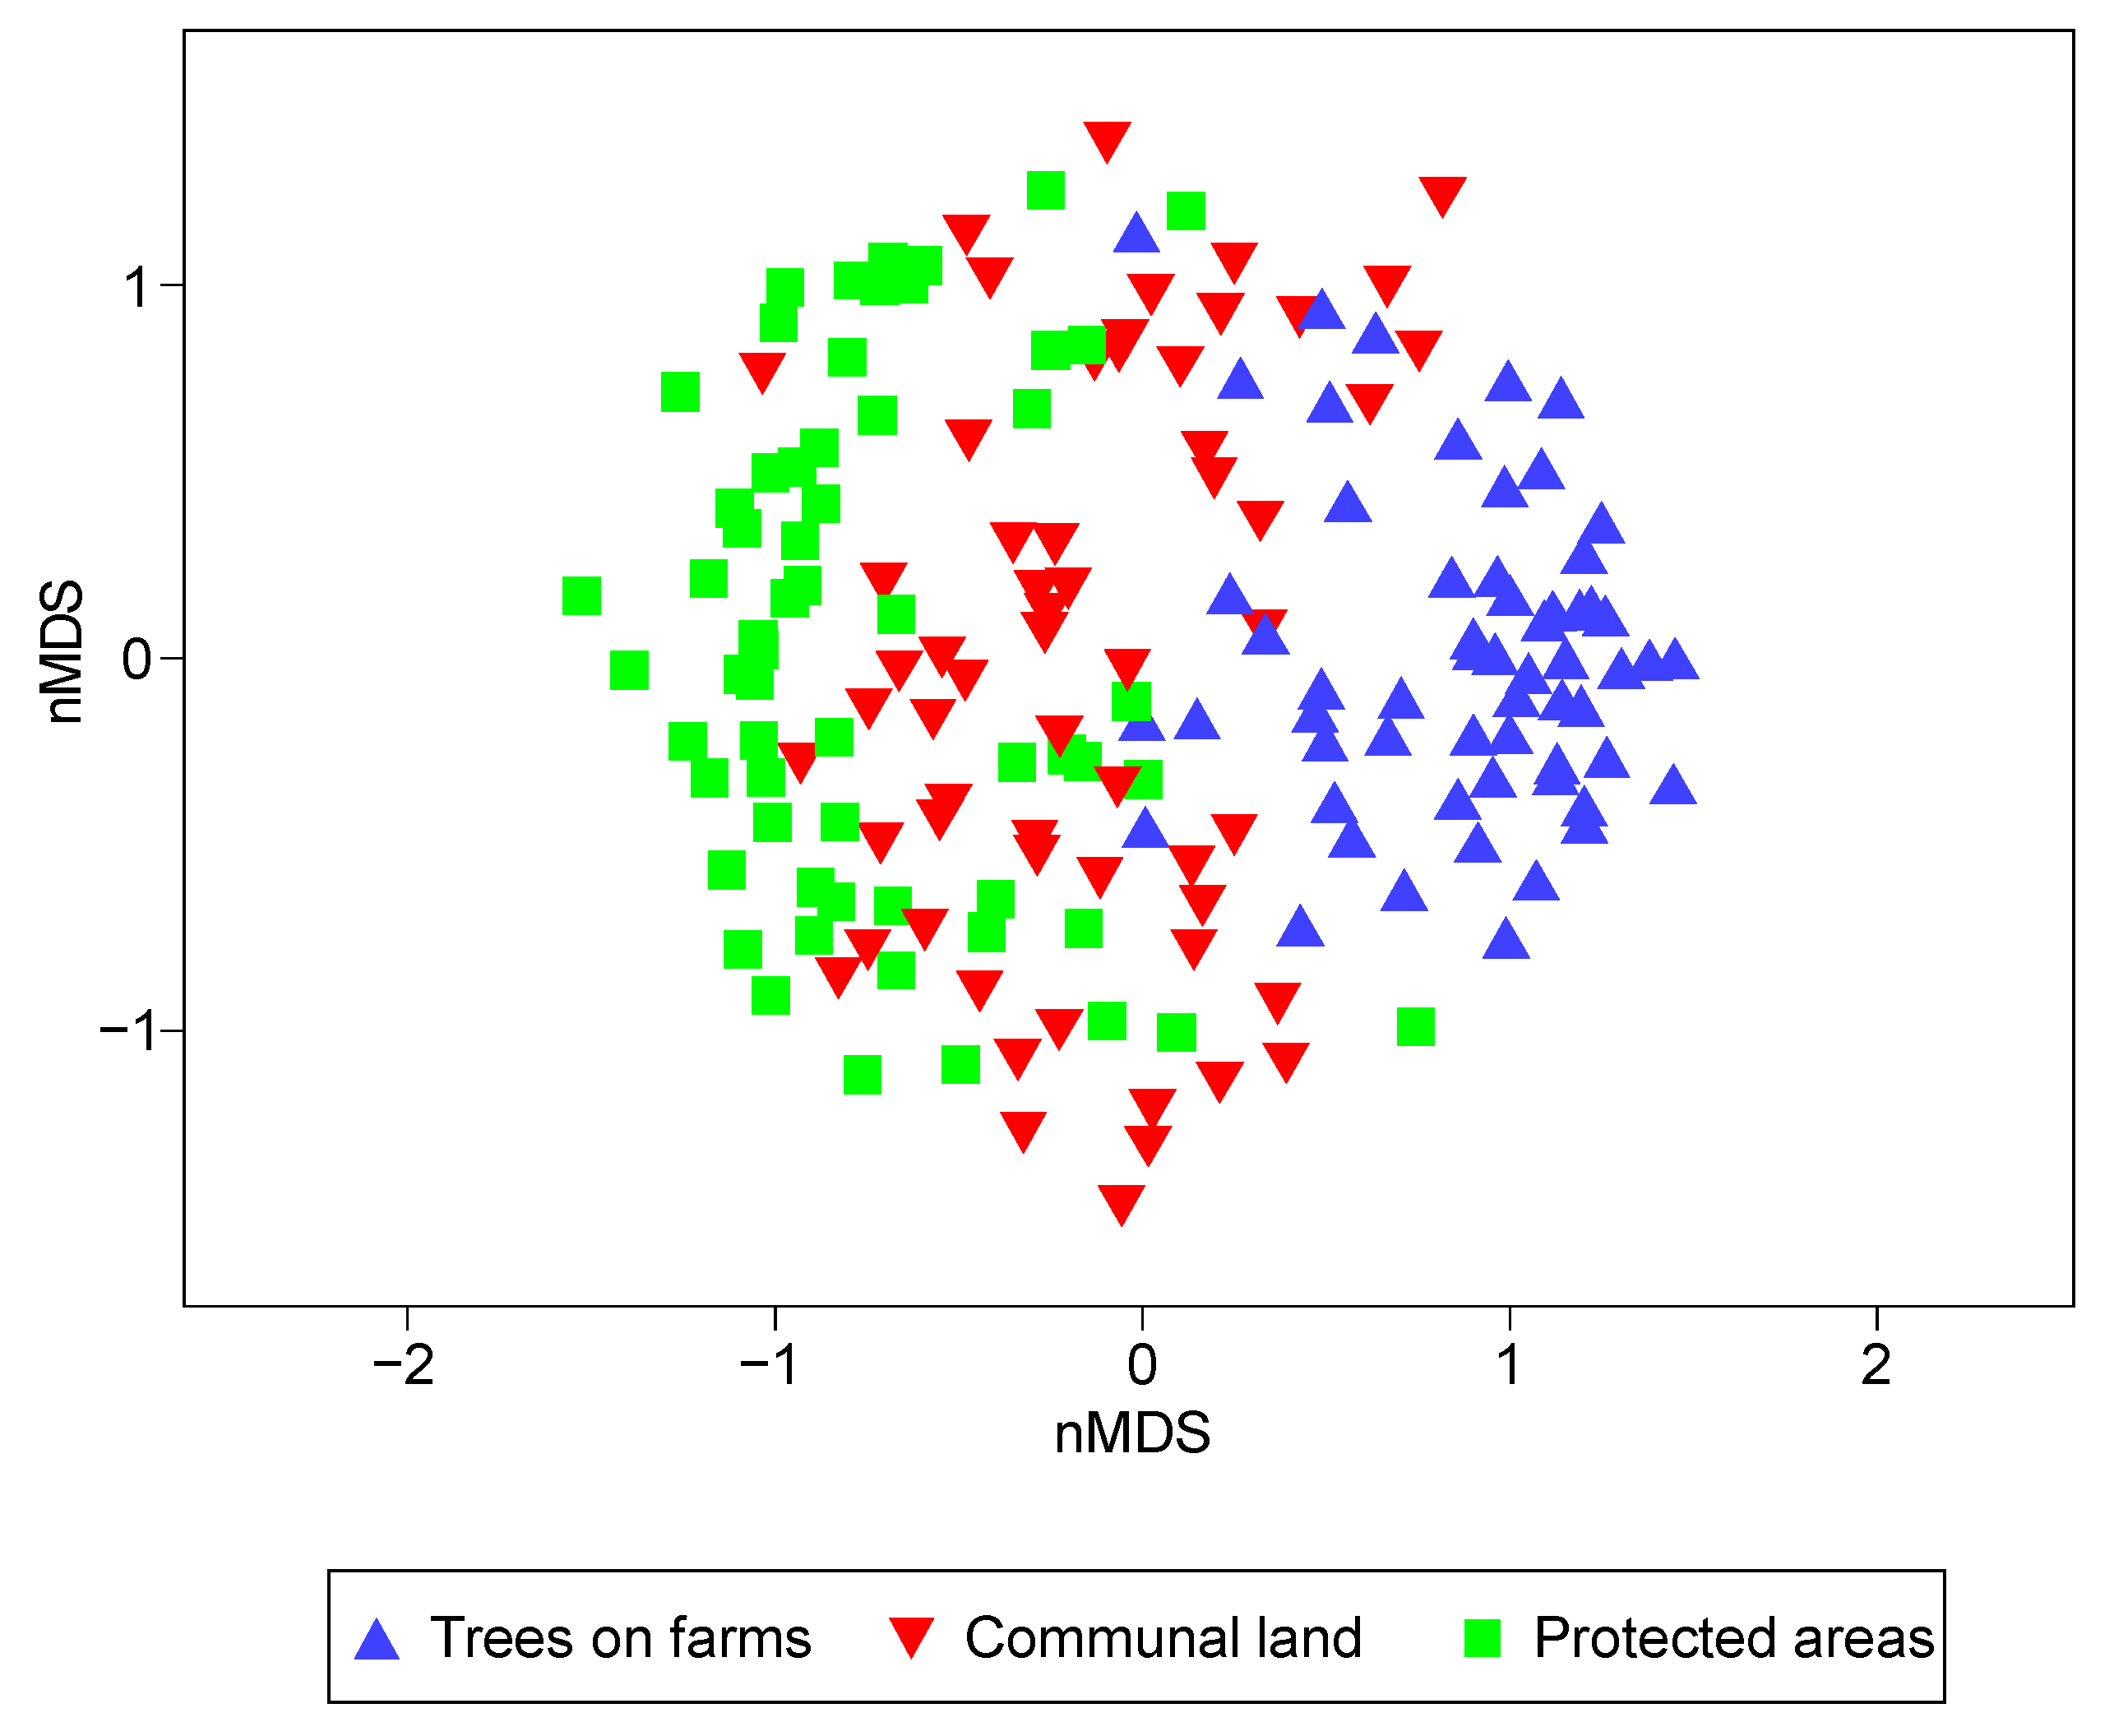
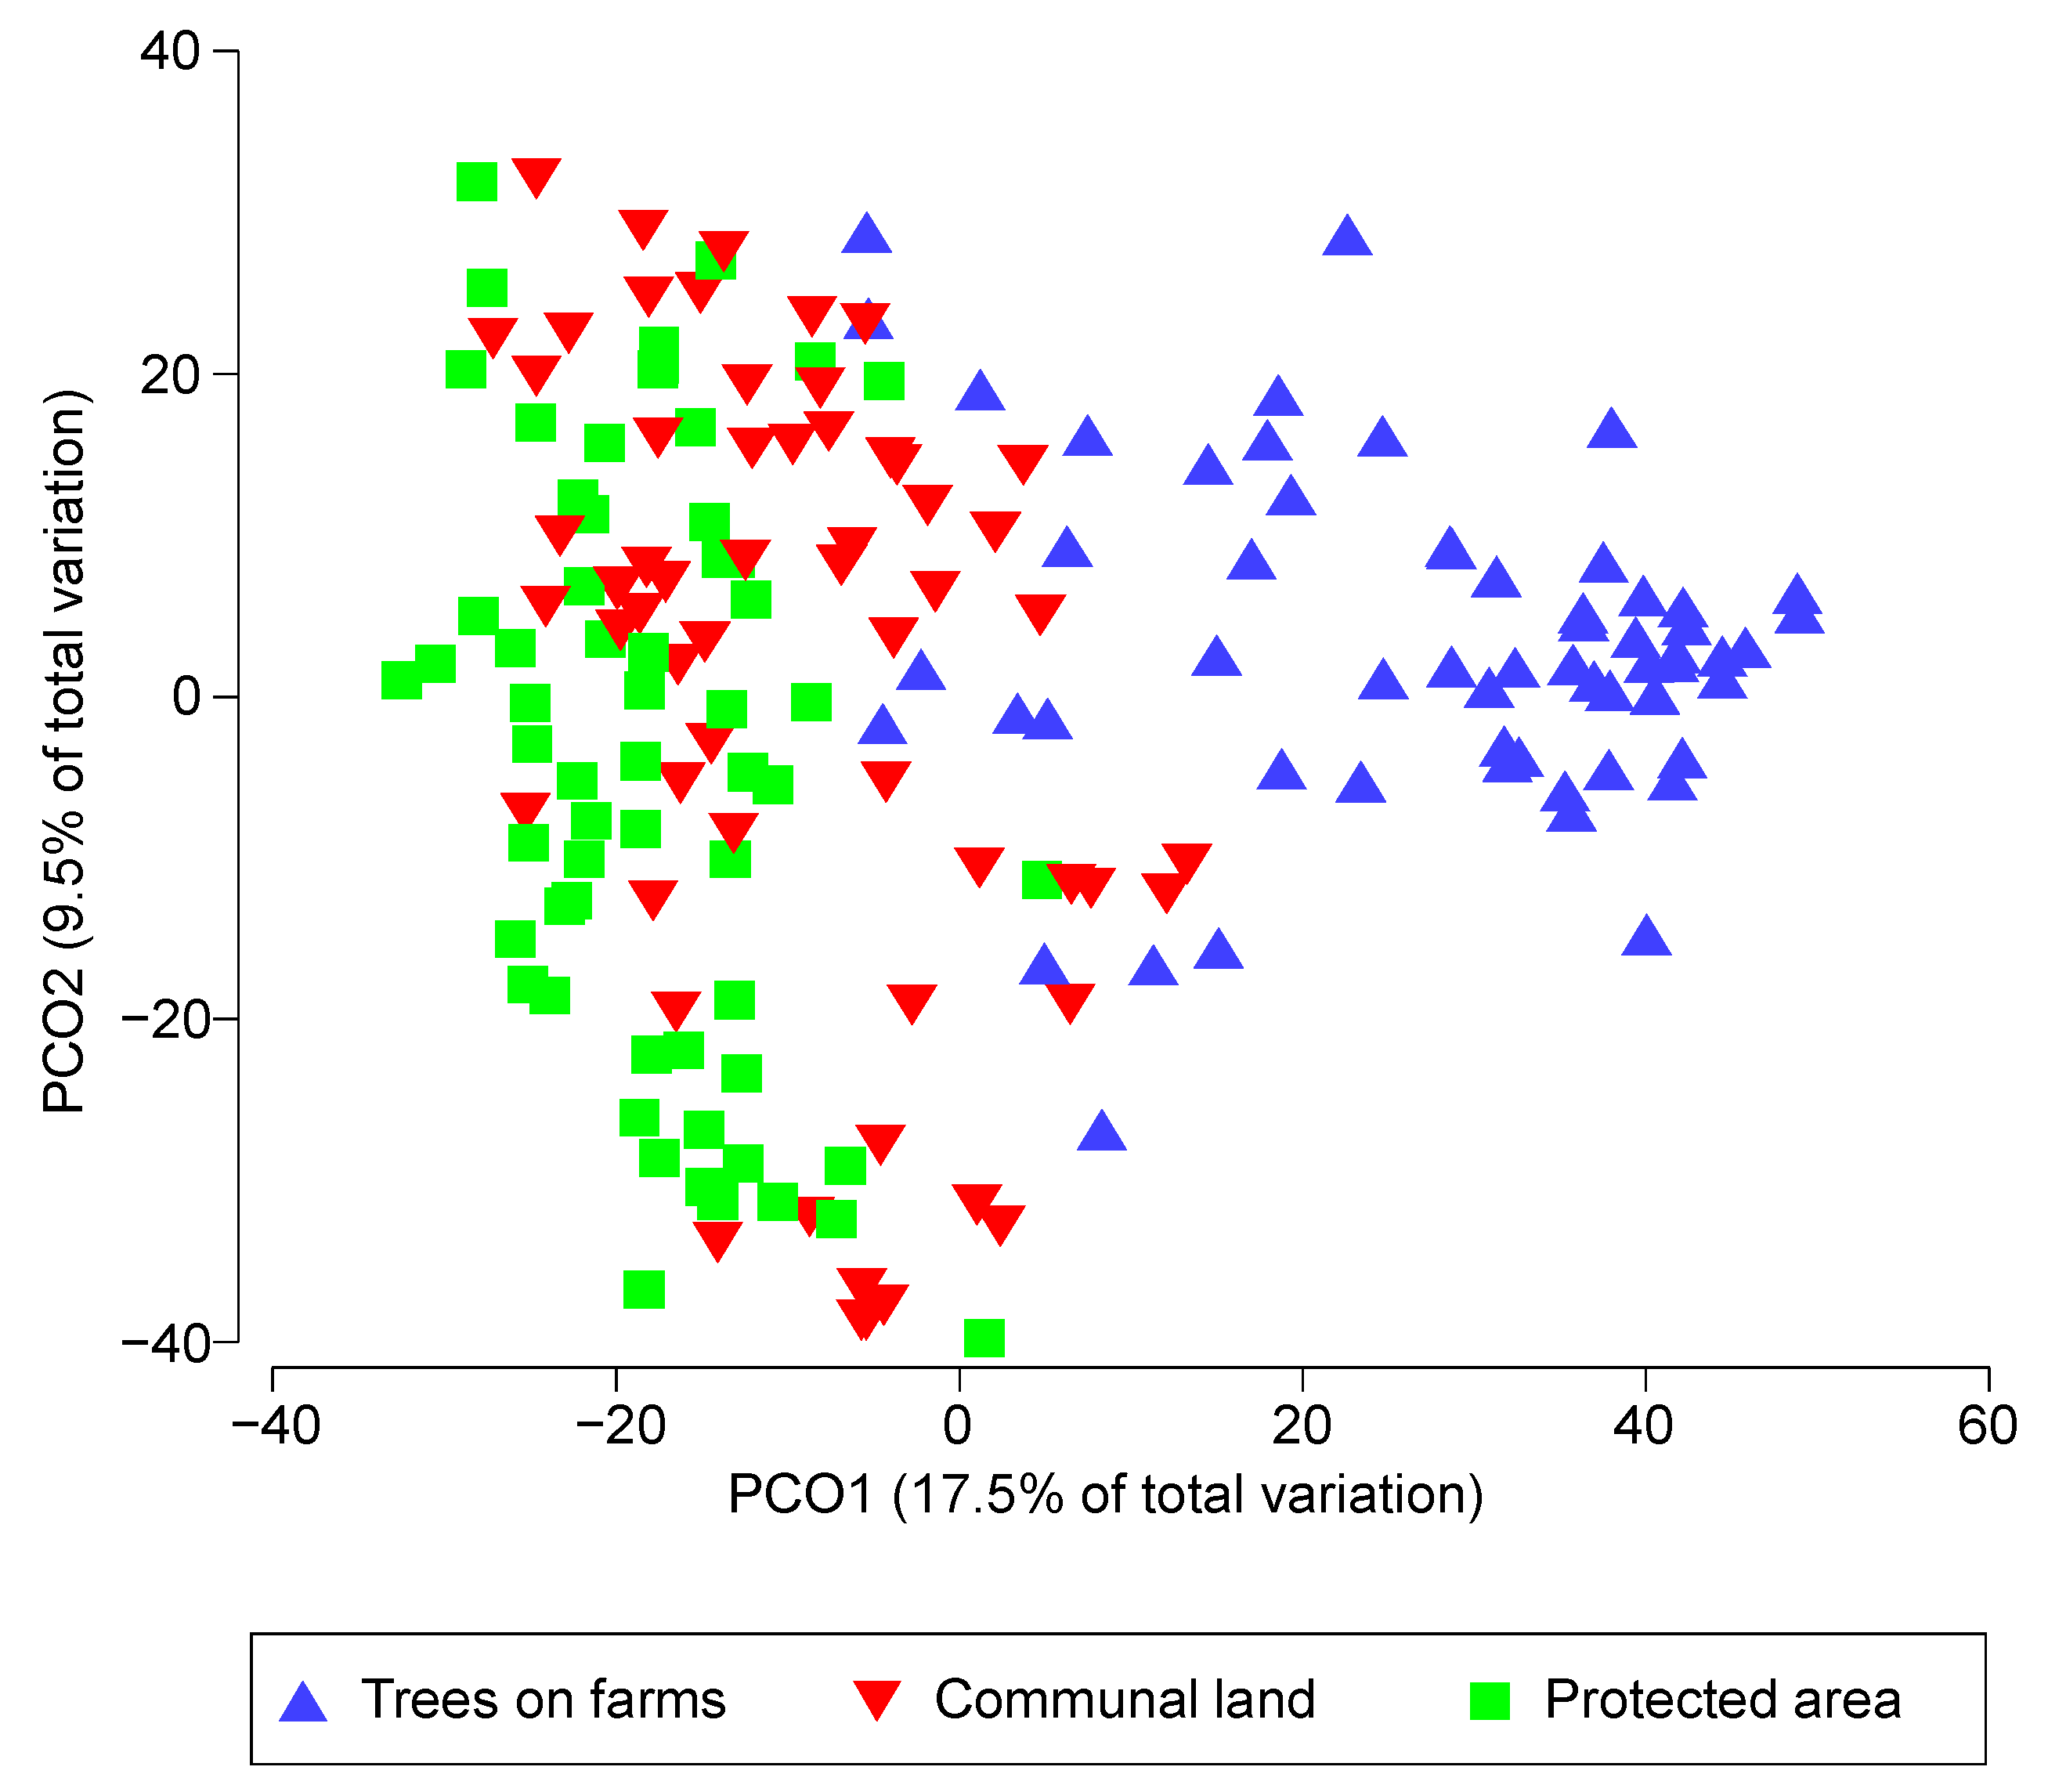
3.2. The Variance of Species Richness among Different Land-Uses

The homogeneity of multivariate dispersion (PERMDISP) results showed a significant difference in species variation among the land-uses (F = 15.79, p ≤ 0.001). The PERMDISP pairwise comparisons support the significant difference in land-uses (Table 4). The trees on farms category differed significantly from communal land (t = 4.4022, p ≤ 0.001). Likewise, the trees on farms differed significantly from protected areas (t = 4.2802, p ≤ 0.001). The species variation of communal land and a protected area was not statistically distinct (t = 0.45084, p = 0.673). The species richness variation average dissimilarity within the land-uses was 45% at trees on farms, 52% on communal land and 51% in protected areas (Table 4). The PCO explained 27% of the variation among the land-uses—9.5% and 17.5%, respectively, between axes (Figure 4).

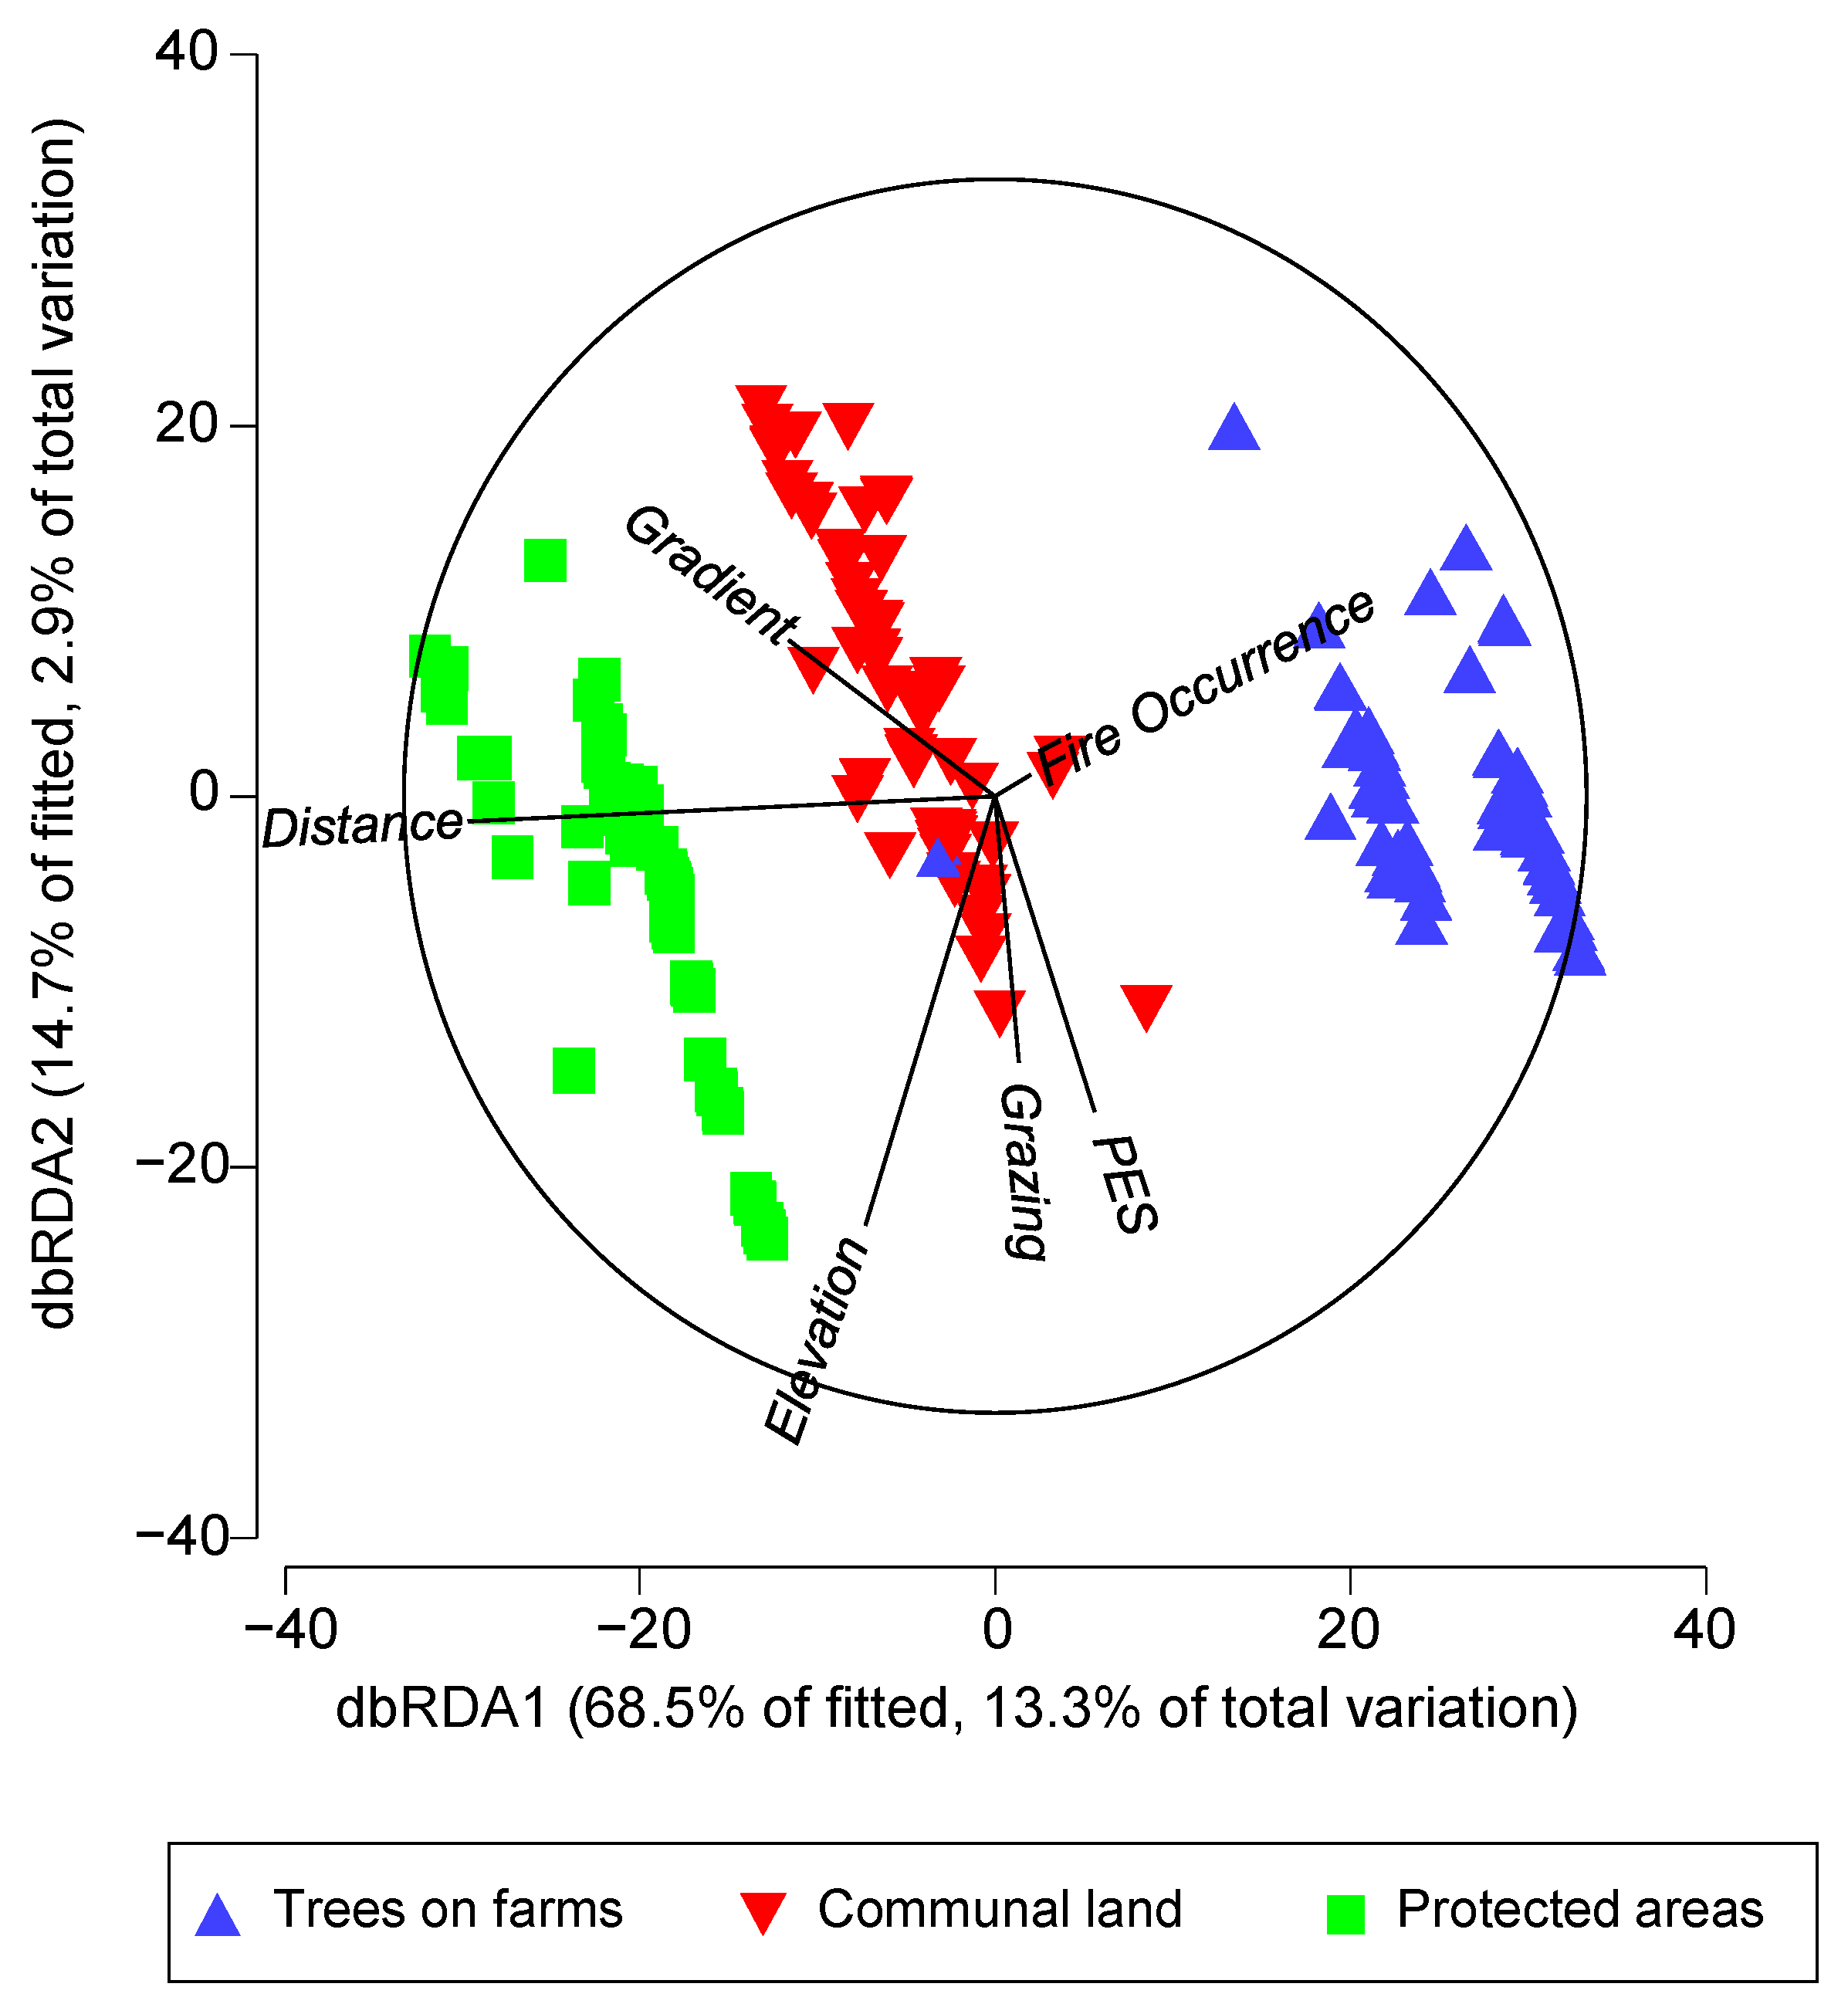
3.3. Drivers of Species Richness in Different Land-Uses

The DISTLM results showed that there was a significant correlation between species richness and most of the socio-ecological factors examined (R2 = 0.194, p ≤ 0.001). The marginal test showed a significant relationship (p ≤ 0.001) between species richness (all land-uses) and most socio-ecological factors (elevation, gradient, PES harvesting, grazing and distance), except for fire occurrence (p = 0.384). The variations explained by each variable are as follows: distance (12.2%), elevation (2.6%), gradient (5.5%), fire occurrence (0.6%), grazing (1.6%) and PES harvesting (1.5%) and as shown in Table 5. The first two axes of dbRDA captured 83.2% of the variability in the fitted model and 16.2% of the total variation in the data cloud (Figure 5). Concerning trees on farms, species richness is driven by fire occurrence, grazing and PES harvesting. On communal land, species richness is driven by PES harvesting, gradient, distance, elevation and grazing. The tree species richness in the protected area is driven by distance.

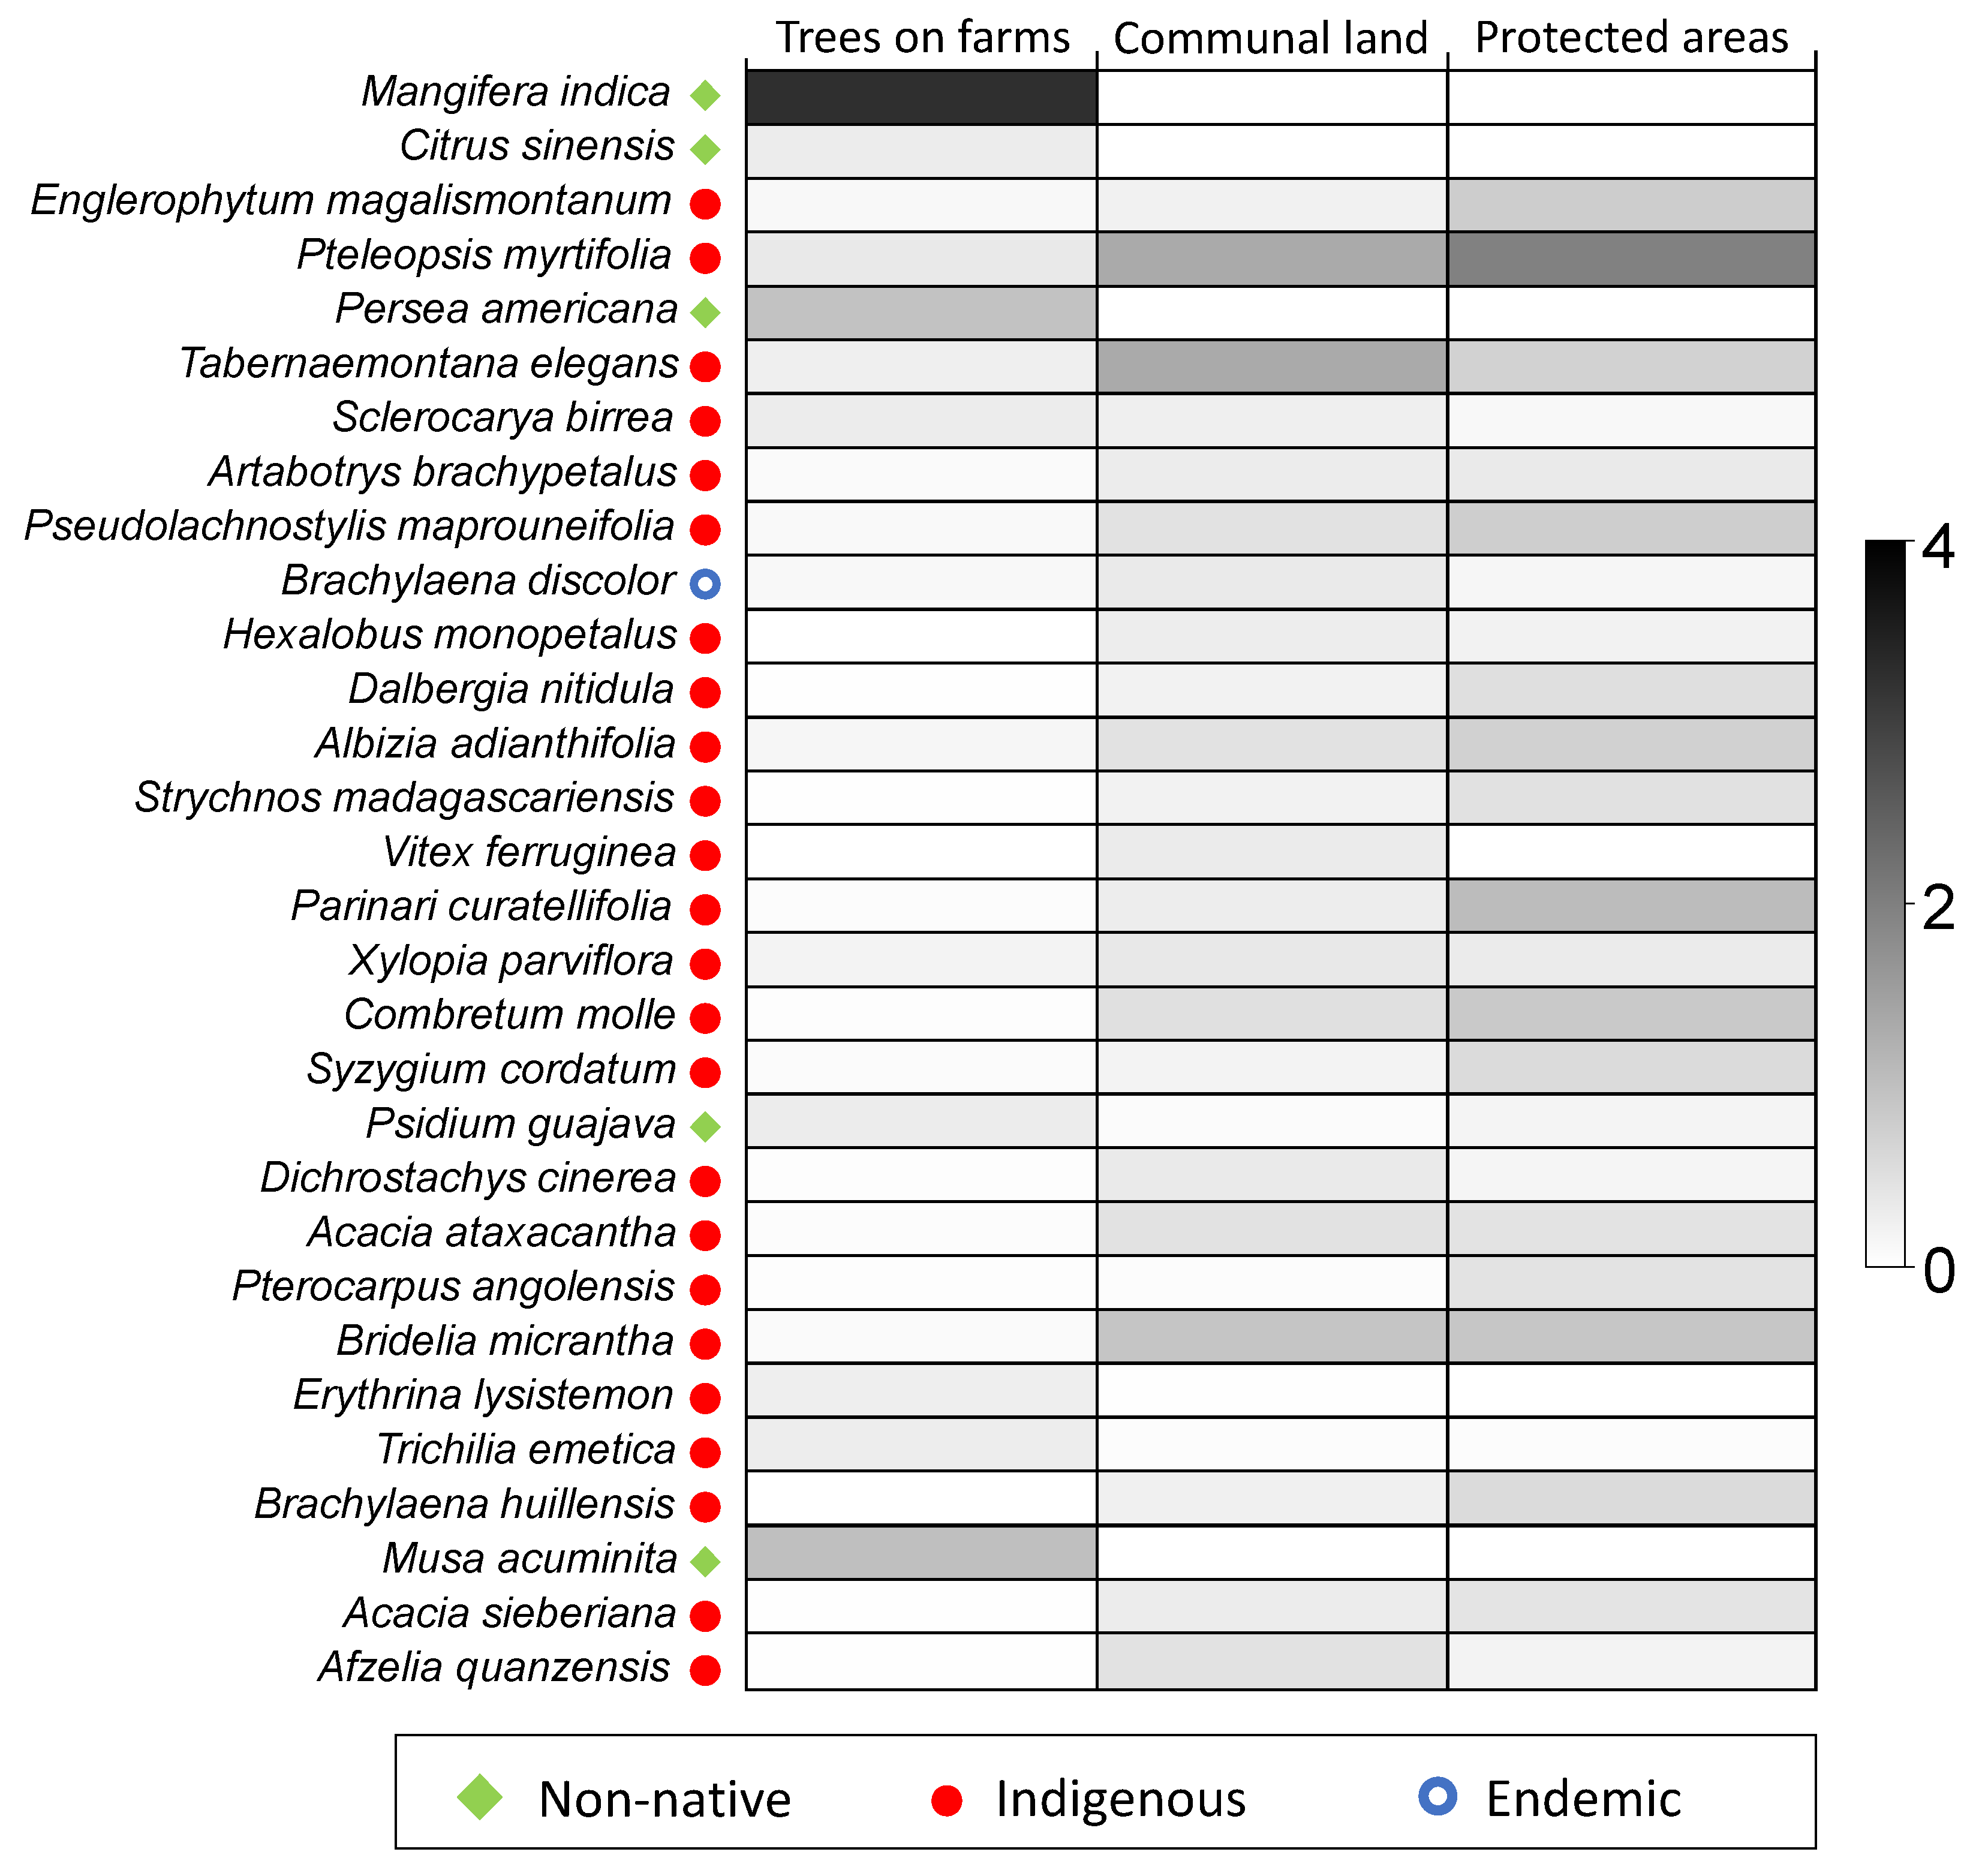
3.4. Species Abundance Distribution in Different Land-Uses

The SIMPER results showed the dominating species and contribution of each species in different land-use abundances (Table 6). A full species list is given in Table S1 in the Supplementary Materials. Non-native tree species have largely dominated and contributed to the similarity of trees on farms: Mangifera indica L. (66%) and Persea Americana Mill. (80%). The communal land was dominated by a wide range of indigenous tree species; the most dominating species were Afzelia quanzensis Welw. (70%) and Senegalia ataxacantha (DC.) Kyal. & Boatwr. (73%). The most dominating species in the protected areas were Englerophytum magalismontanum (Sond.) T.D. Penn. (71%) and Brachylaena huillensis O. Hoffm. (68%).
An average dissimilarity of 97% species richness was observed between the trees on farms and on communal land (Table 7). A total of 27 of the 126 shared species between the trees on farms and communal land contributed above 70% to the average dissimilarity between the two land-uses. The most dominating species in terms of dissimilarity were Mangifera indica (12%), Persea Americana (4%). Pteleopsis myrtifolia (M.A. Lawson) Engl. & Diels. (6%), Tabernaemontana elegans Stapf (6%) and Bridelia micrantha (Hochst.) Baill. (4%). Non-native species such as Mangifera indica, Persea Americana, Citrus x sinensis (L.) Osbeck and Musa acuminita Colla were completely absent in the communal land, and indigenous species such as Ximenia caffra Sond. and Hexalobus monopetalus (A.Rich) Engl. & Diels. were completely absent in the trees on farms. An average dissimilarity of 97% species richness was observed between the trees on farms and those in protected areas. About 30 of the 126 shared species between the trees on farms and protected areas contributed above 70% to the average dissimilarity between the two land-uses. The most dominating species in terms of dissimilarity were Mangifera indica (10%), Persea Americana (3%), Pteleopsis myrtifolia (6%), Bridelia micrantha (3%), Combretum molle R.Br. ex G.Don (4%) and Parinari curatellifolia Planch. Ex Benth. (4%). Indigenous species such as Maesa lanceolate Forssk., Rothmannia capensis Thunb., Faurea saligna Harv., Scolopia Mundii (Eckl. & Zeyh.) Warb. and Brachylaena huillensis were completely absent in the trees on farms, while non-native species such as Mangifera indica, Persea Americana and Musa acuminita were completely absent in the protected areas.
An average dissimilarity of 89% species richness was observed between the communal land and protected areas. A total of 30 of the 126 shared species between the communal land and protected areas contributed above 70% to the average dissimilarity between the two land-uses. The most dominating species in terms of dissimilarity were Pteleopsis myrtifolia (6%), Tabernaemontana elegans (5%), Parinari curatellifolia (4%), Pseudolachnostylis maprouneifolia Pax. (3%) and Combretum molle (3%). The indigenous species Faurea saligna was completely absent in the communal land. The visual impact of the greyscale intensities in a shade plot (Figure 6) gives a strong idea of which species are highly dominated in each land-use. White denotes the absence of that species in that land-use, and full black represents the maximum abundance in the land-use. The shade plot shows the top 30 dominating tree species; the trees on farms were dominated by non-native tree species, while both the communal land and the protected areas were dominated by indigenous species. Notably, only one endemic species was found in the top 30 and was observed only in protected areas.

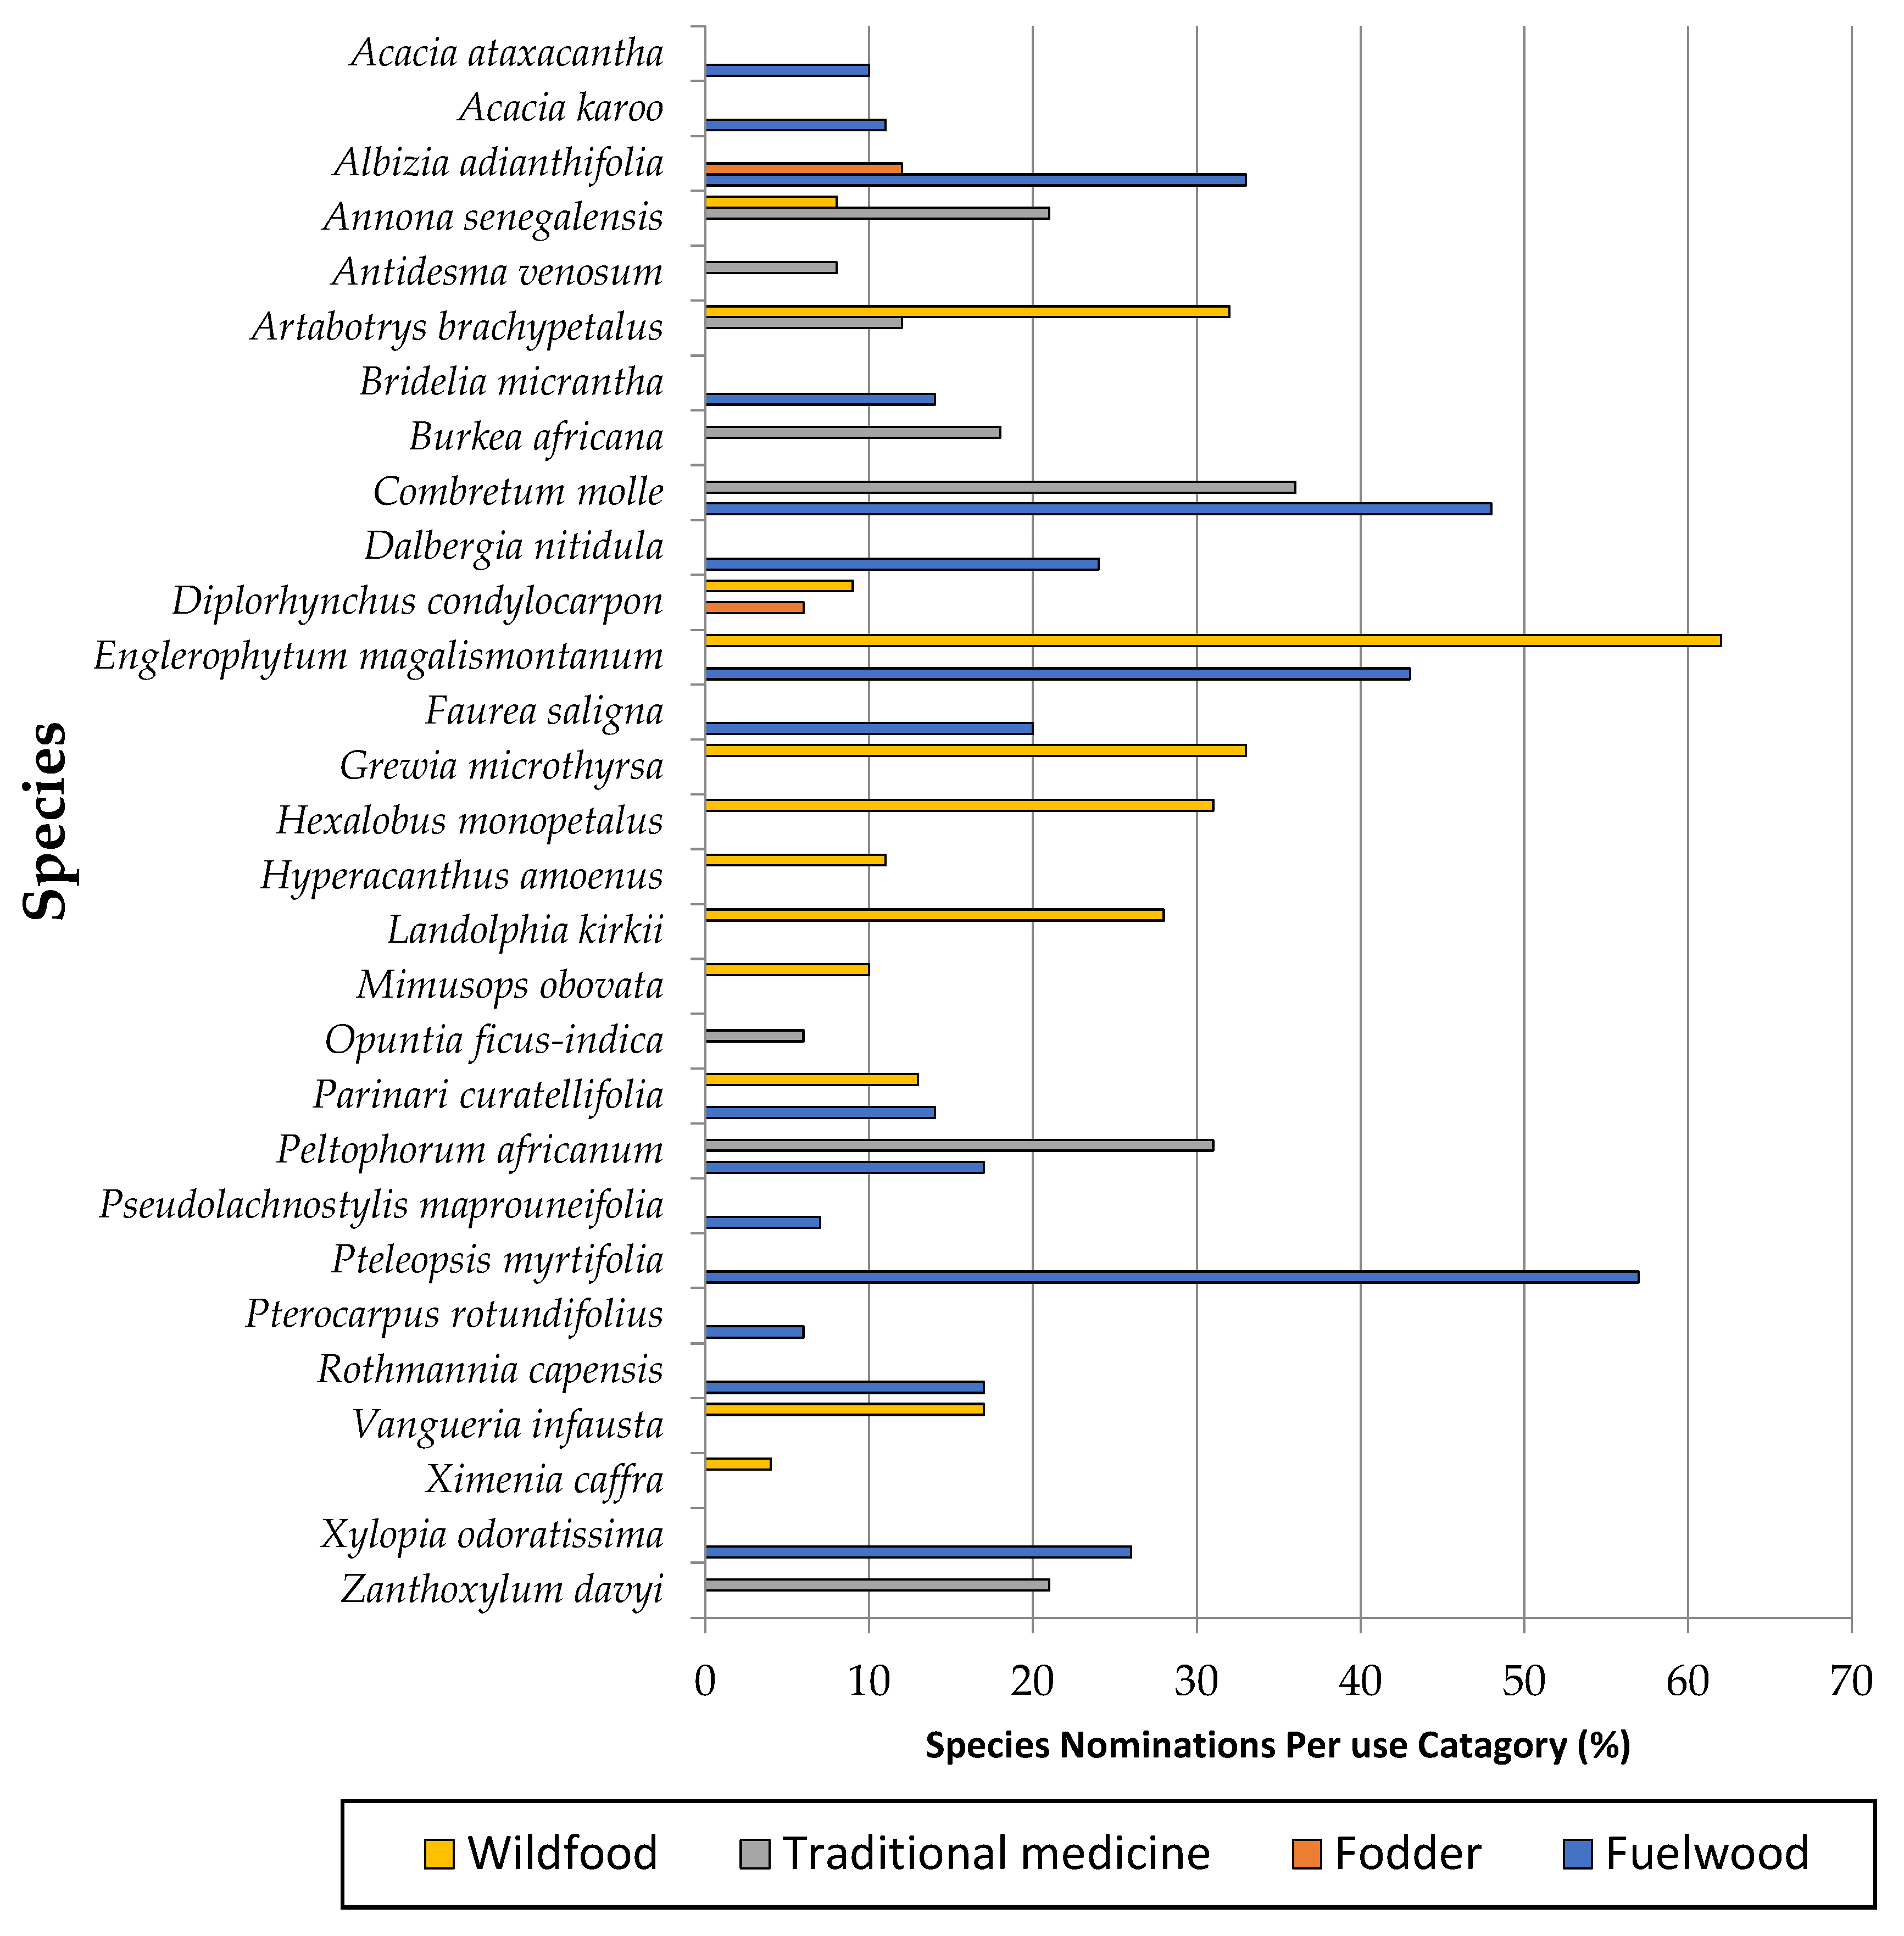
3.5. Tree Species Use and Conservation Strategies

In the FGDs, the participants listed the important tree species based on the utility categories such as fuelwood, fodder, wild food and traditional medicine. Based on species nomination within the FGDs, the most important tree species in each category were evaluated using the fidelity level formula. A full species list is given in Table S1 in the supplementary material. The overall number of citations of the most important tree species varied between 4% and 62% in the use categories (Figure 7). The indigenous species Englerophytum magalismontanum was the most reported tree species (62%) for wild fruits in the study sites, while it was also highly reported for fuelwood utilisation (43%). Pteleopsis myrtifolia was the most described (57%) tree species for fuelwood, while Combretum molle was the most cited (36%) tree species for traditional medicine. Albizia adianthifolia (Schumach.) W.F.Wight was most frequently given (12%) as a species for fodder. From 29 tree species, 8 tree species were cited as multiple purpose species, such as Englerophytum magalismontanum and Parinari curatellifolia (both appearing in the wild food and fuelwood utility categories). Peltophorum africanum Sond. and Combretum molle were suggested in both the traditional medicine and fuelwood utility categories. Artabotrys brachypetalus Benth. and Annona senegalensis Pers. were suggested in both the wild food and traditional medicine utility categories, Diplorhynchus condylocarpon Müll.Arg. was suggested in both the fodder and wild food utility categories and Albizia adianthifolia was recorded in both the fuelwood and fodder utility categories.
Overall, in the FGDs sessions, three themes (national conservation policy, community conservation policy and conservation practices) were selected for an in-depth under-standing of the conservation strategies.

3.5.1. Theme 1: National Conservation Policy

In all study sites, the participants are not aware of conservation policies. However, they knew that the government protects natural forests and trees. a participant at Damani village said: “A few decades ago, there were forest guards in our communities employed by the government to protect forests and trees. But, they are no longer there and our forests are overexploited”. The challenge of lacking knowledge of conservation policies was further emphasised by the chief of one of the communities, who said: “We just hear that are some of the trees which are protected by government policies, but we don’t know these trees”.

3.5.2. Theme 2: Community Conservation Policy

In all the study sites, the Chiefs or community leadership reported that it is their responsibility to protect the forest trees within their jurisdiction. Although there are no documented policies or rules provided by the traditional leaders, the message is conveyed through word-of-mouth during the communities’ gatherings. An FGD participant said: “Our leadership always reminds us to protect and report a person who fells live trees” Furthermore, “People from outside our communities are not allowed to harvest or collect forest re-sources in our forests”. The leadership said: “We have people who harvest fuelwood for selling, we always advised them not to harvest in bulk and they should frequently change harvesting sites to allow regeneration”.

3.5.3. Theme 3: Conservation Practices

In all the study sites, there is no formal project implementing conservation practices. The participants indicated: “We are protecting the existing trees on our homesteads and communal farms, and plant non-native trees such Mangifera indica”. The leadership said: “We manage indigenous trees in our farms and homesteads by doing minimal harvesting instead of felling the whole tree”. Furthermore, “We are interested in planting indigenous trees in our communal land. However, we do not know how we can plant indigenous trees”. Trees within the community are highly managed by the community members because of the benefits provided by the trees. A participant said: “Trees help us during natural disasters floods, storms and drought”.

4. Discussion

This study utilised both quantitative and qualitative methods, employing a mixed method approach. The quantitative method was used to collect vegetation data through inventory for an assessment of biodiversity and species richness within the study areas. The qualitative method was used to collect social data through FGDs. FGDs were critical in this study to gather more detailed information of how the local people conserve and understand the conservation of trees in their traditional agroforestry landscape. Behaviours that can be explained by social science methodology are integral when evaluating agroforestry systems and can complement the empirical data collection rooted in natural science practices. The combination of inventory and FGDs helped to show a link between the species richness and conservation strategies being applied by the local people. Such an approach also helped in understanding changes in species richness, in combination with the vegetation survey data concerning the three categories: trees on farms, communal land and protected areas.

4.1. Species Richness in Different Land-Uses

The tree species richness was higher on communal land than it was in protected areas and on farms. These findings coincide with the results of the studies conducted by Tezbew and Asfaw [37] and Eyasu et al. [38], where they reported that human-modified landscapes harbour over 90% of the tropical species richness of protected areas. However, due to anthropogenic activities, the tropics are experiencing deforestation and forest degradation [38]. The high number of tree species in communal land in comparison to protected areas and trees on farms was associated with the disturbances in communal land. The intermediate disturbance hypothesis suggests that the species diversity maximises when a disturbance occurs at an intermediate frequency or with an intermediate intensity [39,40]. This may show that communal land could harbour a large number of species and disturbances due to different activities; therefore, such land could serve to increase species richness. Nevertheless, the high disturbance is associated with the loss of the tree species richness in natural forests [40]; therefore, the magnitude of disturbance has to be monitored to help to conserve the tree species richness in communal land. Other studies conducted in different parts of the world also reported similar findings; higher species numbers are found on communal land than within protected areas or associated with trees on farms [41]. The lower level of tree species richness concerning trees on farms was associated with land users and managers planting more non-native species and retaining few indigenous tree species. Local farmers tend to keep more species that provide multiple important economic benefits [42]. The value of tree species’ heterogeneity in trees on farms is regarded as a long-term benefit [43,44]. The limitation of planting more indigenous tree species is a delayed-return-investment from indigenous trees [45]. However, Borsari [46] argued that agriculture production is heavily dependent on the diversity and abundance of existing and planted tree species on a farm. The integration of diverse native tree species enhances the landscape and habitat heterogeneity [37]. Modern agriculture homogenised most of the heterogonous landscape by maximising the production at the expense of the tree species heterogeneity [43]. A traditional agroforestry practice such as trees on farms has been appreciated in terms of enhancing tree species heterogeneity on farms and in promoting conservation [41]. Trees on farms provide similar resources as native forests; for example, the local people of Nepal collect 43% of the fuelwood and fodder from trees on farms [41]. Overexploitation has a negative impact on the richness of trees on farms, resulting in poor production, thus affecting local livelihoods [47]. In protected areas, the lower level of tree species richness is highly likely to be associated with succession, because the protected areas are intact and not disturbed due to restrictions [23]. The results on the tree species richness similarity of the land-use indicated that the communal land and protected area are similar in terms of floristic richness and harbour similar tree species. This fits well with the notion that trees on farms harbour most non-native tree species; hence, the similarity is very low within communal land and protected areas.

4.2. Drivers of Species Richness Variance in Different Land-Uses

The distance between households and land-uses such as communal land, trees on farms and protected areas has a positive impact on species richness, which is in line with the findings of Bhandari et al. [41], who reported that the distance between forests and people’s homes influences the species richness in agroforestry landscapes. When there is a large distance between the forest and the people, people save the time and costs of the regular collection of forest products by collecting in nearby sites such as from trees on farms and on communal land [39,40], and they sometimes tamper with protected areas [23]. Hence, the current study observed human disturbances in protected areas. It is more likely that the human disturbances in protected areas are unauthorised. Furthermore, the distance compels the local people to harvest the forest products from the trees on farms and on communal land [41]. The close dependence on communal land and trees on farms reduces the pressure on native forests and eventually contributes to conservation [41]. A great species richness in communal land and on farms is not only contributing to conservation but also contributes to the stand productivity and diversity of the forest products [38]. The tree species richness in communal land and on farms provides a diversity of forest products such as fruits, fodder, construction materials, food and firewood [37].

4.3. Tree Species Richness, Uses and Conservation Strategies

This study found that the TALs of the VBR host up to 29 of the most appreciated tree species, of which 15 are used for fuelwood, 14 are used for wild food, 7 are used for traditional medicine and 2 are used for fodder. On the contrary, studies conducted in traditional agroforestry systems in India found that most tree species are used for fuelwood, followed by traditional medicine uses [48]. Unsurprisingly, most of the tree species in TALs have a high value to the local people [14], determined by human needs such as food, energy and shelter. Concerning trees on farms, the non-native species contributed the greatest number of tree species, which were represented by two species, Mangifera indica and Persea Americana. These findings coincide with the results of the study conducted by Yashmita-Ulman [49], who reported that farmers in India plant Mangifera Indica along the farm boundaries or within the farms. A study conducted by Borsari [46] reported that Mangifera indica is one of the iconic tree species in agroforestry practices such as silvopasture and trees on farms. Both the communal land and protected area were dominated by several indigenous tree species such as Pteleopsis myrtifolia, Albizia adianthifolia, Tabernaemontana elegans, Parinari curatellifolia, Englerophytum magalismontanum, Bridelia micrantha, Pseudolachnostylis maprouneifolia and Combretum molle.
This study found that the local people have no conservation strategy and conservation practices to enhance the tree species richness for the sustainable functionality of the traditional agroforestry landscape. The only strategy that seems to be effective is the set of traditional rules of protecting trees by restricting people to felling live trees. The study conducted by Duriaux-Chavarria et al. [47] highlighted that, in Niger and Ethiopia (north and central), rural communities and farmers restored tree species richness through the planting of native tree species and subsequently improved tree species richness and ecosystem services. Considerable restoration practices such as planting native tree species on traditional agroforestry land reduce disservices by human beings.

4.4. Implications for Conservation

The findings revealed a lower tree species richness among trees on farms compared to the communal land and protected areas. The participants acknowledged and highlighted the lack of awareness of conservation policies; others highlighted the lack of knowledge of planting native trees in the landscape. This may have an overall negative impact on rural forest tree conservation and the enhancement of tree species richness in traditional agroforestry landscapes. Therefore, identifying native tree species that can be planted to enhance forest tree species richness and diversity is paramount in this traditional agroforestry landscape. The Climate Smart Agriculture Strategic Framework for Agriculture, Forestry and Fisheries in South Africa developed actions to increase the forest cover or tree species in agroforestry systems by identifying agroforestry species for different agro-ecological zones and supporting farmers in increasing the tree cover on their land [15]. However, practically, nothing has been achieved, as local people are still only depending on the existing tree species. An additional constraint is that the developed Agroforestry Strategic Framework [15] largely promotes modern agroforestry systems over traditional agroforestry. Interdepartmental collaboration in enhancing traditional agroforestry tree species diversity would play an important role in conserving and improving the local people’s livelihoods. Moreover, implementing the actions and strategic frameworks would fast-track the mitigation of biodiversity loss in South Africa.

5. Conclusions

The study found that the TALs were characterised by multipurpose tree species such as Englerophytum magalismontanum, Parinari curatellifolia, Peltophorum africanum, Combretum molle, Artabotrys brachypetalus, Annona senegalensi, Diplorhynchus condylocarpon and Albizia adianthifolia for different uses such as fuelwood, fodder, traditional medicine and wildfruits. Species richness was found to be higher on communal land commonly driven by PES. A reduced overharvesting of PES harvesting, in combination with the effort to conserve trees, would, therefore, restore and augment species richness in both trees on farms and communal land uses. The physical distance between resources and village settlements was the major factor driving species richness within protected areas. Therefore, there is a greater need for protected areas in close proximity to communities with strict traditional rules to conserve tree species richness. The results of this study confirmed that local people are promoting the conservation of native tree species within traditional agroforestry landscapes and are also conserving the existing native tree species governed by local and traditional rules. In addition, there were no forest restoration or conservation practices or projects implemented in the communities to support biodiversity and species richness. Lastly, an inadequate legislative framework on conservation in rural communities is a critical challenge considering the unprecedented rise of biodiversity loss and forest degradation. This study advocates for the adoption of native tree species planting and conservation in traditional agroforestry landscapes to enhance the landscape productivity and functionality. There is, therefore, a need to establish a conservation strategic framework for restoring tree species richness, targeting traditional agroforestry in the VBR region and beyond.

Supplementary Materials

The following supporting information can be downloaded at: https://www.mdpi.com/article/10.3390/f13111766/s1, Table S1: Species list from species richness plots and nominated species derived from the FGD sessions.

Author Contributions

Conceptualisation, L.M. and P.W.C.; methodology, L.M. and P.W.C.; software, L.M., P.W.C. and M.G.A.; validation, L.M., P.W.C., M.G.A. and R.P.T.; formal analysis, L.M.; investigation, L.M.; resources, P.W.C. and J.P.S.; data curation, L.M. and P.W.C.; writing—original draft preparation, L.M.; writing—review and editing, P.W.C., J.P.S., R.P.T. and H.-P.K.; visualisation, L.M., P.W.C. and J.P.S.; supervision, P.W.C.; project administration, L.M., P.W.C. and R.P.T.; funding acquisition, J.P.S. and H.-P.K. All authors have read and agreed to the published version of the manuscript.

Funding

This research was funded as a Short-Term Scientific Mission as part of the ASAP project (Agroforestry in Southern Africa: new pathways for innovative land-use systems under a changing climate) sponsored by the German Federal Ministry for Research and Education (BMBF) under grant number 01LL1803A.

Data Availability Statement

The data are available from the corresponding author upon reasonable request.

Acknowledgments

The authors would like to acknowledge the cooperation and support from each study community leadership tribal authority during the data collection in their respective areas. Sincere gratitude is extended to every individual who participated in this study.

Conflicts of Interest

The authors declare no conflict of interest.

References

  1. Rasethe, M.T.; Semenya, S.S.; Potgieter, M.J.; Maroyi, A. The utilization and management of plant resources in rural areas of the Limpopo Province, South Africa. J. Ethnobiol. Ethnomed. 2013, 9, 27. [Google Scholar] [CrossRef] [PubMed] [Green Version]
  2. Scheiter, S.; Gaillard, C.; Martens, C.; Erasmus, B.; Pfeiffer, M. How vulnerable are ecosystems in the Limpopo province to climate change? S. Afr. J. Bot. 2018, 116, 86–95. [Google Scholar] [CrossRef]
  3. Turpie, J.K.; Forsythe, K.J.; Knowles, A.; Blignaut, J.; Letley, G. Mapping and valuation of South Africa’s ecosystem services: A local perspective. Ecosyst. Serv. 2017, 27, 179–192. [Google Scholar] [CrossRef]
  4. Makhado, R.A.; Potgieter, M.J.; Wessels, D.C.; Saidi, A.T.; Masehela, K.L. Use of Mopane Woodland Resources and Associated Woodland Management Challenges in Rural Areas of South Africa. Ethnobot. Res. Appl. 2012, 10, 369–379. [Google Scholar]
  5. Santos, P.Z.F.; Crouzeilles, R.; Sansevero, J.B.B. Can agroforestry systems enhance biodiversity and ecosystem service provision in agricultural landscapes? A meta-analysis for the Brazilian Atlantic Forest. For. Ecol. Manag. 2019, 433, 140–145. [Google Scholar] [CrossRef]
  6. Araia, M.G.; Chirwa, P.W.; Syampungani, S. Do strictly protected areas protect vulnerable local tree species better than human land use? Disentangling conservation value from biodiversity value. J. Nat. Conserv. 2020, 58, 125919. [Google Scholar] [CrossRef]
  7. Bucheli, P.; Vandreé, J.; Bokelmann, W. Agroforestry systems for biodiversity and ecosystem services: The case of the Sibundoy Valley in the Colombian province of Putumayo. Int. J. Biodivers. Sci. Ecosyst. Serv. Manag. 2017, 13, 380–397. [Google Scholar] [CrossRef]
  8. Plieninger, T.; Muñoz-Rojas, J.; Buck, L.E.; Scherr, S.J. Agroforestry for sustainable landscape management. Sustain. Sci. 2020, 15, 1255–1266. [Google Scholar] [CrossRef]
  9. Viswanath, S.; Lubina, P.A.; Subbanna, S.; Sandhya, M.C. Traditional Agroforestry systems and practices: A review. Adv. Agric. Res. Technol. J. 2018, 2, 18–29. [Google Scholar]
  10. Sheppard, J.P.; Bohn Reckziegel, R.; Borrass, L.; Chirwa, P.W.; Cuaranhua, C.J.; Hassler, S.K.; Hoffmeister, S.; Kestel, F.; Maier, R.; Mälicke, M.; et al. Agroforestry: An Appropriate and Sustainable Response to a Changing Climate in Southern Africa? Sustainability 2020, 12, 6796. [Google Scholar] [CrossRef]
  11. Pinard, F.; Joetzjer, E.; Kindt, R.; Kehlenbeck, K. Are coffee agroforestry systems suitable for circa situm conservation of indigenous trees? A case study from Central Kenya. Biodivers. Conserv. 2014, 23, 467–495. [Google Scholar] [CrossRef]
  12. Chavan, S.B.; Newaj, R.; Rizvi, R.H.; Ajit; Prasad, R.; Alam, B.; Handa, A.K.; Dhyani, S.K.; Jain, A.; Tripathi, D. Reduction of global warming potential vis-à-vis greenhouse gases through traditional agroforestry systems in Rajasthan, India. Environ. Dev. Sustain. 2021, 23, 4573–4593. [Google Scholar] [CrossRef]
  13. Rendón-Sandoval, F.J.; Casas, A.; Moreno-Calles, A.I.; Torres-García, I.; García-Frapolli, E. Traditional Agroforestry Systems and Conservation of Native Plant Diversity of Seasonally Dry Tropical Forests. Sustainability 2020, 12, 4600. [Google Scholar] [CrossRef]
  14. Ayisi, K.K.; Belete, A.; Addo-Bediako, A.; Ramudzuli, M.R.; Mkhari, J.J.; Mollel, N. Traditional agroforestry practice in Limpopo Province of South Africa. J. Hum. Ecol. 2018, 62, 24–34. [Google Scholar]
  15. Department of Agriculture, Forestry and Fisheries. Agroforestry Strategy Framework for South Africa. 2017. Available online: https://www.forestry.co.za/uploads/File/industry_info/policy%20legislation/Agroforestry%20Strategy%20Framework%20Approved%20fourth%20Draft%20-%2009%20Feb%202017.pdf (accessed on 15 August 2022).
  16. Sheppard, J.P.; Chamberlain, J.; Agúndez, D.; Bhattacharya, P.; Chirwa, P.W.; Gontcharov, A.; Sagona, W.C.J.; Shen, H.; Tadesse, W.; Mutke, S. Sustainable Forest Management Beyond the Timber-Oriented Status Quo: Transitioning to Co-production of Timber and Non-wood Forest Products—A Global Perspective. Curr. For. Rep. 2020, 6, 26–40. [Google Scholar] [CrossRef] [Green Version]
  17. Musakwa, W.; Wang, S.; Wei, F.; Malapane, O.L.; Thomas, M.M.; Mavengahama, S.; Zeng, H.; Wu, B.; Zhao, W.; Nyathi, N.A.; et al. Survey of Community Livelihoods and Landscape Change along the Nzhelele and Levuvhu River Catchments in Limpopo Province, South Africa. Land 2020, 9, 91. [Google Scholar] [CrossRef] [Green Version]
  18. FAO. Southern Africa’s Forests and People: Investing in a Sustainable Future: Successes, Challenges and Ways Forward; FAO: Rome, Italy, 2015; ISBN 9780620667098. [Google Scholar]
  19. Kori, E.; Onyango Odhiambo, B.D.; Chikoore, H. A geomorphodiversity map of the Soutpansberg Range, South Africa. Landf. Anal. 2019, 38, 13–24. [Google Scholar] [CrossRef]
  20. Constant, N.L.; Tshisikhawe, M.P. Hierarchies of knowledge: Ethnobotanical knowledge, practices and beliefs of the Vhavenda in South Africa for biodiversity conservation. J. Ethnobiol. Ethnomed. 2018, 14, 56. [Google Scholar] [CrossRef]
  21. Ramarumo, L.J.; Maroyi, A. An inventory of useful threatened plant species in Vhembe Biosphere Reserve, Limpopo Province, South Africa. Biodiversitas 2020, 21, 2146–2158. [Google Scholar] [CrossRef]
  22. Makhubele, L.; Chirwa, P.W.; Araia, M.G. The influence of forest proximity to harvesting and use of provisioning ecosystem services from tree species in traditional agroforestry landscapes. Int. J. Sustain. Dev. World Ecol. 2022, 29, 812–826. [Google Scholar] [CrossRef]
  23. Araia, M.G.; Chirwa, P.W. Revealing the Predominance of Culture over the Ecological Abundance of Resources in Shaping Local People’s Forest and Tree Species Use Behavior: The Case of the Vhavenda People, South Africa. Sustainability 2019, 11, 3143. [Google Scholar] [CrossRef] [Green Version]
  24. Alavi, H.; Hąbek, P. Addressing Research Design Problem in Mixed Methods Research. Manag. Syst. Prod. Eng. 2016, 21, 62–66. [Google Scholar] [CrossRef]
  25. Migiro, S.; Magangi, B.A. Mixed methods: A review of literature and the future of the new research paradigm. Afr. J. Bus. Manag. 2011, 5, 3757–3764. [Google Scholar]
  26. Leavy, P. Research Design: Quantitative, Qualitative, Mixed Methods, Arts-Based, and Community-Based Participatory Research Approaches; Guilford Press: New York, NY, USA; London, UK, 2017; ISBN 9781462530038. [Google Scholar]
  27. Berg, B.L.; Lune, H. Qualitative Research Methods for the Social Sciences; Pearson: Harlow, UK, 2017; ISBN 129-2-16439-5. [Google Scholar]
  28. Dhanya, B.; Sathish, B.N.; Viswanath, S.; Purushothaman, S. Ecosystem services of native trees: Experiences from two traditional agroforestry systems in Karnataka, Southern India. Int. J. Biodivers. Sci. Ecosyst. Serv. Manag. 2014, 10, 101–111. [Google Scholar] [CrossRef]
  29. Maponya, P.; Venter, S.L.; Du Plooy, C.P.; Backeberg, G.R.; Mpandeli, S. Research, Extension Services and Training as Key Drivers to Agroforestry Adoption in Limpopo Province, South Africa. In Proceedings of the 3rd World Irrigation Forum, International Commission on Irrigation and Drainage (ICID), Bali, Indonesia, 1–9 September 2019. [Google Scholar]
  30. Anderson, M.; Gorley, R.N.; Clarke, R.K. Permanova+ for Primer: Guide to Software and Statistical Methods; PRIMER-Ltd.: Plymouth, UK, 2008. [Google Scholar]
  31. Devkota, K.; dos Santos, C.F.; Blochtein, B. Mustard plants distant from forest fragments receive a lower diversity of flower-visiting insects. Basic Appl. Ecol. 2020, 47, 35–43. [Google Scholar] [CrossRef]
  32. Clarke, K.R.; Warwick, R.M. Change in Marine Communities: An Approach to Statistical Analysis and Interpretation; Primer-E Ltd.: Plymouth, UK, 1994. [Google Scholar]
  33. Bray, J.R.; Curtis, J.T. An Ordination of the Upland Forest Communities of Southern Wisconsin. Ecol. Monogr. 1957, 27, 325–349. [Google Scholar] [CrossRef]
  34. da Silva, T.C.; Cruz, M.P.; Sousa Araújo, T.A.d.; Schwarz, M.L.; Albuquerque, U.P. Methods in Research of Environmental Perception. In Methods and Techniques in Ethnobiology and Ethnoecology; Albuquerque, U.P.D., Cruz da Cunha, L.V.F., Lucena, R.F.P.D., Alves, R.R.N., Eds.; Humana Press: New York, NY, USA, 2014; pp. 99–109. ISBN 978-1-4614-8635-0. [Google Scholar]
  35. Roller, M.R. A Quality Approach to Qualitative Content Analysis: Similarities and Differences Compared to Other Qualitative Methods. Forum Qualitative Sozialforschung/Forum: Qualitative Social Research, Vol 20, No 3 (2019): Qualitative Content Analysis I. Forum Qual. Soc. Res. 2019, 20. [Google Scholar] [CrossRef]
  36. Bengtsson, M. How to plan and perform a qualitative study using content analysis. Nurs. Open 2016, 2, 8–14. [Google Scholar] [CrossRef] [Green Version]
  37. Tazebew, E.; Asfaw, Z. Tree species diversity, preference and management in smallholder coffee farms of Western Wellega, Ethiopia. J. Biol. Agric. Healthc. 2018, 8, 43–53. [Google Scholar]
  38. Eyasu, G.; Tolera, M.; Negash, M. Woody species composition, structure, and diversity of homegarden agroforestry systems in southern Tigray, Northern Ethiopia. Heliyon 2020, 6, e05500. [Google Scholar] [CrossRef]
  39. Bendix, J.; Wiley, J.J.; Commons, M.G. Intermediate disturbance and patterns of species richness. Phys. Geogr. 2017, 38, 393–403. [Google Scholar] [CrossRef]
  40. Silva Pedro, M.; Rammer, W.; Seidl, R. A disturbance-induced increase in tree species diversity facilitates forest productivity. Landsc. Ecol. 2016, 31, 989–1004. [Google Scholar] [CrossRef]
  41. Bhandari, S.K.; Maraseni, T.; Timilsina, Y.P.; Parajuli, R. Species composition, diversity, and carbon stock in trees outside forests in middle hills of Nepal. For. Policy Econ. 2021, 125, 102402. [Google Scholar] [CrossRef]
  42. Milián-García, I.; Sánchez-Cárdenas, S.; Wencomo-Cárdenas, H.B.; Ramírez-Suárez, W.M.; Navarro-Boulandier, M. Study of biodiversity components in the agroecological farm La Paulina, Perico municipality, Cuba. Pastos Forrajes 2018, 41, 47–51. [Google Scholar]
  43. Dominati, E.J.; Maseyk, F.J.; Mackay, A.D.; Rendel, J.M. Farming in a changing environment: Increasing biodiversity on farm for the supply of multiple ecosystem services. Sci. Total Environ. 2019, 662, 703–713. [Google Scholar] [CrossRef]
  44. Iverson, A.L.; Gonthier, D.J.; Pak, D.; Ennis, K.K.; Burnham, R.J.; Perfecto, I.; Ramos Rodriguez, M.; Vandermeer, J.H. A multifunctional approach for achieving simultaneous biodiversity conservation and farmer livelihood in coffee agroecosystems. Biol. Conserv. 2019, 238, 108179. [Google Scholar] [CrossRef]
  45. Sagastuy, M.; Krause, T. Agroforestry as a Biodiversity Conservation Tool in the Atlantic Forest? Motivations and Limitations for Small-Scale Farmers to Implement Agroforestry Systems in North-Eastern Brazil. Sustainability 2019, 11, 6932. [Google Scholar] [CrossRef] [Green Version]
  46. Borsari, B. Agrobiodiversity as Necessary Standard for the Design and Management of Sustainable Farming Systems. J. Agro Sci. 2022, 10, 92–101. [Google Scholar] [CrossRef]
  47. Duriaux-Chavarría, J.-Y.; Baudron, F.; Gergel, S.E.; Yang, K.F.; Eddy, I.M.S.; Sunderland, T. More people, more trees: A reversal of deforestation trends in Southern Ethiopia. Land Degrad. Dev. 2021, 32, 1440–1451. [Google Scholar] [CrossRef]
  48. Mylliemngap, W. Agrobiodiversity and Natural Resource Management in Traditional Agricultural Systems of Northeast India; SSRN: Rochester, NY, USA, 2021. [Google Scholar]
  49. Yashmita-Ulman; Singh, M.; Kumar, A.; Sharma, M. Conservation of Plant Diversity in Agroforestry Systems in a Biodiversity Hotspot Region of Northeast India. Agric. Res. 2021, 10, 569–581. [Google Scholar] [CrossRef]
Figure 1. Map showing the study areas and location within (A) national, (B) provincial, (C) district and (D) community contexts.
Forests 13 01766 g001
Figure 2. Estimation of actual (SOb) and estimated (Bootstrap) total species richness for (a) the total study area, (b) Trees on farms, (c) Protected areas, (d) Communal Land.
Forests 13 01766 g002
Figure 3. Species richness in the study areas; multi-dimensional scaling of the local assemblage of different land-uses.
Forests 13 01766 g003
Figure 4. Principal Component Analysis (PCO) of species richness variation between different land-uses in the study areas.
Forests 13 01766 g004
Figure 5. dbRDA (distance-based redundancy analysis) on the association of land-uses and other environmental factors in the study areas.
Forests 13 01766 g005
Figure 6. Shade plot showing tree species distribution between land-uses, further subdivided by native or non-native status in South Africa.
Forests 13 01766 g006
Figure 7. Nominated important tree species per defined utility category, as cited by participants in the focus group discussions.
Forests 13 01766 g007
Table 1. Actual and estimated tree species richness between different land-uses with sampling effectiveness estimates.
Land-UsesNumber of SpeciesSampling Effectiveness
SObSBoot(%)
Trees on farms 6880.684.4
Communal land8395.986.5
Protected areas8184.595.8
Overall126137.491.7
SOb = Species observation. SBoot = Species richness estimator (Bootstrap).
Table 2. PERMANOVA results of species richness between areas and study villages.
SourcedfSSMSPseudo-FP (Perm)Unique Terms
Vi333,22011,0731.99450.016997
Lu281,63240,81618.0150.001998
VixLu633,31155512.45040.001997
Res1683.81 × 1052265
Total1795.29 × 105
Lu = Lu (Random factor). Vi = Village (Fixed factor). SS = Sum of species. MS = Mean of species. F ratio (Pseudo-F). P = Permuted probability values. df = Degrees of freedom.
Table 3. PERMANOVA pairwise comparisons for species richness.
Pairwise Land-UsestP (Perm)Av.SBray
(Trees on farms & Communal land)4.480.00120.99
(Trees on farms & Protected area)5.410.00117.29
(Communal land & Protected area)2.340.00124.87
t = Pairwise statistics value. P = Permuted probability values. Av.SBray = Average Bray–Curtis similarity.
Table 4. PERMDISP pairwise comparison of species richness variance.
Pairwise Land-UsestP (Perm)Within (Land-Uses Av. D (%))
(Trees on farms & Communal land)4.40220.001Trees on farms (45)
(Trees on farms & Protected areas)4.28020.001Communal land (52)
(Communal land & Protected areas)0.45080.673Protected areas (51)
t = Pairwise statistics value. P = Permuted probability values. Av.DBray = Average Bray–Curtis dissimilarity.
Table 5. Results of the DISTLM Marginal test for relationships between individual socio-ecological factors and species richness.
Marginal Tests
Variablepp (%)
Elevation0.0012.6
Gradient0.0015.5
Fire occurrence0.3840.6
Grazing0.0011.6
PES0.0011.5
Distance0.00112.2
Table 6. Similarity Percentages (SIMPER) analysis of tree species abundance similarity.
Trees on Farms
(A.Sim = 14.9)
Communal Land
(A.Sim = 10.88)
Protected Areas
(A.Sim = 14.9)
SpeciesAv.AAv.SC.%Av.AAv.SC.%Av.AAv.SC.%
Afzelia quanzensis 0.450.3969.95
Albizia adianthifolia 0.450.4166.350.721.2341.75
Brachylaena huillensis 0.570.5767.5
Bridelia micrantha 0.901.2352.140.880.8847.81
Combretum molle 0.480.5062.620.850.8359.45
Englerophytum magalismontanum 0.780.5070.95
Mangifera indica3.259.8065.79
Parinari curatellifolia 1.051.7333.27
Persea americana0.952.1680.28
Pseudolachnostylis maprouneifolia 0.450.6458.010.770.6063.56
Pteleopsis myrtifolia 1.332.3021.131.973.1121.37
Senegalia ataxacantha 0.450.3673.30
Tabernaemontana elegans 1.332.1540.870.700.8753.78
Av.A = Average abundance. Av.sim = Average similarity. C = Contribution.
Table 7. Similarity Percentages (SIMPER) analysis of tree species abundance dissimilarity.
Average Dissimilarity(TOF & CL) = 97% (TOF & PA) = 97%
TOFCL TOFPA
SpeciesAv.AAv.AAv.DC.% Av.AAv.AAv.DC.%
Afzelia quanzensis0.020.451.8451.53
Albizia adianthifolia0.130.452.1045.74 0.130.722.7536.55
Annona senegalensis0.080.251.2166.24
Artabotrys brachypetalus0.080.301.3661.05 0.080.331.3060.72
Brachylaena discolor0.120.331.7553.34
Brachylaena huillensis ---0.571.9348.8
Bridelia micrantha0.080.903.8433.18 0.080.883.1927.72
Citrus x sinensis0.30---1.0970.84
Combretum molle0.030.481.8749.64 0.030.852.7039.34
Croton sylvaticus 0.020.371.0368.88
Cussonia spicata ---0.371.1665.64
Dalbergia nitidula 0.020.51.6050.44
Dichrostachys cinerea0.030.331.5954.99
Englerophytum magalismontanum0.120.221.1368.57 0.120.782.6342.06
Faurea saligna ---0.371.0766.74
Ficus sur 0.070.271.1863.24
Hexalobus monopetalus---0.281.1367.41
Hyperacanthus amoenus
Maesa lanceolata ---0.330.9870.91
Mangifera indica3.25---12.1712.58 3.25---10.1010.41
Musa acuminita1.00---3.2636.55 1.00---2.7733.71
Parinari curatellifolia0.050.281.5756.61 0.051.053.9521.09
Peltophorum africanum0.030.221.2962.38
Persea americana0.95---3.9529.22 0.95---3.2324.43
Pseudolachnostylis maprouneifolia0.100.452.3538.99 0.100.772.6344.77
Psidium guajava0.300.071.4958.14 0.300.171.4855.19
Pteleopsis myrtifolia0.351.335.9225.14 0.351.976.417.02
Pterocarpus angolensis 0.030.431.3159.38
Rothmannia capensis ---0.350.9969.9
Sclerocarya birrea0.300.252.2441.3 0.300.121.5253.66
Scolopia Mundii ---0.381.1764.45
Senegalia ataxacantha0.050.452.1943.57 0.050.431.3758.03
Strychnos madagascariensis 0.020.471.2662.02
Syzygium cordatum 0.070.571.9746.8
Tabernaemontana elegans0.251.336.2419.03 0.250.703.0430.86
Trichilia emetica0.280.051.2963.72 0.280.051.0467.82
Vachellia sieberiana0.020.301.4559.64 0.020.421.3956.62
Vitex ferruginea---0.321.2364.99
Ximenia caffra---0.281.1069.71
Xylopia parviflora0.180.371.9147.71 0.180.321.6052.09
Average Dissimilarity(CL & PA) = 89%
CLPA
SpeciesAv.AAv.AAv.DC.%
Afzelia quanzensis0.450.181.6849.57
Albizia adianthifolia0.450.722.7931.42
Annona senegalensis
Artabotrys brachypetalus0.300.331.5651.32
Brachylaena discolor0.330.131.3757.82
Brachylaena huillensis0.230.572.1039.15
Bridelia micrantha0.900.884.2017.46
Citrus x sinensis
Combretum molle0.480.853.0724.96
Croton sylvaticus0.070.371.0168.05
Cussonia spicata0.180.371.4356.28
Dalbergia nitidula0.200.51.8145.72
Dichrostachys cinerea0.330.151.4454.68
Englerophytum magalismontanum0.220.782.5134.24
Faurea saligna---0.370.9669.13
Ficus sur0.170.271.1761.89
Hexalobus monopetalus0.280.201.2160.57
Hyperacanthus amoenus0.120.230.9270.16
Maesa lanceolata0.080.331.1165.69
Mangifera indica
Musa acuminita
Parinari curatellifolia0.281.053.6121.52
Peltophorum africanum0.220.181.1663.19
Persea americana
Pseudolachnostylis maprouneifolia0.450.772.9728.29
Psidium guajava
Pteleopsis myrtifolia1.331.976.407.19
Pterocarpus angolensis0.050.431.2359.21
Rothmannia capensis
Sclerocarya birrea0.250.121.1164.44
Scolopia Mundii0.020.381.0966.91
Senegalia ataxacantha0.450.432.2736.79
Strychnos madagascariensis0.20.471.5553.06
Syzygium cordatum0.180.571.9843.69
Tabernaemontana elegans1.330.704.9412.74
Trichilia emetica
Vachellia sieberiana0.300.422.0641.46
Vitex ferruginea
Ximenia caffra
Xylopia parviflora0.370.321.7547.68
Av.A = Average abundance. Av.D = Average dissimilarity. C = Contribution. TOF = Trees on farms. CL = Communal land. PA = Protected areas.
Publisher’s Note: MDPI stays neutral with regard to jurisdictional claims in published maps and institutional affiliations.

