Article

Water Storage and Use by Platycladus orientalis under Different Rainfall Conditions in the Rocky Mountainous Area of Northern China

School of Soil and Water Conservation, Beijing Forestry University, Beijing 100083, China
*
Author to whom correspondence should be addressed.
Forests 2022, 13(11), 1761; https://doi.org/10.3390/f13111761
Submission received: 21 September 2022 / Revised: 20 October 2022 / Accepted: 21 October 2022 / Published: 26 October 2022
(This article belongs to the Special Issue Sap Flow Measurements—A Tool To Talk with Trees)

Abstract

:
Tree water transport and utilization are essential for maintaining ecosystem stability in seasonally arid areas. However, it is not clear how Platycladus orientalis absorbs, consumes via transpiration, and stores water under varying precipitation conditions. Therefore, this study used stem sap flow thermal dissipation probes and hydrogen and oxygen isotope tracing technology to observe different water control treatments in a P. orientalis plantation. We found that the average daily sap flow of P. orientalis under different water control treatments had the following order: no rainfall (NR) < half rainfall (HR) < double rainfall (DR) < natural rainfall (AR). The percentage of nocturnal sap flow was as follows: AR (13.34%) < NR (19.62%) < DR (20.84%) < HR (30.90%). The percentage of water storage was NR (4.13%) < AR (4.49%) < DR (6.75%) < HR (9.29%). The sap flow of P. orientalis was primarily affected by vapor pressure deficit and solar radiation, with a degree of influence of DR < NR < HR < AR. The response of P. orientalis sap flow to environmental factors differed due to the soil changes in relative extractable water (REW) before and after precipitation. During high REW conditions, environmental factors have a higher impact on sap flow. The source of water absorbed changed regularly with the precipitation gradient. When soil water content increased, the water source used by P. orientalis gradually changed to shallow soil. Compared to before and after precipitation, there was no significant change except for NR. P. orientalis could regularly adjust the activities of transpiration water consumption, water storage, and absorption. This adaptive property is conducive to survival through extreme drought stress.

1. Introduction

Evapotranspiration is the total water vapor flux transported by vegetation and the ground to the atmosphere, which plays an essential role in the energy balance and water cycle of forest ecosystems [1]. The vast majority of evapotranspiration in land plants covered areas comes from plant transpiration [2]. According to statistics, the global average annual evapotranspiration is (476.7 ± 378.2) mm, of which vegetation transpiration, soil evaporation, and canopy interception evaporation are (268.6 ± 303.2) mm, (161.4 ± 103.4) mm and (46.6 ± 77.2) mm, respectively [3]. Transpiration is the primary process by which trees lose water [4,5]. Most of the water absorbed from roots is lost through stomatal transpiration via canopy leaves. Transpiration is not only the main driving force for plants to absorb and transport water and inorganic ions but also plays an essential role in the regional hydrological cycle [6,7,8]. More than 90% of tree transpiration water is consumed by tree sap flow, which is the most active part of the Soil-Plant-Atmosphere Continuum (SPAC) [9]. Sap flow is an essential physiological index to measure water consumption in plant transpiration, as a critical component of water and energy balance. Previous studies have shown that accurately quantifying sap flow was important for studying how transpiration and water consumption of trees changed [10].
Sap flow varies from day to night. Early studies have suggested that no transpiration occurs at night due to the lack of solar radiation (RS), low vapor pressure deficit (VPD), and the stomata on plant leaves being closed [11,12,13]. However, the research in recent ten years has confirmed that nocturnal sap flow plays an essential part in the transpiration of some plant species, accounting for 5%–20% of the total day sap flow [14,15,16,17]. The occurrence of nocturnal sap flow increases the water potential of trees, which alleviates the effects of drought on pre-dawn photosynthesis and effectively reduces the formation of xylem embolization [18]. VPD is the leading cause of tree transpiration [5,19]. Researchers determined the start time of VPD as the actual start time of tree transpiration, and tree transpiration reflected by sap flow often lags behind actual tree transpiration [20]. Therefore, we can distinguish transpiration from water storage by the relationship between sap flow and VPD [21]. Specifically, when VPD is close to 0, and the sap flow is still moving, trees are storing water [22]. The water storage capacity of trees can be estimated by using the time lag between the sap flow and the start of transpiration (VPD start). Many studies have focused on the daytime sap flow, yet few studies have been conducted on the effects of nocturnal tree water storage on water balance in the ecosystem [23].
VPD, RS, wind speed (WS), and soil moisture are considered the main meteorological influence factors of sap flow [21]. Some studies have found that the correlation between stem sap flow density and various environmental factors was highly significant [4,24,25]. In addition, stem sap flow was affected by the weather. The degree of response of sap flow to environmental factors varies significantly under different weather conditions [26,27]. Li et al. [28] and Zhang et al. [29] found that under the weather conditions of sunny, cloudy, and rainy days, the daily variation process of sap flow was significantly different, and its response to environmental factors varied with typical weather, especially temperature, VPD, and RS. Xia et al. [30] found that the meteorological factors on sunny days explained the sap flow of camphor trees more than those on rainy days. In addition, precipitation affects tree sap flow by changing most ecological conditions, especially soil and air moisture [31]. Researchers have confirmed that rainfall levels significantly affected sap flow. This process is based on the change of soil moisture by precipitation input. When soil water content increased with the increase in rainfall, tree sap flow movement was strong. When the soil moisture content decreases, the sap flow decreases [30]. The response of plant sap flow in light rain events is weak and will change significantly only after reaching the precipitation threshold [32,33]. When the rainfall pattern changes, the intensity and duration of soil drought cannot be determined due to the randomness of rainfall, which affects forest transpiration [34]. In addition, some studies found that the sap flow of a stand of trees did not change or showed only a minimal change after reducing rainfall [35,36]. This could be due to trees changing their water sources under drought treatment and absorbing more groundwater to alleviate drought caused by reduced rainfall.
Both originating from precipitation, soil water and groundwater are the two primary water sources of plants [36]. Precipitation fundamentally affects the hydrological process of an ecosystem. Plants will adjust their water sources and utilization strategies due to changes in precipitation patterns. Thus, species structure and community composition are affected [37]. Williams et al. found that in areas with frequent precipitation and abundant water, Quercus species mainly used shallow water [38]. In contrast, the main water sources available during times with a lack of rainfall are deep soil water and groundwater. Plants also vary the water sources they use during the dry season to prevent growth from being limited by a decrease in the water content of the shallow soil. The effect of drought on plant transpiration is also related to the depth of the water absorbed. Jackson et al. [39] and Meinzer et al. [40] showed that trees acquire deep soil water during dry seasons to maintain or even increase transpiration. Schwendenmann et al. [41] investigated seasonal tree water uptake patterns in an experimental plantation in central Panama. These studies indicated that plant species that use deep soil water maintain higher transpiration during the dry season.
The mountainous area of Beijing has the typical seasonal arid climate of northern China, with poor soil and an abundance of gravel. The precipitation is unevenly distributed, and the water deficit is severe [22]. Platycladus orientalis is one of the main species used for afforestation in the region, and the forest containing P. orientalis accounts for 26.2% of the total forest area in the Beijing mountainous area. The P. orientalis forest is a relatively stable top-level community that provides essential ecological protection to local social and economic development [42]. Therefore, we studied the average growth and distribution of P. orientalis in seasonally dry areas and clarified that the characteristics and patterns of transpiration, water consumption, storage, and absorption are of great scientific significance for the restoration and construction of local vegetation. We used thermal diffusion probe (TDP, Dynamax Inc., Houston, TX, USA) technology to continuously observe the sap flow of a P. orientalis plantation in Beijing’s mountainous area. This study had the following main objectives: (1) To reveal the variation of sap flow and nocturnal water storage under different water conditions by using a controlled precipitation device. (2) We explored the relationship between the sap flow characteristics of P. orientalis and the main environmental factors before and after different precipitation conditions and rainfall events. (3) We determined hydrogen and oxygen isotopic compositions of the soil and tree branches using isotope (δ2H and δ18O) techniques. The Iso-Source model was used to determine the contribution rate of soil water at different depths to plant water under various moisture conditions to evaluate the vulnerability of the mountainous region in the north of Beijing to future precipitation changes. In addition, this study provides a theoretical basis for afforestation and management measures in this area.

2. Materials and Methods
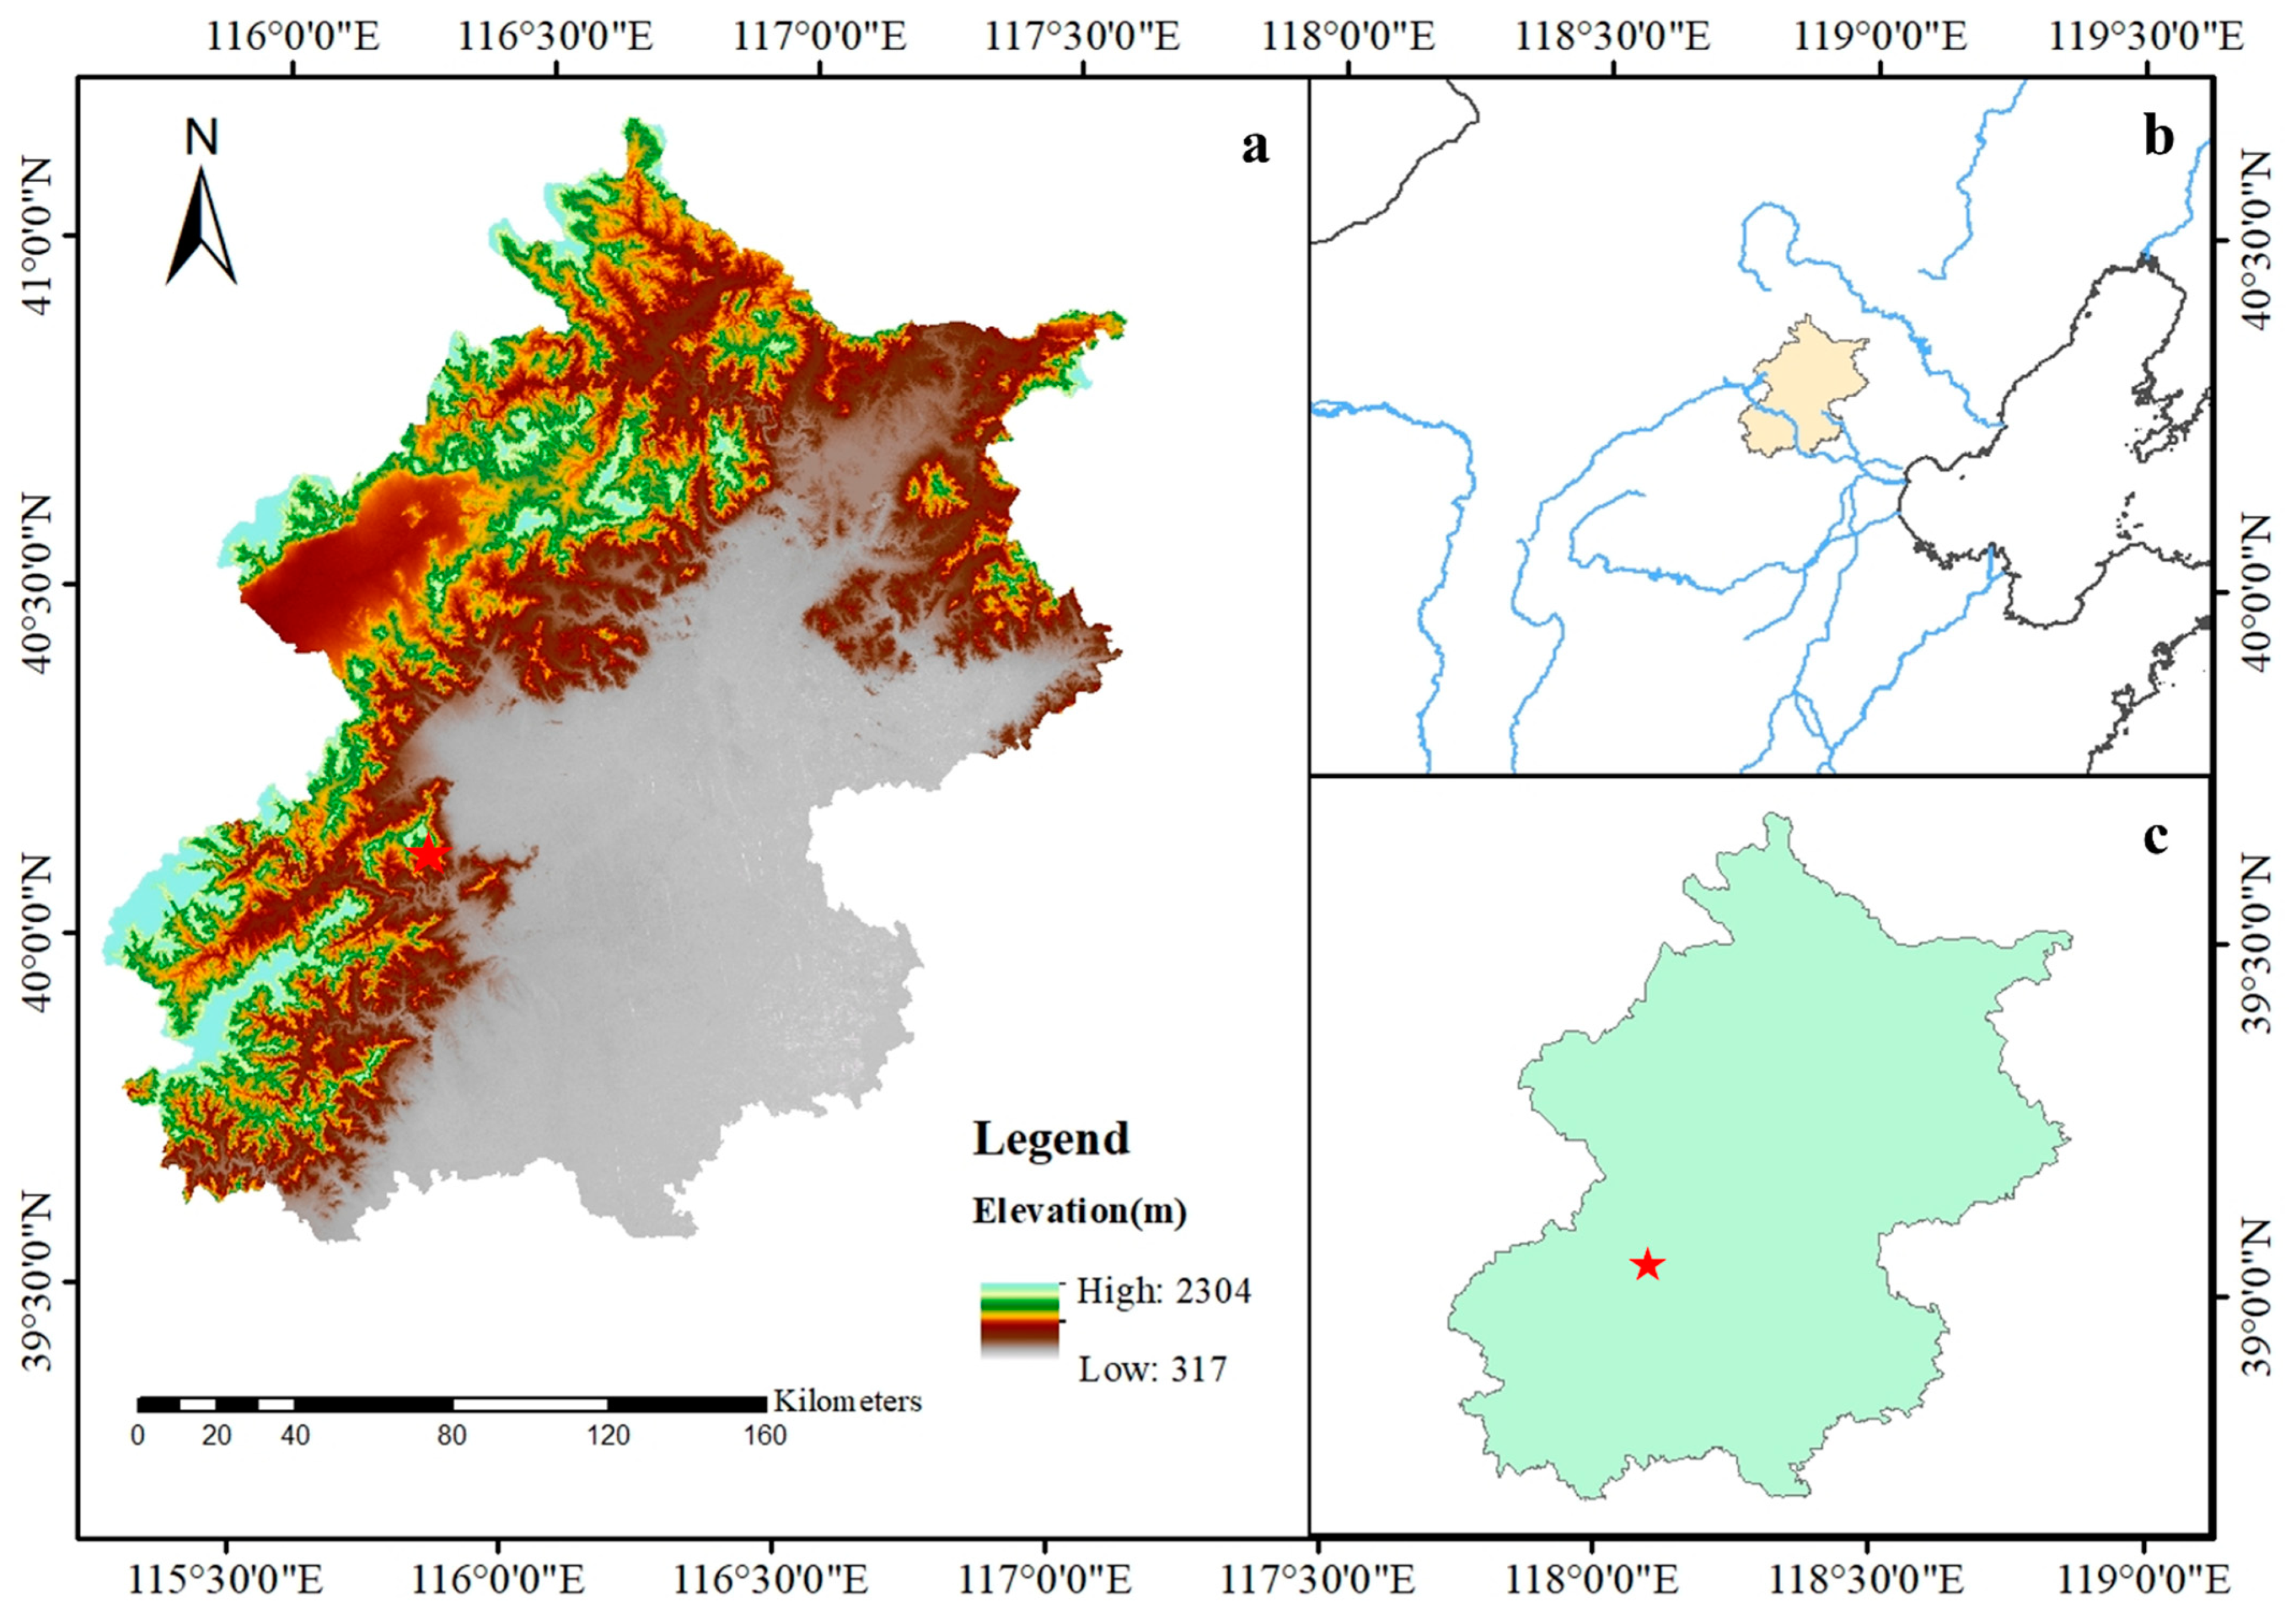
2.1. Study Site

The study was conducted at the Forest Ecosystem Positioning Research Station in Beijing (40°3′46″ N, 116°5′45″ E) (Figure 1), which covers an area of 16 km2. Under the strong influence of warm temperate, semi-humid, and semi-arid continental monsoon climates, the average annual precipitation is 610.1 mm, falling mainly from August to September. The potential evapotranspiration is approximately 1800 mm. The average annual air temperature is 13.1 °C. The highest and lowest temperatures recorded in history were 41.6 °C and −19.6 °C. The average annual sunshine is 2662 h, and the average frost-free period is 193 days. The selected study site consists of a P. orientalis plantation spanning an area of 20 m × 20 m with a gradient of 20°. The primary soil type is brown soil. The average thickness of barren soil was 52.8 cm. Most shrubs in the study site are Grewia biloba and Ziziphus jujuba. Herbaceous plants include Carex lanceolata and Oplismenus undulatifolius.

2.2. Experimental Design

The mountainous area of Beijing, in which the study site is located, is seasonally arid. The P. orientalis in the study site was typically more than 10 m tall. Due to the limitation of weather, region, and species at the test site, it is challenging to artificially simulate rainfall and is a tremendous waste of water resources. Therefore, this study independently developed a set of precipitation gradient control devices. We used natural precipitation to set a specific rainfall gradient. The test device was placed at the study site in March 2021. The observation period for the study was from 1 August to 30 September 2021. We selected P. orientalis trees with similar morphological characteristics (i.e., diameter at breast height, tree height, and forest age) in the plantation. Table S1 shows the conditions of the study site. Four precipitation control areas with an area of 10 m × 10 m were set. The water control treatments were divided into no rainfall (NR), half rainfall (HR), natural rainfall (AR), and double rainfall (DR) areas.
Figure 2 illustrates the different treatments. For the NR treatment, a rain screen was installed above the tree canopy to block the precipitation input, resulting in a rain-free area. The slope of the rain screen was set at 30°. To prevent any precipitation from falling in the NR treatment area, we also covered the ground with white polyester ethylene plastic and a water-retaining PVC plate to shield the ground from water. When it was laid on the ground, the plastic sheet was situated close to the trunk and fastened with elastic rope to prevent stem flow from entering the ground. PVC ventilation pipes with a length of 1 m and a diameter of 11 cm were laid along the sample every 2 m under the plastic cloth. There were vents on the side of the pipe wall that were not in contact with the ground or the plastic sheet. These extra steps were taken for the NR treatment to ensure that there was no precipitation input and ensure ventilation. A rain baffle board was placed above the canopy of the HR treatment, and the area of the rain baffle covered half of the HR treatment area. The slope of the rain baffle board was set as in the NR treatment, and a rainwater collecting device was situated at the bottom of the slope to block half of the precipitation. No rain baffle was placed in the AR treatment to allow for natural precipitation. The DR treatment was located next to the NR treatment so that the precipitation that was blocked by the NR treatment could flow into the DR treatment along the slope of the rain baffle. Because there was no rain baffle device above the canopy of the DR area, it had natural rainfall conditions. On this basis, combined with the precipitation intercepted by the NR area, these conditions resulted in double precipitation. The soil layer thickness in the study site was 0.8–1 m, and below 1m is the impermeable rock layer [43,44]. The plant root depth ranges from 0 to 1 m. A 1 m deep trench was dug between the trees in each treatment area, and a PVC board was inserted. The buried depth of the PVC board was up to the impermeable layer, and it extended 20 cm above the surface to prevent surface and underground runoff between different treatment areas. Moreover, to ensure that the meteorological conditions in different water control areas were consistent, the rain shields used in the test device were transparent materials, and the device frame occupied a small position. The distance between each water control area was close, and the climate difference in the forest was minimal.
The replicated test plot consisted of two plots with the same devices as described above in woodland with the same slope, aspect, and elevation. In order to verify that P. orientalis was used as an independent system to carry out plant transpiration under each water control condition, a 10 m × 10 m plot was established on the same slope and aspect 50 m away from the treatment plot as the control plot.
To verify the effect of the treatments, we randomly set 5 m × 5 m quadrats in each treatment area from June to July 2021. Twenty rain collectors were placed evenly in each quadrat to obtain rainfall distribution. After measurement, the HR and DR-treated rain screen area was 56.2% and 110.5% of the respective total treatment area. According to the proportion of rainfall collected by the rainfall collector to the total rainfall, we calculated that rainfall in the four treatment areas was 0.0%, 48.5%, 97.8%, and 192.1% for NR, HR, AR, and DR, respectively.

2.3. Measurement and Calculation of Tree Sap Flow

This study focuses on the difference in sap flow under different water control treatments. Therefore, select sample trees of the same diameter class, and ensure that the sapwood depth inserted by the TDP probe is consistent, so as to avoid increasing the variables affecting the sap flow due to tree physiological factors and test operation problems. Trees with the same diameter class, good growth, no pests, and no diseases were selected for sap flow observation in each treatment area. There were three replicates for each treatment. Trees No. 1–3 were selected in the NR plots, No. 4–6 were selected in HR, No. 7–9 were selected in AR, and No. 10–12 were selected in DR. Table 1 provides basic information about the 12 sampled trees. The DBH of the sample tree is 12.39–14.01 cm. We used the growth cone to drill the tree core at the DBH of the sample tree and measured the sapwood and heartwood length. The heartwood diameter of Platycladus orientalis was 1.51–2.03 cm. Stem sap flow was measured using TDP. According to the TDP operation manual, for trees with DBH of 12.5–20 cm, in order to ensure that the probe is inserted into the sapwood without touching the heartwood, a probe with a length of 3 cm should be selected. After drilling at diameter at breast height, we installed TDP. After installation, to prevent rain and heat radiation from affecting the probe, we used silicone glue to seal the joint between the probe and the trunk. Aluminum foil was wrapped around the tree trunk at the probe site. A data collector was connected to the probe. The collection frequency was every 10 s. The mean value was calculated every 30 min and recorded.
The empirical formula for calculating sap flow density (JS) is as follows:
J s = 0.0119 × ( D T M D T D T ) 1.231
F V = J S × A S × 1800
Q = i = 1 48 F V × 1000
where J s is the sap flow density (g·cm−2·s−1). Δ T M is the maximum diurnal temperature difference between the upper and lower probes. Δ T is the instantaneous temperature difference. F V is the sap flow rate (g·h−1). A S is the sapwood area at the diameter at breast height (cm2). The unit conversion value was 1800. Q is the day and night flow (kg·d−1). This study averaged sap flow density (JS), sap flow rate (FV), and daily sap flow (Q) from three P. orientalis individuals in each treatment area.

2.4. Hydrometeorological Measurements

A HOBO (Onset Inc., Cape Cod, MA, USA) automatic weather station was installed on the open ground 800 m from the plantation, and it collected the following data every 30 min: precipitation (P), RS, atmospheric pressure, air temperature (T), air relative humidity (RH), and WS. Data were recorded every 30 min. The VPD near the forest can be calculated according to T and RH:
VPD = 0.611 e [ 17.502 T / ( T + 240.97 ) ] ( 1 R H )
An ECH20 water sensor was installed in the precipitation control area of the sample plot. The ECH20 collected data every 10 min, and average values were output every 30 min. The monitoring depth is 0.3 m. The water sensor in each water control treatment area has three repetitions. In order to reflect the influence of soil water content on plants, the study followed the relative extractable water (REW) method using the following formula [45]:
REW = ( SWC SWC min SWC max SWC min )
where: SWC is the measured soil water content. SWCmax is the field water capacity of the sample plot. SWCmin is the minimum soil water content during the study period. When REW < 0.4, researchers usually assume that plants are under soil water stress. According to REW, the soil water content during the study period was divided into SWC-H (REW > 0.4) in the relatively high soil water content period and SWC-L (REW < 0.4) in the relatively low soil water content period.
In order to explore the influence of the difference in soil moisture before and after rainfall on the response of sap flow to environmental factors, we used REW to divide the SWC of the four water control treatments before and after each rainfall.

2.5. Determination of the Water Source

Branches and soil samples were collected from the NR, HR, AR, and DR treatments on a typical sunny day before and after the rainfall event on 4 September 2021. Three well-growing P. orientalis trees with similar height and diameter at breast height were selected in each treatment plot, and fully mature branches of the same height were collected as samples. The diameter of the branches was 1–3 cm, and the length was 3–5 cm. Branches were collected from each plant in triplicate. A soil drill with an inner diameter of 5 cm and a length of 150 cm was used near the sample tree to stratify samples according to 0–20, 20–40, 40–60, 60–80, and 80–100 cm at 20 cm intervals. Each soil layer was collected in triplicate. We collected spring water samples from the Jingshan Spring (116°04′ E, 40°04′ N) to represent the groundwater, with samples taken in triplicate. The soil, branch, and groundwater samples were immediately put into 50 mL sampling bottles after collection, sealed, and transported to the laboratory freezer for later use (−10 °C).

2.6. Stable Isotope Analysis

The isotope values of the collected soil and branch samples were measured in the Laboratory of Eco-Hydrological Processes and Mechanisms, Beijing Forestry University. First, the outer epidermis of the collected branches was removed, and the xylem was retained. An automatic vacuum condensation extraction system (LI-2100, LICA, Beijing, China) was used to extract the moisture from the soil and branch samples. Subsequently, the hydrogen and oxygen isotopic compositions of the resulting water samples collected from soil, branches, and groundwater were analyzed using a Sap Water Isotope Analysis Instrument (DLT-100, LGR, San Jose, CA, USA). The ratio of H and O is the thousandth difference from the standard mean ocean water (SMOW), and the determination accuracy was 0.3‰ and 0.1‰, respectively. Represented by:
δ X = ( R sa R st ) / R st × 1000
where δ X is δ D or δ O . R sa and R st represent the 18O or 2H isotope ratios of the sample to the standard mean ocean water, respectively.
Due to the rich organic matter in plants, the samples were contaminated by spectra during low-temperature vacuum distillation [46]. Therefore, we used the software provided by LGR (LWIA-Spectral Contamination Identifier v1.0, LWIA-SCI) to identify and correct the spectra [47] (see Supplementary Information). Figure S1 shows the corrected sample isotopic composition data.

2.7. Data Analysis

In this study, Excel software was used for data sorting and calculation, and R language was used for statistical analyses. The significant differences between samples were determined using one-way analysis of variance (ANOVA), and the degree of impact of each environmental factor was expressed by residual contribution rate PA. Correlation analysis and regression fitting completed the relationship between sap flow and environmental factors. According to the isotope mass conservation principle, the Iso-Source model was used to quantify the relative contribution rate of different water sources. The δ2H and δ18O of five different water sources (0–20, 20–40, 40–60, 60–100 cm soil water, and groundwater) were input into the model simultaneously. The formula was:
δ X S = c 1 δ X 1 + c 2 δ X 2 + c 3 δ X 3 + c 4 δ X 4 + c 5 δ X 5
c 1 + c 2 + c 3 + c 4 + c 5 = 1
where δ X S is the water δ2H or δ18O (‰) in the xylem of tree stems; δX1, δX2, δX3, δX4, and δX5 are the δ2H or δ18O of soil water and groundwater in 0–20 cm, 20–40 cm, 40–60 cm, and 60–100 cm soil layers, respectively. c1, c2, c3, c4, and c5 were the contribution rates of 0–20, 20–40, 40–60, and 60–100 cm soil layers to P. orientalis, respectively.
P A = ( S S A / S S T ) × 100
where: S S A is the sum of squared residuals of each factor, and S S T is the total sum of squared residuals.
Origin2021 was used to make all figures.

3. Results

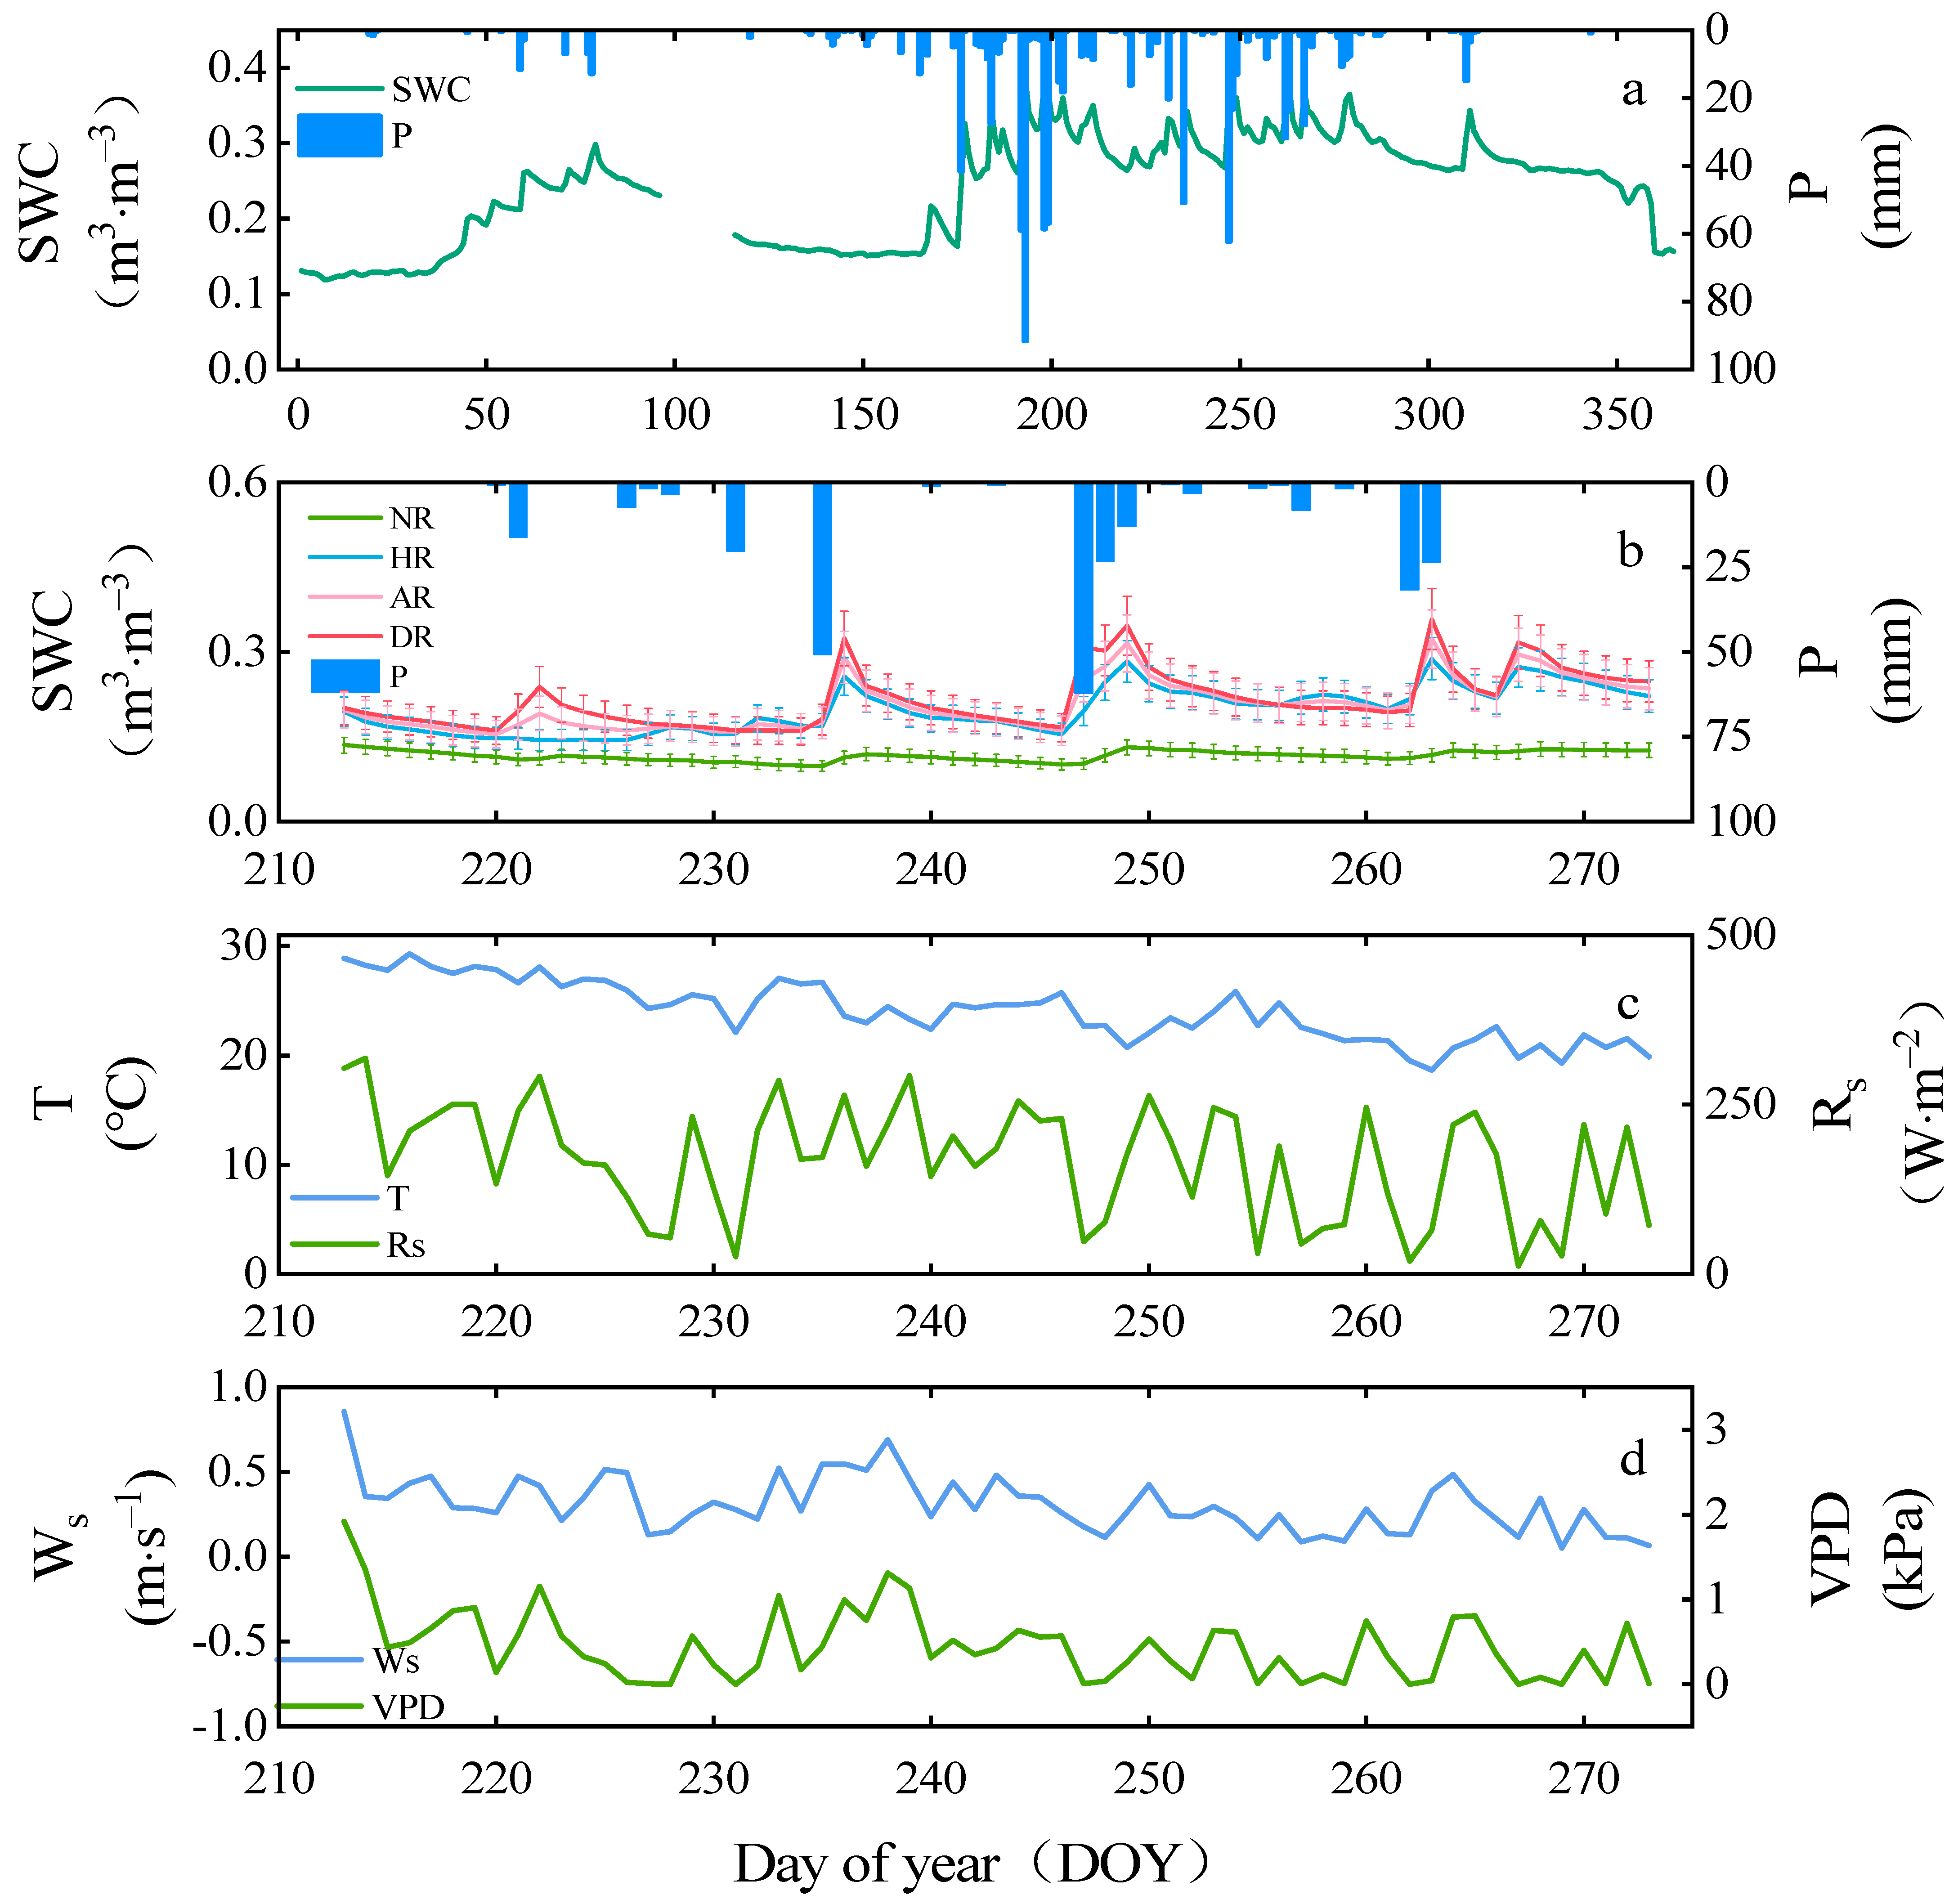
3.1. Environmental Data

The precipitation at the study sites in 2021 was unevenly distributed, totaling 900.6 mm (Figure 3a). Most of the precipitation was concentrated in August and September, with precipitation accounting for 34.37% of the annual precipitation (309.6 mm). From January to May, the SWC was low. During the rainy season, the soil moisture began to rise significantly from June to July. Soil moisture fluctuated in the range of 0.26 to 0.37 m3·m−3 in August and September. The overall soil moisture level began to decline rapidly, with a significant decline in precipitation in October. During the observation period, the highest precipitation was on 4 September and 19, reaching 130 mm and 55.2 mm, respectively. Except for the NR treatment, SWC in the AR, HR, and DR treatments each reached a peak during these rainfall events. The fluctuation of SWC in NR treatment was weak (13.51%–9.81%), which was significantly different from the other three treatment areas (p < 0.01). The treatments were sorted from highest to lowest SWC as follows: DR > AR > HR > NR (Figure 3b). Figure 3c,d shows the daily variation in major hydrometeorological parameters during the observation of the growing season (1 August–30 September) in 2021. The major hydrometeorological parameters include VPD, RS, T, and WS. The range of RS varied between 11.72 and 318.77 W·m−2, and the average value was 167.88 W·m−2. The maximum and minimum values were recorded on 2 August and 24 September, respectively. T decreased over time during the observation period, from a maximum of 29.2 °C to a minimum of 19.3 °C, with an average of 24 °C. The WS ranged from 0.05 to 0.86 m·s−1, with the maximum value on August 1 and the minimum value on September 26, with an average value of 0.31 m·s−1. The VPD varied from 0 to 1.92 kPa, with an average of 0.44 kPa.

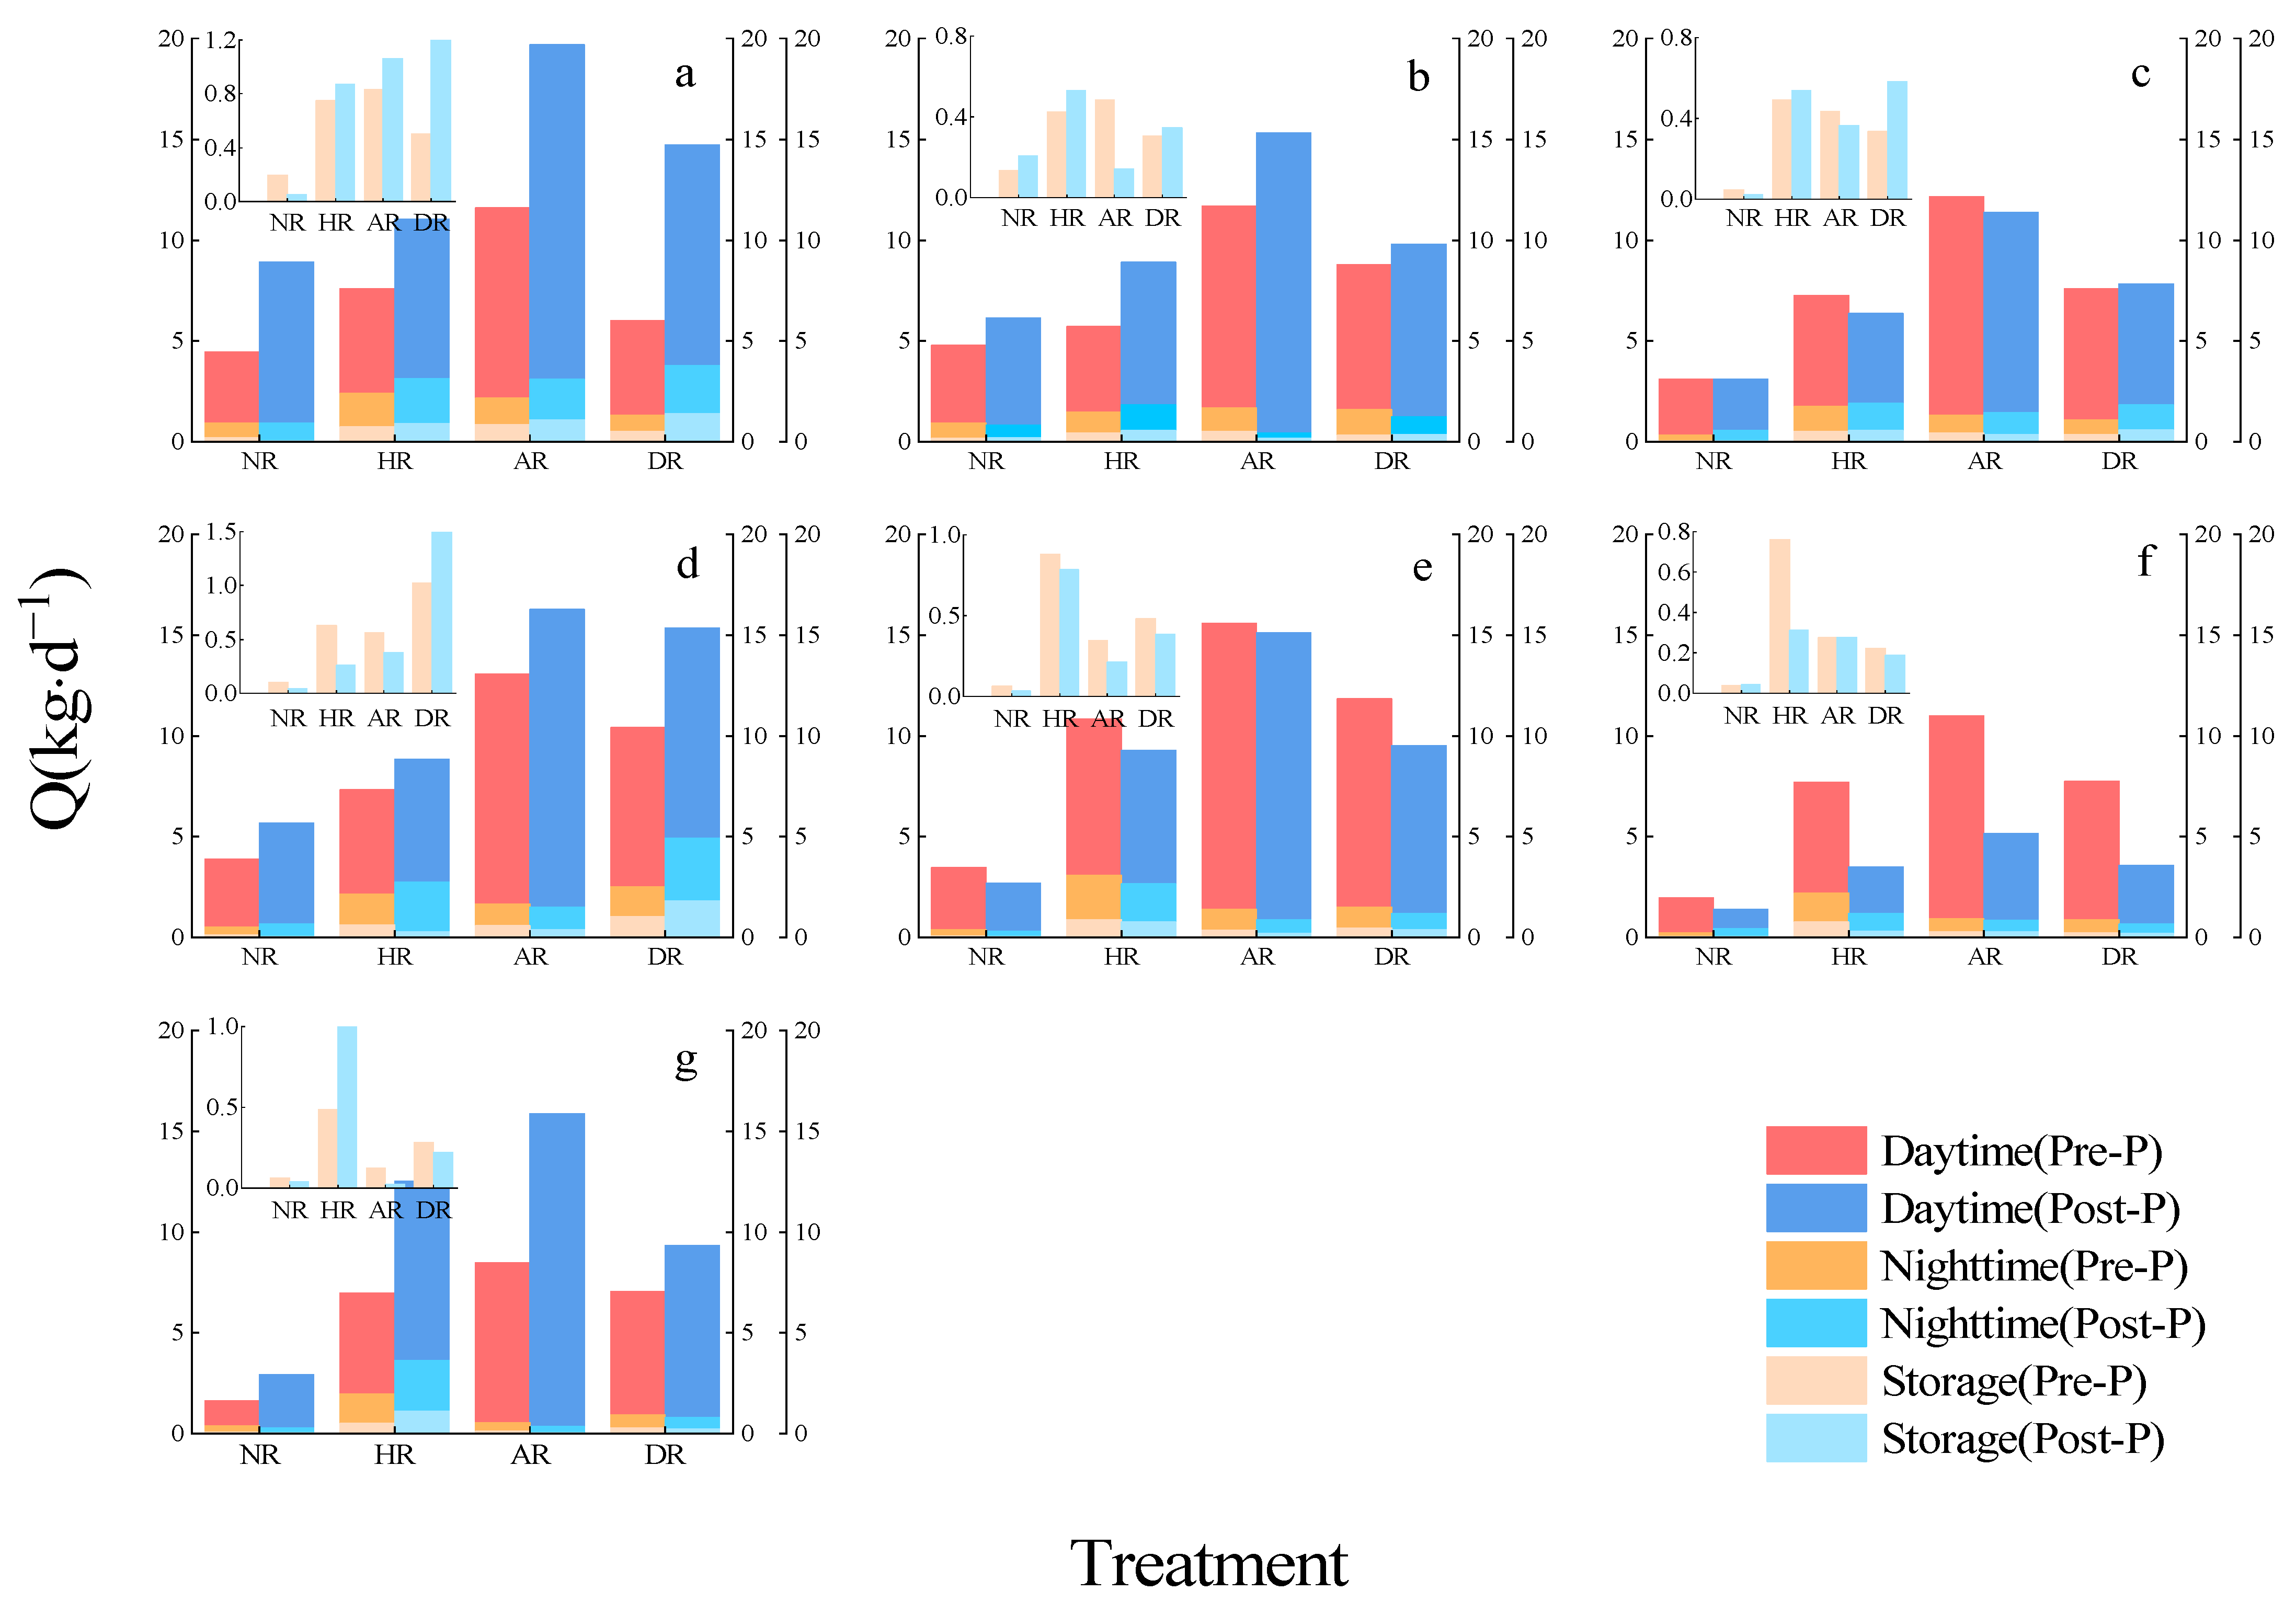
3.2. Time Lag and Calculation of Tree Water Storage

To visualize the time delay, we selected typical sunny days in the middle of August to show the diurnal variation of JS, RS, and VPD. Figure 4 shows that the sap flow lags behind RS and VPD. The lag time of RS (3.5 h) was higher than that of VPD (2 h). Then, the dislocation comparison method was used to move the JS, RS, and VPD for 30 min and conduct a correlation analysis. The time difference with the largest correlation coefficient indicates the delay value of sap flow. Figure 5 shows that JS lags behind RS and VPD. The maximum correlation coefficients between JS and VPD (0.866, 0.929, 0.885, 0.892 for NR, HR, AR, and DR, respectively) under the four treatments were higher than those between JS and RS (0.856, 0.893, 0.883, 0.883). The delay of JS and RS was 5 h, 4.5 h, 3 h, and 3.5 h, respectively, for NR, HR, AR, and DR; the delay of JS and VPD was 2.5 h, 2.5 h, 2 h, and 2.5 h. These findings indicate that sap flow depends heavily on the daily variation of VPD. According to the delay time between JS and VPD, the daily water storage of tree trunks was calculated.

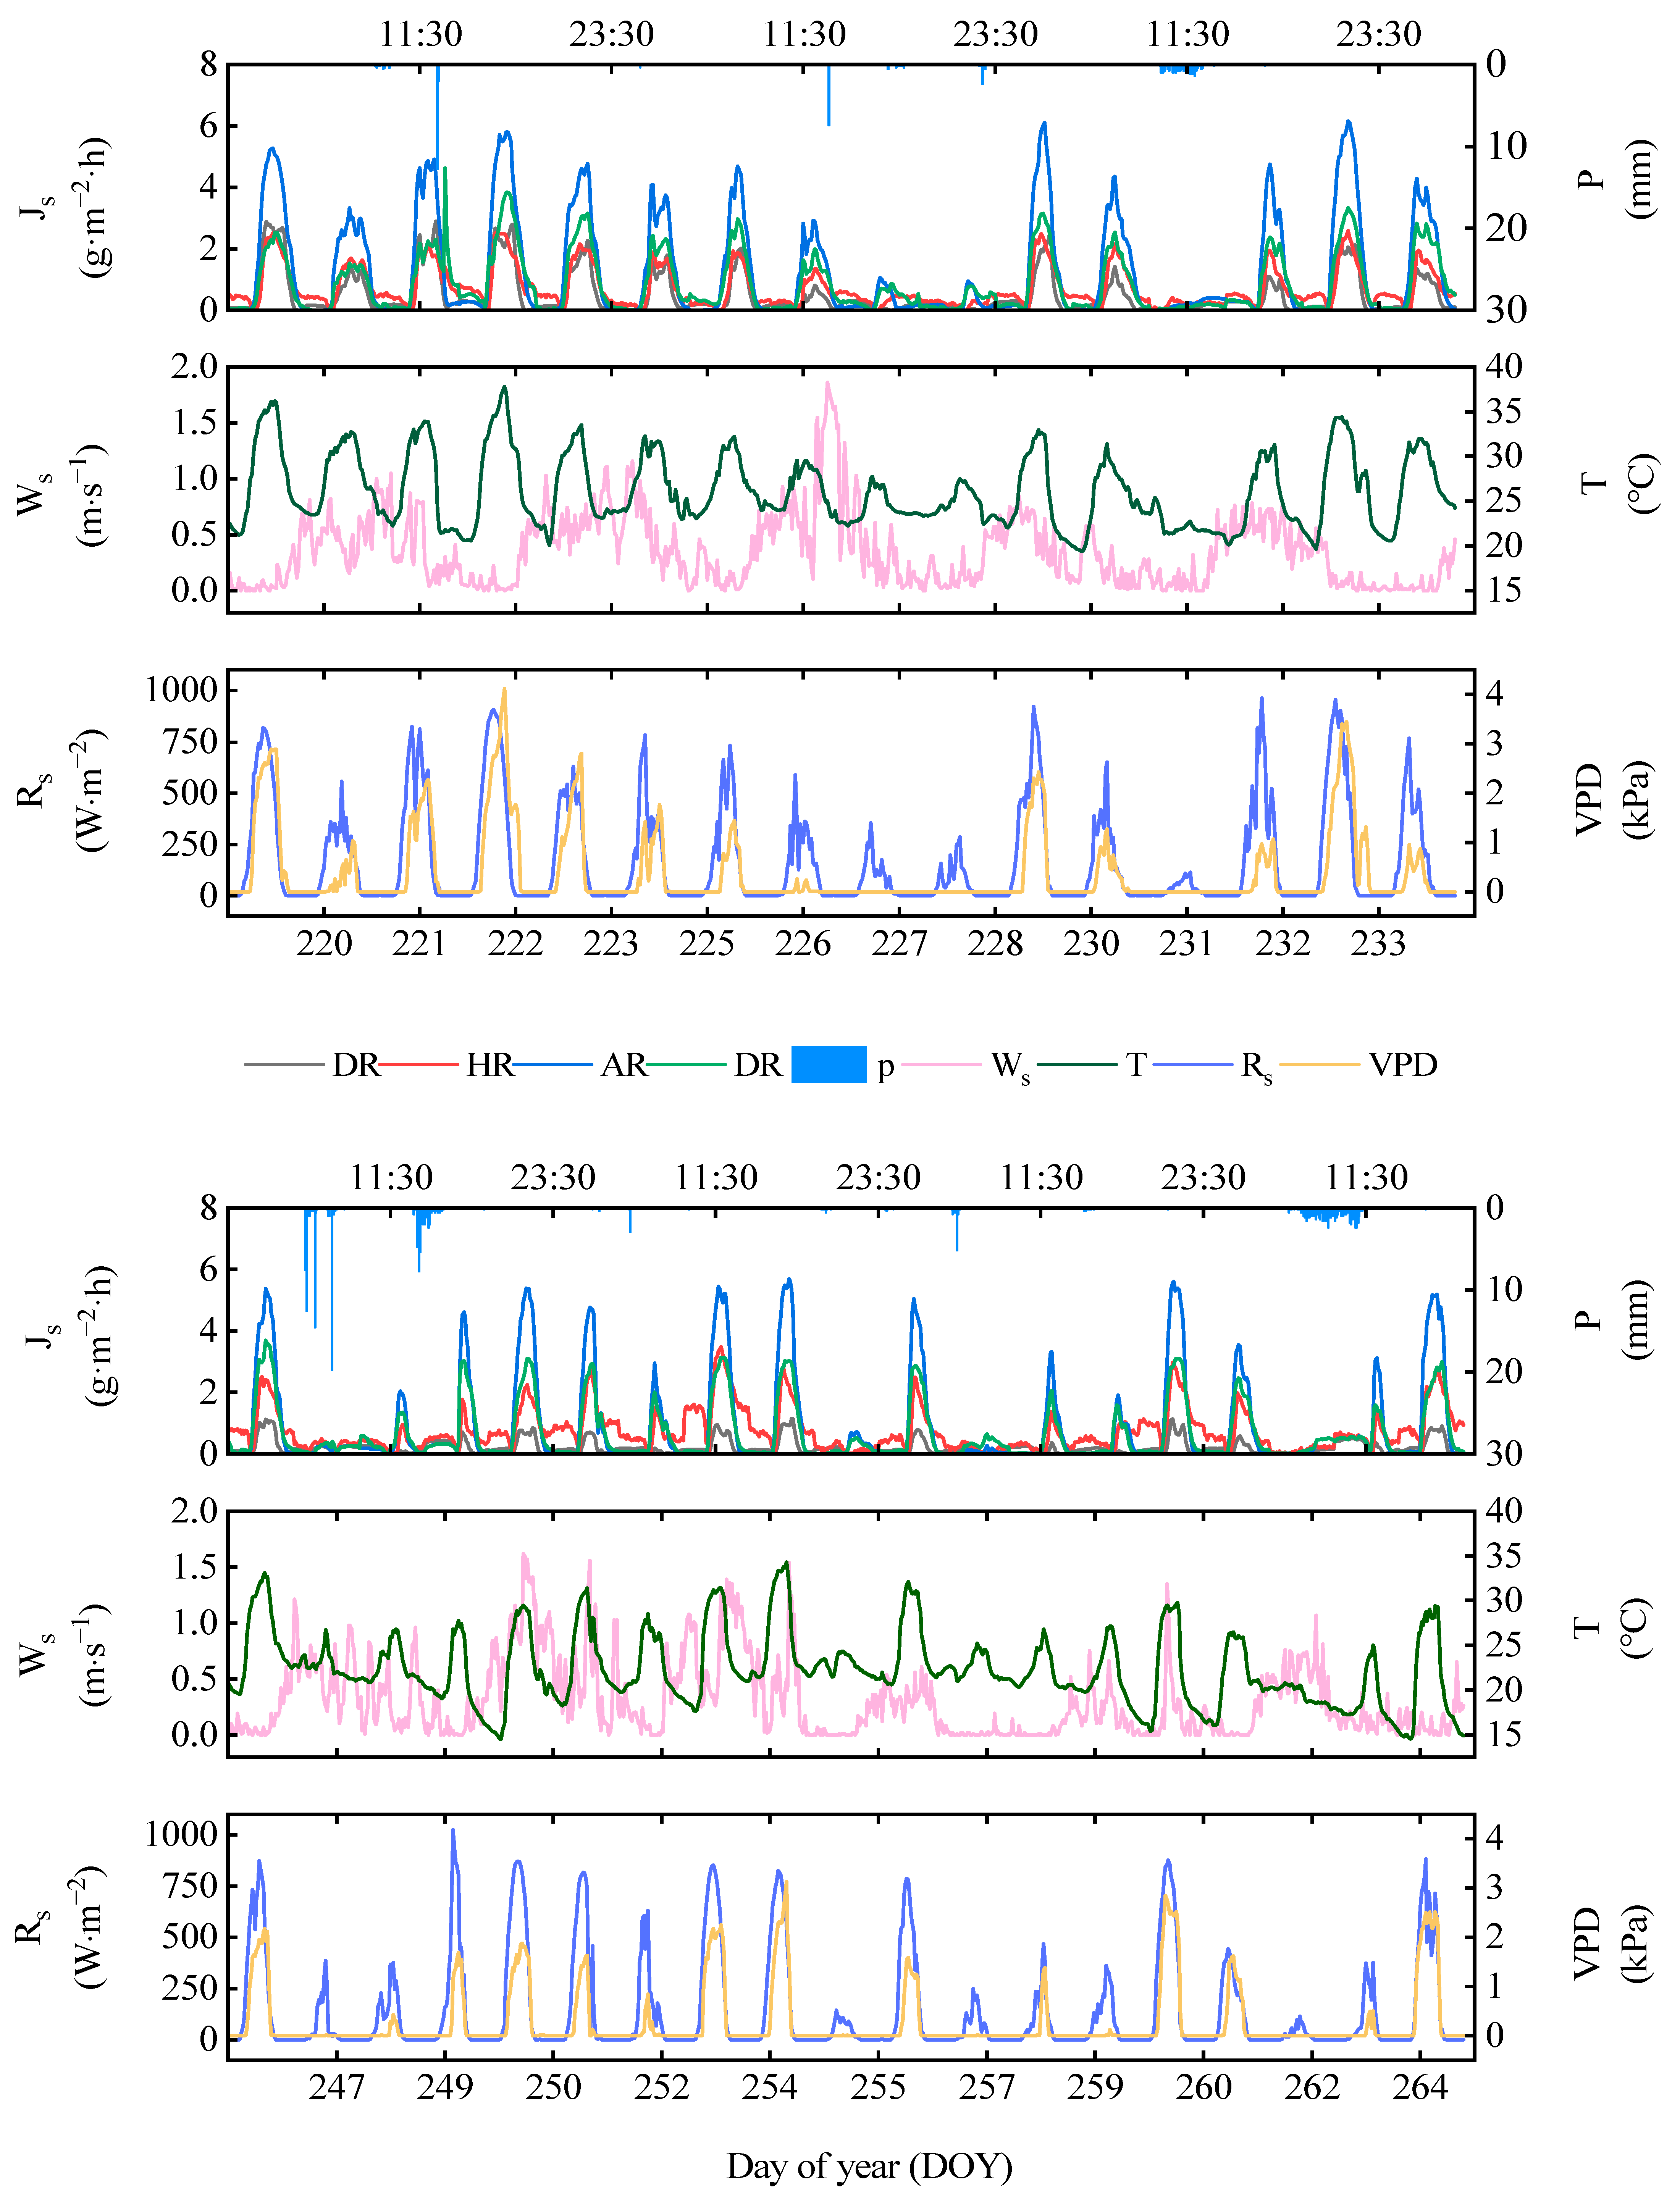
3.3. Characteristics of Sap Flow Changes

We compared the P and Q of trees in the four treatments, as well as the percent of NQ and water storage (WS) in Q (Figure 6). Our findings helped to explore the various characteristics of flow and storage of P. orientalis under different precipitation treatments. The Q of the four treatments was QNR (3.98 kg/d) < QHR (7.68 kg/d) < QDR (10.99 kg/d) < QAR (11.93 kg/d). Under different precipitation gradients, the Q decreased with the decline of the overall precipitation level. However, the sap flow did not increase the proportion of Q in the DR treatment but instead showed a slight decrease. The NQ and WS showed different trends: the NQ was NQAR (13.34%) < NQNR (19.62%) < NQDR (20.84%) < NQHR (30.90%), whereas the WS was WSNR (4.13%) < WSAR (4.49%) < WSDR (6.75%) < WSHR (9.29%).
We investigated the average values of daytime sap flow (QD), nocturnal sap flow (QN), and water storage (QS) on the two days before and after the seven precipitation events (a, b, c, d, e, f, g) during the observation period to determine the characteristics of variation of water consumption and water storage of P. orientalis before and after precipitation. Table S2 shows information about the rainfall events. QD generally showed the change of low before precipitation (Pre-P) and high after precipitation (Post-P; Figure 7). Before and after the precipitation events a, b, d, and g, QD increased with the rate of precipitation. The QD of F in Pre-P was significantly higher than that in Post-P. In addition, the difference in QD before and after the c and e precipitation events was not statistically significant (p < 0.05). QD did not increase because of precipitation input but decreased or remained stable (Figure 7c,e,f), which may be due to the high level of SWC and strong sap flow before precipitation. VPD, RS, and other environmental factors weaken with time from most-recent precipitation events, so the trunk sap flow decreased or maintained its original state. The variation of QN and QS in Pre-P and Post-P were similar to the changes in QD, and the differences in QD, QN, and QS during Pre-P and Post-P in the NR treatment were not significantly different (p < 0.05).
The variation of JS and environmental factors on sunny and rainy days during the observation period is shown in Figure 8. August 21 was a typical sunny day. JS showed a unimodal diurnal variation, where it was high during the day and low at night, with an inverted “U” curve. JS started at approximately 07:30. With the increase in RS, T, and VPD, there was a rapid increase in JS, with a peak at approximately 13:30. In the afternoon, as RS decreased, JS stabilized after falling to a low value at 20:30; it reached its lowest value and approached zero until the next day before the start of tree sap flow at 07:30. The diurnal variation of RS, VPD, and T showed a unimodal curve, like that of JS, and the three-peaked at 11:00, 13:00, and 13:30, respectively. WS has no apparent diurnal variation.
JS initially showed high volatility on rainy days. With the accumulation of precipitation, the change of JS weakened. JS had single and multiple peaks or maintained a low value, which was related to the duration of precipitation. In the precipitation events on August 9 and August 14, precipitation occurred after the start of JS. The environmental factors showed a multi-peak change in these two precipitation events, and JS also showed the same trend. However, the difference in environmental factors after the two precipitation events resulted in a significantly different JS (p < 0.05). After the precipitation event on August 9, the peak values of RS and VPD remained high. On August 14, RS and VPD were low, and the JS was also low. Until the weather turned sunny, RS and VPD recovered to a high level, and the JS movement became active. The precipitation on August 19 lasted throughout the whole daily process of sap flow. During this period, the values of the environmental factors RS, VPD, T, and WS were low. JS has no peak change and remained low. The precipitation began at 07:00 on September 19 and ended at 10:00 on September 20. Throughout the duration of precipitation, JS remained low. When the precipitation stopped, the sap flow density changed with the environmental factors in a single peak curve. RS, VPD, and T on rainy days were significantly lower than on sunny days. Because environmental factors regulate sap flow, the JS of P. orientalis changed irregularly on rainy or cloudy days. In addition, during the increase and decrease in JS, the four treatments showed the characteristics of AR > DR > HR > NR. The sap flow density in the AR treatment was significantly higher than that of the other three treatments (p < 0.05).

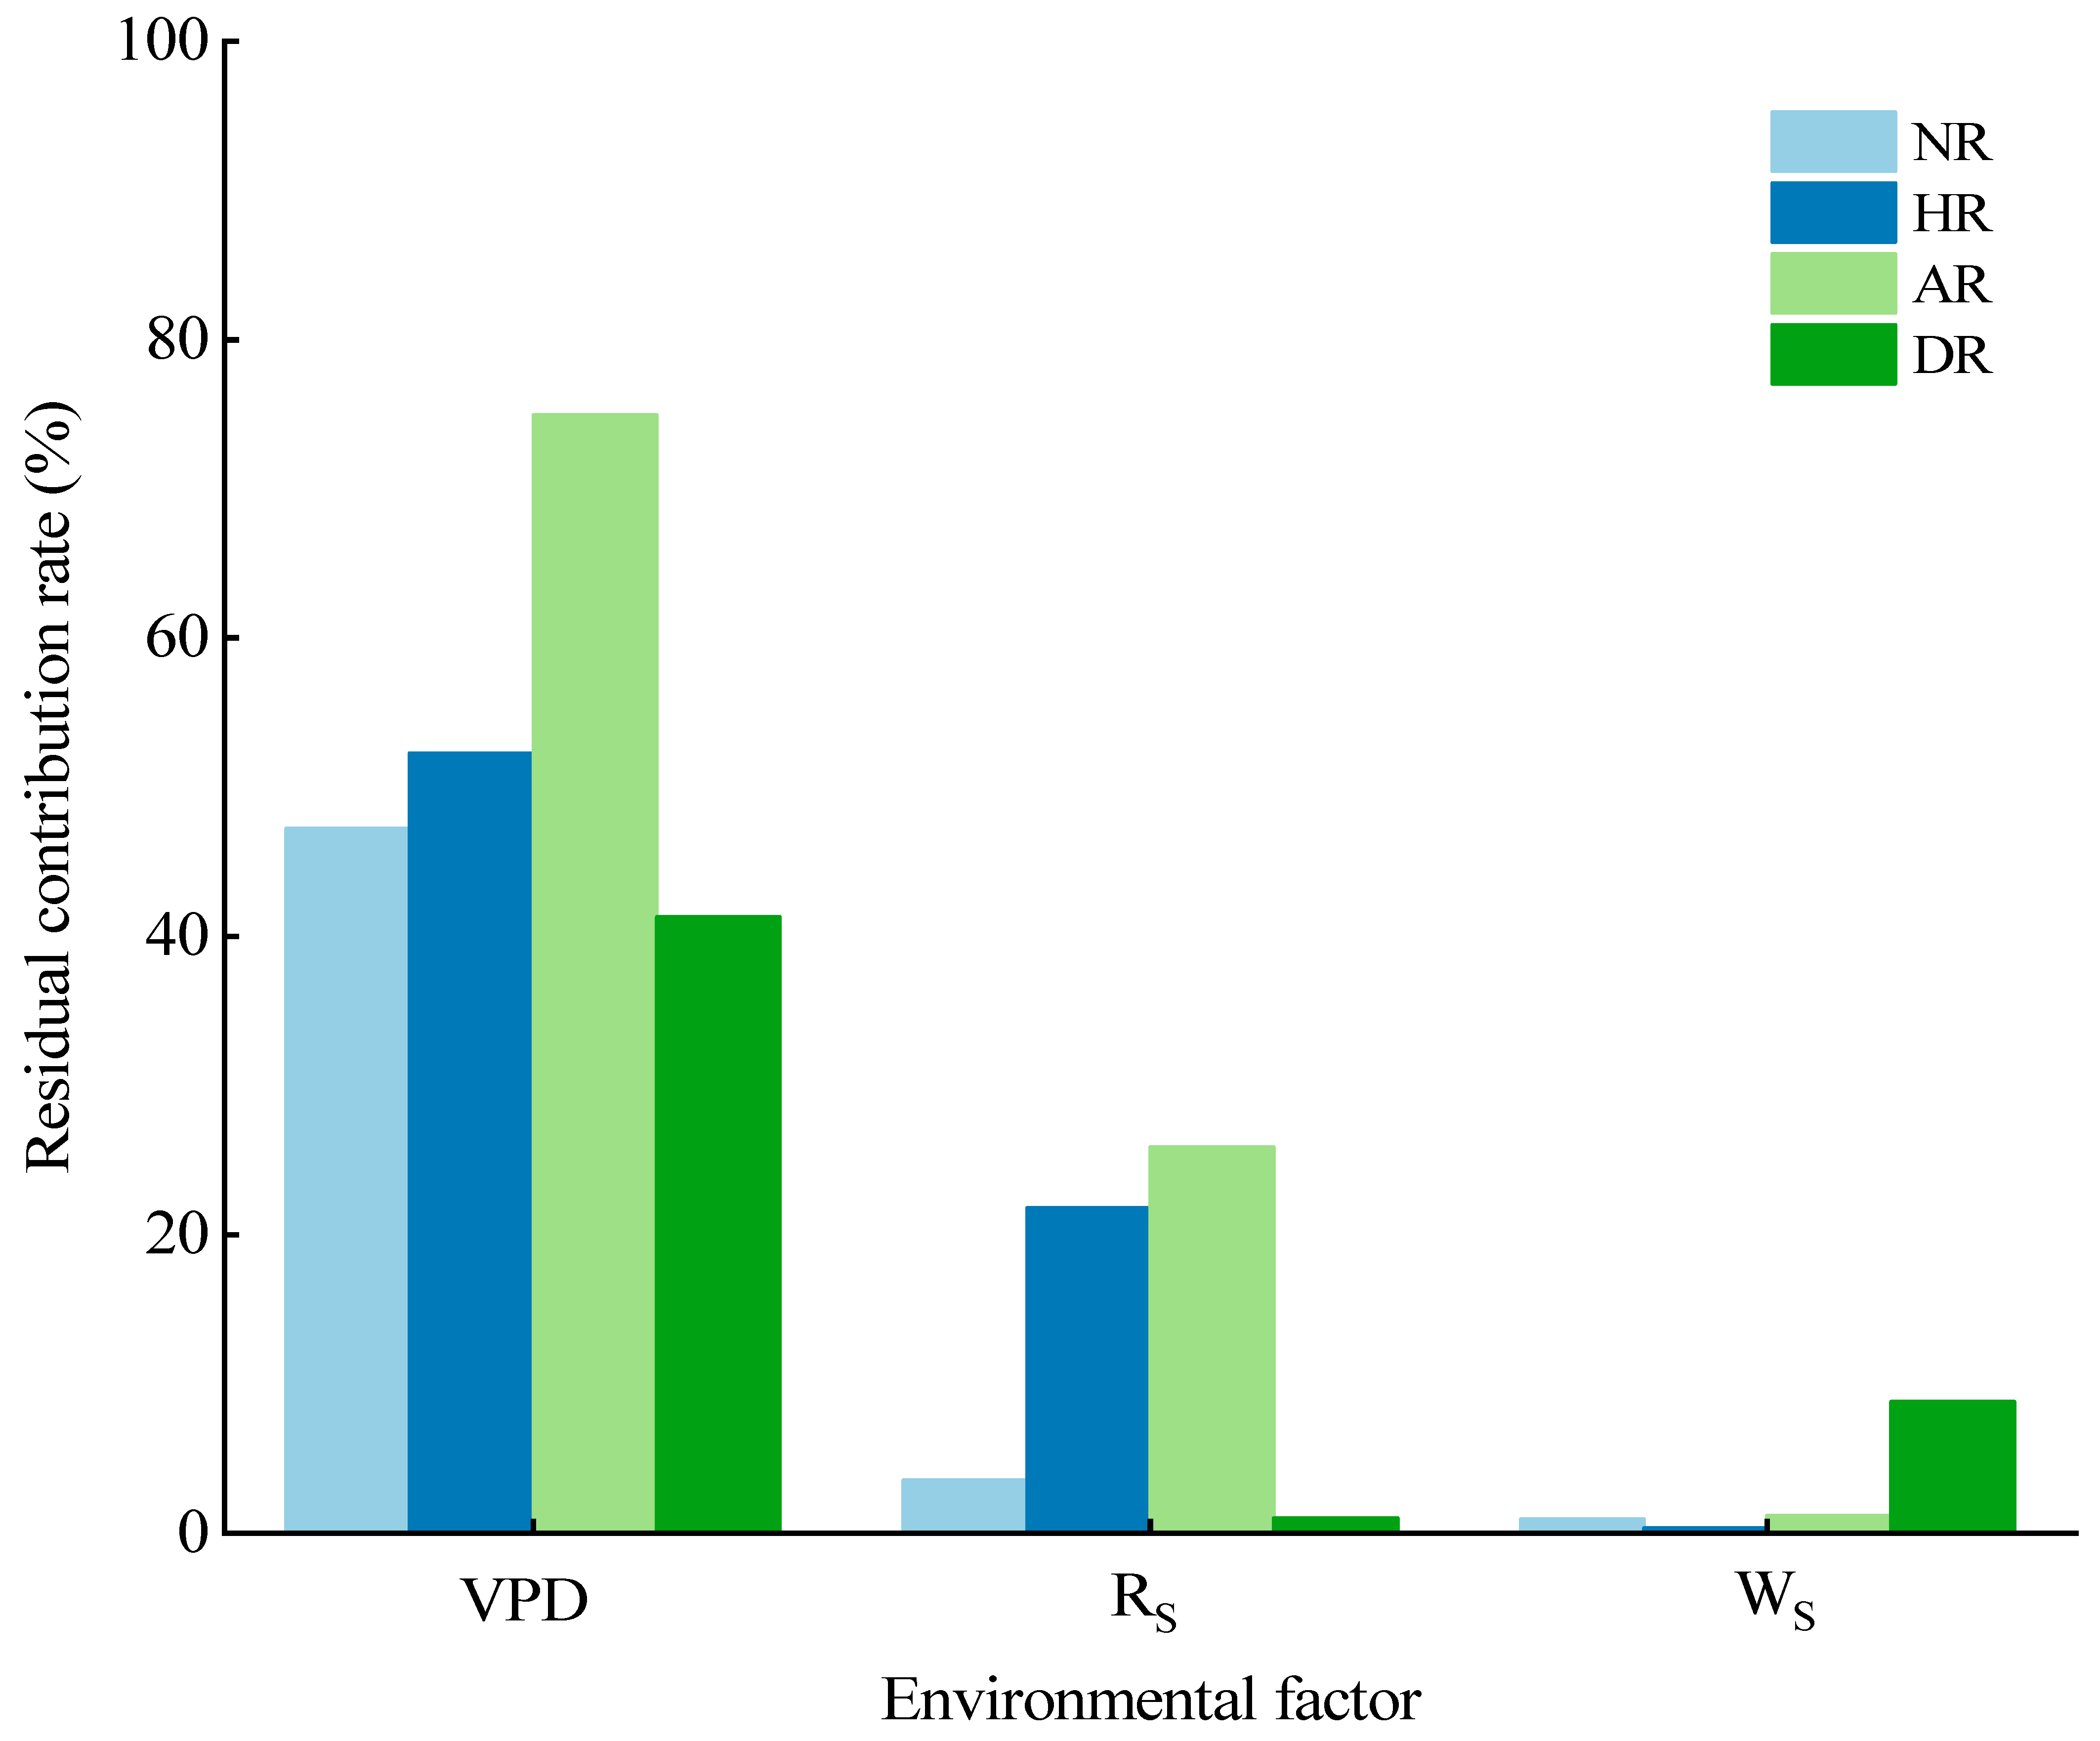
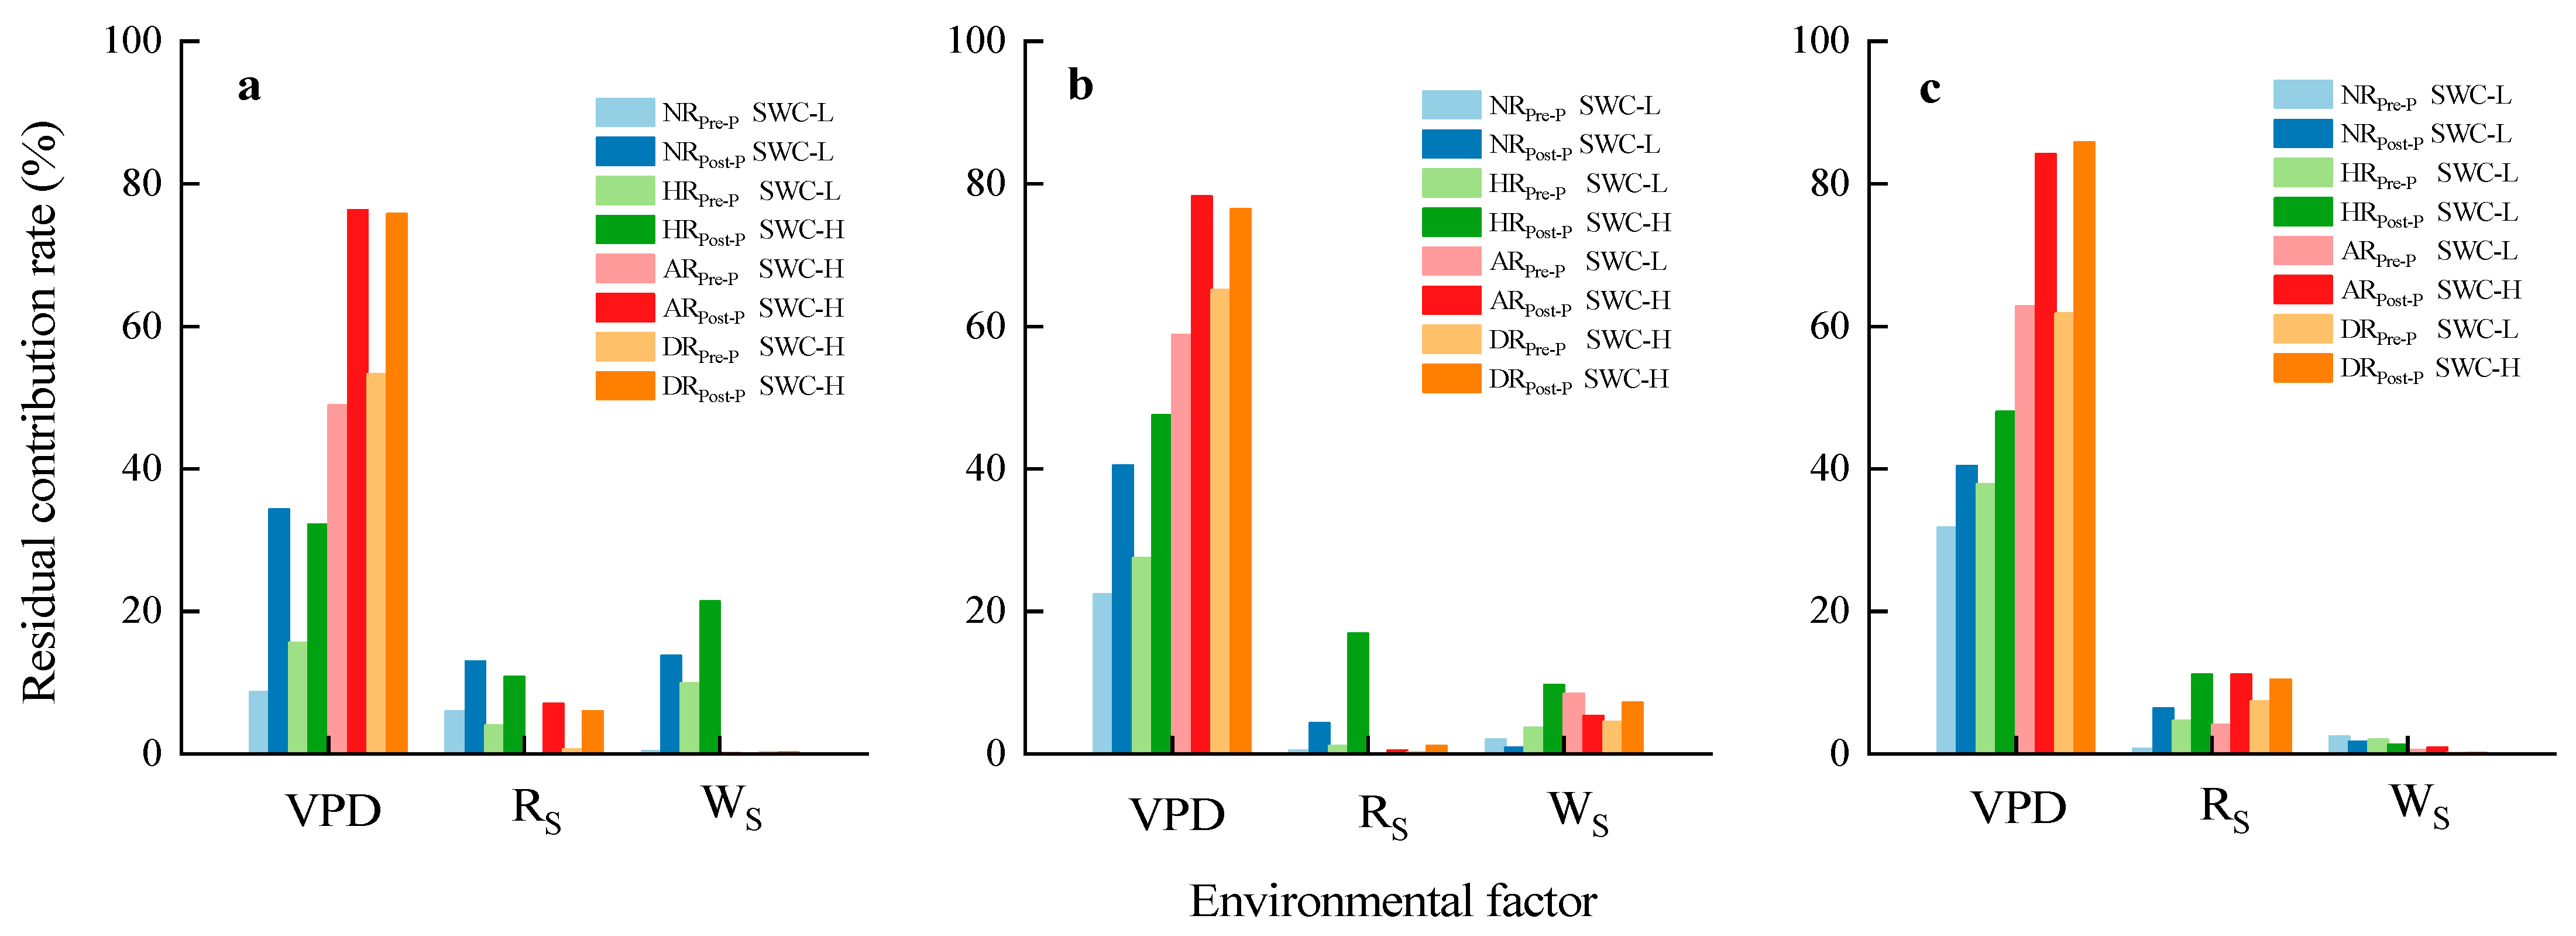
3.4. Response of Sap Flow to Environmental Factors

This study analyzed the environmental factors VPD, RS, and WS. The degree of Q and VPD showed the following trend AR > HR > NR > DR (Figure 9 and Table 2), which is consistent with the performance of the residual contribution rate (Figure 10). RS also followed this same trend. The degree of fitting and contribution rate of Q and WS were low under the four treatments. We found that among the three environmental factors, Q was mainly affected by VPD. The degree was highly significant (p < 0.01). The contribution rate was 40%–74%. Under the four treatments, the response of Q to environmental factors in the AR treatment was the most significant, and VPD had the greatest impact. The degree of Q regulated by environmental factors in the NR and HR treatments was consistent with that in the AR treatment. The response of Q in the DR treatment and its correlation with environmental factors was low.

4. Discussion

4.1. Influence of Precipitation on Sap Flow

This study found that the gradient set by the precipitation treatments significantly impacted the dry sap flow of P. orientalis. The Q of the four treatments showed a trend of AR > DR > HR > NR during the observation period. After reducing precipitation, the Q of P. orientalis was significantly lower than that under natural conditions, which is consistent with previous research results. He et al. [48] conducted an artificial precipitation interception experiment in loess areas to reduce precipitation input. On the daily scale, the sap density of Robinia pseudoacacia in the half-precipitation treatment was significantly lower than that of the control group. Limousin et al. [49] conducted a rain reduction treatment on the holy oak forest. When there was only 70% of the average precipitation, the annual sap flow of the stand decreased by 23%, and the duration of influence covered the entirety of the study period. Besson et al. [36] also found that 80% of the average precipitation led to a 20%–27% decrease in plant canopy transpiration and an 8%–13% decrease in annual stand transpiration after intercepting precipitation in a Quercus variabilis forest in southern Portugal. In addition, a rain enhancement treatment was conducted by Besson et al. during the study period. When the precipitation increased by 20%, the transpiration of the sample trees increased by 14%–63%, and the annual transpiration of the stand increased by 11%.
In a study on the transpiration of P. orientalis from the perspective of total annual transpiration, Liu [43] found that the overall annual transpiration was the largest under the double precipitation treatment. From August to October, the transpiration under natural precipitation was higher than that of the double precipitation treatment, which is consistent with the results of this study. In the dry season, when the precipitation is lower, any amount of precipitation will significantly increase the sap flow. During the rainy season, the overall amount of precipitation is great, so there was less of an impact on the Js, as observed in the DR, which had a lower sap flow than the AR treatment. Theoretically, the sap flow should increase with precipitation because of the increase in the soil water content. For example, previous studies have found that under similar VPD and RS conditions, the sap flow after precipitation was significantly higher than before precipitation [50]. The results from the present study agreed with these results. However, during the growing season with high precipitation, frequent and continuous precipitation increases RH and decreases T, thus reducing VPD. Because sap flow is significantly affected by VPD, the movement of sap flow will be restricted when VPD is low. In irrigation studies on poplar plantations, Zhao et al. found that irrigation can effectively regulate the adaptation of sap flow to environmental factors but increasing irrigation may not necessarily lead to a corresponding increase in transpiration [51].
The SWC of the sample plots under drought conditions was always low. Due to long-term water shortages trees decrease the rate of sap flow to cope with drought stress. In a study on water transport, Liu et al. [52] found that the sap flow of P. orientalis and Quercus variabilis showed the same trend under no water conditions as we found in this study. Brinkmann et al. [53] found that the JS of three temperate plants (Picea obies, Fagus sylvatica, and Acer pseudoplatanus) significantly decreased with the shortage of soil water in the summer when the climate was dry. Zhang et al. [54] studied the stem sap flow of typical plants in exposed bedrock habitats. After two consecutive months of drought treatment, the JS did not decrease significantly. The difference in meteorological factors has little influence on the movement of plant sap flow under natural and drought conditions, which may be due to the short duration of the drought, the water storage environment in the study site, and the relatively stable deep-water sources available to the plant.
In addition to transpiration, most of the water absorbed by plants is also used for xylem water storage to cope with the uncertainty of water available to vegetation in changing environments [22]. The ability of xylem tissues to store water is thought to be part of an evolutionary process that supports overall plant physiological functions under severe drought conditions [7,16]. This study found that compared with the change of sap flow under four precipitation treatments, the water storage of tree trunks had different results. Although the daily sap flow of P. orientalis in the HR treatment was low, its water storage capacity was higher than that of the other treatments (NR, AR, DR) because P. orientalis increased its xylem water storage capacity during drought stress to ensure survival. With the increased storage of nocturnal water, plants have a higher dependence on xylem water, which contributes to plants maintaining their hydraulic support under high transpiration demands. This also helps to relieve the risk of hydraulic failure from xylem cavitation and embolism during drought [55,56,57]. Therefore, trees may use an active adaptive strategy of increasing water storage to avoid water stress. The higher water storage under soil water limitation also partly demonstrates the drought resistance of P. orientalis in seasonally dry areas and relies on the water stored in the xylem at night to survive the dry season.

4.2. Influence of Precipitation Treatments on the Response of Sap Flow to Environmental Factors

Previous studies have shown that sap flow is affected by many factors [58]. It is closely related to meteorological conditions and soil water content [59,60,61]. Especially on a daily scale, RS is the driving force of trunk sap flow. When RS increased, stomata gradually opened. The increase in T and the decrease in RH led to an increase in VPD, which continued to increase the stomatal conductance of leaves [62]. Wind speed can disturb the tree canopy, accelerating the water vapor exchange on the leaf surface, and increasing transpiration and sap flow [63].
Environmental factors significantly regulate the sap flow, while precipitation indirectly affects the sap flow of plants by regulating soil water content; this also affects the relationship between P. orientalis and environmental factors [30,64,65]. In this study, the three precipitation events on 14 September (f), 19 August (c), and 19 September (g) had total rainfall amounts of 8.2 mm, 20.2 mm, and 45.2 mm, respectively, divided into light rain, moderate rain, and heavy rain. Figure 11 shows that the SWC of the sample plots of the first two precipitation events did not rise significantly. The SWC of the third precipitation event increased significantly after rain. Most treatments were in the SWC-L period before the rain and the SWC-H period after the rain.
Figure 12 shows the rate of contribution of each environmental factor to JS, and the overall performance is similar to Figure 10. Before and after precipitation, the rate of contribution of VPD to JS accounted for most environmental factors, and the rate of contribution of RS and WS was low. Combined with the REW of water control treatment sample plots before and after precipitation, our results showed that since the SWC of the AR and DR treatments was higher than that of NR and HR treatments, the AR and DR treatments were mainly in the SWC-H. The rate of contribution of VPD to the AR and DR treatments was generally higher than that of NR and HR treatments. After a precipitation event, with the increase in SWC, the rate of contribution also increased. In the f, c, and g precipitation events, the difference in the rate of contribution mainly depends on the magnitude of REW. It does not show that the rate of contribution increases in a gradient manner with precipitation. Due to the low rate of contribution of RS and WS, the difference between pre-precipitation and post-precipitation and different treatments did not show regularities. VPD significantly affected each treatment JS before and after rainfall (Table 3). However, the degree of response of JS to RS was not significant before precipitation, and the increase was highly significant after precipitation.
Among environmental factors, sap flow is primarily regulated by VPD. Due to the difference in REW, the degree of response of sap flow to VPD before and after precipitation is different. The sap flow response is more rapid with the increase or decrease in VPD after precipitation because the SWC in the SWC-H is more abundant than in the SWC-L. The water conductivity of trees increased; the water absorption resistance of roots decreased; the photosynthesis and transpiration increased; the sensitivity of P. orientalis to environmental factors increased. Previous studies have shown that when SWC was high, transpiration and VPD were highly coupled [66]. Gessler found that the correlation between beech and VPD decreased during drought, which was mainly regulated by soil water content [67]. Xia et al. [30] found that transpiration in Cinnamomum camphora was inhibited during the SWC-L. When the SWC-H after a precipitation event, Cinnamomum camphora was more susceptible to regulating VPD, RS, WS, and other factors. The research of Lv [64] and Wang [65] also has findings similar to this study. When the SWC was improved due to precipitation events, the response of sap flow to environmental factors also increased.

4.3. Water Resources

We found that the change in sap flow and water use of P. orientalis were integrated. When subjected to drought stress, trees preferentially reduced the sap flow rate, reduced transpiration water consumption, relied more on the water replenishment effect of the xylem, and adjusted the source of water absorption. When the water available for plants to absorb was sufficient, the sap flow rate increased. The regulation of sap flow by environmental factors will be increased when SWC was sufficient, and the water source utilized by the plant also changed. The water source utilized by trees changed regularly with the precipitation gradient (Figure 13). Trees in the NR treatment mainly used soil water and groundwater from 60–100 cm. The utilization ratio of soil water from the 40–100 cm soil layer and underground water of trees in the HR and AR treatments decreased, and the ratio of water used in the 0–40 cm soil water increased. With the increase in precipitation, the water source used by trees in the DR treatment was mainly from the 0–40 cm soil layer, and trees in the DR treatment also used water from the 40–100 cm soil layer and groundwater. Liu’s research [44] found that P. orientalis mostly used water in deep soil under drought conditions. With the increase in SWC, the water source gradually changed to shallow soil, and P. orientalis primarily uses groundwater (30.5%) and soil water (21.6%) from the 60–100 cm soil layer. However, P. orientalis is susceptible to precipitation in the rainy season, and it is easy to absorb water from the 0–20 cm soil layer (26.6%). Zhao et al. [68] also found that the depth of water use of P. orientalis in the rainy season gradually deepened with the increased duration of the drought period. Comparing the water sources of P. orientalis before and after precipitation, we found no noticeable change in the rate of contribution of soil at different depths, except for with the NR treatment. The utilization ratio of water from the 0–40 cm soil layer increased after rainfall in other treatments. This change is more evident in the high SWC of AR and DR treatments after rainfall. When the soil water deficit occurs, the trunk sap flow density of P. orientalis generally decreased and then gradually stabilized because trees will primarily use xylem water and deeper soil water and groundwater when they encounter drought stress conditions.

5. Conclusions

In the mountainous area of northern China, which has frequent precipitation in the middle of the growing season, we controlled the precipitation in a P. orientalis plantation to study its sap flow. P. orientalis had noticeable differences in the different water treatment conditions, with QNR (3.98 kg/d) < QHR (7.68 kg/d) < QDR (10.99 kg/d) < QAR (11.93 kg/d), indicating that the sap flow decreases with the decrease in precipitation, but doubling the precipitation does not significantly improve the sap flow. The percentage of sap flow was NQAR (13.34%) < NQNR (19.62%) < NQDR (20.84%) < NQHR (30.90%) and water storage at night was WSNR (4.13%) < WSAR (4.49%) < WSDR (6.75%) < WSHR (9.29%). P. orientalis can survive drought stress conditions by using the water stored in the xylem through nighttime sap flow. However, the percentage of sap flow and water storage of P. orientalis at night is the highest when the rainfall is reduced by half, which indicates that it does not change with rainfall conditions.
The sap flow of P. orientalis was less affected by wind speed and was primarily affected by VPD and RS. The degree of influence and correlation of VPD and RS on tree sap flow were DR < NR < HR < AR, respectively. The degree of response of P. orientalis sap flow to environmental factors differed due to the soil changes relative to REW before and after precipitation. In the period of high REW, environmental factors have a greater impact on sap flow.
The water absorption source of P. orientalis changed regularly with the precipitation gradient. When SWC changes regularly with precipitation from low to high, the water source used by P. orientalis gradually changes to shallow soil. The primary water source for the NR treatment was from deep soil water and groundwater, possibly because P. orientalis faced a long period of drought, which changed its root distribution so that trees can make more use of deep-water sources to reduce the dependence on the transpiration of water stored in stems. Compared to before and after precipitation, there was no significant change in the water source except for NR. Other treatments increased the utilization of water from the 0–40 cm soil layer after rainfall. This change was more pronounced when the REW of AR and DR was higher after rainfall.
In conclusion, according to precipitation and soil moisture changes, P. orientalis could regularly adjust the activities of transpiration water consumption, water storage, and absorption. This self-adaptive characteristic is beneficial for it to survive extreme drought stress and improves its chances for survival.

Supplementary Materials

The following supporting information can be downloaded at: https://www.mdpi.com/article/10.3390/f13111761/s1, Figure S1: Isotopic composition of different water sources before and after rainfall; Table S1: Conditions of the study plot; Table S2: Precipitation event information; Method S1: Spectral pollution identification and correction.

Author Contributions

Writing—original draft preparation, X.Z.; writing—review and editing, G.J.; project administration, X.Y.; data curation, X.Z., B.D. and Z.L. All authors have read and agreed to the published version of the manuscript.

Funding

This research was funded by the National Natural Science Foundation of China (41977149, 42277062).

Data Availability Statement

Data are contained within the article.

Acknowledgments

The authors are grateful to Liu Rui, Zhang Longqi and Lv Xiangrong for collecting and organizing the original data. We are also thankful to Lei Ziran, Liu Ziqi and Liu Zihe for the software assistance.

Conflicts of Interest

The authors declare no conflict of interest.

References

  1. Xiong, Y.J.; Zhao, S.H.; Tian, F.; Qiu, G.Y. An Evapotranspiration Product for Arid Regions Based on the Three-Temperature Model and Thermal Remote Sensing. J. Hydrol. 2015, 530, 392–404. [Google Scholar] [CrossRef]
  2. McCabe, M.F.; Wood, E.F. Scale Influences on the Remote Estimation of Evapotranspiration Using Multiple Satellite Sensors. Remote Sens. Environ. 2006, 105, 271–285. [Google Scholar] [CrossRef]
  3. Zhang, Y.; Kong, D.; Zhang, X.; Tian, J.; Li, C. Impacts of Vegetation Changes on Global Evapotranspiration in the Period 2003–2017. Acta Geogr. Sin. 2021, 76, 584–594. [Google Scholar] [CrossRef]
  4. Zhang, J.G.; He, Q.Y.; Shi, W.Y.; Otsuki, K.; Yamanaka, N.; Du, S. Radial Variations in Xylem Sap Flow and Their Effect on Whole-tree Water Use Estimates. Hydrol. Process. 2016, 29, 4993–5002. [Google Scholar] [CrossRef]
  5. Di, N.; Xi, B.; Clothier, B.; Wang, Y.; Li, G.; Jia, L. Diurnal and Nocturnal Transpiration Behaviors and Their Responses to Groundwater-Table Fluctuations and Meteorological Factors of Populus Tomentosa in the North China Plain. For. Ecol. Manag. 2019, 448, 445–456. [Google Scholar] [CrossRef]
  6. Jasechko, S.; Sharp, Z.D.; Gibson, J.J.; Birks, S.J.; Yi, Y.; Fawcett, P.J. Terrestrial Water Fluxes Dominated by Transpiration. Nature 2013, 496, 347–350. [Google Scholar] [CrossRef]
  7. Wang, H.; Zhao, P.; Wang, Q.; Cai, X.; Ma, L.; Rao, X.; Zeng, X. Nocturnal Sap Flow Characteristics and Stem Water Recharge of Acacia Mangium. Front. For. China 2008, 3, 72–78. [Google Scholar] [CrossRef]
  8. Hubbart, J.A.; Kavanagh, K.L.; Pangle, R.; Link, T.; Schotzko, A. Cold Air Drainage and Modeled Nocturnal Leaf Water Potential in Complex Forested Terrain. Tree Physiol. 2007, 27, 631–639. [Google Scholar] [CrossRef] [Green Version]
  9. Poyatos, R.; Granda, V.; Flo, V.; Adams, M.A.; Adorjan, B.; Aguade, D.; Aidar, M.P.M.; Allen, S.; Susana Alvarado-Barrientos, M.; Anderson-Teixeira, K.J.; et al. Global Transpiration Data from Sap Flow Measurements: The SAPFLUXNET Database. Earth Syst. Sci. Data 2021, 13, 2607–2649. [Google Scholar] [CrossRef]
  10. Gartner, K.; Nadezhdina, N.; Englisch, M.; Cermak, J.; Leitgeb, E. Sap Flow of Birch and Norway Spruce during the European Heat and Drought in Summer 2003. For. Ecol. Manag. 2009, 258, 590–599. [Google Scholar] [CrossRef]
  11. Zeppel, M.J.B.; Lewis, J.D.; Phillips, N.G.; Tissue, D.T. Consequences of Nocturnal Water Loss: A Synthesis of Regulating Factors and Implications for Capacitance, Embolism and Use in Models. Tree Physiol. 2014, 34, 1047–1055. [Google Scholar] [CrossRef] [PubMed] [Green Version]
  12. Zhang, H.; Levia, D.F.; He, B.; Wu, H.; Fu, C. Interspecific Variation in Tree- and Stand-Scale Stemflow Funneling Ratios in a Subtropical Deciduous Forest in Eastern China. J. Hydrol. 2020, 590. [Google Scholar] [CrossRef]
  13. Benyon, R.G. Nighttime Water Use in an Irrigated Eucalyptus Grandis Plantation. Tree Physiol. 1999, 19, 853–859. [Google Scholar] [CrossRef] [PubMed]
  14. Dawson, T.E.; Burgess, S.S.O.; Tu, K.P.; Oliveira, R.S.; Santiago, L.S.; Fisher, J.B.; Simonin, K.A.; Ambrose, A.R. Nighttime Transpiration in Woody Plants from Contrasting Ecosystems. Tree Physiol. 2007, 27, 561–575. [Google Scholar] [CrossRef] [Green Version]
  15. Forster, M.A. How Significant Is Nocturnal Sap Flow? Tree Physiol. 2014, 34, 757–765. [Google Scholar] [CrossRef] [Green Version]
  16. Wang, H.; Zhao, P.; Cai, X.; ma, L.; Rao, X.; Zeng, X.; Wang, Q. Partition of Nocturnal Sap Flow in Acacia Mangium and Its Implication for Estimating the Whole-Tree Transpiration. Front. For. China 2009, 4, 191–200. [Google Scholar] [CrossRef]
  17. Siddiq, Z.; Chen, Y.-J.; Zhang, Y.-J.; Zhang, J.-L.; Cao, K.-F. More Sensitive Response of Crown Conductance to VPD and Larger Water Consumption in Tropical Evergreen than in Deciduous Broadleaf Timber Trees. Agric. For. Meteorol. 2017, 247, 399–407. [Google Scholar] [CrossRef]
  18. Bucci, S.J.; Scholz, F.G.; Goldstein, G.; Meinzer, F.C.; Hinojosa, J.A.; Hoffmann, W.A.; Franco, A.C. Processes Preventing Nocturnal Equilibration between Leaf and Soil Water Potential in Tropical Savanna Woody Species. Tree Physiol. 2004, 24, 1119–1127. [Google Scholar] [CrossRef]
  19. Tie, Q.; Hu, H.; Tian, F.; Guan, H.; Lin, H. Environmental and Physiological Controls on Sap Flow in a Subhumid Mountainous Catchment in North China. Agric. For. Meteorol. 2017, 240–241, 46–57. [Google Scholar] [CrossRef]
  20. Resco de Dios, V.; Loik, M.E.; Smith, R.; Aspinwall, M.J.; Tissue, D.T. Genetic Variation in Circadian Regulation of Nocturnal Stomatal Conductance Enhances Carbon Assimilation and Growth. Plant Cell Environ. 2016, 39, 3–11. [Google Scholar] [CrossRef]
  21. Chen, Z.; Zhang, Z.; Sun, G.; Chen, L.; Xu, H.; Chen, S. Biophysical Controls on Nocturnal Sap Flow in Plantation Forests in a Semiarid Region of Northern China. Agric. For. Meteorol. 2020, 284, 107904. [Google Scholar] [CrossRef]
  22. Liu, Z.; Liu, Q.; Wei, Z.; Yu, X.; Jia, G.; Jiang, J. Partitioning Tree Water Usage into Storage and Transpiration in a Mixed Forest. For. Ecosyst. 2021, 8, 72. [Google Scholar] [CrossRef]
  23. McCormick, E.L.; Dralle, D.N.; Hahm, W.J.; Tune, A.K.; Schmidt, L.M.; Chadwick, K.D.; Rempe, D.M. Widespread Woody Plant Use of Water Stored in Bedrock. Nature 2021, 597, 225–229. [Google Scholar] [CrossRef]
  24. Zhou, H.; Zhao, W.; Zheng, X.; Li, S. Root Distribution of Nitraria Sibirica with Seasonally Varying Water Sources in a Desert Habitat. J. Plant Res. 2015, 128, 613–622. [Google Scholar] [CrossRef] [PubMed]
  25. Guerrieri, R.; Belmecheri, S.; Ollinger, S.V.; Asbjornsen, H.; Jennings, K.; Xiao, J.; Stocker, B.D.; Martin, M.; Hollinger, D.Y.; Bracho-Garrillo, R.; et al. Disentangling the Role of Photosynthesis and Stomatal Conductance on Rising Forest Water-Use Efficiency. Proc. Natl. Acad. Sci. USA 2019, 116, 16909–16914. [Google Scholar] [CrossRef] [Green Version]
  26. Chen, S.; Lin, G.; Huang, J.; Jenerette, G.D. Dependence of Carbon Sequestration on the Differential Responses of Ecosystem Photosynthesis and Respiration to Rain Pulses in a Semiarid Steppe. Glob. Change Biol. 2009, 15, 2450–2461. [Google Scholar] [CrossRef]
  27. Zhao, C.Y.; Si, J.H.; Feng, Q.; Yu, T.F.; Li, P.D. Comparative Study of Daytime and Nighttime Sap Flow of Populus Euphratica. Plant Growth Regul. 2017, 82, 353–362. [Google Scholar] [CrossRef]
  28. Li, S.; Lu, S.; Zhao, Y.; Zhao, N.; Chen, B. Characteristics and Influencing Factors in Sap Flow of Four Broadleaved Tree Species for Typical Weather Conditions of Beijing. J. Ecol. Rural. Environ. 2019, 35, 189–196. [Google Scholar] [CrossRef]
  29. Zhang, X.; Zhang, H.; Wang, Y.; Wang, Y.; Liu, C.; Yang, P.; Pan, S. Characteristics of daily sap flow for typical species in Jinyun Mountain of Chongqing in relation to meteorological factors. J. Beijing For. Univ. 2016, 38, 11–20. [Google Scholar] [CrossRef]
  30. Xia, Y.; Zhang, X.; Dai, J.; Wang, Y.; Luo, Z. Response of Stem Sap Flow of Cinnamomum camphora to Precipitation Under Different Environments in the Subtropical Monsoon Region. Res. Soil Water Conserv. 2021, 28, 144–152. [Google Scholar] [CrossRef]
  31. Ivans, S.; Hipps, L.; Leffler, A.J.; Ivans, C.Y. Response of Water Vapor and CO2 Fluxes in Semiarid Lands to Seasonal and Intermittent Precipitation Pulses. J. Hydrometeorol. 2006, 7, 995–1010. [Google Scholar] [CrossRef]
  32. Zhao, W.; Liu, B. The Response of Sap Flow in Shrubs to Rainfall Pulses in the Desert Region of China. Agric. For. Meteorol. 2010, 150, 1297–1306. [Google Scholar] [CrossRef]
  33. Fravolini, A.; Hultine, K.R.; Brugnoli, E.; Gazal, R.; English, N.B.; Williams, D.G. Precipitation Pulse Use by an Invasive Woody Legume: The Role of Soil Texture and Pulse Size. Oecologia 2005, 144, 618–627. [Google Scholar] [CrossRef] [PubMed]
  34. Knapp, A.K.; Briggs, J.M.; Collins, S.L.; Archer, S.R.; Bret-Harte, M.S.; Ewers, B.E.; Peters, D.P.; Young, D.R.; Shaver, G.R.; Pendall, E. Shrub Encroachment in North American Grasslands: Shifts in Growth Form Dominance Rapidly Alters Control of Ecosystem Carbon Inputs. Glob. Change Biol. 2010, 14, 615–623. [Google Scholar] [CrossRef]
  35. Wightman, M.G.; Martin, T.A.; Gonzalez-Benecke, C.A.; Jokela, E.J.; Cropper, W.P.; Ward, E.J. Loblolly Pine Productivity and Water Relations in Response to Throughfall Reduction and Fertilizer Application on a Poorly Drained Site in Northern Florida. Forests 2016, 7, 214. [Google Scholar] [CrossRef] [Green Version]
  36. Besson, C.K.; Lobo-do-Vale, R.; Rodrigues, M.L.; Almeida, P.; Herd, A.; Grant, O.M.; David, T.S.; Schmidt, M.; Otieno, D.; Keenan, T.F.; et al. Cork Oak Physiological Responses to Manipulated Water Availability in a Mediterranean Woodland. Agric. For. Meteorol. 2014, 184, 230–242. [Google Scholar] [CrossRef]
  37. Porporato, A.; Daly, E.; Rodriguez-Iturbe, I. Soil Water Balance and Ecosystem Response to Climate Change. Am. Nat. 2004, 164, 625. [Google Scholar] [CrossRef]
  38. Ehleringer, W.J.R. Intra- and Interspecific Variation for Summer Precipitation Use in Pinyon-Juniper Woodlands. Ecol. Monogr. 2000, 70, 517–537. [Google Scholar] [CrossRef]
  39. Jackson, P.C.; Cavelier, J.; Goldstein, G.; Meinzer, F.C.; Holbrook, N.M. Partitioning of Water Resources among Plants of a Lowland Tropical Forest. Oecologia 1995, 101, 197–203. [Google Scholar] [CrossRef]
  40. Meinzer, F.C.; Andrade, J.L.; Goldstein, G.; Holbrook, N.M.; Wright, J. Caveliers.J. Partitioning of Soil Water among Canopy Trees in a Seasonally Dry Tropical Forest. Oecologia 1999, 121, 293–301. [Google Scholar] [CrossRef]
  41. Schwendenmann, L.; Pendall, E.; Sanchez-Bragado, R.; Kunert, N.; Hölscher, D. Tree Water Uptake in a Tropical Plantation Varying in Tree Diversity: Interspecific Differences, Seasonal Shifts and Complementarity. Ecohydrology 2014, 8, 1–12. [Google Scholar] [CrossRef]
  42. Wang, X.; Jia, G.; Deng, W.; Liu, Z.; Liu, Z.; Que, G.; Li, L. Long-term Water Use Characteristics and Patterns of Typical Tree Species in Seasonal Drought Regions. Chin. J. Appl. Ecol. 2021, 32, 1943–1950. [Google Scholar] [CrossRef]
  43. Liu, W.; Jia, G. Studies of Platycladus orientalis Stomatal Conductance and Its Regulation on Canopy Transpiration in Beijng Mountainous Area. Master’s Thesis, Beijing Forestry University, Beijing, China, 2019. [Google Scholar]
  44. Liu, Z.; Yu, X.; Jia, G.; Li, H.; Lu, W.; Hou, G. Response to Precipitation in Water Sources for Platycladus orientalis in Beijing Mountatin Area. Sci. Silvae Sin. 2018, 54, 16–23. [Google Scholar] [CrossRef]
  45. Tognetti, R.; Giovannelli, A.; Lavini, A.; Morelli, G.; Fragnito, F.; d’Andria, R. Assessing Environmental Controls over Conductances through the Soil–Plant–Atmosphere Continuum in an Experimental Olive Tree Plantation of Southern Italy. Agric. For. Meteorol. 2009, 149, 1229–1243. [Google Scholar] [CrossRef]
  46. Martín-Gómez, P.; Barbeta, A.; Voltas, J.; Peñuelas, J.; Dennis, K.; Palacio, S.; Dawson, T.E.; Ferrio, J.P. Isotope-Ratio Infrared Spectroscopy: A Reliable Tool for the Investigation of Plant-Water Sources? New Phytol. 2015, 207, 914–927. [Google Scholar] [CrossRef] [PubMed] [Green Version]
  47. Schultz, N.M.; Griffis, T.J.; Lee, X.; Baker, J.M. Identification and Correction of Spectral Contamination in 2H/1H and 18O/16O Measured in Leaf, Stem, and Soil Water. Rapid Commun. Mass Spectrom. 2011, 25, 3360–3368. [Google Scholar] [CrossRef]
  48. He, Q.-Y.; Yan, M.-J.; Miyazawa, Y.; Chen, Q.-W.; Cheng, R.-R.; Otsuki, K.; Yamanaka, N.; Du, S. Sap Flow Changes and Climatic Responses over Multiple-Year Treatment of Rainfall Exclusion in a Sub-Humid Black Locust Plantation. For. Ecol. Manag. 2020, 457, 117730. [Google Scholar] [CrossRef]
  49. Limousin, J.M.; Rambal, S.; Ourcival, J.M.; Rocheteau, A.; Joffre, R.; Rodriguez-Cortina, R. Long-Term Transpiration Change with Rainfall Decline in a Mediterranean Quercus Ilex Forest. Glob. Change Biol. 2009. [Google Scholar] [CrossRef]
  50. Wu, X.; Chen, Y.; Tang, Y. Sap flow characteristics and its responses to precipitation in Robinia pseudoacacia and Platycladus orientalis plantations. Chin. J. Plant Ecol. 2015, 39, 1176–1187. [Google Scholar] [CrossRef] [Green Version]
  51. Zhao, W.-Q.; Xi, B.-Y.; Liu, J.-Q.; Liu, Y.; Zou, S.-Y.; Song, W.-Y.; Chen, L.-X. Transpiration Process and Environmental Response of Poplar Plantation under Different Irrigation Condition. Chin. J. Plant Ecol. 2021, 45, 370–382. [Google Scholar] [CrossRef]
  52. Liu, Z.; Yu, X. Water Migration Process and Utilization Mechanism of Typcial Trees in North China. Ph.D. Thesis, Beijing Forestry University, Beijing, China, 2019. [Google Scholar]
  53. Brinkmann, N.; Eugster, W.; Zweifel, R.; Buchmann, N.; Kahmen, A. Temperate Tree Species Show Identical Response in Tree Water Deficit but Different Sensitivities in Sap Flow to Summer Soil Drying. Tree Physiol. 2016, 36, 1508–1519. [Google Scholar] [CrossRef] [PubMed] [Green Version]
  54. Zhang, H.; Ding, Y.; Chen, H.; Wang, K.; Nie, Y. Responses of Sap Flow to Natural Rainfall and Continuous Drought of Tree Species Growing on Bedrock Outcrops. Chin. J. Appl. Ecol. 2018, 29, 1117–1124. [Google Scholar] [CrossRef]
  55. Meinzer, F.C.; Johnson, D.M.; Lachenbruch, B.; McCulloh, K.A.; Woodruff, D.R. Xylem Hydraulic Safety Margins in Woody Plants: Coordination of Stomatal Control of Xylem Tension with Hydraulic Capacitance. Funct. Ecol. 2009, 23, 922–930. [Google Scholar] [CrossRef]
  56. Yi, K.; Dragoni, D.; Phillips, R.P.; Roman, D.T.; Novick, K.A. Dynamics of Stem Water Uptake among Isohydric and Anisohydric Species Experiencing a Severe Drought. Tree Physiol. 2017, 37, 1393. [Google Scholar] [CrossRef] [PubMed] [Green Version]
  57. Mcculloh, K.A.; Johnson, D.M.; Meinzer, F.C.; Woodruff, D.R. The Dynamic Pipeline: Hydraulic Capacitance and Xylem Hydraulic Safety in Four Tall Conifer Species. Plant Cell Environ. 2014, 37, 1171–1183. [Google Scholar] [CrossRef] [PubMed] [Green Version]
  58. Green, S.R. Radiation Balance, Transpiration and Photosynthesis of an Isolated Tree. Agric. For. Meteorol. 1993, 64, 201–221. [Google Scholar] [CrossRef]
  59. Bosch, D.D.; Marshall, L.K.; Teskey, R. Forest Transpiration from Sap Flux Density Measurements in a Southeastern Coastal Plain Riparian Buffer System. Agric. For. Meteorol. 2014, 187, 72–82. [Google Scholar] [CrossRef]
  60. Chen, D.; Wang, Y.; Liu, S.; Wei, X.; Wang, X. Response of Relative Sap Flow to Meteorological Factors under Different Soil Moisture Conditions in Rainfed Jujube (Ziziphus Jujuba Mill.) Plantations in Semiarid Northwest China. Agric. Water Manag. 2014, 136, 23–33. [Google Scholar] [CrossRef]
  61. Ma, C.; Luo, Y.; Shao, M.; Li, X.; Sun, L.; Jia, X. Environmental Controls on Sap Flow in Black Locust Forest in Loess Plateau, China. Sci. Rep. 2017, 7, 13160. [Google Scholar] [CrossRef] [Green Version]
  62. Wei, X.; Fu, S.; Chen, D.; Zheng, S.; Wang, T.; Bai, Y. Grapevine Sap Flow in Response to Physio-Environmental Factors under Solar Greenhouse Conditions. Water 2020, 12, 3081. [Google Scholar] [CrossRef]
  63. Fan, B.; Liu, Z.; Xiong, K.; Li, Y.; Li, K.; Yu, X. Influence of Environmental Factors on the Sap Flow Activity of the Golden Pear in the Growth Period of Karst Area in Southern China. Water 2022, 14, 1707. [Google Scholar] [CrossRef]
  64. Lv, J.; He, Q.; Yan, M.-J.; li, G.; Du, S. Sap Flow Characteristics of Quercus liaotungensis in Response to Sapwood Area and Soil Moisture in the Loess Hilly Region, China. Chin. J. Appl. Ecol. 2018, 29, 725–731. [Google Scholar] [CrossRef]
  65. Wang, Y.; Wei, J.; Zhou, M.; Zhao, P.; Liu, B. Response of Sap Flow of Betula platyphylla to Soil Moisture in Southern Greater Xing’an Mountains. Res. Soil Water Conserv. 2020, 27, 128–133. [Google Scholar] [CrossRef]
  66. Granier, A.; Biron, P.; Lemoine, D. Water Balance, Transpiration and Canopy Conductance in Two Beech Stands. Agric. For. Meteorol. 2000, 100, 291–308. [Google Scholar] [CrossRef]
  67. Gessler, A.; Bächli, L.; Freund, E.R.; Treydte, K.; Schaub, M.; Haeni, M.; Weiler, M.; Seeger, S.; Marshall, J.; Hug, C.; et al. Drought Reduces Water Uptake in Beech from the Drying Topsoil, but No Compensatory Uptake Occurs from Deeper Soil Layers. New Phytol. 2022, 233, 194–206. [Google Scholar] [CrossRef]
  68. Zhao, N.; Meng, P.; He, Y.; Lou, Y.; Yu, X. Response of Water Sources in Platycladus orientalis and Vitex negundo var. Heterophylla System to Precipitation Events in Mountain Area of Beijing, China. Chin. J. Appl. Ecol. 2017, 28, 2155–2163. [Google Scholar] [CrossRef]
Figure 1. The overview of the study area. (a) Beijing mountainous area; (b) North China; (c) Beijing municipality.
Forests 13 01761 g001
Figure 2. Experimental design. It is a combination of different treatments. The actual test treatments are randomly distributed in the sample plot.
Forests 13 01761 g002
Figure 3. (a) Precipitation (P) and soil water content (SWC) in 2021; (b) precipitation (P) and soil water content (SWC) of four treatments in the rainy season (1 August–30 September) of 2021; (c) air temperature (T) and solar radiation (RS) during the observation period; (d) wind speed (WS) and vapor pressure deficit (VPD) during observation. The values of SWC are the means of measurement at soil depths of 10, 30, 50, 70, and 90 cm over the study site. Note: data from 8 April to 25 April is missing for 2021.
Forests 13 01761 g003
Figure 4. Cross-correlation (r) between mean sap flow (JS), solar radiation (RS), and vapor pressure deficit (VPD). The maximum for each curve is retained as the time lag for the time series pair. (a) DR treatment; (b) HR treatment; (c) AR treatment; (d) DR treatment. The red arrow is max correlation coeffcient.
Forests 13 01761 g004
Figure 5. Relative relationships of the peak time lag between sap flow (JS)and meteorological variables during typical sunny days. The sap flow (JS) of four treatments area are NR treatment (NR), HR treatment (HR), AR treatment (AR), and DR treatment (DR). The meteorological variables are solar radiation (RS), and vapor pressure deficit (VPD).
Forests 13 01761 g005
Figure 6. Variation of daily sap flow (Q), nocturnal sap flow percentage (NQ), water storage percentage (WS), and precipitation (P) under the four treatments. (a) NR treatment. (b) HR treatment. (c) AR treatment. (d) DR treatment.
Forests 13 01761 g006
Figure 7. The average values of daytime sap flow (QD), nocturnal sap flow (QN), and water storage (QS) were under different treatments before and after seven precipitation events. (a) 8.09. (b) 14 August. (c) 19 August. (d) 23 August. (e) 4 September. (f) 14 September. (g) 19 September. The daytime sap flow (QD), before and after precipitation events are Daytime(Pre-P) and Daytime(Post-P); the nocturnal sap flow (QN) before and after precipitation events are Nighttime(Pre-P) and Nighttime(Post-P); the water storage (QS) before and after precipit-ation events are Storage(Pre-P) and Storage(Post-P).
Forests 13 01761 g007
Figure 8. Diurnal variation of NR treatment sap flow (NR), HR treatment sap flow (HR), AR treatment sap flow (AR), DR treatment sap flow (DR), precipitation (P), air temperature (T), solar radiation (RS), wind speed (WS) and vapor pressure deficit (VPD).
Forests 13 01761 g008
Figure 9. Linear regression showing the relationship between Q and environmental factors impacting the growth of P. orientalis during the observation period. The regresssion line of four treatments area are NR treatment (NR), HR treatment (HR), AR treatment (AR), and DR treatment (DR). (a) Vapor pressure deficit (VPD). (b) Solar radiation (RS). (c) Wind speed (WS).
Forests 13 01761 g009
Figure 10. The contribution rate of the residual error between the Q and environmental factors impacting the growth of P. orientalis during the observation period. The contribution rate of four treatments area are NR treatment (NR), HR treatment (HR), AR treatment (AR), and DR treatment (DR).
Forests 13 01761 g010
Figure 11. Changes in soil water content before and after three precipitation events. (a), Precipitation event on 14 September. (b), Precipitation event on 19 August. (c), Precipitation event on 19 September.
Forests 13 01761 g011
Figure 12. Results of sap flow density and environmental factors of P. orientalis under four water control treatments before and after three rainfall events. (a), Precipitation event on September 14. (b), Precipitation event on August 19. (c), Precipitation event on September 19.
Forests 13 01761 g012
Figure 13. The contribution rate of different water sources to the water use of P. orientalis before and after the rainfall event on 4 September.
Forests 13 01761 g013
Table 1. Determination of sample wood information of P. orientalis by sap flow.
HandleSample Tree DBH
(cm)
Sapwood Area
(cm2)
Heartwood Diameter
(cm)
Mean Sapwood Area (cm2)Tree Height
(m)
Average Tree Height
(m)
NR112.69175.951.45197.2716.9416.08
213.19190.811.7816.46
314.27225.061.9314.85
HR413.85211.391.51195.3613.4516.95
513.12188.691.8419.26
613.03185.991.6418.14
AR712.97184.191.58194.4814.2215.36
814.01216.552.0316.31
912.92182.711.8515.56
DR1012.39167.341.83197.5615.7617.25
1113.93213.961.9218.43
1213.85211.391.5917.57
NR, no precipitation treatment; HR, half precipitation treatment; AR, natural precipitation treatment; DR, double precipitation treatment.
Table 2. Fitted results of daily Q and environmental factors of P. orientalis.
Environmental FactorExperimental TreatmentFitting EquationR2Pearson’s rpSignificance
VPDNRy = 1.94 + 4.27x0.472320.687 **0***
HRy = 4.95 + 5.72x0.522480.723 **0***
ARy = 6.18 + 11.60x0.749470.866 **0***
DRy = 7.51 + 7.29x0.172630.415 **0.0014**
RSNRy = 0.11 + 0.02x0.457230.684 **0.0639.
HRy = 1.47 + 0.04x0.735270.860 **0***
ARy = 0.16x + 0.07x0.893080.946 **0***
DRy = 5.21x + 0.03x0.113330.361 **0.9105
WSNRy = 1.00 + 9.05x0.34380.55170.322
HRy = 4.49 + 9.66x0.21410.46270.4298
ARy = 3.77 + 24.19x0.56630.68290.0088**
DRy = 3.31 + 23.32x0.25340.50340.0192*
‘***’ and ‘**’ are extremely significant; ‘*’ is significant; ‘.’, ‘ ’ are Not significant.
Table 3. Effects of environmental factors on sap flow density of P. orientalis under four treatments before and after three rainfall events.
Precipitation EventsEnvironmental FactorsTreatmentPre-PrecipitationPost-Precipitation
pSignificancepSignificance
fVPDNR0.0285*0***
HR0.0017**0***
AR0***0***
DR0***0***
RSNR0.0653.0.0002***
HR0.0994.0.0003***
AR0.7257 0.0066**
DR0.2679 0.0089**
WSNR0.6408 0.0001***
HR0.0108*0***
AR0.7072 0.6837
DR0.5847 0.4773
cVPDNR0***0***
HR0***0***
AR0***0***
DR0***0***
RSNR0.5364 0.0003***
HR0.3708 0***
AR0.8739 0.2284
DR0.5717 0.064.
WSNR0.2109 0.0793.
HR0.103 0.0001***
AR0.0007***0.0002***
DR0.016*0***
gVPDNR0.0001***0***
HR0.0012**0***
AR0***0***
DR0***0***
RSNR0.4836 0***
HR0.0854.0***
AR0.0153*0***
DR0.0011**0***
WSNR0.2001 0.104
HR0.2577 0.2149
AR0.3921 0.1252
DR0.6064 0.5845
‘***’ and ‘**’ are extremely significant; ‘*’ is significant; ‘.’, ‘ ’ are Not significant.
Publisher’s Note: MDPI stays neutral with regard to jurisdictional claims in published maps and institutional affiliations.

