Abstract
(1) Background: Oaks have achieved notoriety for sufficient levels of sympatric species richness allowing hybridization, thus generating substantial phenotypic variation. Leaf fluctuation asymmetry is an important attribute, as it reflects not only genetic variability but also species buffering capacity. (2) Methods: We investigated the phenotypic diversity of four-oak species (Quercus acutissima, Q. variabilis, Q. fabri, and Q. serrata var. brevipetiolata) using leaf geometric morphometric analysis. Eight leaf morphological indicators (length, width, perimeter, area, left and right areas, areal ratio, and normalized symmetry index) were used to determine the hybridization level, whereas bilateral symmetry indicators were used to assess species environmental adaptation; (3) Results: Phenotypic variation ranged from 1.54 to 29.35 folds and significantly diverged among the studied species. Taxonomically species in Section Quercus (Q. fabri and Q. serrata var. brevipetiolata) are lower than those in Section Cerris (Q. acutissima and Q. variabilis) with good bilateral symmetry. The bilateral symmetry index of Q. variabilis had a larger range of variation, indicating better environmental adaptability; (4) Conclusions: We presume that species in Section Quercus with less leaf fluctuation asymmetry have a high level of genetic heterozygosity; however, this assumption requires further verification. The observed phenotypic diversity reflects a combination of environmental and genetic factors.
1. Introduction
Woody plants are characterized by their short flowering periods and long vegetative growth seasons. Leaf morphological traits often serve as good indicators for species identification. Long-term field surveys in natural oak forests have concluded that oak species can easily be identified through their leaf morphological characteristics [1,2,3]; however, hybrid individuals have typical asymmetries and irregular leaves with phenotypes exhibiting various intermediate forms [4,5], thus making it difficult to distinguish between different species. The traditional morphology, with no discernible hybridization trend, is helpful in intraspecific and interspecific variation investigation.
It is well established that species phenotypic characteristics variation is associated with genetic and environmental interaction effects [6,7,8,9]. Du et al. [10] study of Quercus dentata and Q. aliena leaf traits revealed greater divergence in mixed than in pure stands. The asymmetric trait divergence of these two oak species is the result of their demographic history imbalance, creating asymmetric interspecific selection pressures [10]. Hybridization is an important source of genetic variation and is thought to be a form of adaptive introgression that, under certain circumstances, produces functional variation that allows species to become more adapted to local climatic conditions [11]. Ramirez et al. [8], in a common garden experiment with different California white oak (Q. lobata) provenances, found leaf trait variation had functional consequences and was related to light factors. Therefore, the two major factors, genetic and environment, are often considered when conducting leaf phenotyping studies. Early work, however, focused on traditional morphology, which does not provide the proper graphical representation of shape variation and thus does not offer insight into the mechanisms underlying how leaf phenotypic traits adapt to environmental change.
The advancement of modern geometric morphometry methods has created an opportunity to objectively investigate leaf phenotypic diversity [12,13,14]. This approach helped in investigating leaves Fluctuating Asymmetry (FA), allometric patterns (AP), and bilateral asymmetry (BA) [15]. These indicators are assumed to explain the genetic factors as well as reflect the buffering capacity of species to environmental stresses [16,17]. For example, Cuevas-Reyes et al. [18] conducted a leaf fluctuation asymmetry study on Q. affinis and Q. laurina hybrids with higher levels of fluctuation asymmetry. They considered hybrids to have higher genetic variation and buffering capacity against environmental stress than their parents. Most studies have used the “Fluctuating Asymmetry (FA)” indicator to study several morphological variants in oaks. In contrast, here we used the “Bilateral Symmetry (BA)” indicators (the areal ratio (AR), and the standardized symmetry index (SI)) to study leaf phenotypic traits, which we think is more suitable for explaining environmental adaptability [19]. We used the MatLab and R packages compiled by Shi et al. [20] to effectively extract leaf phenotypic indicators to study the leaf morphological phenotypic variation of oak trees.
Species hybridization within the genus Quercus is widespread, as confirmed by a large amount of data on genetic and phenotypic variation [21,22,23,24]. Species hybridization typically produces phenotypic variety, which is frequent in oak trees [18]. The four oaks (Quercus acutissima, Q. variabilis, Q. fabri, and Q. serrata var. brevipetiolata) represent the native Quercus species in China, with various sympatric populations in deciduous broad-leaved forests [22,25]. While Q. acutissima and Q. variabilis belong to Section Cerris and Q. fabri, and Q. serrata var. brevipetiolata belong to Section Quercus, interspecific hybridization usually occurs [22,26]. Hybridization occurs mostly between species in the same Section; however, the long history of differentiation has allowed for some ancient introgression between species belonging to different Sections [27]. Thus, the four oaks form a notable syngameon which makes it an ideal material for studying leaf phenotypic variation. Here, we selected the mixed oak forest in Yushan, Jiangsu, China where the four oaks coexist as the study object. We used modern geometric morphometry methods to study leaf intra- and inter-specific phenotypic variation among these four oaks, to understand how leaf phenotypic traits respond to environmental change within the interspecific hybridization context.
2. Materials and Methods
2.1. Study Area and Plant Materials
Yushan (31°36′ N, 120°40′ E), located northwest of Changshu City, Jiangsu Province (maximum altitude of 263 m), China provided the material for our study. The main vegetation types are mixed evergreen deciduous broad-leaved forests, deciduous broad-leaved forests, coniferous forests, and scrub. The deciduous broad-leaved forests include Quercus acutissima, Q. variabilis, Q. fabri, and Q. serrata var. brevipetiolata, as the dominant species. We collected 5 healthy mature leaves from different branches in different directions. We sampled 295 oak individuals within the 80 × 250 m study area (Figure 1) with a various number of individuals per species: Q. acutissima (48), Q. variabilis (88), Q. fabri (96), and Q. serrata var. brevipetiolata (63), with each individual represented by a sample of five leaves (N = 1475 leaves) for phenotypic variation analysis.
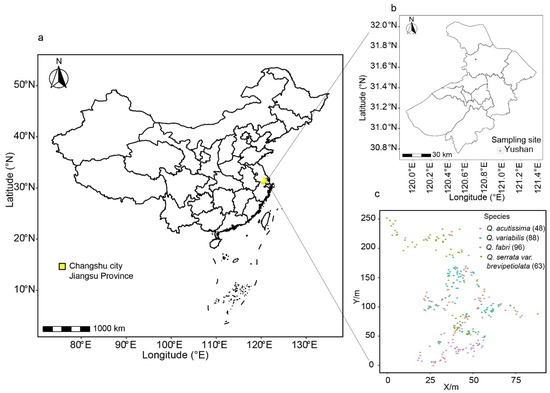
Figure 1.
Sampling sites’ geographical locations and distribution of sampled trees. (a): sampling site in Jiangsu Province, China; (b): sampling site in Yushan, Changsu City; (c): samples numbers and GPS information.
2.2. Leaf Phenotypic Data Collection
We used an EPSON V39 scanner (600-dpi resolution) to capture the sampled leaves images. The leaves were scanned with an adaxial surface facing upward. After processing each leaf separately in Photoshop CC 2019, the results were saved as bitmap-formatted black-and-white images (Figure 2). The M-file created by Shi et al. [20] was used to generate CSV files and automatically extracted the plane coordinate points of the blade edges in the Matlab software (Version 2017b). The CSV files were then used in R script to calculate leaf length (LL), leaf width (LW), leaf perimeter (LP), leaf area (LA), left leaf area (LLA), right leaf area (RLA), leaf area ratio (AR; see below), and normalized symmetry index (SI; see below), and automatically generated CSV result files for further data analysis [20]. The R script specifies leaf width as the widest distance and leaf length as the distance from the leaf’s tip to the base.
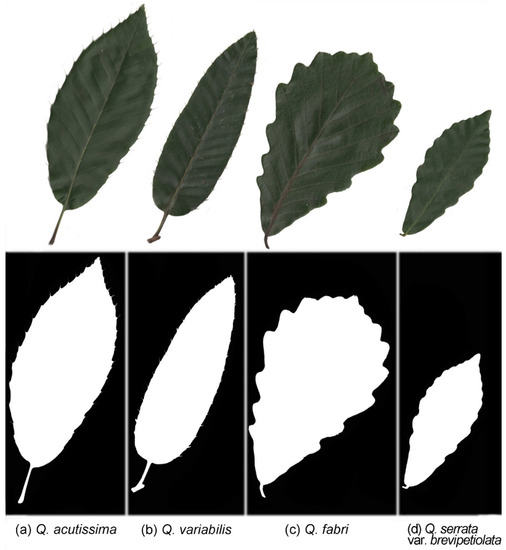
Figure 2.
Representative leaf images of the four-oak species (top) and picture of processing formats (bottom). (a): Quercus acutissima; (b): Q. variabilis; (c): Q. fabri; (d): Q. serrata var. brevipetiolata.
2.3. Leaf Shape and Symmetry Analysis
We used two metrics to quantify the leaf shape: width/length (RWL) and perimeter/area (RPA) as follows:
The following two indicators were used to measure the extent of leaf bilateral symmetry: areal ratio (AR) of the leaf’s left and right sides, and standardized index (SI) [19]. A straight line through the leaf’s base and apex divides each leave into two sides: left and right (Figure 3a). We dissected the leaf into n subregions (Figure 3b, n = 5 to represent the calculation process) using a group of parallel and equidistant straight vertical strips, which are perpendicular to the straight line through the leaf’s base and apex. AR is the areal quotient of the left and right sides of this leaf.
where Li and Ri are the intersected left and right areas between the i-th subregion and the leaf SI:
where n equals 1000 in the calculation, is the average of the relative area differences among the n sub-regions.
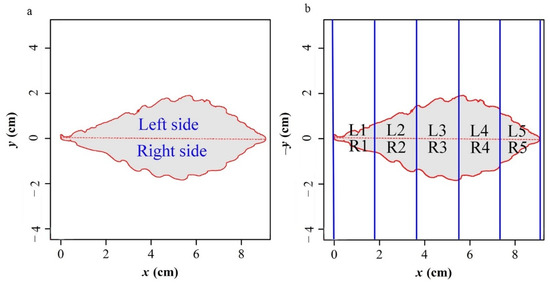
Figure 3.
(a) Illustration of the areal ratio (AR) calculations of the left to right sides, and (b) the standardized index (SI) for measuring leaf bilateral symmetry.
We transformed the AR and SI values to natural logarithmic, if the absolute value of ln (AR) approaches 0, it indicates a good symmetry for both sides’ areas; when leaves are closer to bilateral symmetry the smaller the SI becomes the ln value [19].
2.4. Data Analysis
The 10 leaf phenotypic traits (LL, LW, LP, LLA, RLA, LA, RWL, RPA, AR, and SI) were tested for normality and a one-way analysis of variance (ANOVA) was used to test for significant differences. Differences between leaf phenotypic traits of the two species were further compared using the multiple analysis of significance (LSD) method and Bonferroni correction. We performed principal component analysis and cluster analysis using correlations of the 10 leaf phenotypic data.
A multiple linear regression model with leaf symmetry indicators (AR, SI) as dependent variables and eight leaf phenotypic traits (LL, LW, LP, LA, LLA, RLA, RWL, and RPA) as independent variables as follows:
where a is the intercept, x1–x8 represent the eight leaf phenotypic indicators as the independent variables, b-i is the independent variable coefficients, and ε is the residual. We carried out all analyses in R (version 4.1.0) [28].
Y = a + b × x1 + c × x2 + d × x3 + e × x4 + f × x5 + g × x6 + h × x7 + i × x8 + ε
3. Results
3.1. Leaf Phenotypic Symmetry
We tested 10 leaf phenotypic indicators for normal distribution after log transformation. Nine indicators (LL, LW, LP, LA, LLA, RLA, AR, SI, and RPA) produced normal distribution while (RWL) demonstrated a bimodal distribution (Figure S1). The overall AR and SI means of the four species were 1.08 ± 0.41 and 0.17 ± 0.06, respectively. Individual species AR showed a declining trend with Q. variabilis (1.08 ± 0.20) > Q. acutissima (1.06 ± 0.16) > Q. serrata var. brevipetiolata (1.04 ± 0.11) > Q. fabri (1.02 ± 0.11) (Figure 4). Similarly, individual species mean SI also produced a declining trend with a somewhat different species order: Q. acutissima (0.21 ± 0.07)) = Q. variabilis (0.21 ± 0.06) > Q. fabri (0.16 ± 0.04) > Q. serrata var. brevipetiolata (0.14 ± 0.03) (Figure 4). Figure 5 showed that after converting AR to natural logarithm, Q. fabri had ln (AR) values closest to zero, followed by Q. serrata var. brevipetiolata, Q. acutissima and Q. variabilis. The intra-species variation is in the following order: Q. variabilis > Q. acutissima > Q. serrata var. brevipetiolata > Q. fabri. Q. acutissima and Q. serrata var. brevipetiolata did not significantly differ; however, Q. variabilis and Q. fabri were highly significant. After converting SI to natural logarithms, the largest ln (SI) values were found for Q. acutissima, followed by Q. variabilis, Q. fabri, and Q. serrata var. brevipetiolata. In terms of within species variation range, Q. serrata var. brevipetiolata had the smallest, with the other three species having similar ranges of variation. The LSD analysis showed no significant differences between Q. acutissima and Q. variabilis, while the rest of the two combinations were highly significant from each other.
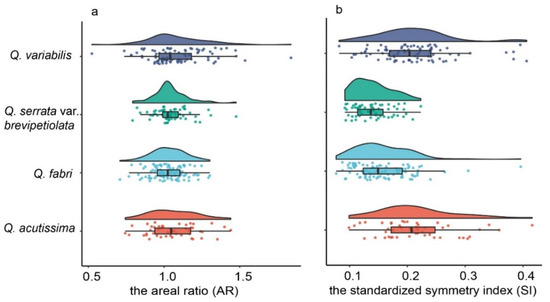
Figure 4.
Cloud and rain diagrams of leaf symmetry indexes of the four-oak species. (a): AR; (b): SI.
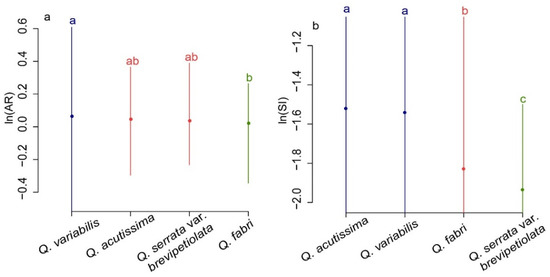
Figure 5.
The LSD of the natural logarithm of AR (a) and SI (b) for measuring leaf bilateral symmetry. a, b, c represent the significance of the difference.
We developed multiple linear regression models with leaf bilateral symmetry indicators (AR and SI) as dependent variables and LL, LW, LP, LA, LLA, RLA, RLA, RPA, and RWL as independent variables (Table 1). According to the t-test, LA values in both models were not significant, while the leaf bilateral symmetry indicator had a high level of correlation, so we excluded LA from subsequent analyses. Only LLA and RLA were significant in the AR model, while five independent variables (LL, LP, LLA, RLA, and RPA) were significant in the SI model (Table 1). F-test indicated that 39.59 and 76.63% of the independent variables explained leaf bilateral symmetry in the SI and AR models, respectively (Table 1). We used the residual analysis and outlier detection to determine model accuracy (Figure S2) and the results indicated that residuals were consistent with few outliers (Figure S2a,b,e,f). After removing the outliers, the correlations were roughly the same.

Table 1.
Multivariate linear model prediction between leaf fluctuating asymmetry and leaf phenotypic traits.
3.2. Leaf Phenotypic Indicators Intra- and Inter-Specific Variation
The four oaks’ leaf phenotypic indicators showed an abundance of intraspecific variation (1.54–29.35-fold). The top three leaf phenotypic traits (RLA, LA, and LLA) showed high coefficients of variation (Table 2). Q. acutissima had the greatest variation in SI (4.2-fold), RLA (3.88-fold), LLA (3.74-fold); while Q. variabilis, Q. fabri and Q. serrata var. brevipetiolata shared similar leaf phenotypic indicators with high variability (RLA (Q. variabilis = 15.67-fold, Q. fabri = 29.35-fold, Q. serrata var. brevipetiolata = 4.09-fold), LA (Q. variabilis = 14.61-fold, Q. fabri = 26.95-fold, Q. serrata var. brevipetiolata = 5.23-fold), and LLA (Q. variabilis = 13.66-fold, Q. fabri = 25.9-fold, Q. serrata var. brevipetiolata = 6.91-fold)). Q. fabri had the largest leaves among species, as evidenced by its greater LL, LW, LP, LA, LLA, RLA, RWL, and RPA values. Compared to the other three species, Q. variabilis harbored more AR (3.54-fold) and SI (5.13-fold) variation.

Table 2.
Leaf phenotypic variation range of four oak species.
With the exception of AR and RPA, ANOVA revealed significant leaf phenotypic traits’ interspecific differences in LL, LW, LP, LA, LLA, RLA, RWL, and SI (Table 3). Contrasting leaf phenotypic traits differences were observed between the two oak Sections, Cerris and Quercus, with reduced and substantial variation for the former and latter, respectively. No significant differences were observed in LW, RWL, AR, RPA, and SI in Section Cerris (Q. acutissima and Q. variabilis) while considerable variations in LW, LP, LA, LLA, RLA, and RWL were observed in Section Quercus (Q. fabri and Q. serrata var. brevipetiolata). Additionally, extensive variation exists between species in different Sections (e.g., LL and LP between Q. variabilis and Q. serrata var. brevipetiolata; LA, LLA, and RLA between Q. acutissima and Q. fabri; and LW, RWL, and SI among the four taxa).

Table 3.
ANOVA e summary of leaf phenotypic indexes among the four-oak species.
3.3. Principal Component and Cluster Analyses of Variation in Leaf Phenotypic Traits
For each oak species, we performed a separate principal component analysis (PCA) and LLA, RLA, LL, LW, LA, LP, and RPA, all had equal and significant contributions to the first principal component (PCA1) across the four-oak species (Figure 6). However, the leaf phenotypic variation contributes to PCA2 differed across the four-oak species (e.g., RWL and SI followed by LL and LW for Q. acutissima (Figure 6a); SI for Q. variabilis (Figure 6b); AR and RWL followed by SI for Q. fabri (Figure 6c); SI and AR for Q. serrata var. brevipetiolata (Figure 6d)). Overall, RWL, SI, and AR contributed more to PCA2.
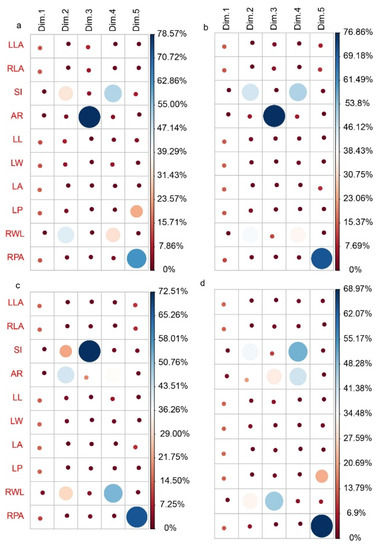
Figure 6.
Contribution rate of 10 leaf phenotypic variables to principal components. (a): Q. acutissima; (b): Q. variabilis; (c): Q. fabri; (d): Q. serrata var. brevipetiolata.
Positive correlations between SI, RPA, and AR; between LL, LP, RLA, LA, and LLA; and between RWL and LW were observed for Q. acutissima (Figure S3). LL, LP, RLA, LA, and LLA had high cos2 values and were better able to represent the principal component analysis as cos2 values indicated that the variables have a larger contribution to the principal components, in which case the variables are located near the circle edge of the correlation plot (Figure S3a). In contrast to Q. acutissima, the 10 leaf phenotypic correlations of Q. variabilis were different and positively correlated between SI, AR, LL, LP, and LLA; and between RLA, LA, RWL, and LW were observed. LL, LP, RLA, LA, LLA, and LW had high cos2 values and were better contributors to the principal component analysis (Figure S3b).
AR and RWL of Q. acutissima and Q. variabilis were negative in different quadrants. Contrary to Q. acutissima and Q. variabilis, Q. fabri experienced a shift from a negative to a positive correlation between AR and RWL, as well as an increase in AR cos2 value and a decrease in SI cos2 value (Figure S3c). Q. serrata var. brevipetiolata shared the representation and correlation of the leaf phenotypic variables with Q. variabilis, except for SI, AR, and RWL cos2 values suggesting that these three parameters are the primary leaf phenotypic indicators causing differences between these two species (Figure S3d).
According to Pearson correlation analysis, most of the 10 leaf phenotypic traits had high and positive correlations with ranges of 0.073 to 0.982, while few had low negative correlations with ranges of −0.788 to −0.004. RPA produced high and negative correlations with LP, LA, LW, LL, RLA, and LLA (Figure 7a). According to the fragmentation diagram and contribution, the first two principal components accounted for the leaf phenotypic traits variation (79.94%) (Figure 7b,c). Principal component analysis revealed that individuals of the four species could be classified into two groups; however, species within Sections were complex and difficult to distinguish (Figure 7d). According to the hierarchical clustering, the four-oak species had areas of intersection as they clustered into seven classes, allowing individuals from different Sections to coexist (Figure 8).
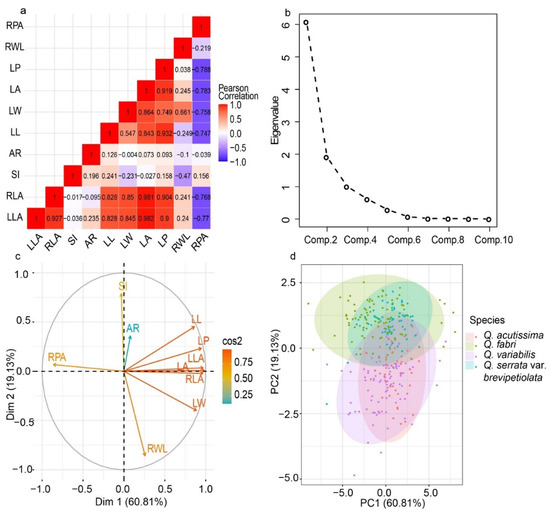
Figure 7.
Principal component analysis of leaf phenotypic variation for the four-oak species. (a): Correlation analysis; (b): Gravel figure (the contribution of each principal component to total variability); (c): Variable correlation and important value; (d): Two-dimensional principal component analysis.
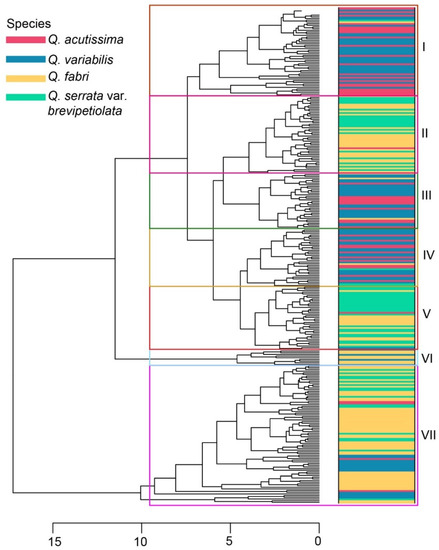
Figure 8.
Hierarchical clustering of leaf phenotypic traits for the four-oak species.
4. Discussion
Prior to molecular genetic markers use, leaf phenotypic variation was often used in studying hybrids. F1-hybrid generations are genetically superior to their parents, exhibiting a wide range of intermediate phenotypic traits, as well as transgressive segregation [29]. Although there is some correlation between the phenotypic variation of hybrids and their parents, clear patterns often did not occur. The phenotypic traits do not directly identify the parental origin but are still valuable for studying introgression [6]. Additionally, phenotypic variation responded to the species’ adaptation to their environment. In this study, we used the scanned leaves graphs and extracted indicators that enabled us to rapidly access a large number of species phenotypic data for hybrids assessments [20]. Furthermore, we introduced two new indicators (AR and SI) to measure/assess leaf symmetry and used them to determine hybridization occurrence and to evaluate the species’ environmental adaptability. In our study, Section Cerris species exhibited wide variation in fluctuating asymmetries and species in Section Quercus with small FA. The two major factors, genetic and environment, are often considered when conducting leaf phenotyping studies [6,7,8,9]. Earlier studies considered species with higher levels of fluctuation asymmetry to have higher genetic variation and buffering capacity against environmental stress [18]. We think Cerris species had higher genetic variation and more environmental adaptability and Quercus species may have high genetic heterozygosity. However, those assumptions require further molecular experiment verification. We expect that our findings will provide a theoretical basis for future molecular diagnostic research.
4.1. Environmental Adaptability of the Four-Oak Species
Various researchers used the leaf fluctuation asymmetry (FA) index to measure the variance brought on by genetics, environmental factors, and their interaction, which can lead to developmental instability and leaf phenotypic plasticity in plants [13,30,31]. FA not only measures leaf symmetry, floral structure, and reproductive symmetry but also reflects the combined ability of a species to buffer internal genetic factors from external environmental stresses during development [32]. However, bilateral symmetrical indicators (AR and SI), can sufficiently express the leaves’ adaptability to their environment [19]. Of the four-oak species studied, Section Quercus (Q. fabri and Q. serrata var. brevipetiolata) species leaves had good bilateral symmetry. The bilateral symmetry index of Q. variabilis had a large range of variation. Previous studies pointed to the existence of greater fluctuating asymmetry in leaf shape, revealing increased plants’ environmental adaptation [18]. Based on the observed spatial distribution of the four-oak species, we found Q. variabilis to be environmentally heterogeneous and exhibit a dispersal distribution within its populations, thus, it has the highest environmental adaptability. The ecological niche theory states that each species has a specific habitat and that its potential for adaptation constrains the species’ dispersion [33,34,35]. These four-oak species have a high number of sympatric populations with a long history of differentiation in China [22,25,36,37]. This reinforces the fact that these oaks produce phenotypic diversity to adapt to different habitats. We also found the highest variation in leaf symmetry indicators in Q. fabri, an observation supported by the known high rate of hybridization of species in Section Quercus. Li et al. [22] studied the genetic variation of these four-oak species and found that Q. fabri had more introgression, further supporting our observation.
4.2. Phenotypic Diversity from Genetic Variation
One of the biological mechanisms causing leaf asymmetry is genetic variation, and hybridization is a major source of its generation [11]. In various investigations, hybrids contain intermediate phenotypic features, a by-product of introgression [38]. For example, the production of the Q. subpyrenaica hybrids by Q. robur and Q. petraea; Q. faginea and Q. pubescens hybrids [39]. Hybrids frequently differ from the conventional intermediate morphology and exhibit a wide range of phenotypic features of both parents and the intermediate [40]. Here, the studied oaks exhibit a wide range of phenotypic traits with 1.54–29.35-fold. García-Nogales et al. [41] who phenotyped Q. ilex populations across a latitudinal gradient, showed that leaf area size variation ranged from 98.7–184.1 cm2 with a variation of 1.87-fold. However, in the present study, substantial leaf area size variation was observed from Q. acutissima (3.54-fold) to Q. fabri (26.95-fold). All four oaks exhibit greater variation in leaf area size than Q. ilex [41]. The magnitude of phenotypic variation in the studied local mixed oak forests is greater than that observed for other oak populations in wide geographical conditions, an observation supports the role of hybridization in generating substantial phenotypic variation.
Two related hypotheses are currently used to explain FA levels in hybrids: (1) genetic heterozygosity increases and FA decreases in hybrids [42]; and (2) FA can indicate an increase by disrupting co-adapted gene complexes in hybrids [43,44]. The increase in FA of hybrids depends on the hybrids’ phylogenetic, intraspecific hybrids have lower FA levels than hybrids of interspecific species [45]. The fluctuation asymmetry of individuals in Section Cerris was higher than that of Section Quercus, as we demonstrated above. Considering the first hypothesis, we conclude that the white oak group has a high level of genetic heterozygosity. At the same time, there is no discernible difference between Q. acutissima and Q. variabilis, while a discernible difference between Q. serrata var. brevipetiolata and Q. fabri exists. We speculate that there are more hybrids within Section Quercus. This, of course, need to be verified by molecular data. In addition, the main causes of leaf fluctuation asymmetry, according to our multiple linear regression simulations, were determined to be LL, LP, LLA, RLA, and RLP. As a result, these indicators will be crucial in any future analysis of leaf phenotypic traits variation within and among species.
4.3. The Impact of Phenotypic Variation on Species Classification
Our analyses of 295 individual oaks using principal components and hierarchical clustering revealed the difficulty associated with our attempts to distinguish among the four-oak species and separate them into four independent groupings. Leaf phenotypic traits differed less between Q. acutissima and Q. variabilis and more between Q. serrata var. brevipetiolata and Q. fabri. The high level of similarity between species and the large morphological variation of individuals makes it more difficult to classify species [40]. Quercus species are wind-pollinated, with weak reproductive barriers, thus allowing the production of many fertile hybrid offspring [46]. The extensive morphological variation of hybrids has blurred species boundaries. The initial identification of species based on leaf geometry morphology alone is subject to a certain rate of error. We can add traditional morphology such as leaf hair morphology, leaf hair color, and branch color. However, whether these morphologies change with environment and genetics needs to be further investigated.
Authors should discuss the results and how they can be interpreted from the perspective of previous studies and the working hypotheses. The findings and their implications should be discussed in the broadest context possible. Future research directions may also be highlighted.
5. Conclusions
The four-oak species have significantly different leaf morphologies, varying in character from 1.54 to 29.35 folds. The wind-pollinated mating system, with weak reproductive barriers, facilities Quercus species hybridization. We hypothesize that the observed extensive leaf attribute variation resulted from interspecific hybridization. Species in Section Quercus with small FA have high genetic heterozygosity. However, this still needs further verification using molecular markers. Wide variation in fluctuating asymmetries exhibits that Section Cerris species are more suited to the environment than Section Quercus species. Phenotypic diversity improves species’ capacity to adapt to environmental change, but it also makes species classification challenging.
Supplementary Materials
The following supporting information can be downloaded at: https://www.mdpi.com/article/10.3390/f13101635/s1, Figure S1: Normal distribution detection for the 10 leaf-shaped indicators; Figure S2: Residual error analysis and outlier detection of two models. (a–d): SI, (e–f): AR; Figure S3: Correlation and important value of 10 leaf phenotypic variables. (a): Q. acutissima; (b): Q. variabilis; (c): Q. fabri; (d): Q. serrata var. brevipetiolata.
Author Contributions
Conceptualization, X.L.; methodology, X.L.; software, X.L. and X.Y.; formal analysis, X.L. and J.H.; resources, Y.F.; writing—original draft preparation, X.L.; writing—review and editing, Y.F. and Y.A.E.-K.; supervision, Y.F.; project administration, Y.F. All authors have read and agreed to the published version of the manuscript.
Funding
This work was supported by the National Natural Science Foundation of China (31770699 to Y.F.), the State Scholarship Fund, the Priority Academic Program Development of Jiangsu Higher Education Institutions (PAPD to Y.F.), Nanjing Forestry University Excellent Doctoral Thesis Fund (2171700124 to X.L.), and the Jiangsu Innovation Engineering Fund (KYCX18_0989 to X.L.).
Institutional Review Board Statement
Not applicable.
Informed Consent Statement
Not applicable.
Data Availability Statement
The datasets are available from the corresponding author on reasonable request.
Acknowledgments
The authors thank Xiaodong Li, Baokun Xu for their contribution to sample.
Conflicts of Interest
The funders had no role in the design of the study; in the collection, analyses, or interpretation of data; in the writing of the manuscript; or in the decision to publish the results.
References
- Kremer, A.; Dupouey, J.L.; Deans, J.D.; Cottrell, J.; Csaikl, U.; Finkeldey, R.; Espinel, S.; Jensen, J.; Kleinschmit, J.; Van Dam, B. Leaf morphological differentiation between Quercus robur and Quercus petraea is stable across western European mixed oak stands. Ann. For. Sci. 2002, 59, 777–787. [Google Scholar] [CrossRef]
- Staudt, M.; Mir, C.; Joffre, R.; Rambal, S.; Bonin, A.; Landais, D.; Lumaret, R. Isoprenoid emissions of Quercus spp. (Q. suber and Q. ilex) in mixed stands contrasting in interspecific genetic introgression. New Phytol. 2004, 163, 573–584. [Google Scholar] [CrossRef] [PubMed]
- Tovar Sánchez, E.; Oyama, K. Natural hybridization and hybrid zones between Quercus crassifolia and Quercus crassipes (Fagaceae) in Mexico: Morphological and molecular evidence. Am. J. Bot. 2004, 91, 1352–1363. [Google Scholar] [CrossRef] [PubMed]
- Gonzalez-Rodriguez, A.; Oyama, K. Leaf morphometric variation in Quercus affinis and Q. laurina (Fagaceae), two hybridizing Mexican red oaks. Bot. J. Linn. Soc. 2005, 147, 427–435. [Google Scholar] [CrossRef]
- Maslova, N.P.; Karasev, E.V.; Xu, S.L.; Spicer, R.A.; Liu, X.Y.; Kodrul, T.M.; Spicer, T.E.; Jin, J.H. Variations in morphological and epidermal features of shade and sun leaves of two species: Quercus bambusifolia and Q. myrsinifolia. Am. J. Bot. 2021, 108, 1441–1463. [Google Scholar] [CrossRef]
- Yücedağ, C.; Müller, M.; Gailing, O. Morphological and genetic variation in natural populations of Quercus vulcanica and Q. frainetto. Plant Syst. Evol. 2021, 307, 8. [Google Scholar] [CrossRef]
- Anderegg, L.D.; Berner, L.T.; Badgley, G.; Sethi, M.L.; Law, B.E.; Hillerislambers, J. Within-species patterns challenge our understanding of the leaf economics spectrum. Ecol. Lett. 2018, 21, 734–744. [Google Scholar] [CrossRef]
- Ramirez, H.; Ivey, C.T.; Wright, J.W.; Macdonald, B.W.; Sork, V.L. Variation in leaf shape in a Quercus lobata common garden: Tests for adaptation to climate and physiological consequences. Madroño 2020, 67, 77–84. [Google Scholar] [CrossRef]
- Klápště, J.; Kremer, A.; Burg, K.; Garnier-Géré, P.; El-Dien, O.G.; Ratcliffe, B.; El-Kassaby, Y.A.; Porth, I. Quercus species divergence is driven by natural selection on evolutionarily less integrated traits. Heredity 2021, 126, 366–382. [Google Scholar] [CrossRef]
- Du, F.K.; Qi, M.; Zhang, Y.; Petit, R.J. Asymmetric character displacement in mixed oak stands. New Phytol. 2022. [Google Scholar] [CrossRef]
- Cannon, C.H.; Lerdau, M. Variable mating behaviors and the maintenance of tropical biodiversity. Front. Genet. 2015, 6, 183. [Google Scholar] [CrossRef] [PubMed]
- Akli, A.; Lorenzo, Z.; Alía, R.; Rabhi, K.; Torres, E. Morphometric Analyses of Leaf Shapes in Four Sympatric Mediterranean Oaks and Hybrids in the Algerian Kabylie Forest. Forests 2022, 13, 508. [Google Scholar] [CrossRef]
- Liu, Y.; Li, Y.; Song, J.; Zhang, R.; Yan, Y.; Wang, Y.; Du, F.K. Geometric morphometric analyses of leaf shapes in two sympatric Chinese oaks: Quercus dentata Thunberg and Quercus aliena Blume (Fagaceae). Ann. For. Sci. 2018, 75, 90. [Google Scholar] [CrossRef]
- López De Heredia, U.; Duro-García, M.J.; Soto, A. Leaf morphology of progenies in Q. suber, Q. ilex, and their hybrids using multivariate and geometric morphometric analysis. iForest 2018, 11, 90–98. [Google Scholar] [CrossRef]
- Viscosi, V. Geometric morphometrics and leaf phenotypic plasticity: Assessing fluctuating asymmetry and allometry in European white oaks (Quercus). Bot. J. Linn. Soc. 2015, 179, 335–348. [Google Scholar] [CrossRef]
- Chirichella, R.; Rocca, M.; Brugnoli, A.; Mustoni, A.; Apollonio, M. Fluctuating asymmetry in Alpine chamois horns: An indicator of environmental stress. Evol. Ecol. 2020, 34, 573–587. [Google Scholar] [CrossRef]
- Tucić, B.; Budečević, S.; Manitašević Jovanović, S.; Vuleta, A.; Klingenberg, C.P. Phenotypic plasticity in response to environmental heterogeneity contributes to fluctuating asymmetry in plants: First empirical evidence. J. Evol. Biol. 2018, 31, 197–210. [Google Scholar] [CrossRef]
- Cuevas-Reyes, P.; Canché-Delgado, A.; Maldonado-López, Y.; Fernandes, G.W.; Oyama, K.; González-Rodríguez, A. Patterns of herbivory and leaf morphology in two Mexican hybrid oak complexes: Importance of fluctuating asymmetry as indicator of environmental stress in hybrid plants. Ecol. Ind. 2018, 90, 164–170. [Google Scholar] [CrossRef]
- Shi, P.; Niinemets, Ü.; Hui, C.; Niklas, K.J.; Yu, X.; Hölscher, D. Leaf bilateral symmetry and the scaling of the perimeter vs. the surface area in 15 vine species. Forests 2020, 11, 246. [Google Scholar] [CrossRef]
- Shi, P.; Ratkowsky, D.A.; Li, Y.; Zhang, L.; Lin, S.; Gielis, J. A general leaf area geometric formula exists for plants -Evidence from the simplified giel is equation. Forests 2018, 9, 714. [Google Scholar] [CrossRef]
- Castillo-Mendoza, E.; Salinas-Sánchez, D.; Valencia-Cuevas, L.; Zamilpa, A.; Tovar-Sánchez, E. Natural hybridisation among Quercus glabrescens, Q. rugosa and Q. obtusata (Fagaceae): Microsatellites and secondary metabolites markers. Plant Biol. 2019, 21, 110–121. [Google Scholar] [CrossRef] [PubMed]
- Li, X.; Wei, G.; El-Kassaby, Y.A.; Fang, Y. Hybridization and introgression in sympatric and allopatric populations of four oak species. BMC Plant Biol. 2021, 21, 266. [Google Scholar] [CrossRef] [PubMed]
- López De Heredia, U.; Mora-Márquez, F.; Goicoechea, P.G.; Guillardín-Calvo, L.; Simeone, M.C.; Soto, Á. ddRAD Sequencing-Based Identification of Genomic Boundaries and Permeability in Quercus ilex and Q. suber Hybrids. Front. Plant Sci. 2020, 11, 1330. [Google Scholar] [CrossRef] [PubMed]
- Nagamitsu, T.; Uchiyama, K.; Izuno, A.; Shimizu, H.; Nakanishi, A. Environment-dependent introgression from Quercus dentata to a coastal ecotype of Quercus mongolica var. crispula in northern Japan. New Phytol. 2020, 226, 1018–1028. [Google Scholar] [CrossRef]
- Li, X.; Li, Y.; Fang, Y. Prediction of potential suitable distribution areas of Quercus fabri in China based on an optimized Maxent model. Sci. Silvae Sin. 2018, 54, 153–164. [Google Scholar]
- Denk, T.; Grimm, G.W.; Manos, P.S.; Deng, M.; Hipp, A.L. An Updated Infrageneric Classification of the Oaks: Review of Previous Taxonomic Schemes and Synthesis of Evolutionary Patterns. In Oaks Physiological Ecology. Exploring the Functional Diversity of Genus Quercus L.; Springer: Berlin/Heidelberg, Germany, 2017; pp. 13–38. [Google Scholar]
- Zhou, B.; Yuan, S.; Crowl, A.A.; Liang, Y.; Shi, Y.; Chen, X.; An, Q.; Kang, M.; Manos, P.S.; Wang, B. Phylogenomic analyses highlight innovation and introgression in the continental radiations of Fagaceae across the Northern Hemisphere. Nat. Commun. 2022, 13, 1320. [Google Scholar] [CrossRef]
- R Core Team. R Core Team. R Core Team: A Language and Environment for Statistical Computing. In R Foundation for Statistical Computing; MSOR Connections: Vienna, Austria, 2021. [Google Scholar]
- Rieseberg, L.H.; Widmer, A.; Arntz, A.M.; Burke, B.; Dickinson, H.G.; Dickinson, H.G.; Hiscock, S.J.; Hiscock, S.J.; Crane, P.R.; Crane, P.R. The genetic architecture necessary for transgressive segregation is common in both natural and domesticated populations. Philos. Trans. Biol. Sci. 2003, 358, 1141–1147. [Google Scholar] [CrossRef]
- Leamy, L.; Klingenberg, C.P. The Genetics and Evolution of Fluctuating Asymmetry. Annu. Rev. Ecol. Evol. Syst. 2005, 36, 1–21. [Google Scholar] [CrossRef]
- Shadrina, E.; Turmukhametova, N.; Soldatova, V.; Korotchenko, I.; Pervyshina, G. Fluctuating asymmetry in morphological characteristics of Betula pendula Roth leaf under conditions of urban ecosystems: Evaluation of the multi-factor negative impact. Symmetry 2020, 12, 1317. [Google Scholar] [CrossRef]
- Sandner, T.M.; Zverev, V.; Kozlov, M.V. Can the use of landmarks improve the suitability of fluctuating asymmetry in plant leaves as an indicator of stress? Ecol. Ind. 2019, 97, 457–465. [Google Scholar] [CrossRef]
- Chesson, P. A need for niches? Trends Ecol. Evol. 1991, 6, 26–28. [Google Scholar] [CrossRef]
- Pulliam, H.R. On the relationship between niche and distribution. Ecol. Lett. 2000, 3, 349–361. [Google Scholar] [CrossRef]
- Vandermeer, J.H. Niche theory. Annu. Rev. Ecol. Syst. 1972, 3, 107–132. [Google Scholar] [CrossRef]
- Liang, Y.Y.; Shi, Y.; Yuan, S.; Zhou, B.F.; Chen, X.Y.; An, Q.Q.; Ingvarsson, P.K.; Plomion, C.; Wang, B.; Sveriges, L. Linked selection shapes the landscape of genomic variation in three oak species. New Phytol. 2022, 233, 555–568. [Google Scholar] [CrossRef]
- Chen, X.; Yang, J.; Feng, L.I.; Zhou, T.; Zhang, H.; Li, H.; Bai, G.; Meng, X.U.; Li, Z.; Zhao, G. Phylogeography and population dynamics of an endemic oak (Quercus fabri Hance) in subtropical China revealed by molecular data and ecological niche modeling. Tree Genet. Genomes 2020, 16, 2. [Google Scholar] [CrossRef]
- Wilsey, B.J.M.U.; Haukioja, E.; Koricheva, J.; Sulkinoja, M. Leaf fluctuating asymmetry increases with hybridization and elevation in tree-line birches. Ecology 1998, 79, 2092–2099. [Google Scholar] [CrossRef]
- Himrane, H.; Camarero, J.J.; Gil-Pelegrín, E. Morphological and ecophysiological variation of the hybrid oak Quercus subpyrenaica (Q. faginea × Q. pubescens). Trees 2004, 18, 566–575. [Google Scholar] [CrossRef]
- Thompson, K.A.; Urquhart-Cronish, M.; Whitney, K.D.; Rieseberg, L.H.; Schluter, D. Patterns, predictors, and consequences of dominance in hybrids. Am. Nat. 2021, 197, E72–E88. [Google Scholar] [CrossRef]
- García Nogales, A.; Linares, J.C.; Laureano, R.G.; Seco, J.I.; Merino, J. Range-wide variation in life-history phenotypes: Spatiotemporal plasticity across the latitudinal gradient of the evergreen oak Quercus ilex. J. Biogeogr. 2016, 43, 2366–2379. [Google Scholar] [CrossRef]
- Soulé, M.E. Heterozygosity and Developmental Stability: Another Look. Evolution 1979, 33, 396–401. [Google Scholar] [CrossRef]
- Hochwender, C.G.; Fritz, R.S. Fluctuating Asymmetry in a Salix Hybrid System: The Importance of Genetic versus Environmental Causes. Evolution 1999, 53, 408–416. [Google Scholar] [CrossRef] [PubMed]
- Siikamaki, P. Developmental instability in hybrids between Lychnis viscaria and Lychnis alpina (Caryophyllaceae). Am. J. Bot. 1999, 86, 1683–1686. [Google Scholar] [CrossRef] [PubMed]
- Markow, T.A. Evolutionary Ecology and Developmental Instability. Annu. Rev. Entomol. 1995, 40, 105–120. [Google Scholar] [CrossRef]
- Cannon, C.H.; Petit, R.J. The oak syngameon: More than the sum of its parts. New Phytol. 2020, 226, 978–983. [Google Scholar] [CrossRef] [PubMed]
Publisher’s Note: MDPI stays neutral with regard to jurisdictional claims in published maps and institutional affiliations. |
© 2022 by the authors. Licensee MDPI, Basel, Switzerland. This article is an open access article distributed under the terms and conditions of the Creative Commons Attribution (CC BY) license (https://creativecommons.org/licenses/by/4.0/).