
Dynamic Evolution and Future Prediction of Land Use Patterns in the Arid Desert Region of Northwest China from 1990 to 2020

Abstract
:1. Introduction
2. Materials and Methods
2.1. Study Area
2.2. Data Source
2.3. Data Analysis
2.3.1. Single Landscape Dynamics Model
2.3.2. Overall Dynamic Model
2.3.3. Relative Dynamic Model
2.3.4. Landscape Pattern Index
2.3.5. Conversion of Land Use and Its Effect at Small Regional Extent Model
3. Results
3.1. Landscape Pattern Index Evolution
3.1.1. Landscape Pattern at the Landscape Level
3.1.2. Landscape Pattern at the Patch Type Level
3.2. Temporal and Spatial Evolution Process of Each Landscape Type
3.2.1. Dynamic Transfer of Landscape Type
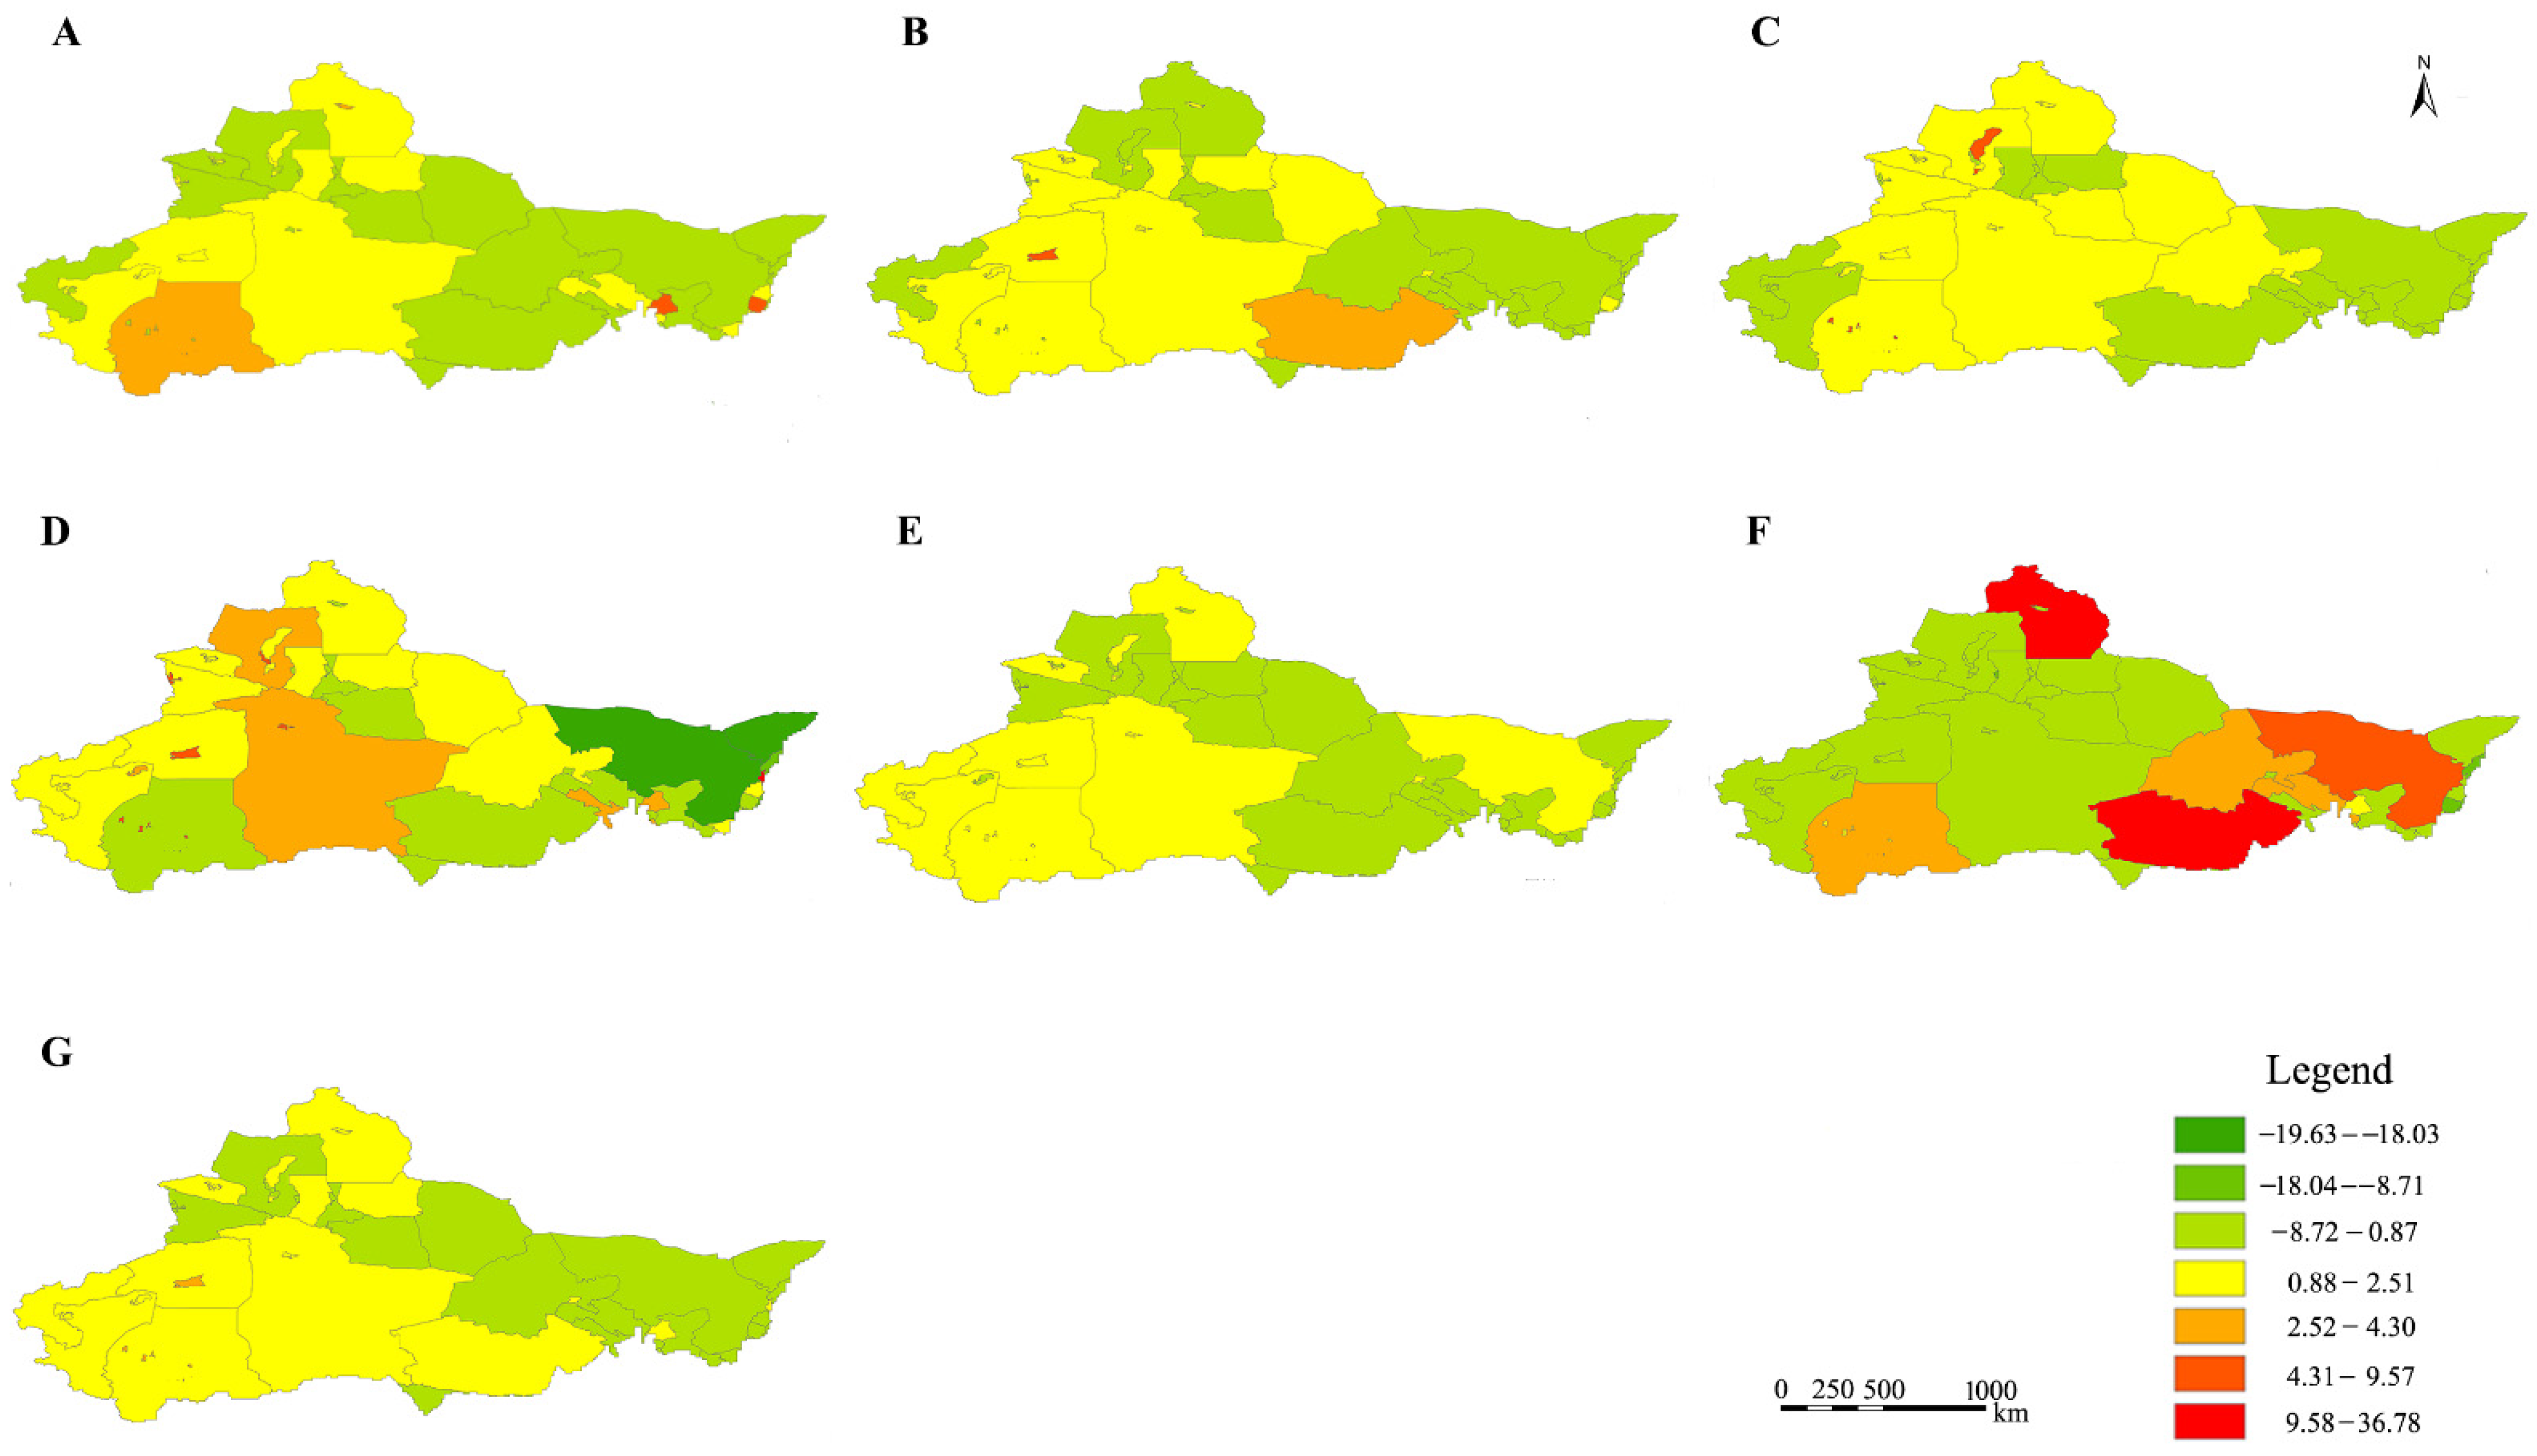
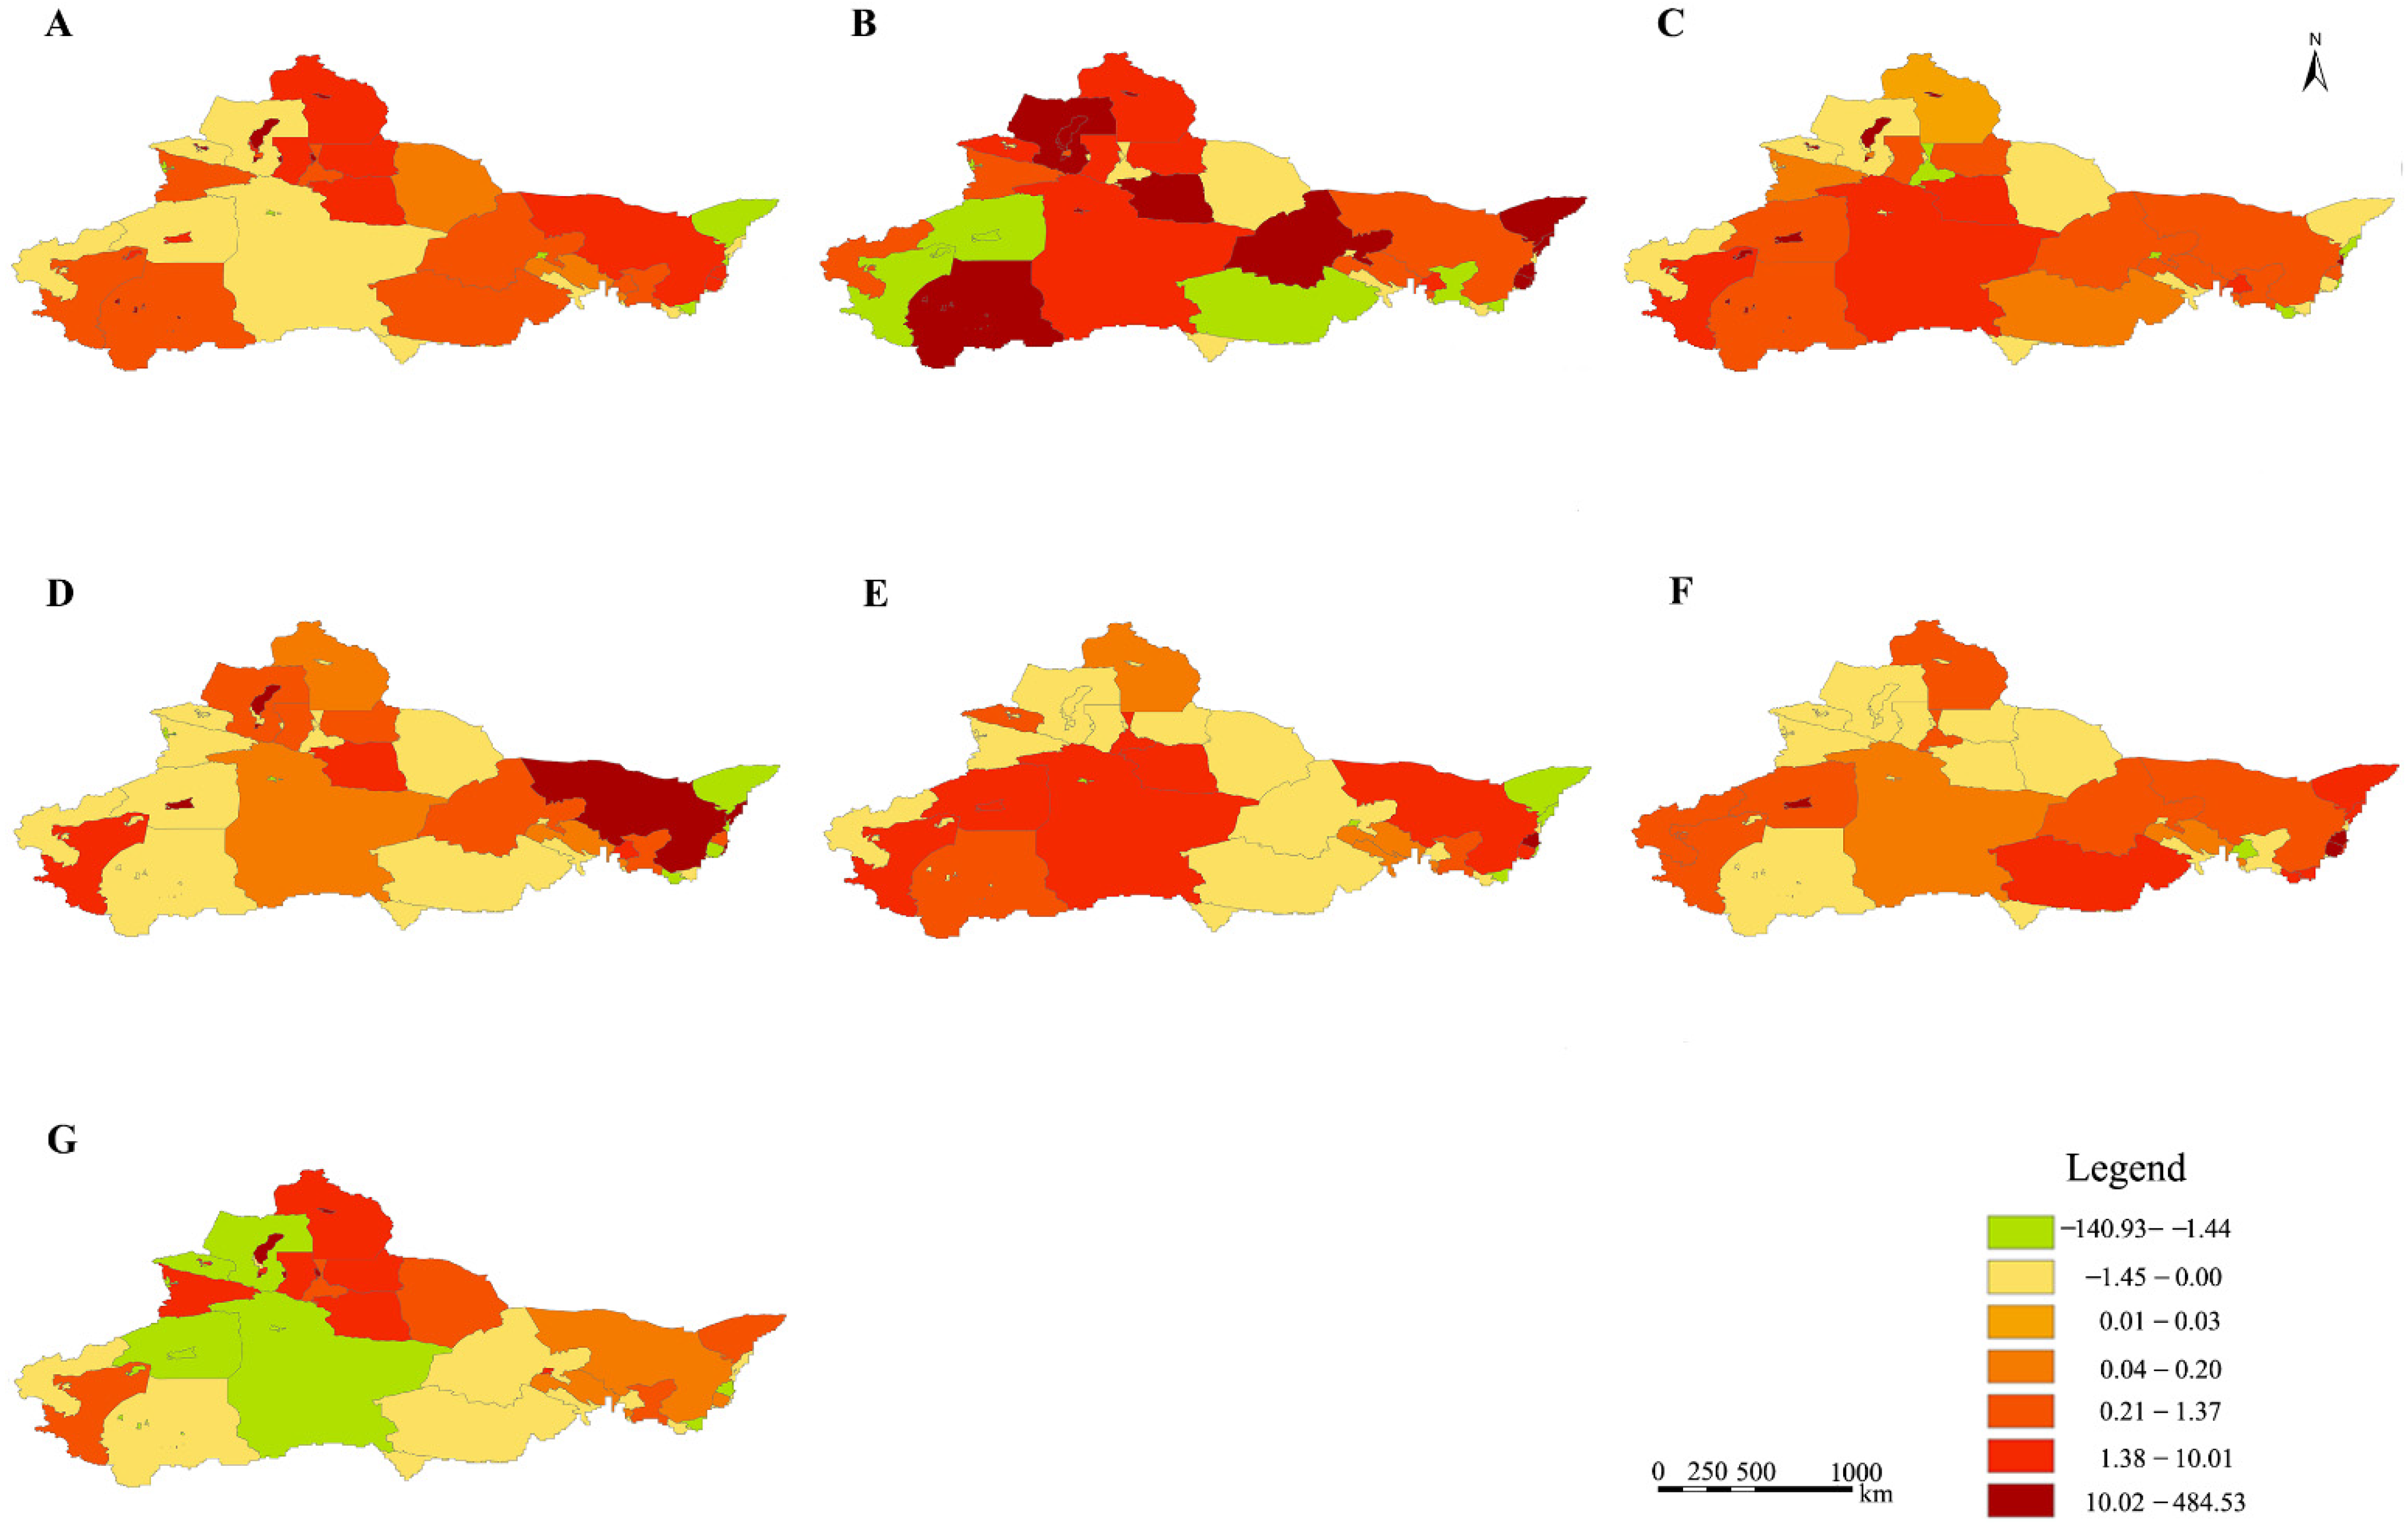
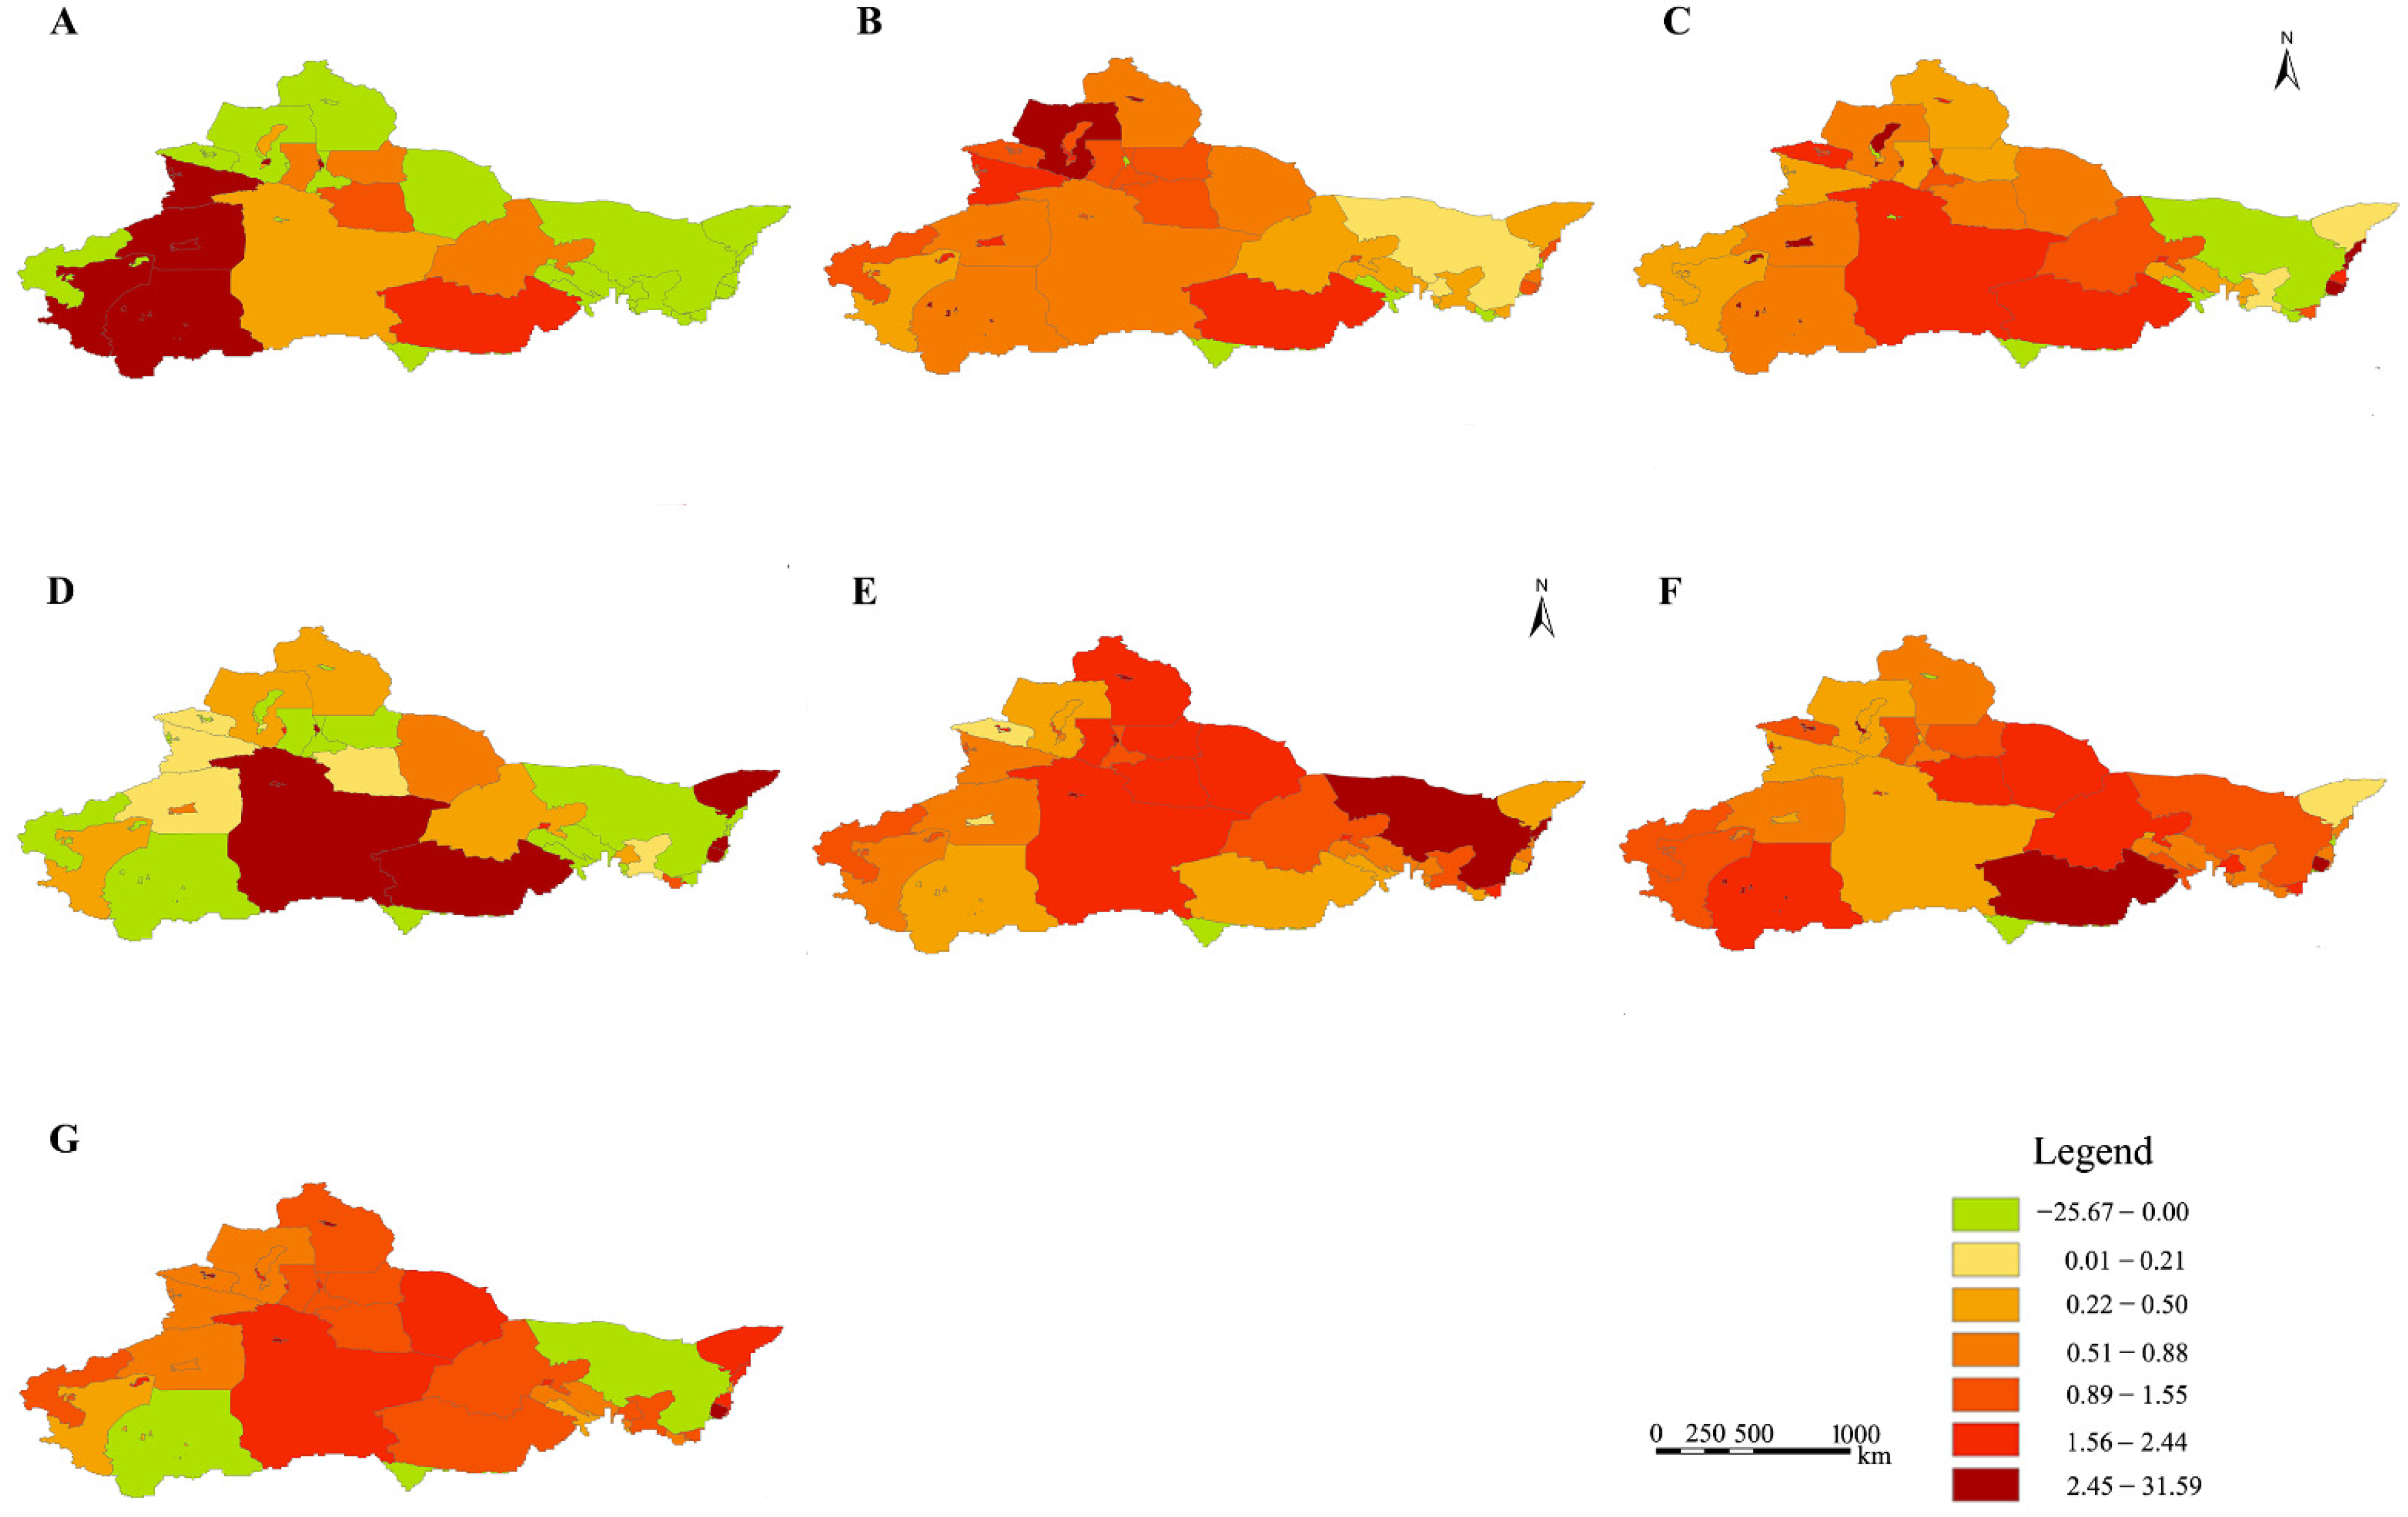
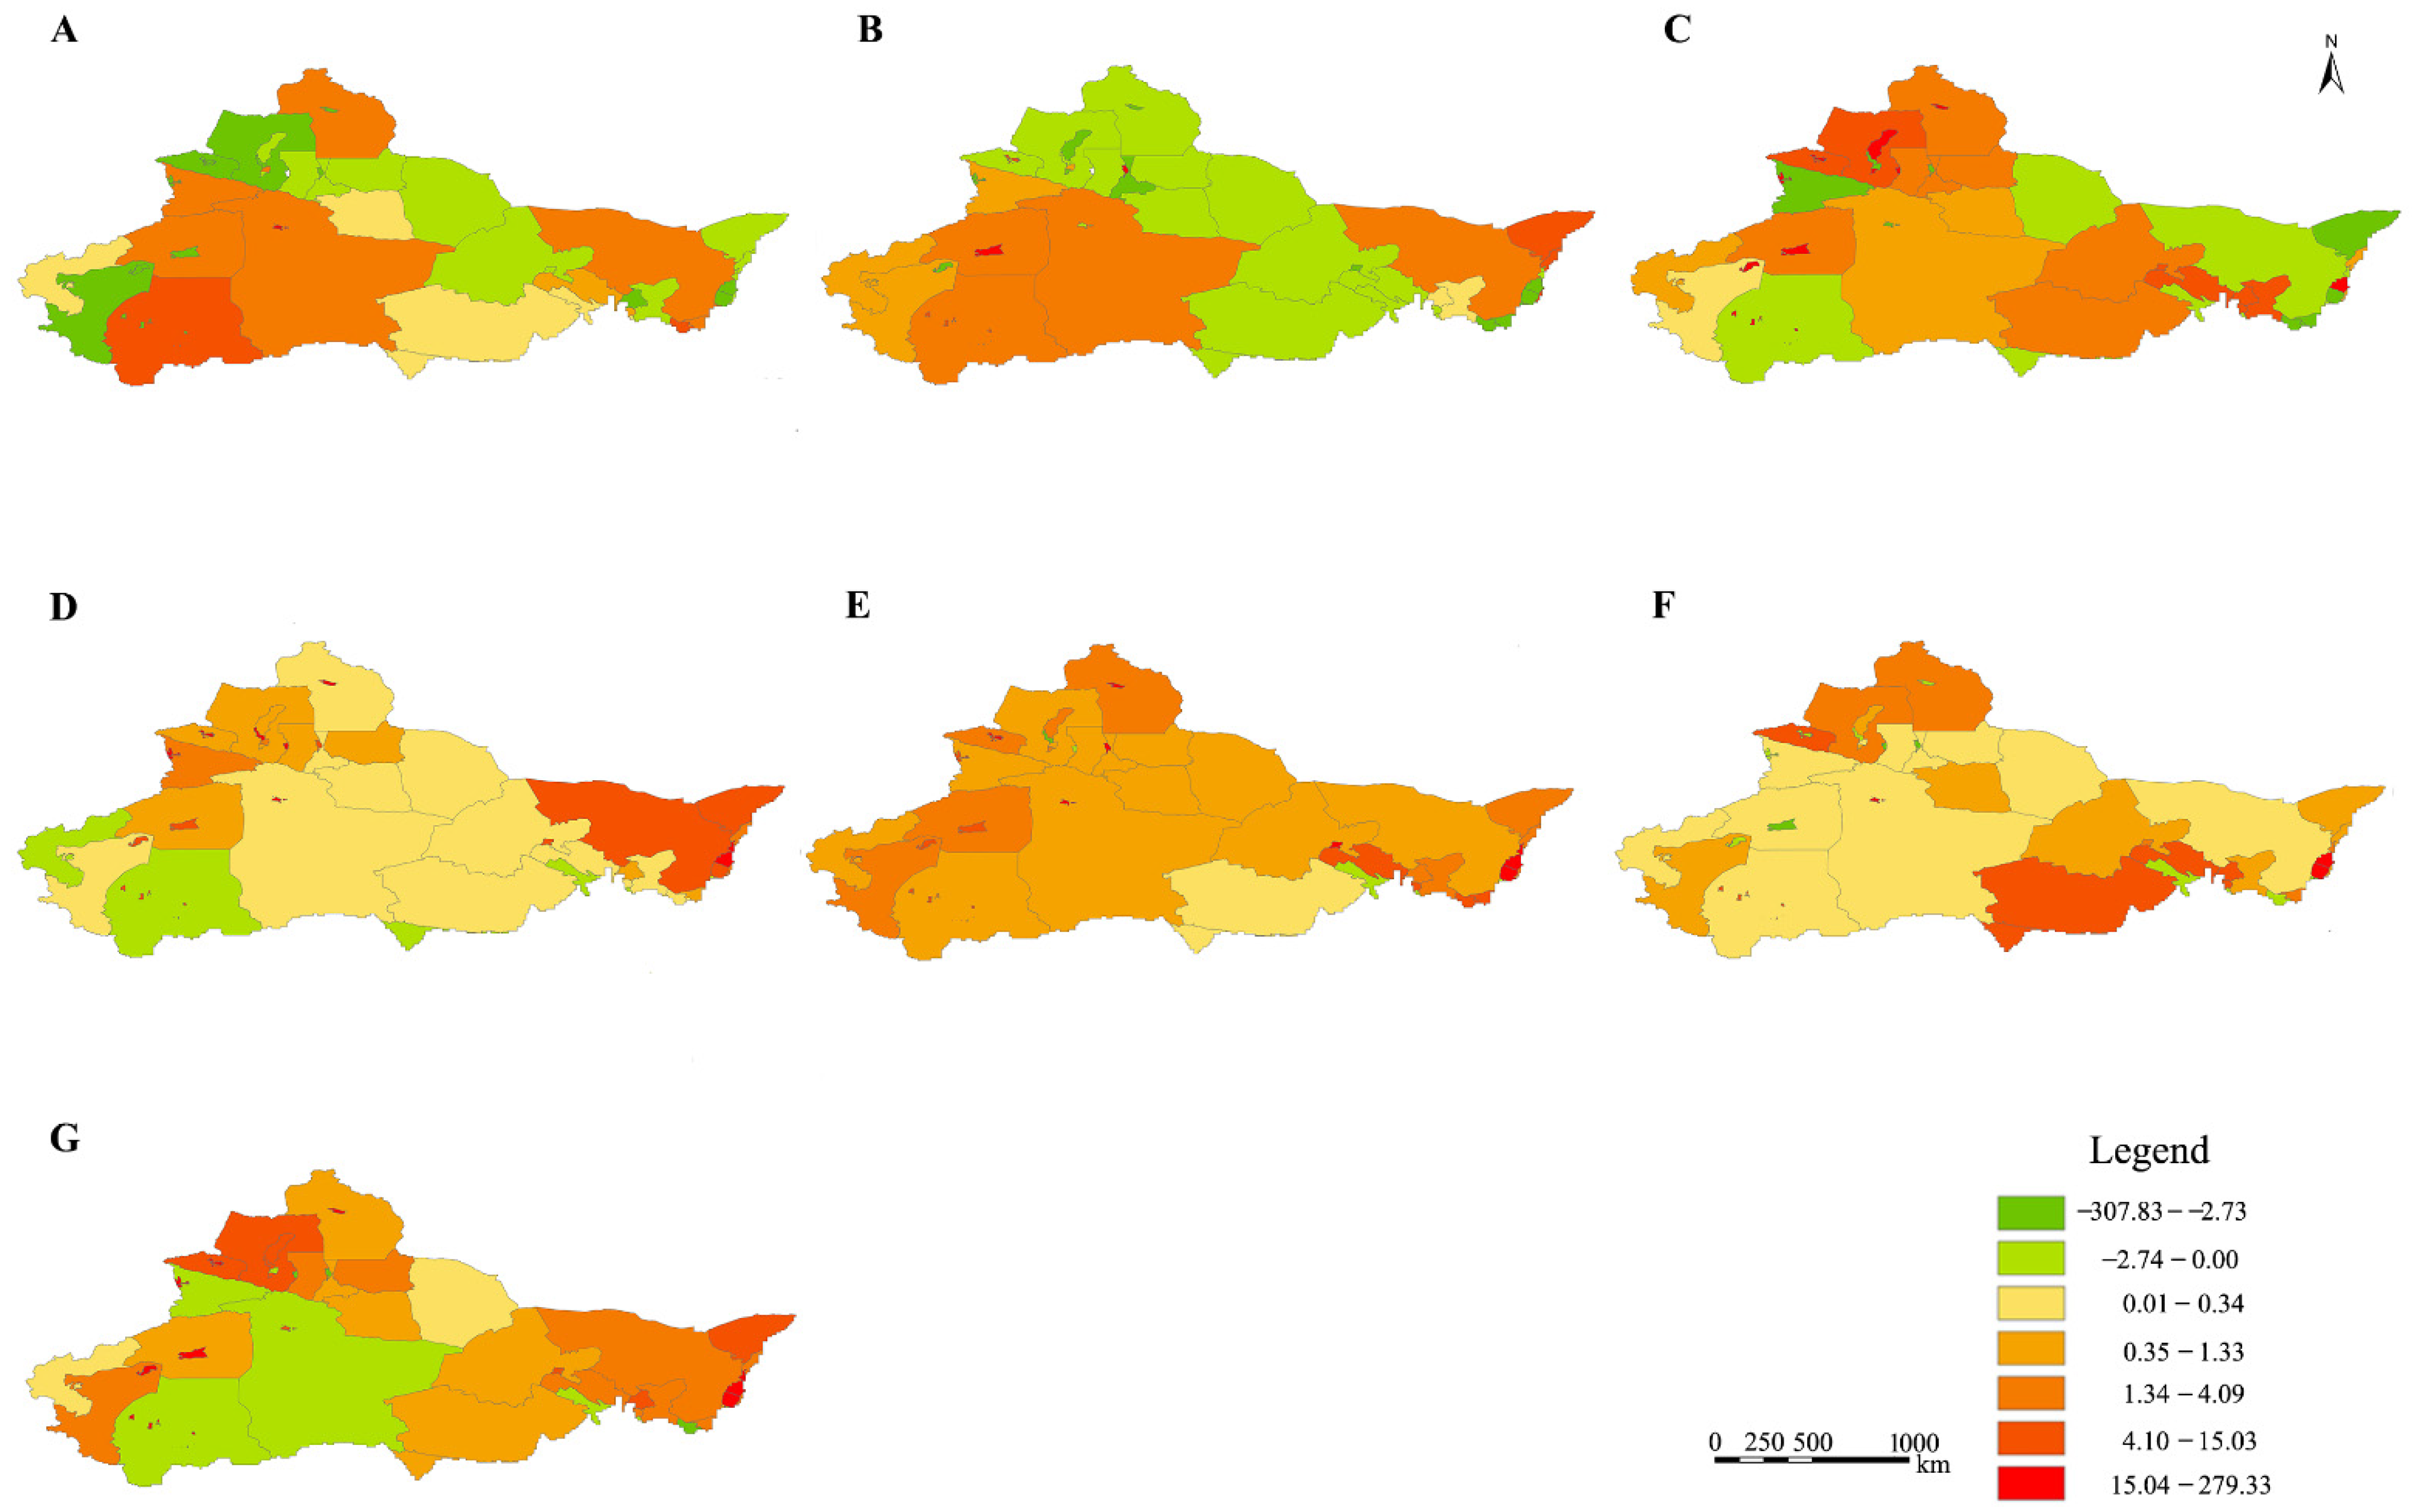
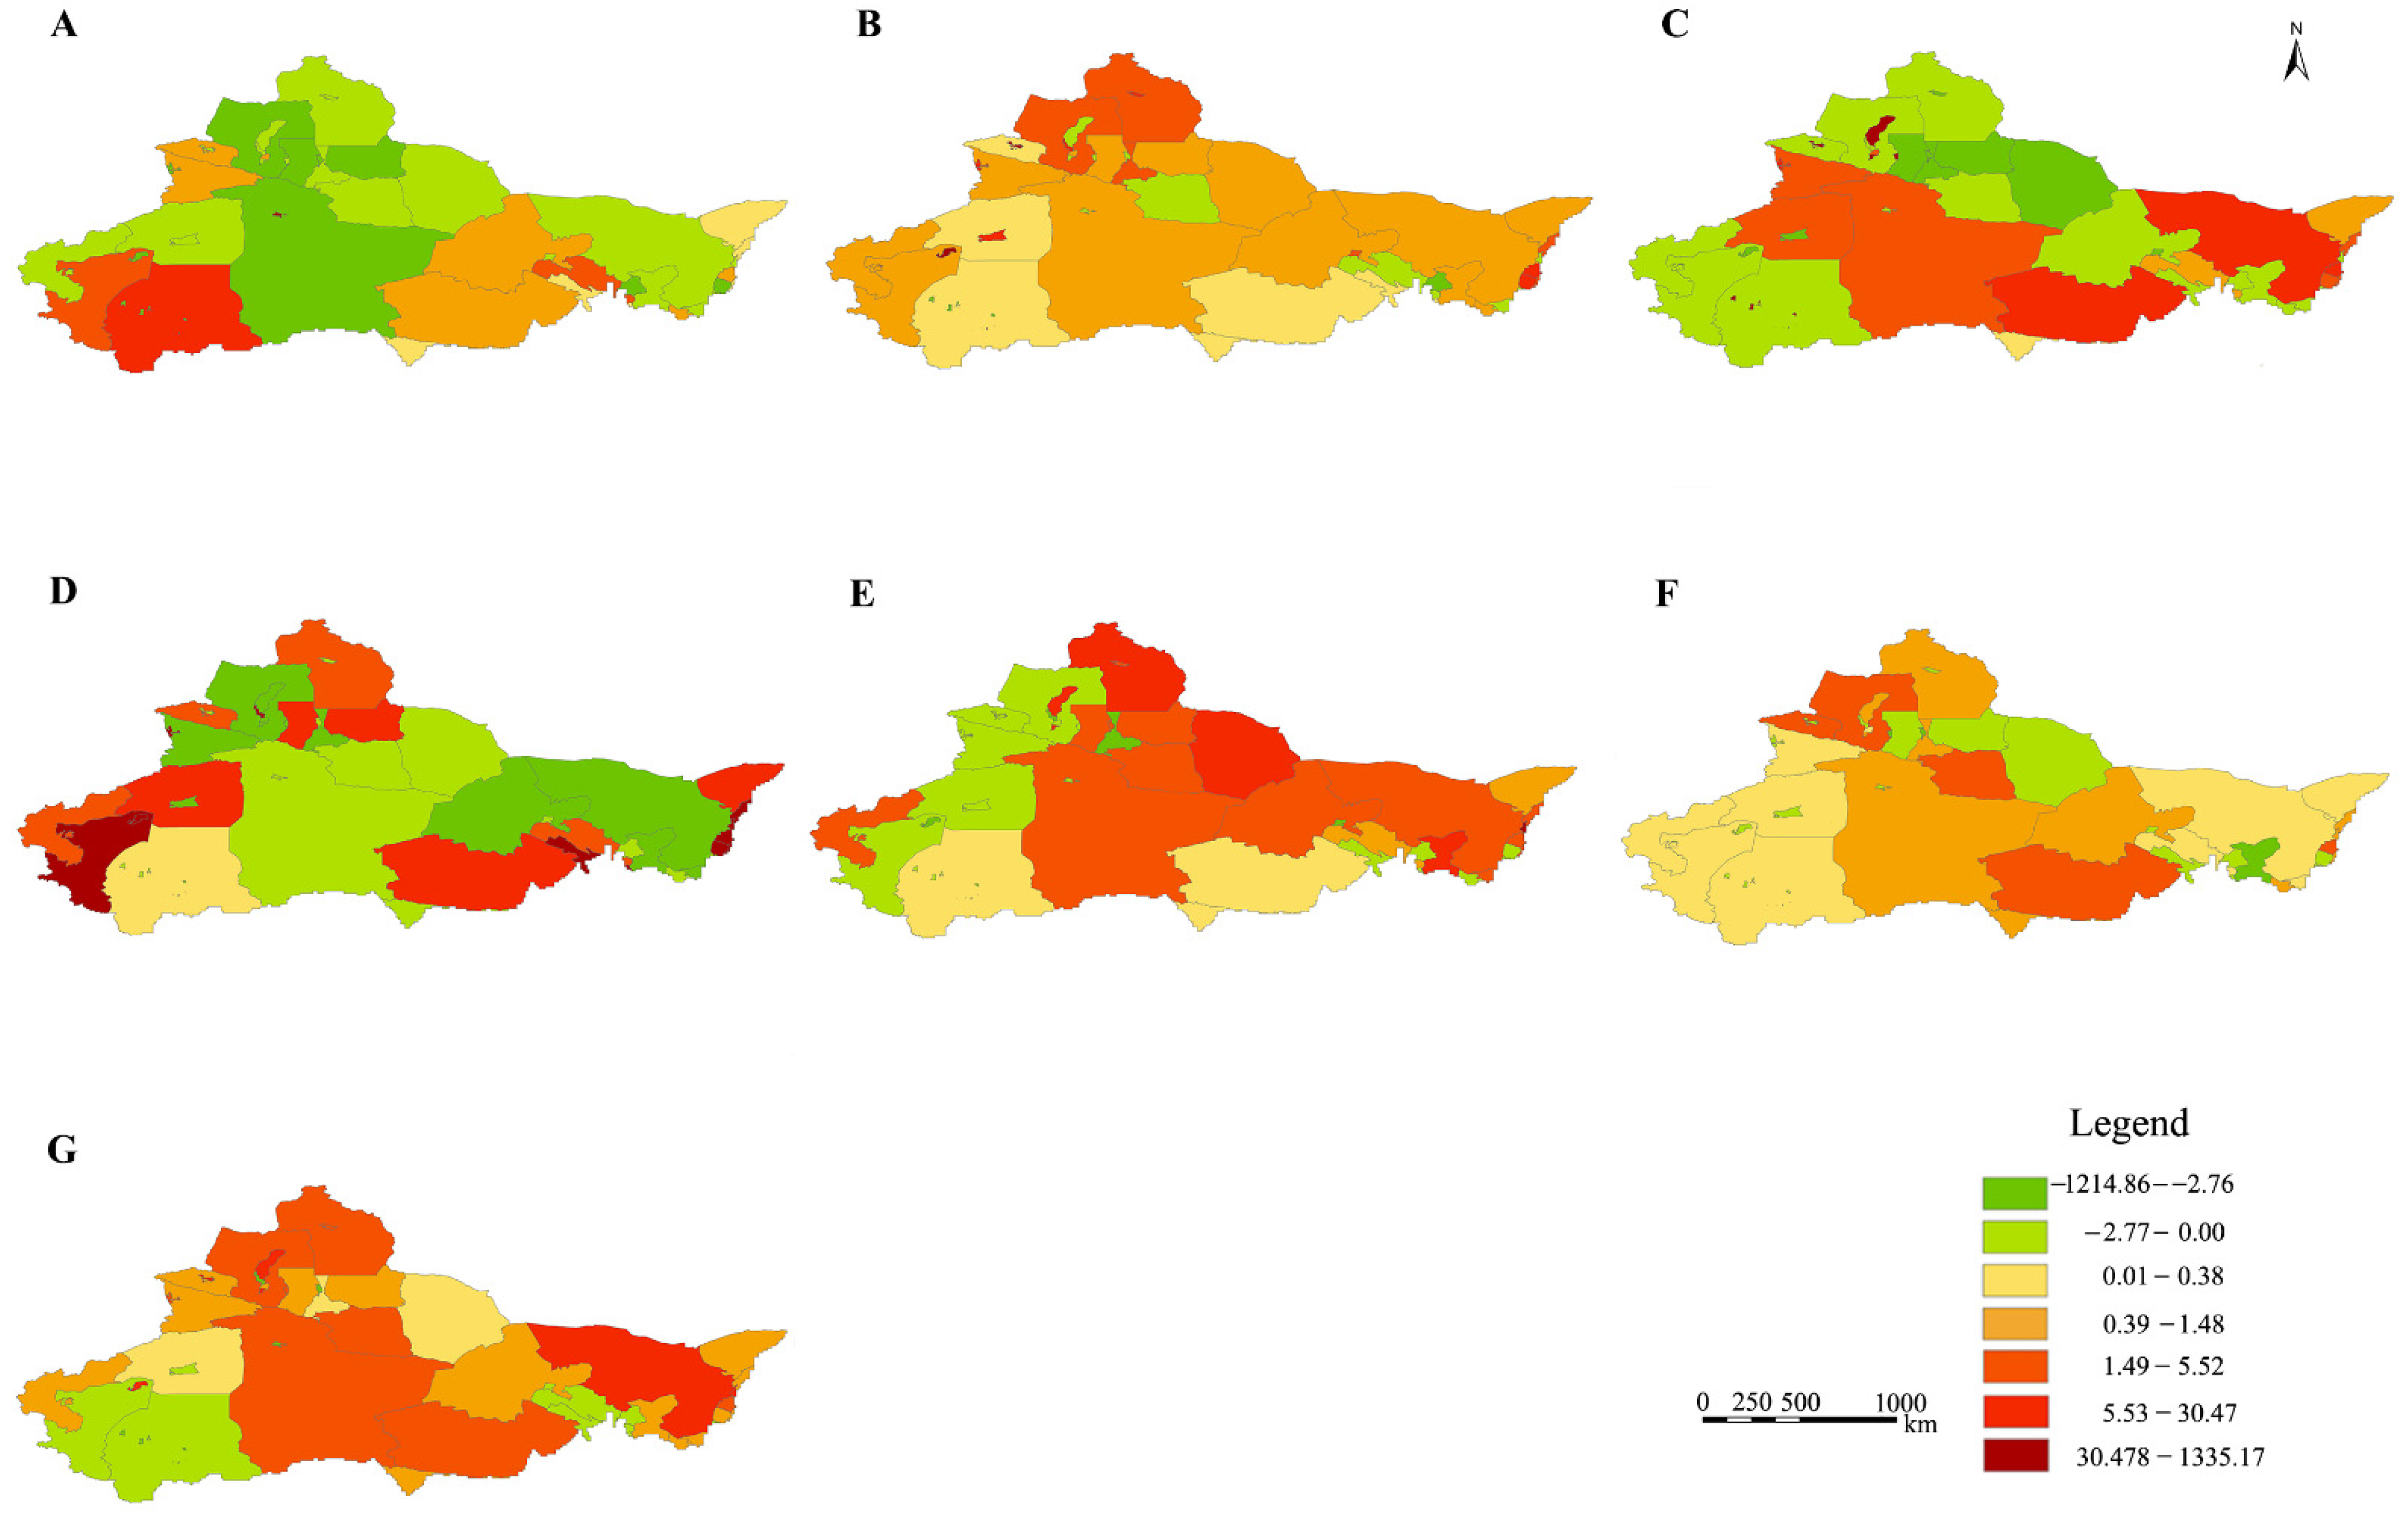
3.2.2. Regional Dynamic Differences
3.3. Dynamic Changes of Landscape Types under Different Simulation Scenarios
4. Discussion
5. Conclusions
Author Contributions
Funding
Informed Consent Statement
Data Availability Statement
Acknowledgments
Conflicts of Interest
References
- Liu, Y.S.; Chen, B.M. The study framework of land use/cover change based on sustainable development in China. Geogr. Res. 2002, 21, 324–330. [Google Scholar]
- Nagendra, H.; Munroe, D.K.; Southworth, J. From pattern to process: Landscape fragmentation and the analysis of land use/land cover change. Agric. Ecosyst. Environ. 2004, 101, 111–115. [Google Scholar] [CrossRef]
- Fu, B.-J.; Lv, Y.-H.; Chen, L.-D.; Su, C.-H.; Yao, X.-L.; Liu, Y. The latest progress of landscape ecology in the world. Acta Ecol. Sin. 2008, 28, 798–804. [Google Scholar]
- Parmesan, C.; Yohe, G. A globally coherent fingerprint of climate change impacts across natural systems. Nature 2003, 421, 37–42. [Google Scholar] [CrossRef] [PubMed]
- Gao, Y.; Huang, J.; Li, S.; Li, S. Spatial pattern of non–stationarity and scale–dependent relationships between NDVI and climatic factors—A case study in Qinghai–Tibet Plateau, China. Ecol. Indic. 2012, 20, 170–176. [Google Scholar] [CrossRef]
- Pettorelli, N.; Vik, J.O.; Mysterud, A.; Gaillard, J.-M.; Tucker, C.J.; Stenseth, N.C. Using the satellite–derived NDVI to assess ecological responses to environmental change. Trends Ecol. Evol. 2005, 20, 503–510. [Google Scholar] [CrossRef]
- Xie, L.L.; Xu, J.L.; Zang, J.M.; Huang, T.N. Simulation and prediction of land use change in Guangxi based on Markov-FLUS model. Res. Soil Water Conserv. 2022, 29, 249–254. [Google Scholar]
- Ma, X.H.; Su, Y.H.; Lin, F.; Dai, C.Y. Land use/cover change and its driving factors in Taiyuan city. Ecol. Sci. 2021, 40, 201–210. [Google Scholar]
- Li, B.; Chen, Y.; Shi, X.; Chen, Z.; Li, W. Temperature and precipitation changes in different environments in the arid region of northwest China. Theor. Appl. Climatol. 2013, 112, 589–596. [Google Scholar] [CrossRef]
- Zheng, S.; Zhang, B.; Peng, D.; Yu, L.; Lin, B.; Pan, Y.; Xie, Q. The trend towards a warmer and wetter climate observed in arid and semi-arid areas of northwest China from 1959 to 2019. Environ. Res. Commun. 2021, 3, 115011. [Google Scholar] [CrossRef]
- Wang, Y.J.; Qin, D.H. Influence of climate change and human activity on water resources in arid region of Northwest China: An overview. Clim. Chang. Res. 2017, 13, 483. [Google Scholar] [CrossRef]
- Wang, T.; Song, X.; Yan, C.Z.; Li, S.; Xie, J. Remote sensing analysis on aeolian desertification trends in northern China during 1975–2010. J. Desert Res. 2011, 31, 1351–1356. [Google Scholar]
- Wang, W.; Feng, Q.S.; Guo, N.; Sha, S.; Hu, D.; Wang, L.; Li, Y. Dynamic monitoring of vegetation coverage based on long time-series NDVI data sets in northwest arid region of China. Pratacultural Sci. 2015, 32, 1969–1979. [Google Scholar]
- Loveland, T.R.; Merchant, J.W.; Ohlen, D.O.; Brown, J.F. Development of a land–cover characteristics database for the conterminous U. S. Photogramm. Eng. Remote Sens. 1991, 57, 1453–1463. [Google Scholar]
- Shi, W.Z.; Ehlers, M. Determining uncertainties and their propagation in dynamic change detection based on classified remotely–sensed images. Int. J. Remote Sens. 1996, 17, 2729–2741. [Google Scholar] [CrossRef]
- Ge, X.-J.; Yu, Y.; Yuan, Y.-M.; Huang, H.-W.; Yan, C. Genetic diversity and geographic differentiation in endangered Ammopiptanthus (Leguminosae) populations in desert regions of northwest China as revealed by ISSR analysis. Ann. Bot. 2005, 95, 843–851. [Google Scholar] [CrossRef]
- Zhao, L.W.; Zhao, W.Z. Evapotranspiration of an oasis-desert transition zone in the middle stream of Heihe River, Northwest China. J. Arid Land 2014, 6, 529–539. [Google Scholar] [CrossRef]
- Guo, B.; Kong, W.H.; Jiang, L. Dynamic monitoring of ecological vulnerability in arid desert ecological region of northwest China and the quantitative analysis of its driving forces. J. Nat. Resour. 2018, 33, 412–424. [Google Scholar]
- Yue, Q.F.; Zhao, X.Q.; Li, S.N.; Tan, K.; Pu, J.W.; Wang, Q. Landscape pattern changes and ecological risk in the Padam River Basin under the background of the “Belt and Road” Initiative. World Reg. Stud. 2021, 30, 839–850. [Google Scholar]
- Zhou, S.Q.; Jing, Y.D.; Zhang, Q.F.; Wu, F.Q. Vegetation landscape pattern change and characteristics of spatial distribution in south edge of Mu Us Sandy Land. Acta Ecol. Sin. 2013, 33, 3774–3787. [Google Scholar] [CrossRef]
- Hu, G.Y.; Dong, Z.B.; Lu, J.F.; Yan, C. Desertification and change of landscape pattern in the Source Region of Yellow River. Acta Ecol. Sin. 2011, 31, 3872–3881. [Google Scholar]
- Duan, H.C.; Wang, T.; Xue, X.; Guo, J.; Wen, X. Spatial-temporal evolution of aeolian desertification and landscape pattern in Horqin Sandy Land: A case study of Naiman Banner in Inner Mongolia. Acta Geogr. Sin. 2012, 67, 917–928. [Google Scholar]
- Xu, X.L.; Li, X.; Xiao, C.J.; Ou, M.H. Land use layout optimization under different scenarios by using the CLUE-S model. Acta Ecol. Sin. 2016, 36, 5401–5410. [Google Scholar]
- Wu, J.S.; Feng, Z.; Gao, Y.; Huang, X.; Liu, H.; Huang, L. Recent progresses on the application and improvement of the CLUE-S Model. Prog. Geogr. 2012, 31, 3–10. [Google Scholar]
- Liu, Y.; Yu, E.T.; Yang, J.J.; Huang, W. Characteristics of spatial and temporal variation of actual evapotranspiration in the arid region of Northwest China from 1960 to 2019. Res. Soil Water Conserv. 2021, 28, 75–80+89. [Google Scholar]
- Chen, L.; Li, H.E.; Zhang, P.; Zhao, X.; Zhou, L.; Liu, T.; Hu, H.; Bai, Y.; Shen, H.; Fang, J. Climate and native grassland vegetation as drivers of the community structures of shrub-encroached grasslands in Inner Mongolia, China. Landsc. Ecol. 2015, 30, 1627–1641. [Google Scholar] [CrossRef]
- Zulkar, H.; Zhao, T.N.; Jiang, Q.O. Boundary scope and change of arid desert area in northwest China. Arid Land Geogr. 2021, 44, 1635–1643. [Google Scholar]
- Zhang, H.F.; Ouyang, Z.Y.; Zheng, H.; Xu, W. Landscape pattern change and its ecological effect in Manas River Basin of Xinjiang, China. Chin. J. Appl. Ecol. 2009, 20, 1408–1414. [Google Scholar]
- Wang, F.; Xie, X.P.; Chen, Z.C. Dynamic evolution of landscape spatial pattern in Taihu Lake basin, China. Chin. J. Appl. Ecol. 2017, 28, 3720–3730. [Google Scholar]
- Yin, D.D.; Wang, Y.H. Temporal and spatial changes of vegetation coverage and its topographic differentiation in temperate continental semi-arid monsoon climate region. Acta Ecol. Sin. 2021, 41, 1158–1167. [Google Scholar]


| Year | NP (Number of Patches) | PD (Patch Density) | LSI (Landscape Shape Index) | CONTAG (Contagion Index, %) | SHDI (Shannon’s Diversity Index) | SHEI (Shannon’s Evenness Index) | AI (Aggregation Degree, %) |
|---|---|---|---|---|---|---|---|
| 1990 | 47,665 | 0.0198 | 112.6909 | 60.4190 | 0.9212 | 0.5141 | 85.7183 |
| 1995 | 46,687 | 0.0194 | 111.0818 | 60.5852 | 0.9201 | 0.5135 | 85.9257 |
| 2000 | 46,068 | 0.0191 | 110.1204 | 60.4942 | 0.9253 | 0.5164 | 86.0501 |
| 2005 | 45,365 | 0.0188 | 109.3393 | 60.3222 | 0.9331 | 0.5208 | 86.1514 |
| 2010 | 45,309 | 0.0188 | 109.7709 | 60.1287 | 0.9386 | 0.5238 | 86.0960 |
| 2015 | 46,331 | 0.0192 | 110.5267 | 59.5760 | 0.9526 | 0.5316 | 85.9994 |
| 2020 | 46,798 | 0.0194 | 111.1301 | 59.3142 | 0.9584 | 0.5349 | 85.9220 |
| Vegetation Type | Year | PLAND (Percentage of Landscape, %) | NP (Number of Patches) | PD (Patch Density) | LPI (Largest Patch Index, %) | LSI (Landscape Shape Index) |
|---|---|---|---|---|---|---|
| Cultivated lands | 1990 | 3.5343 | 4464 | 0.0019 | 0.3802 | 103.9709 |
| 1995 | 3.6629 | 4214 | 0.0017 | 0.4647 | 102.6655 | |
| 2000 | 3.8530 | 3860 | 0.0016 | 0.4933 | 100.0574 | |
| 2005 | 4.1512 | 3444 | 0.0014 | 0.5380 | 95.4676 | |
| 2010 | 4.2080 | 3382 | 0.0014 | 0.5735 | 94.7210 | |
| 2015 | 4.6045 | 3407 | 0.0014 | 0.6310 | 93.6642 | |
| 2020 | 4.6176 | 3418 | 0.0014 | 0.6290 | 93.8907 | |
| Forests | 1990 | 1.6634 | 8375 | 0.0035 | 0.0533 | 117.0449 |
| 1995 | 1.6174 | 8254 | 0.0034 | 0.0513 | 117.5227 | |
| 2000 | 1.6155 | 8112 | 0.0034 | 0.0513 | 117.1722 | |
| 2005 | 1.5990 | 8049 | 0.0033 | 0.0664 | 116.7964 | |
| 2010 | 1.5919 | 8040 | 0.0033 | 0.0663 | 116.9566 | |
| 2015 | 1.5835 | 8050 | 0.0033 | 0.0635 | 117.0230 | |
| 2020 | 1.5803 | 8035 | 0.0033 | 0.0635 | 116.8619 | |
| Grasslands | 1990 | 28.4232 | 15,358 | 0.0064 | 8.0396 | 171.5779 |
| 1995 | 28.1862 | 15,198 | 0.0063 | 7.9093 | 169.2001 | |
| 2000 | 27.8861 | 14,958 | 0.0062 | 7.9177 | 167.0993 | |
| 2005 | 27.6835 | 14,926 | 0.0062 | 7.7055 | 166.0575 | |
| 2010 | 28.1170 | 14,909 | 0.0062 | 7.6785 | 165.9338 | |
| 2015 | 27.7958 | 15,314 | 0.0063 | 7.6042 | 165.8883 | |
| 2020 | 27.7514 | 15,355 | 0.0064 | 7.5967 | 166.1668 | |
| Waters | 1990 | 1.8329 | 8191 | 0.0034 | 0.0627 | 103.3587 |
| 1995 | 1.8098 | 8374 | 0.0035 | 0.0434 | 103.8397 | |
| 2000 | 1.8395 | 8407 | 0.0035 | 0.0432 | 103.6848 | |
| 2005 | 1.8542 | 8402 | 0.0035 | 0.0432 | 103.3593 | |
| 2010 | 1.8535 | 8381 | 0.0035 | 0.0400 | 103.0804 | |
| 2015 | 1.8780 | 8444 | 0.0035 | 0.0408 | 103.2958 | |
| 2020 | 1.9720 | 8515 | 0.0035 | 0.0463 | 102.2746 | |
| Constructive | 1990 | 0.3449 | 3923 | 0.0016 | 0.0137 | 65.6284 |
| lands | 1995 | 0.3382 | 3832 | 0.0016 | 0.0141 | 64.4088 |
| 2000 | 0.3624 | 4022 | 0.0017 | 0.0180 | 65.7540 | |
| 2005 | 0.3881 | 4074 | 0.0017 | 0.0198 | 65.2990 | |
| 2010 | 0.4008 | 4256 | 0.0018 | 0.0202 | 67.1421 | |
| 2015 | 0.5115 | 4710 | 0.0020 | 0.0256 | 70.5785 | |
| 2020 | 0.5676 | 5037 | 0.0021 | 0.0280 | 73.4145 | |
| Unused lands | 1990 | 64.2013 | 7354 | 0.0030 | 57.0431 | 98.8248 |
| 1995 | 64.3854 | 6815 | 0.0028 | 57.3945 | 96.9077 | |
| 2000 | 64.4435 | 6709 | 0.0028 | 57.4806 | 96.1263 | |
| 2005 | 64.3239 | 6470 | 0.0027 | 57.3688 | 95.6023 | |
| 2010 | 63.8288 | 6341 | 0.0026 | 56.8834 | 96.1906 | |
| 2015 | 63.6267 | 6406 | 0.0027 | 56.7146 | 96.9104 | |
| 2020 | 63.5111 | 6438 | 0.0027 | 56.5858 | 97.4515 |
| Year | Index | Cultivated Lands | Forests | Grasslands | Waters | Constructive Lands | Unused Land | Overall Dynamic Degree |
|---|---|---|---|---|---|---|---|---|
| 1990–1995 | Area change (km2) | 3103 | −1108 | −5716 | −557 | −162 | 4440 | |
| Dynamic degree (%) | 0.73 | −0.55 | −0.17 | −0.25 | −0.39 | 0.06 | 0.1614 | |
| 1995–2000 | Area change (km2) | 4583 | −46 | −7238 | 716 | 583 | 1402 | |
| Dynamic degree (%) | 1.04 | −0.02 | −0.21 | 0.33 | 1.43 | 0.02 | 0.0546 | |
| 2000–2005 | Area change (km2) | 7194 | −398 | −4886 | 355 | 620 | −2885 | |
| Dynamic degree (%) | 1.55 | −0.20 | −0.15 | 0.16 | 1.42 | −0.04 | 0.0512 | |
| 2005–2010 | Area change (km2) | 1368 | −171 | 10,454 | −17 | 306 | −11,940 | |
| Dynamic degree (%) | 0.27 | −0.09 | 0.31 | −0.01 | 0.65 | −0.15 | 0.1161 | |
| 2010–2015 | Area change (km2) | 9564 | −204 | −7745 | 590 | 2670 | −4875 | |
| Dynamic degree (%) | 1.88 | −0.11 | −0.23 | 0.26 | 5.53 | −0.06 | 0.0709 | |
| 2015–2020 | Area change (km2) | 316 | −76 | −1073 | 2266 | 1353 | −2786 | |
| Dynamic degree (%) | 0.06 | −0.04 | −0.03 | 1.00 | 2.19 | −0.04 | 0.0244 | |
| 1990–2020 | Area change (km2) | 26,128 | −2003 | −16,204 | 3353 | 5370 | −16,644 | |
| Dynamic degree (%) | 1.02 | −0.17 | −0.08 | 0.25 | 2.15 | −0.04 | 0.0703 |
| Land Type | Natural Development Scenario | Cultivated Land Protection Scenario | Ecological Protection Scenario | |||
|---|---|---|---|---|---|---|
| Area Change (km2) | Dynamic Degree (%) | Area Change (km2) | Dynamic Degree (%) | Area Change (km2) | Dynamic Degree (%) | |
| Cultivated lands | 116,720 | 5.24 | 137,340 | 6.17 | 121,260 | 5.44 |
| Forests | −3782 | −0.50 | −4461 | −0.59 | 148 | 0.02 |
| Grasslands | 40,610 | 0.30 | 32,370 | 0.24 | 28,789 | 0.22 |
| Waters | 29,701 | 3.12 | 28,561 | 3.00 | 37,460 | 3.94 |
| Constructive lands | 33,801 | 12.35 | 25,960 | 9.48 | 33,181 | 12.12 |
| Unused lands | −216,932 | −0.71 | −219,652 | −0.72 | −220,720 | −0.72 |
Publisher’s Note: MDPI stays neutral with regard to jurisdictional claims in published maps and institutional affiliations. |
© 2022 by the authors. Licensee MDPI, Basel, Switzerland. This article is an open access article distributed under the terms and conditions of the Creative Commons Attribution (CC BY) license (https://creativecommons.org/licenses/by/4.0/).
Share and Cite
Li, X.; Zhang, Y.; Liu, Y.; Zhao, T. Dynamic Evolution and Future Prediction of Land Use Patterns in the Arid Desert Region of Northwest China from 1990 to 2020. Forests 2022, 13, 1570. https://doi.org/10.3390/f13101570
Li X, Zhang Y, Liu Y, Zhao T. Dynamic Evolution and Future Prediction of Land Use Patterns in the Arid Desert Region of Northwest China from 1990 to 2020. Forests. 2022; 13(10):1570. https://doi.org/10.3390/f13101570
Chicago/Turabian StyleLi, Xuewu, Yueying Zhang, Yuheng Liu, and Tingning Zhao. 2022. "Dynamic Evolution and Future Prediction of Land Use Patterns in the Arid Desert Region of Northwest China from 1990 to 2020" Forests 13, no. 10: 1570. https://doi.org/10.3390/f13101570
APA StyleLi, X., Zhang, Y., Liu, Y., & Zhao, T. (2022). Dynamic Evolution and Future Prediction of Land Use Patterns in the Arid Desert Region of Northwest China from 1990 to 2020. Forests, 13(10), 1570. https://doi.org/10.3390/f13101570