Article

Fire Impacts on Recruitment Dynamics in a Seasonal Tropical Forest in Continental Southeast Asia

by
Kanokporn Kaewsong
1,*,
Daniel J. Johnson
2,
Sarayudh Bunyavejchewin
3 and
Patrick J. Baker
4
1
College of Environmental Studies, National Dong Hwa University, Shoufeng, Hualien 97401, Taiwan
2
School of Forest, Fisheries and Geomatics Sciences, University of Florida, Gainesville, FL 32611, USA
3
CTFS-ForestGEO, Smithsonian Institution, Bangkok 10220, Thailand
4
School of Ecosystem and Forest Sciences, University of Melbourne, Parkville, VIC 3121, Australia
*
Author to whom correspondence should be addressed.
Forests 2022, 13(1), 116; https://doi.org/10.3390/f13010116
Submission received: 12 December 2021 / Revised: 10 January 2022 / Accepted: 11 January 2022 / Published: 13 January 2022
(This article belongs to the Section Forest Ecology and Management)

Abstract

:
The effects of forest fires on tree recruitment dynamics in tropical forests is important for predicting forest dynamics and ecosystem function in Southeast Asia. To our knowledge, no studies have examined the effects of fire intensity on community-level recruitment patterns in tropical forests due to the rarity of long-term observation datasets in fire-impacted tropical forests and the difficulty of quantifying fire intensity. We addressed two questions: (1) is tree recruitment among species affected by fire intensity? and if so, (2) are there specific plant functional traits associated with these responses? We used data from a long-term forest dynamics plot at the Huai Kha Khaeng (HKK) Wildlife Sanctuary in Thailand. The HKK plot occurs in a strongly seasonal tropical environment and has experienced several fires since its establishment in 1994. We found 46 tree species (52% of the 89 species analysed) showed evidence of reduced recruitment rates with increasing fire intensities during the most recent fire in 2005. Tree species in this flammable landscape have various leaf and wood functional traits associated with fire. Spatial and temporal variability in fire activity may lead to alterations in long-term taxonomic and functional composition of the forest due to selection on fire-related traits.

1. Introduction

Forest fire plays an important role in influencing forest structure and composition, particularly in many regions that experience seasonal climate variability [1,2,3,4,5,6,7]. Fire directly impacts species and community dynamics by acting as a demographic filter, killing trees that are most susceptible due to their size or lack of adaptations to fire. In doing so, fires make resources available for recruitments of new individuals or surviving trees to take advantage of the newly available resources. Community-level recruitment dynamics and subsequent patterns of relative abundance in the wake of a fire will depend on the spatial variability of fire intensity and the resultant mortality. Community-level recruitment patterns have been studied in many temperate and boreal forests [8,9,10], but relatively few tropical forests [11,12]. There are several reasons for this. Firstly, many tropical forests occur in regions that experience aseasonal wet climate conditions and therefore little fire. Secondly, long-term observations of fire activity in tropical forests are rare. And, thirdly, unlike their temperate counterparts few tropical species have annual growth rings to enable reconstruction of historical disturbance events (but see Baker, et al. [13]) and their impact on community structure [14].
Forest fires are a common feature of seasonal tropical forests around the world. These fires are typically low-intensity surface fires that burn along the forest floor [15,16,17]. Seasonal tropical forests typically experience a 3–6 month long dry season during which the lack of rainfall and low relative humidity lead to leaf shedding in the forest canopy and drying of the forest understorey [18,19]. Dry season conditions provide the fuels necessary to carry low-intensity surface fires. In deciduous forests, these fires can spread throughout the landscape, primarily killing understorey vegetation, but occasionally wounding or killing large trees [16,19].
In seasonal tropical landscapes that support a mosaic of deciduous and evergreen forests, the deciduous forests may experience fires every 2–10 years. In contrast, the evergreen forests experience fire much less frequently because the persistent canopy cover ensures that the forest floor is shaded, humid, and relatively cool during the dry season. As a consequence, fires in these landscapes often burn through the deciduous forests only to die out upon reaching the margins of the evergreen forest. However, in years of extreme climatic conditions, such as those associated with strong El Niño–Southern Oscillation (ENSO) events, canopy cover in the evergreen forest may decline as trees drop leaves in response to prolonged and intense drought conditions [20]. Extreme alteration of the microclimate and fuel conditions of the understorey may provide the conditions necessary for surface fires to burn into and through the evergreen forest.
Recent studies of the effects of fire on seasonal tropical forests have focused primarily on the impacts of fire on the trees in the forest at the time of the fire. Because fire-induced mortality is typically size-dependent, low-intensity surface fires typically kill seedlings, saplings, and small trees and have little impact on medium- and large-sized trees. This fire-induced mortality across species varies among sizes of trees [16] and fire intensity [21]. As a consequence, fire may drive changes in tree species abundance due to species-specific size distributions. However, fire may also impact species composition by influencing subsequent patterns of recruitment. Because fire alters local microclimatic conditions and opens previously occupied space and resources, it may favour the recruitment of certain species. However, it is unclear the degree to which the interaction between fire and recruitment shape community composition and subsequent forest dynamics in tropical forests.
Fire may act as a filter shaping the post-disturbance species pool and shifting the relative distribution of functional traits. Plant functional traits are associated with species performance, such as growth and survival, and can provide insights into how plants interact with their living environments [22,23,24,25]. Species that have suitable traits for post-fire conditions might be well adapted to establish. For example, fire-induced mortality may increase light availability at the forest floor, which may favour more shade-intolerant species (high leaf nitrogen, and phosphorus concentrations [26]). We hypothesised that the functional trait distribution of recruits following a fire would be different from the functional trait distribution of recruits during periods without fire. However, there are no studies on the impact of fire intensity and its relation to functional trait distributions of new recruits in seasonal tropical forests. The aim of this study was to examine the effect of variability in fire intensity on tree recruitment patterns in a seasonal evergreen forest in continental Southeast Asia. We addressed the two specific questions:
  • Is regeneration response among species affected by fire intensity?
  • Are functional trait distributions in recruits different during periods with and without fire?

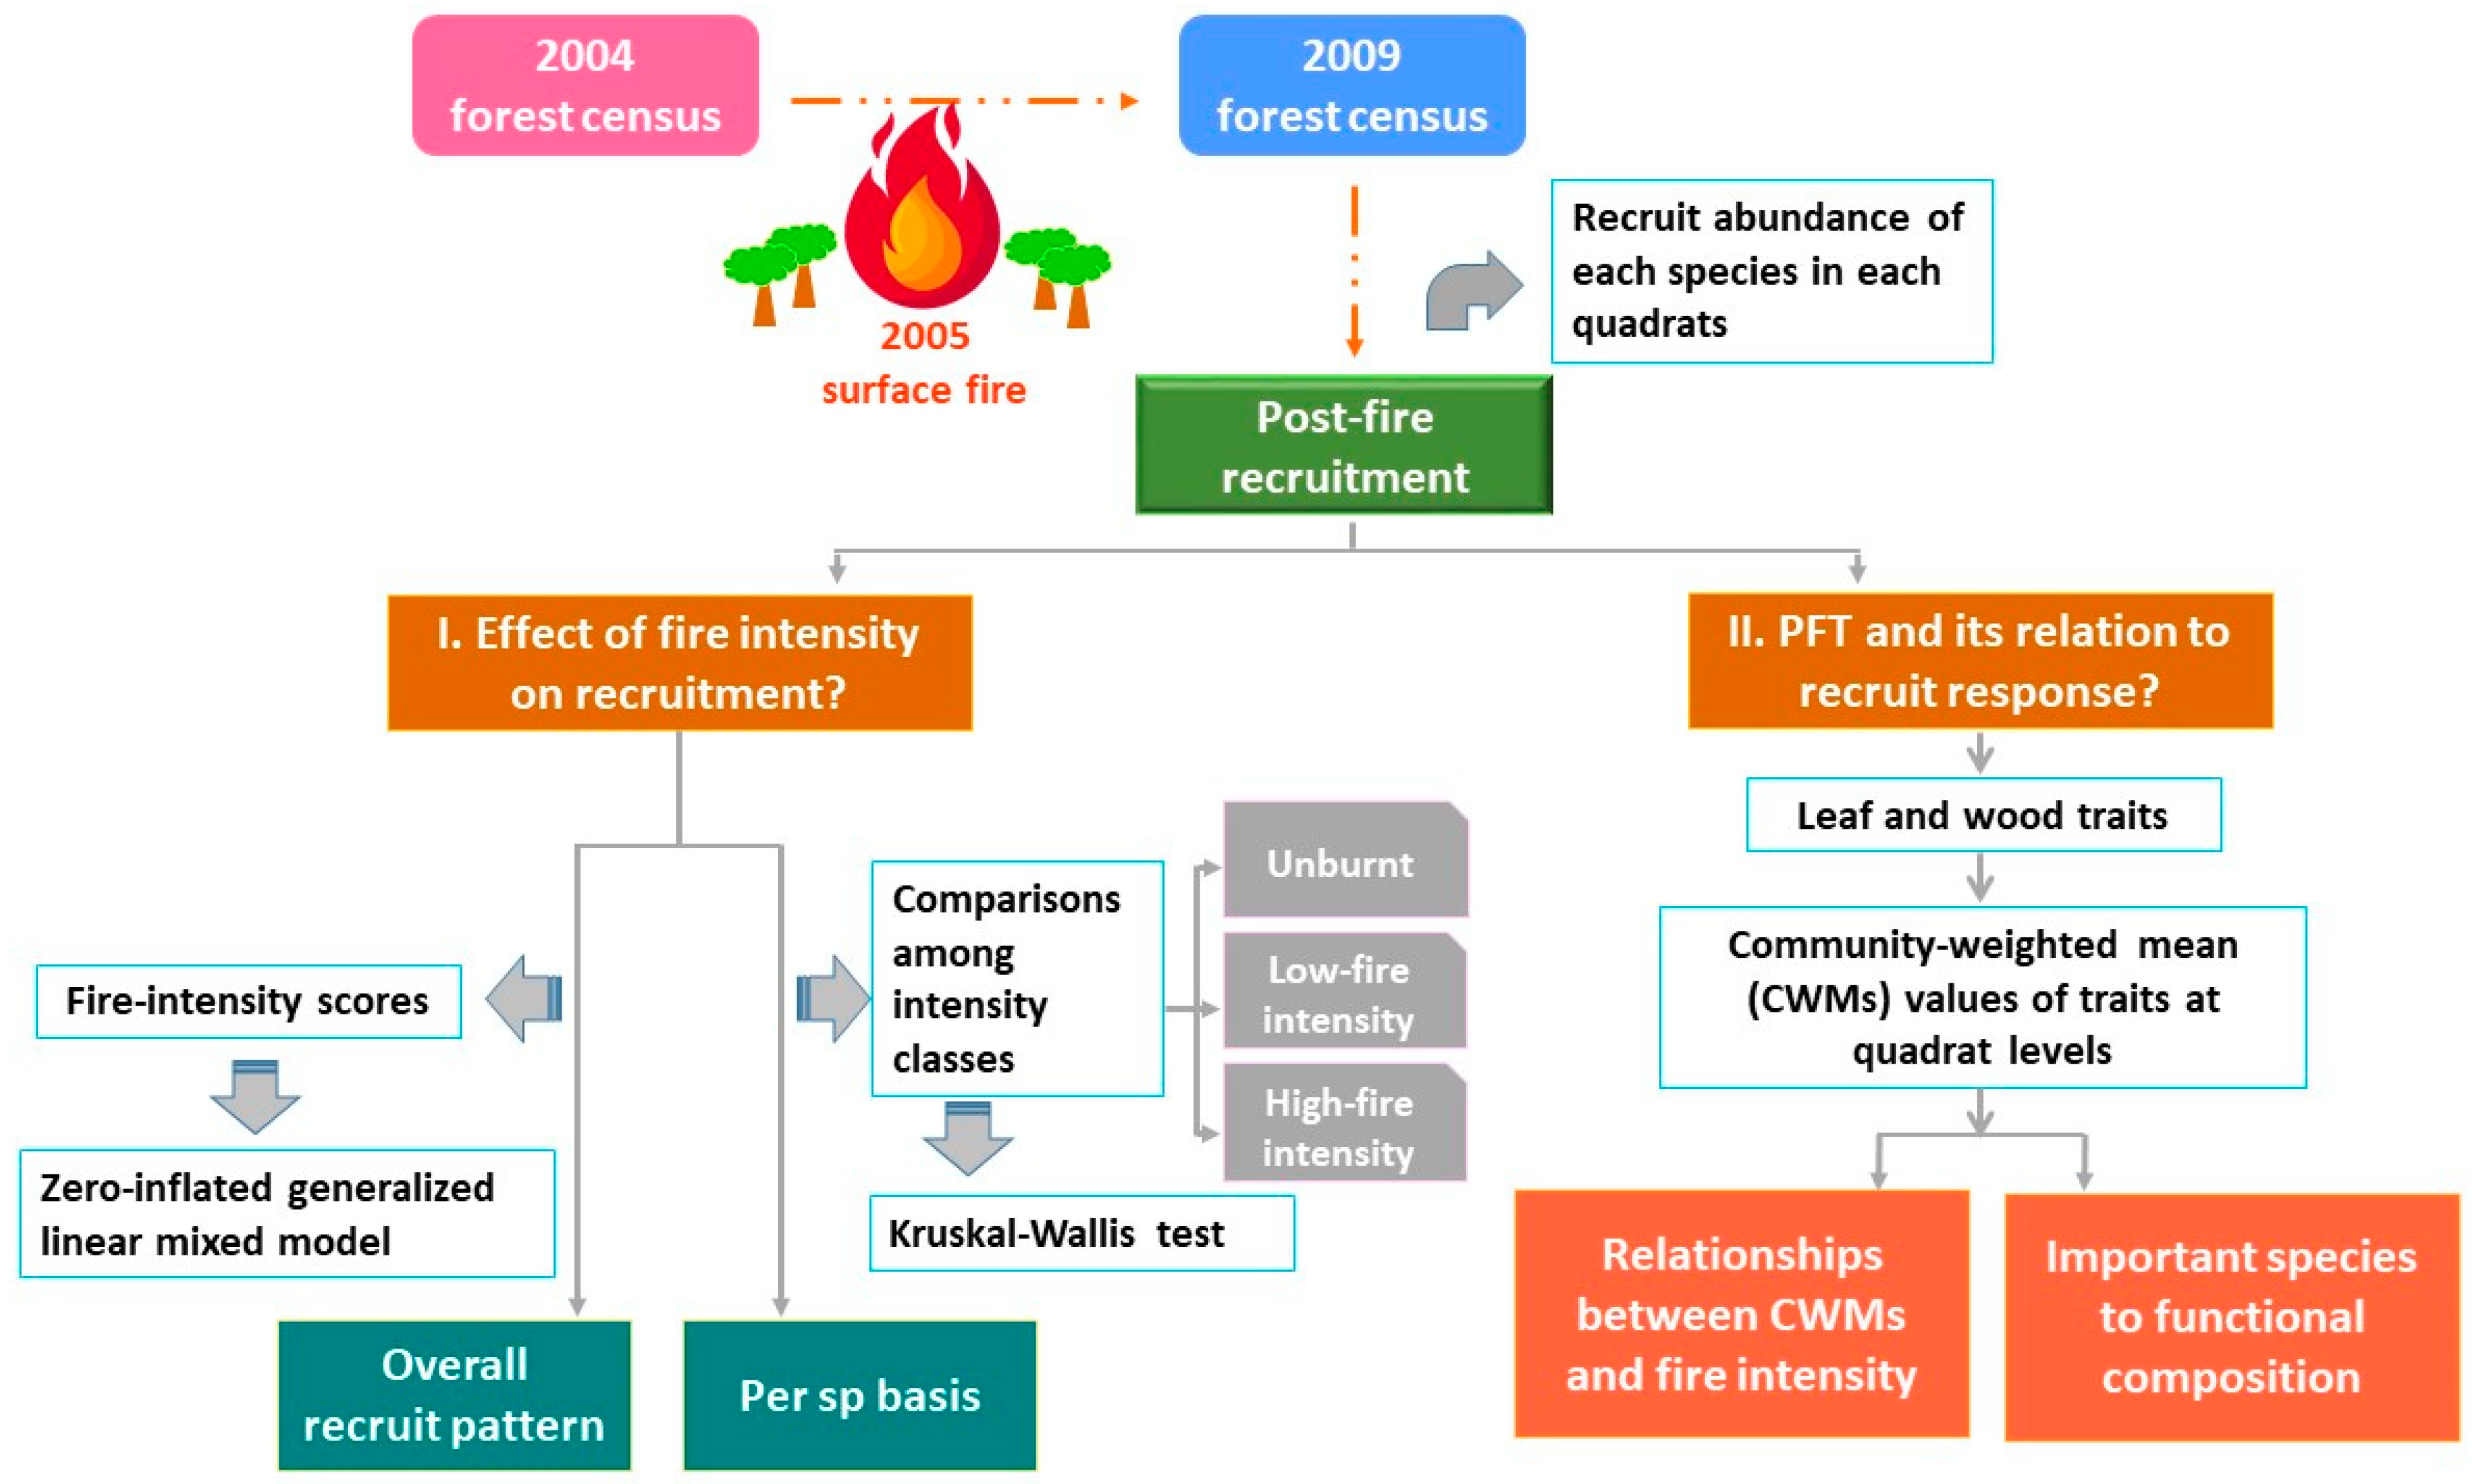
2. Materials and Methods
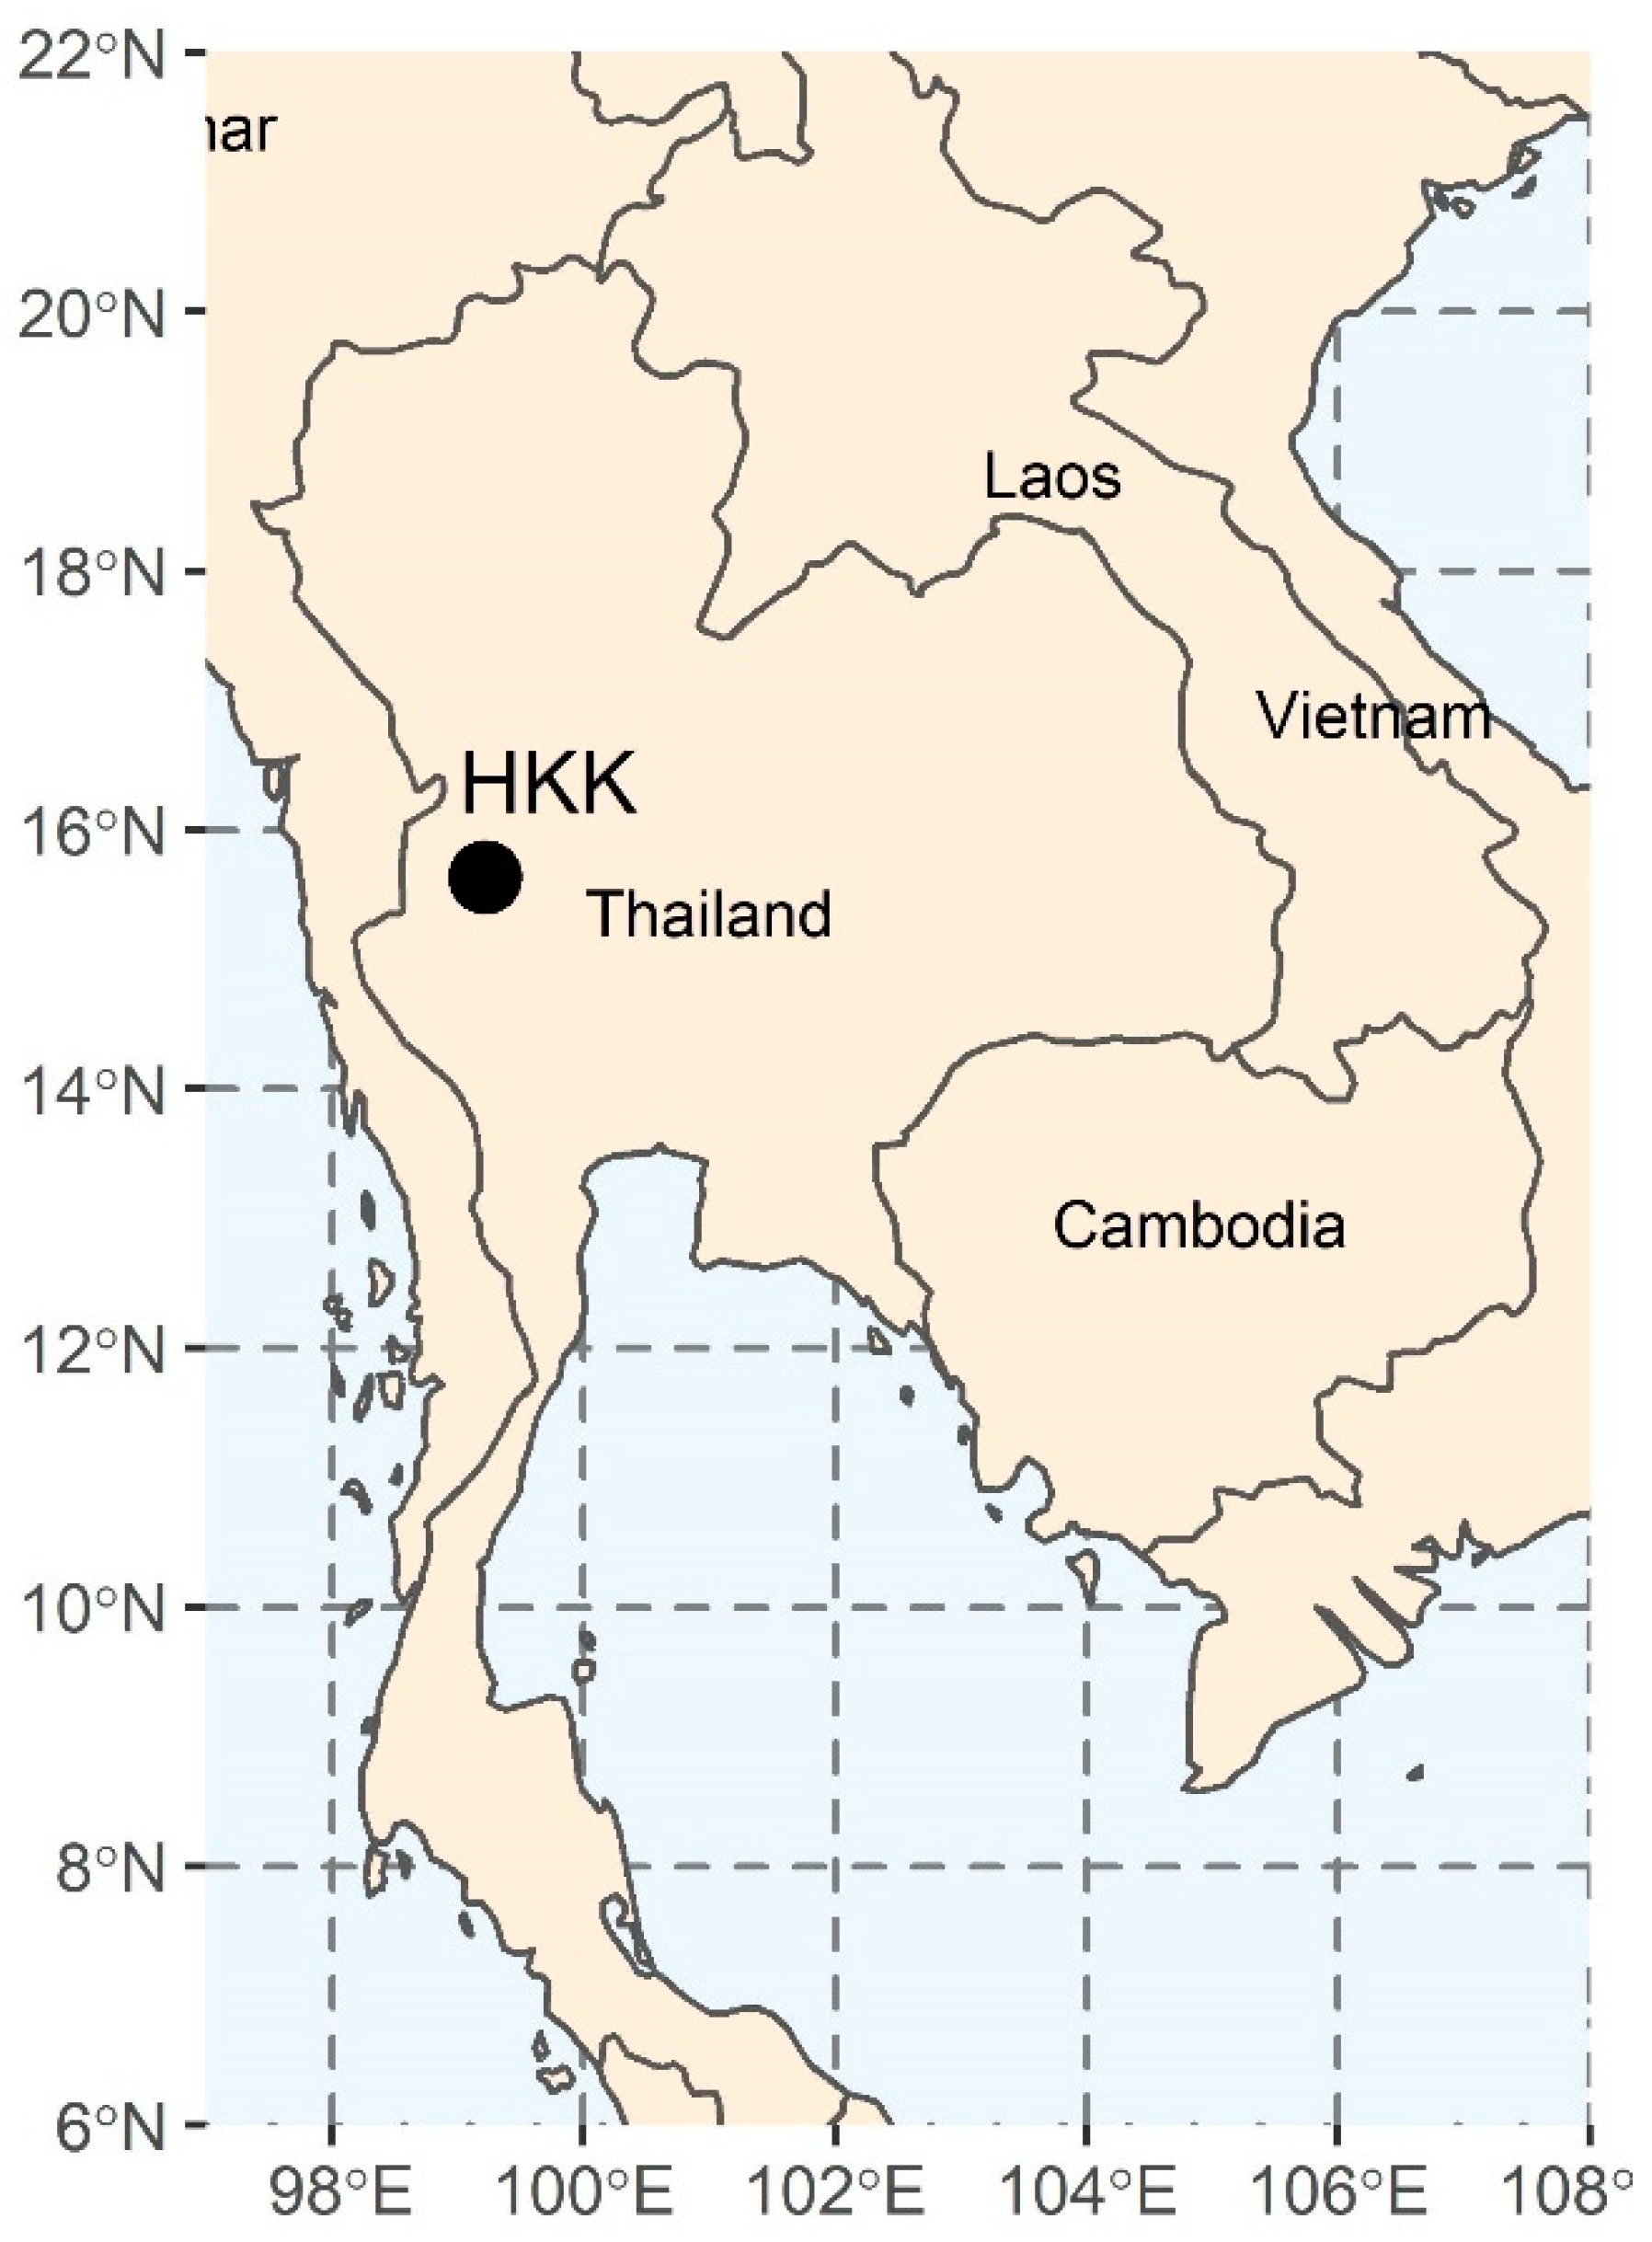
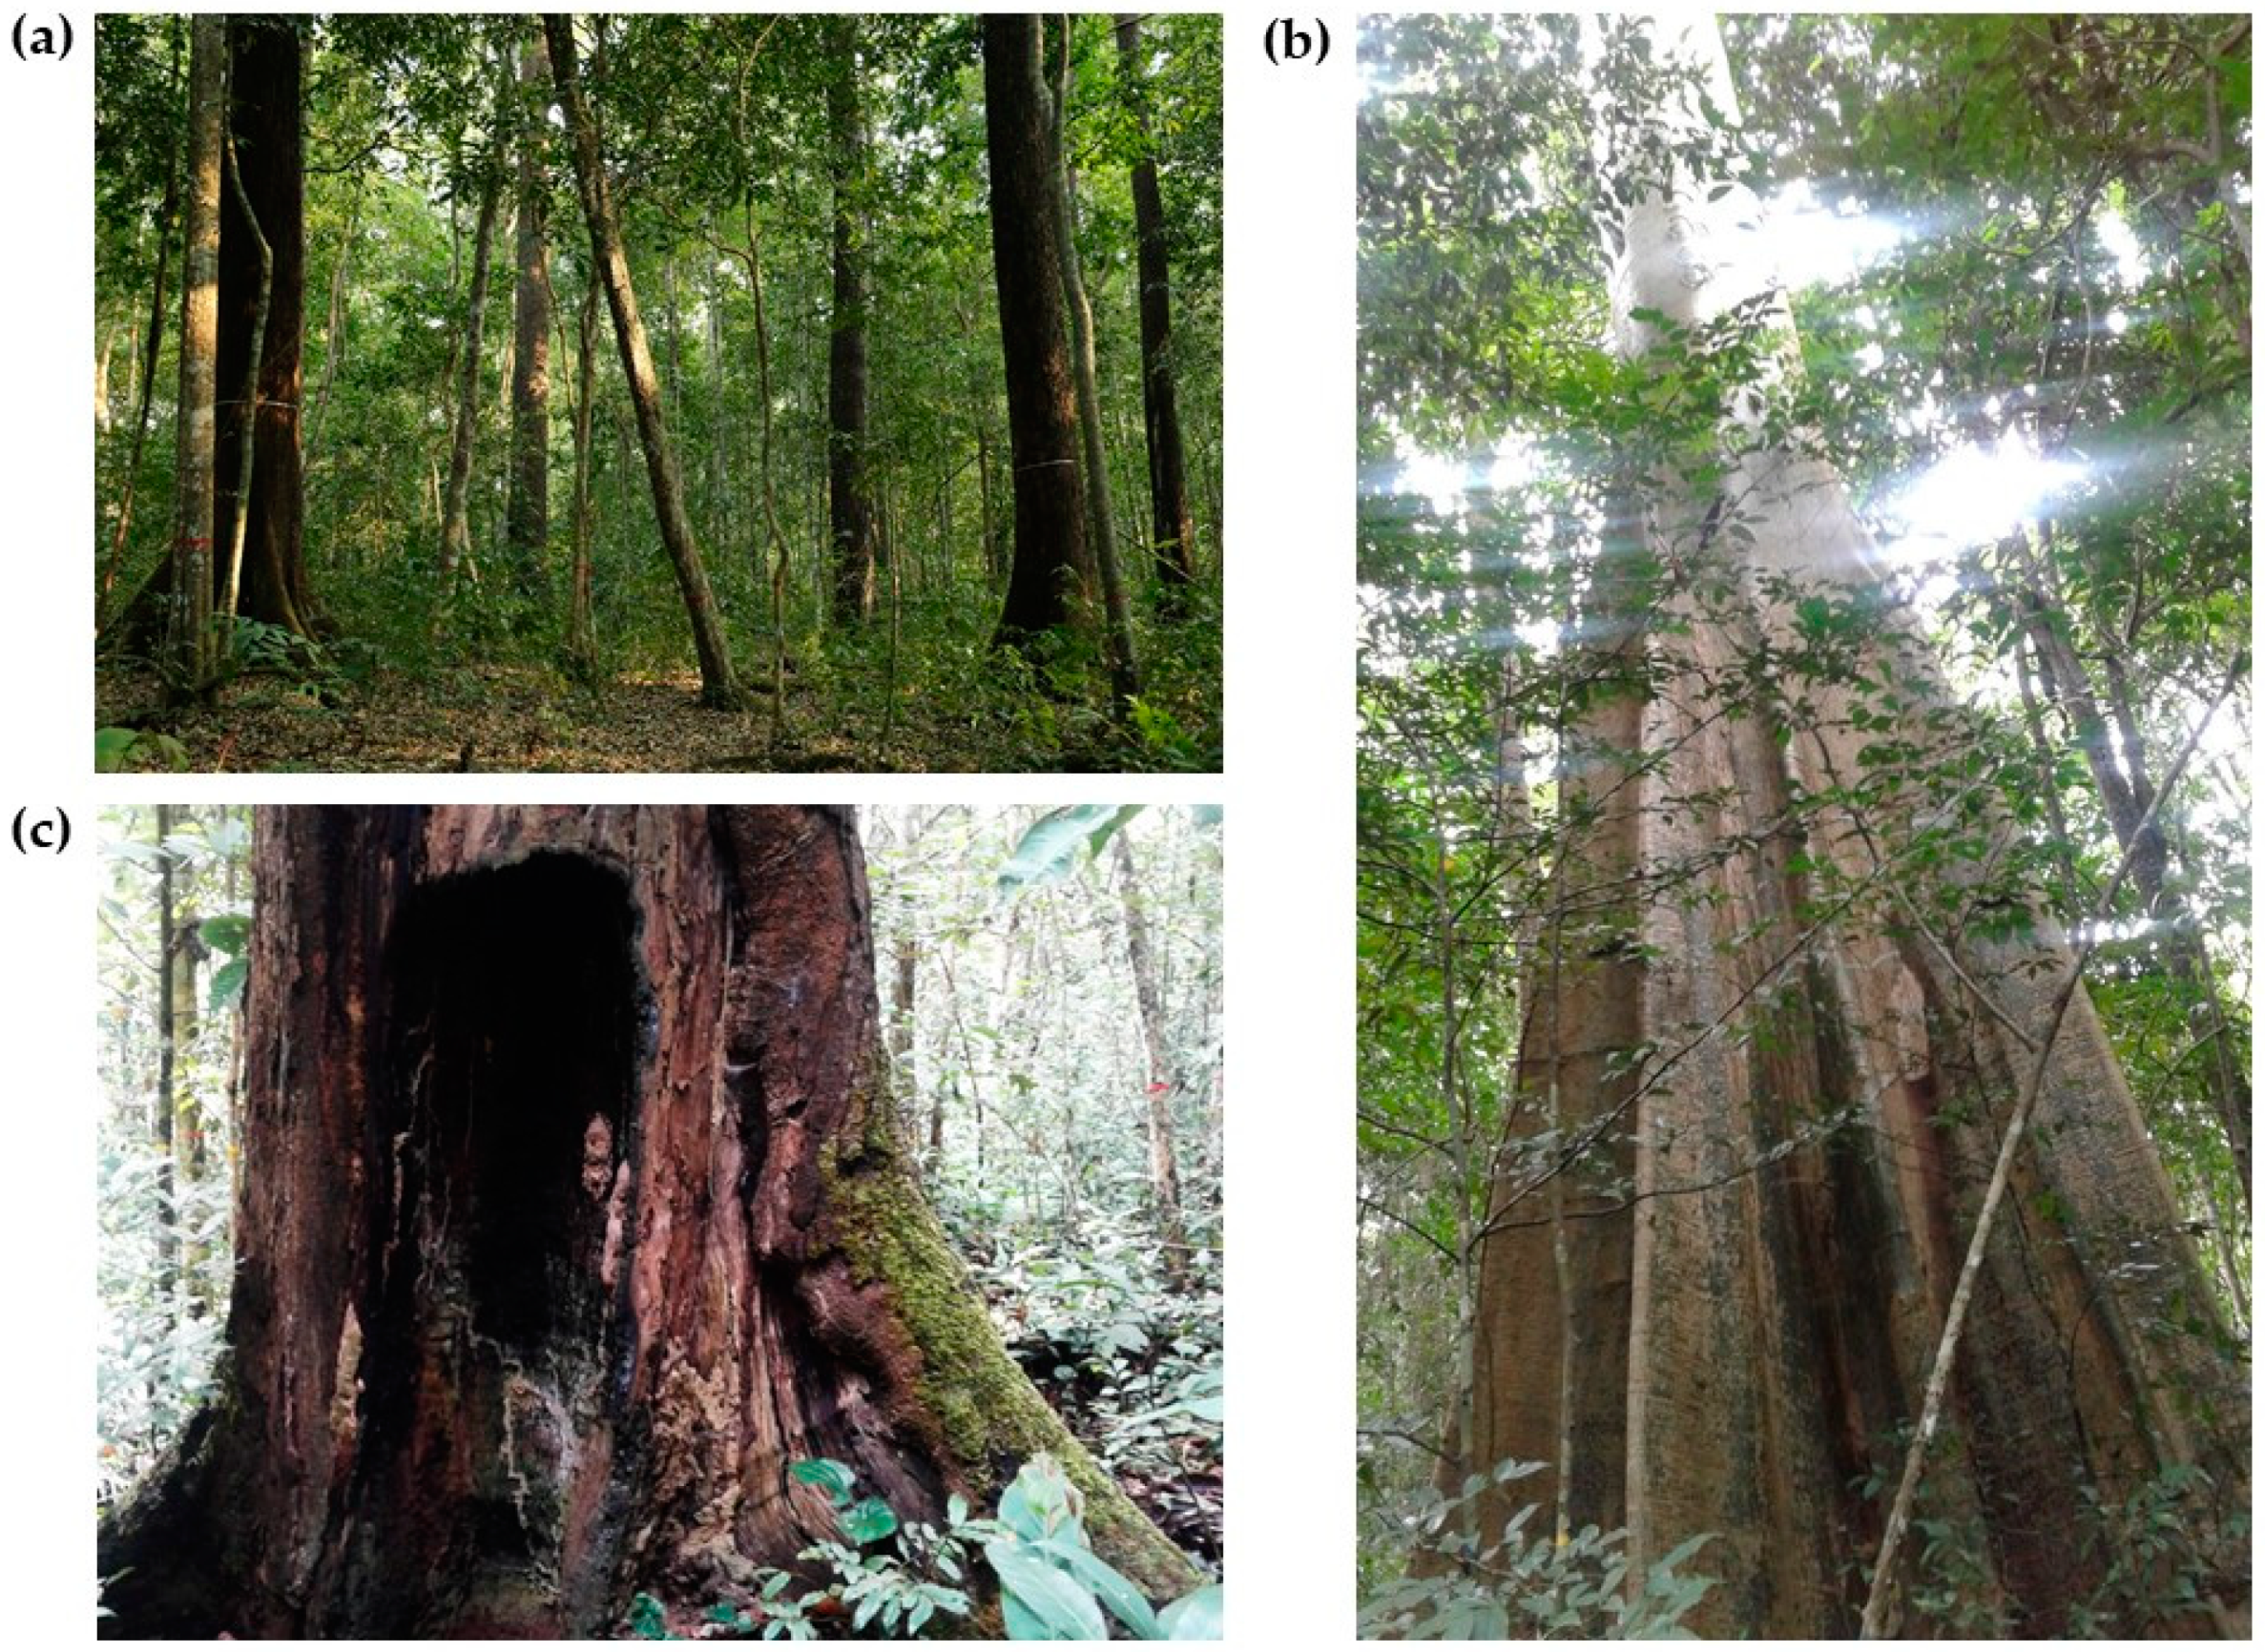
2.1. Study Area

This study was conducted at the Forest Dynamics Plot (HKK FDP) in the Huai Kha Khaeng Wildlife Sanctuary (15°40′ N and 99°10′ E), a UNESCO World Heritage Site, in western Thailand (Figure 1). The HKK FDP is located within a landscape mosaic of three forest types: seasonal dry evergreen forest, deciduous dipterocarp forest, and mixed deciduous forest [27]. The plot is dominated by seasonal evergreen forest, which is the most species-rich of the three forest types. The plot was established in 1992 and has a total area of 50 hectares (1000 m long by 500 m wide). It is divided into 1250 20 × 20 m quadrats and 20,000 5 × 5 m sub-quadrats. Topographic variables such as elevation, slope, and convexity are calculated at the 20 × 20 m quadrat scale using topographic survey data. The elevation range is 549–638 m above sea level. The soils generally have low pH [28]. There is one stream that flows through the northern end of the plot. The climate is strongly monsoonal. The mean annual rainfall is 1473 mm [29] with a distinct annual dry season (months with mean monthly rainfall less than 100 mm) from November to April [27] and rainy season from June to October. The mean annual temperature is 23.5 °C.
All trees in the HKK FDP with diameter at breast height (DBH; measured at 1.3 m above the ground) 1 cm were tagged, measured, identified to species, and mapped following a standard protocol [30,31,32]. The HKK FDP has been censused every five years since 1994; there have been six censuses. The plot contains almost 300 tree species, including 190 genera and 65 families (Figure 2). The Euphorbiaceae family has the most abundant species, Croton roxburghii. The Dipterocarpaceae family is most dominant by basal area, led by Hopea odorata [29]. Approximately 200 trees have diameters larger than 100 cm, including individuals of H. odorata, Anisoptera costata, Dipterocarpus alatus, Lagerstroemia tomentosa, and several species of Ficus.
There are no records or signs of logging or human disturbances in the HKK FDP [29]. Surface fire is the primary disturbance that has been recorded since the plot was established [16,29]. Two surface fires have occurred in the plot since the first census was completed in 1994. The first of these occurred in 1998 and was associated with an intense regional drought triggered by the strong 1997–1998 ENSO event. The 1998 fire burned through the entire 50-ha HKK FDP, killing over 20,000 trees (most were < 5 cm DBH) [16,19]. Some tree species displayed extreme shifts in abundance, notably a >200% increases in Croton roxburghii and near complete extirpation of Solanum erianthum [16]. The second fire, in 2005, burned through approximately two-thirds of the HKK FDP. This fire was recently used to conduct analyses of species-specific susceptibility to fire-induced mortality [21]. A small fire was reported to have burned through several hectares of the southwest corner of the plot in 1992 (J. Grogan, unpublished report), but this was before the completion of the first census, so no data are available describing the reported fire’s impact.

2.2. Workflow and Data

The overview of method and all operation performs of study is shown in Figure 3. Specific details of data and analyses are described in the sections below.

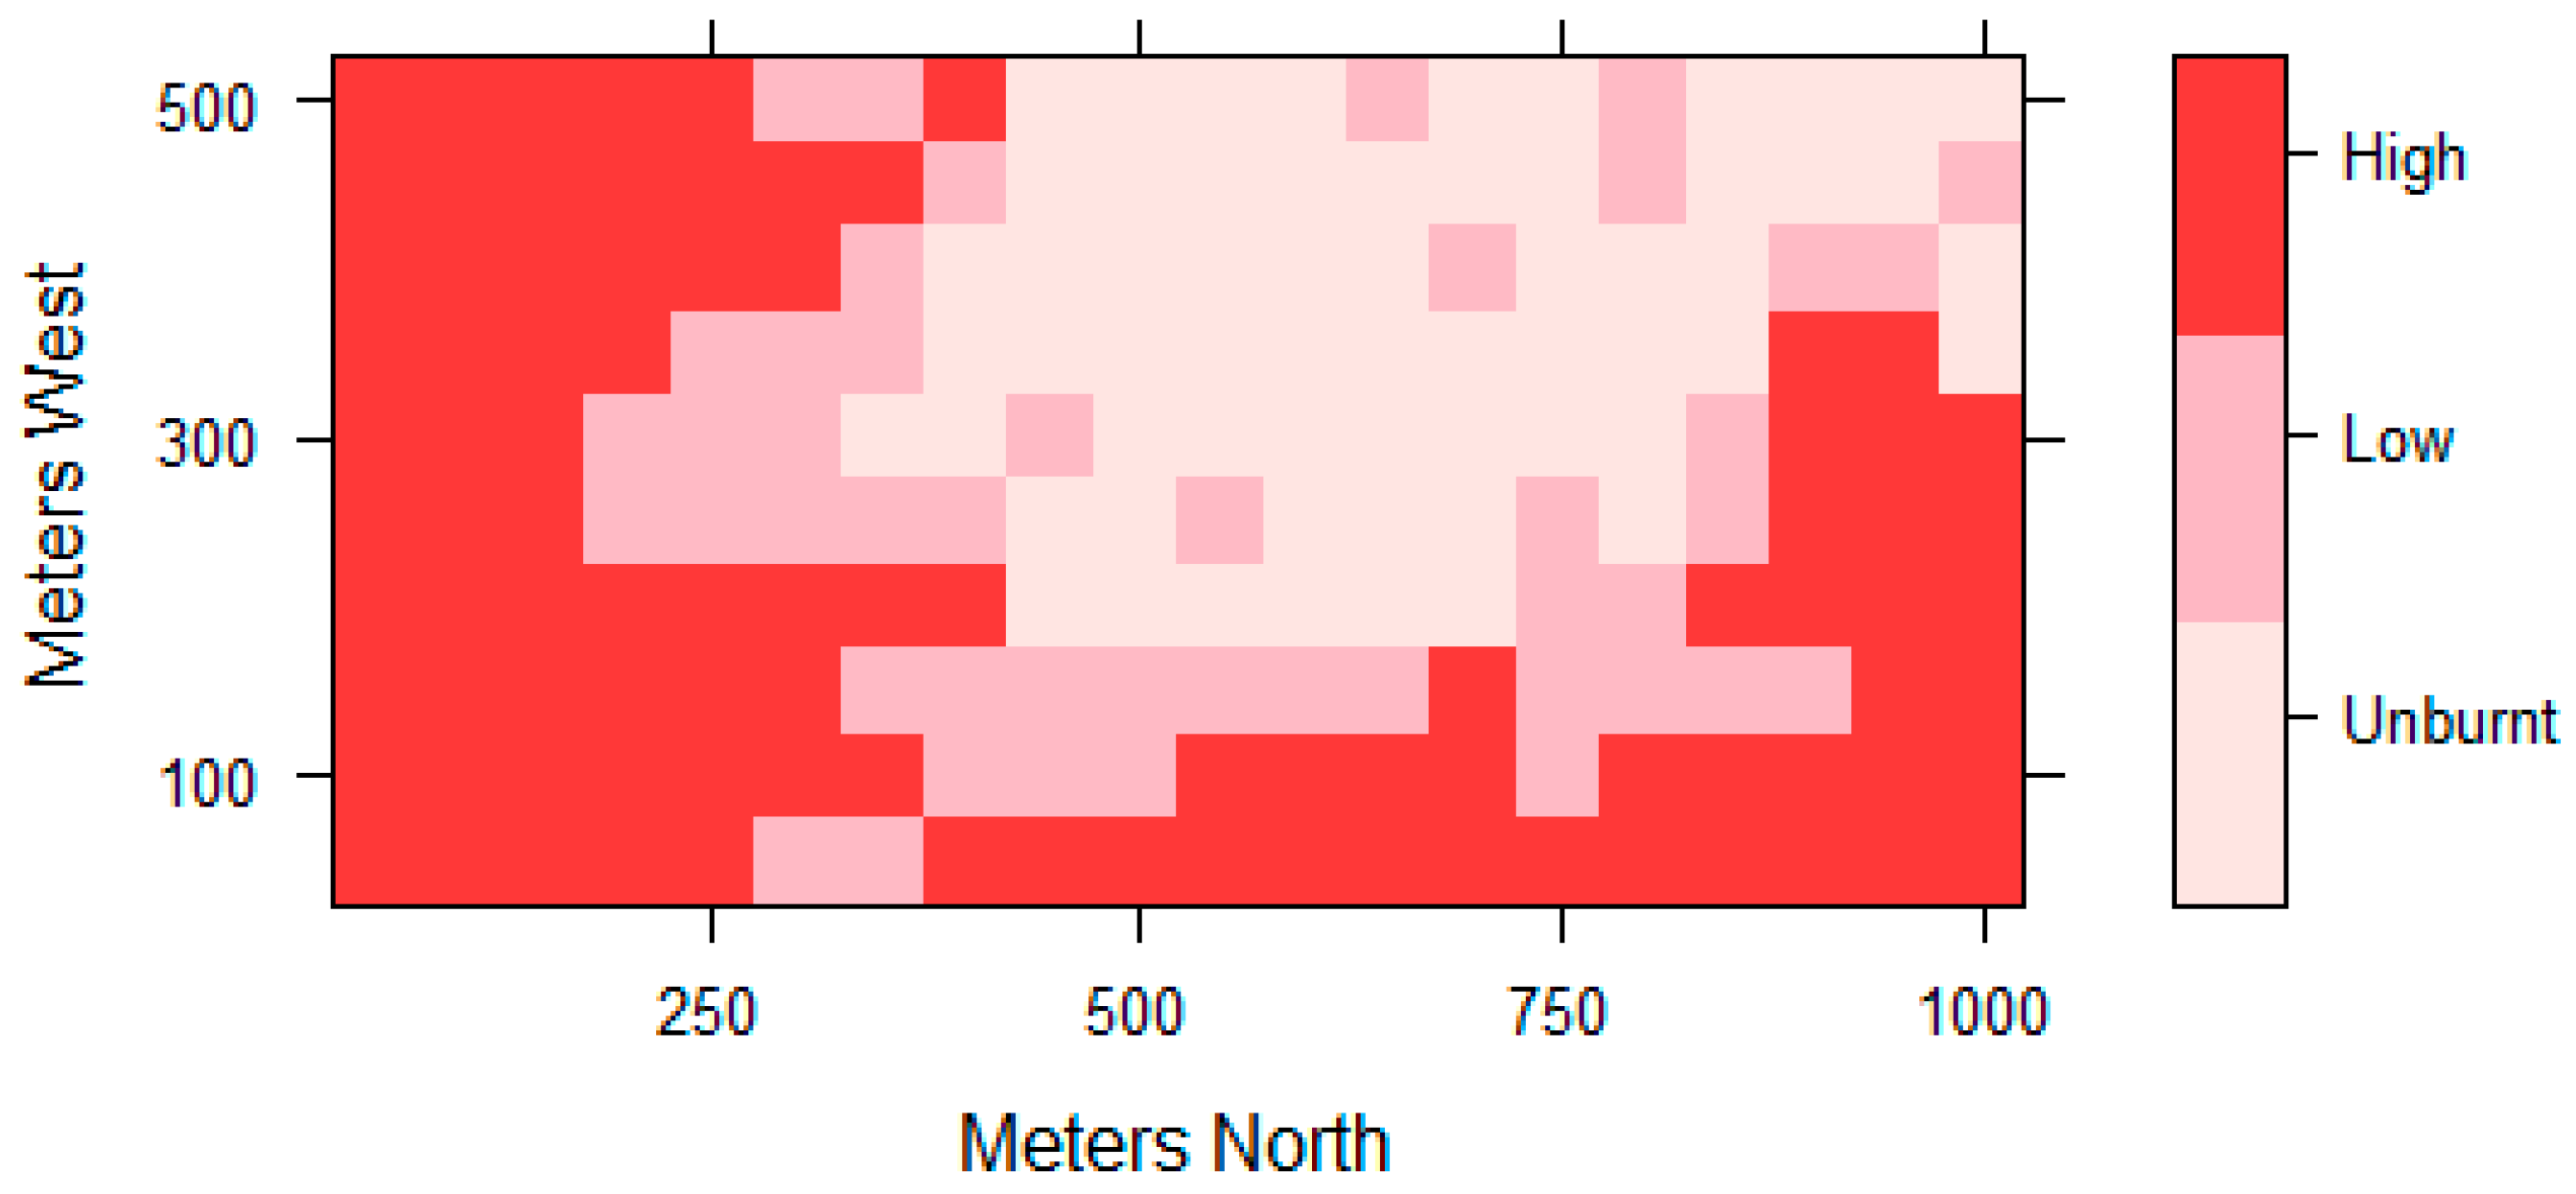
2.2.1. Fire Intensity Classification

The 2005 fire created a mosaic of burn intensities, including no fire, low-intensity fire, and relatively high-intensity fire. We compared recent reconstructions of fire intensity across the plot [21] with recruitment data in the 2004 and 2009 censuses to explore how fire intensity in 2005 may have influenced post-fire recruitment. In total there were 97,104 and 105,905 individual trees in 2004 and 2009, respectively. For our analyses, we excluded species with mean density of <1 tree per ha (i.e., less than 50 individuals) and selected only species that have complete functional trait dataset. This resulted in 89 species being included in this study. We divided the entire plot into 200 quadrats of 50 × 50 m to align with the scale of the fire intensity reconstruction. We then calculated recruits of each tree species in each quadrat using the ‘recruitment’ function in the CTFS R Package from Center for Tropical Forest Science [33]. To analyse the effect of fire intensity on recruitment dynamics, we first used fire intensity data obtained from Trouvé, Bunyavejchewin and Baker [21] as an explanatory variable of species recruit numbers. Fire intensity was calculated as a latent variable for each quadrat based on observed tree mortality between the 2004 and 2009 censuses, modelled background mortality, and modelled species- and size-specific susceptibility to fire-induced mortality. Fire intensity was estimated on a relative scale varying from 0 to 1, with zero being no fire and one being the hottest fire observed. We classified each quadrat as having been unburnt, or experiencing low- or high-intensity fire. A quadrat was considered unburnt if the fire-intensity score was ≤0.1. Quadrats classified as low-intensity fire had fire-intensity scores between 0.1 and 0.5. Quadrats with fire-intensity scores >0.5 were classified as high-intensity fire. Altogether, there were 62, 46, and 92 quadrats classified as unburnt, low-, and high- intensity fire areas, respectively (Figure 4).

2.2.2. Functional Trait Dataset and Their Measurement

Functional trait data were collected from June to September 2016 by scientific staff from the Xishuangbanna Tropical Botanical Garden (XTBG). Samples were collected from at least three individuals of each tree species and at least three leaves were collected for each tree. All leaf samples were collected from small to big trees and throughout the area of the plot. We measured nine standard leaf functional traits using the methods described in Pérez-Harguindeguy, et al. [34] (see Table 1 for a summary of the variables, their measurement units, and abbreviations). Wood samples were collected from trees outside the plot. Wood density (WD) was measured using the standard CTFS/ForestGEO protocol (www.forestgeo.si.edu/protocols, accessed on 1 June 2016). In total, 89 species, for which we had all functional trait measurements were included in this analysis.

2.3. Data Analysis

2.3.1. The Effect of Fire Intensity on Recruit Abundance for All Species and on a per Species Basis

We used the 2009 census data to determine the number of recruits of each species in each 50 × 50 m quadrat. The abundance of recruits per species per quadrat was typically low, and while some species had high recruitment rates many species had no recruits in most quadrats (Figure S1). We tested the relationship between fire intensity and recruits by fitting a zero-inflated generalized linear mixed model with Poisson distribution. The model predicted the number of recruits as a function of fire intensity, while adjusting for the high number of ‘zero’ results per species per quadrat. Species was treated as a random effect because recruits of different species might respond differently to fire intensity. We allowed species to have different intercepts and slopes in the random-effects terms. This model was a quadrat-based analysis using the ‘glmmTMB’ package in R [35]. Our model was:
number of recruits ~ fire intensity + (1 + fire intensity|sp),
zi = ~ fire intensity, family = Poisson
We provide further details about the model in Appendix A. We further tested the effect of fire on recruit abundance for each species among the different fire intensity classes (i.e., unburnt, low-, and high-intensity) using the Kruskal-Wallis test.

2.3.2. Specific Plant Functional Trait and Its Relation to Recruit Response

To answer the question: Are functional trait distributions in recruits different during periods with and without fire? We tested the relationship between the average functional trait values and fire intensities by using simple linear regression. The average trait values were calculated by community-weighted mean (CWM) traits of recruits of each quadrat. The CWM traits of each single trait were calculated by weighting species mean trait values with relative species abundances. We used the ‘cwm’ function from the ‘weimea’ package in R software to calculate CWM traits. Several functional traits were highly skewed, including LA, SLA, LNC, LPC, and LKC; these were log10-transformed prior to analysis.
We further evaluated the relative importance of each species recruitment contribution to the community mean traits in each quadrat according to fire intensity classes. To do this, we calculated the CWM of recruits for each functional trait and in each area. We used percent species-specific contribution to CWM trait to represent the relative importance of individual species to functional composition of each area. Species that have high percentages contribute more to a community functional trait distribution. In other words, species play crucial role in determining functional composition in that area. The relative species-specific contribution was calculated as:
% S p e c i e s   c o n t r i b u t i o n i j = R i T i j C W M j × 100
where Species contributionij is percentage of species i, in trait j. Ri is the relative abundance of recruits in species i, Tij is the mean functional trait j of species i, and CWMj is the community-weighted mean of trait j. All results are reported as CWMs, unless otherwise specified. All analyses were performed in R software v. 3.5.3 [36].

3. Results

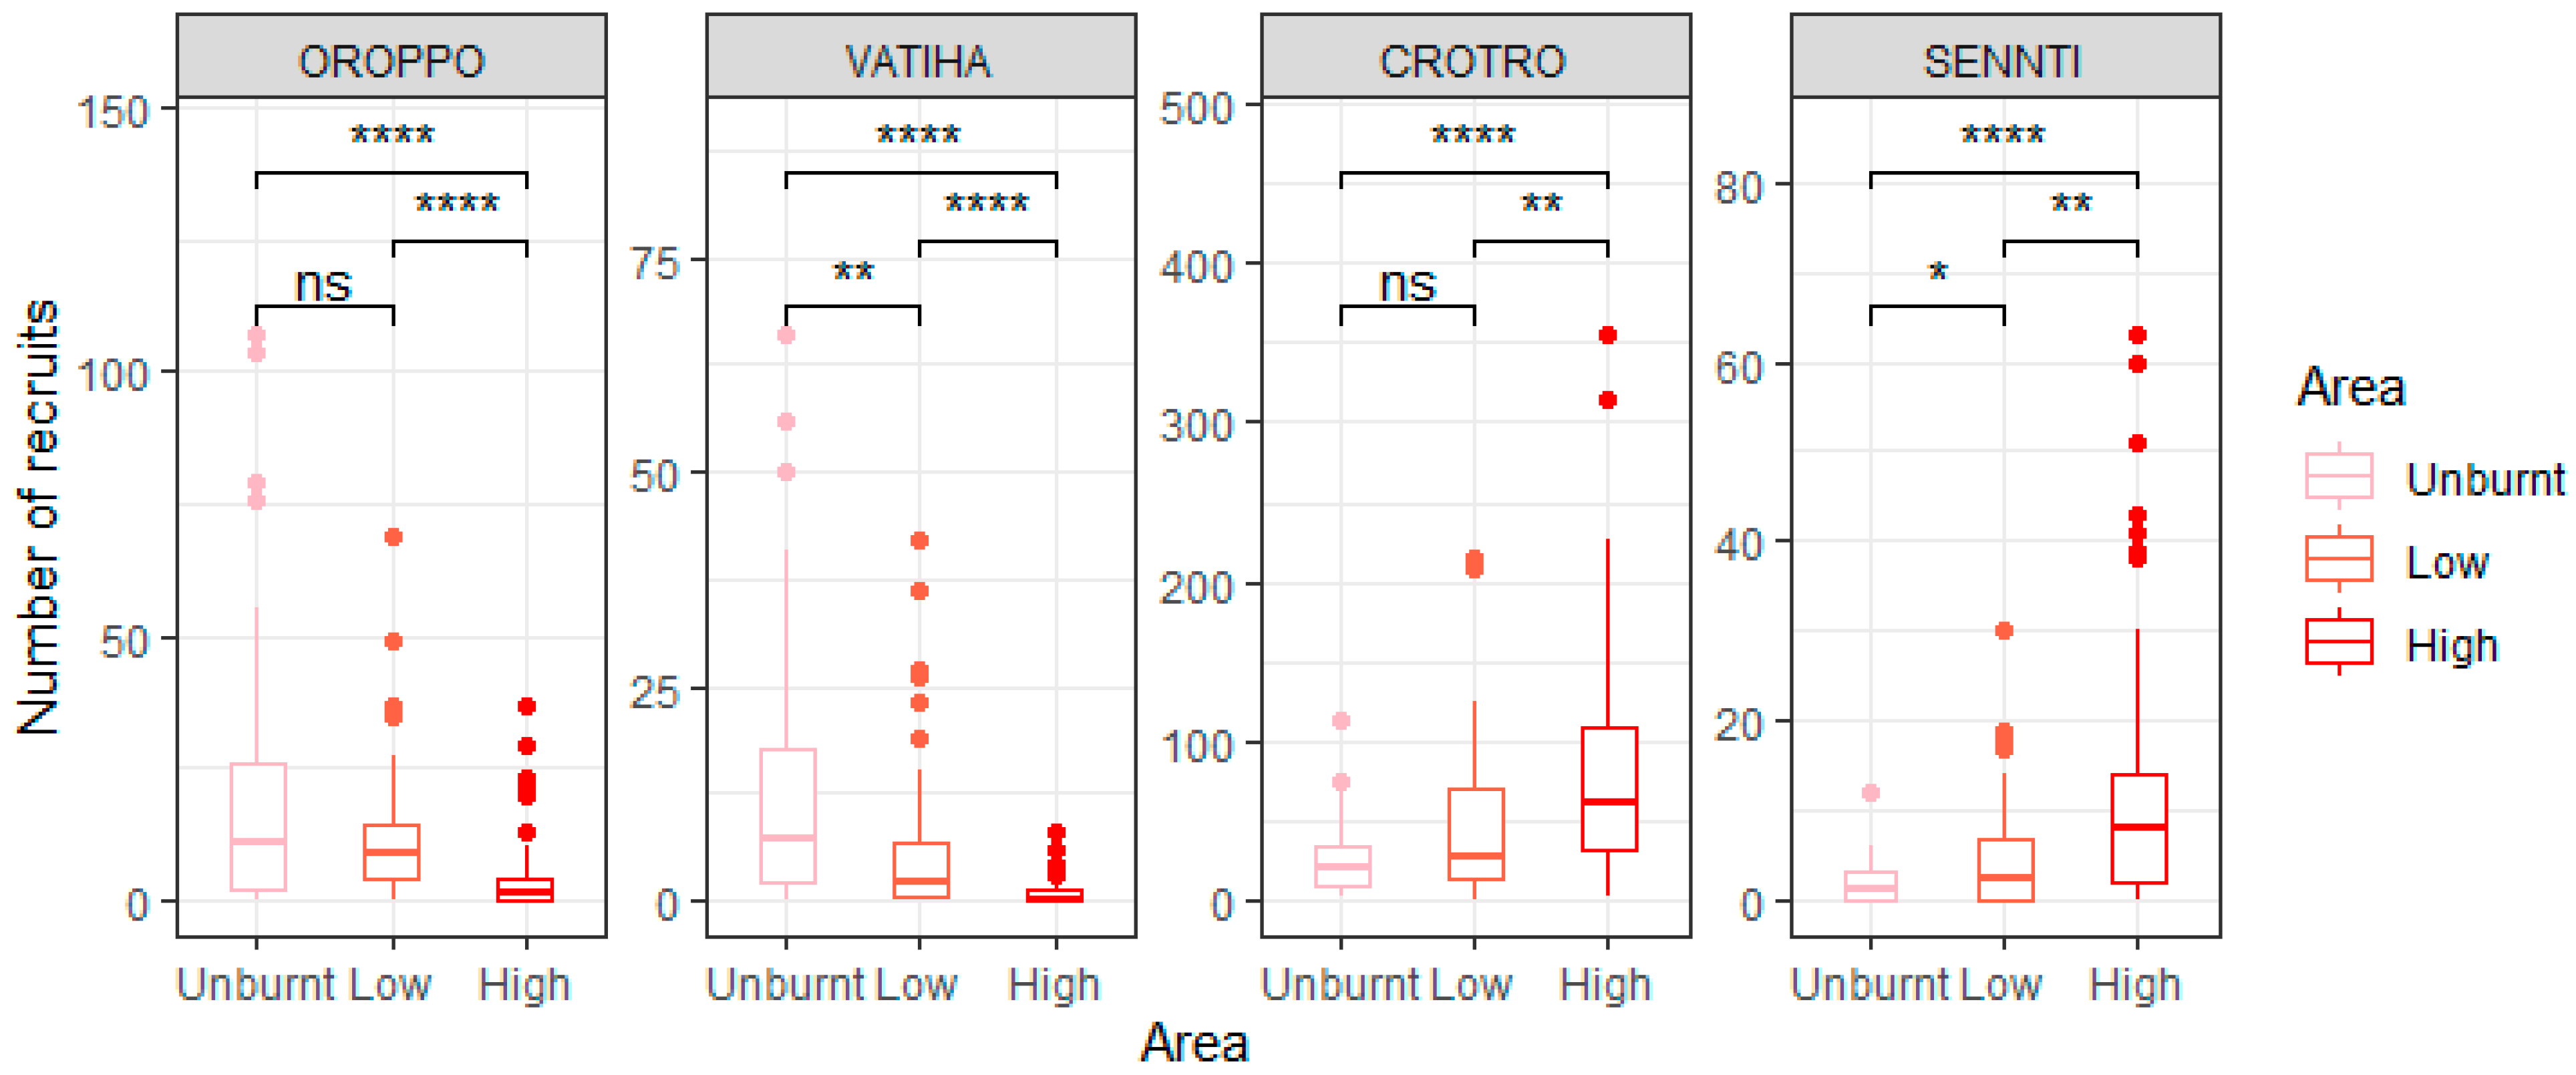
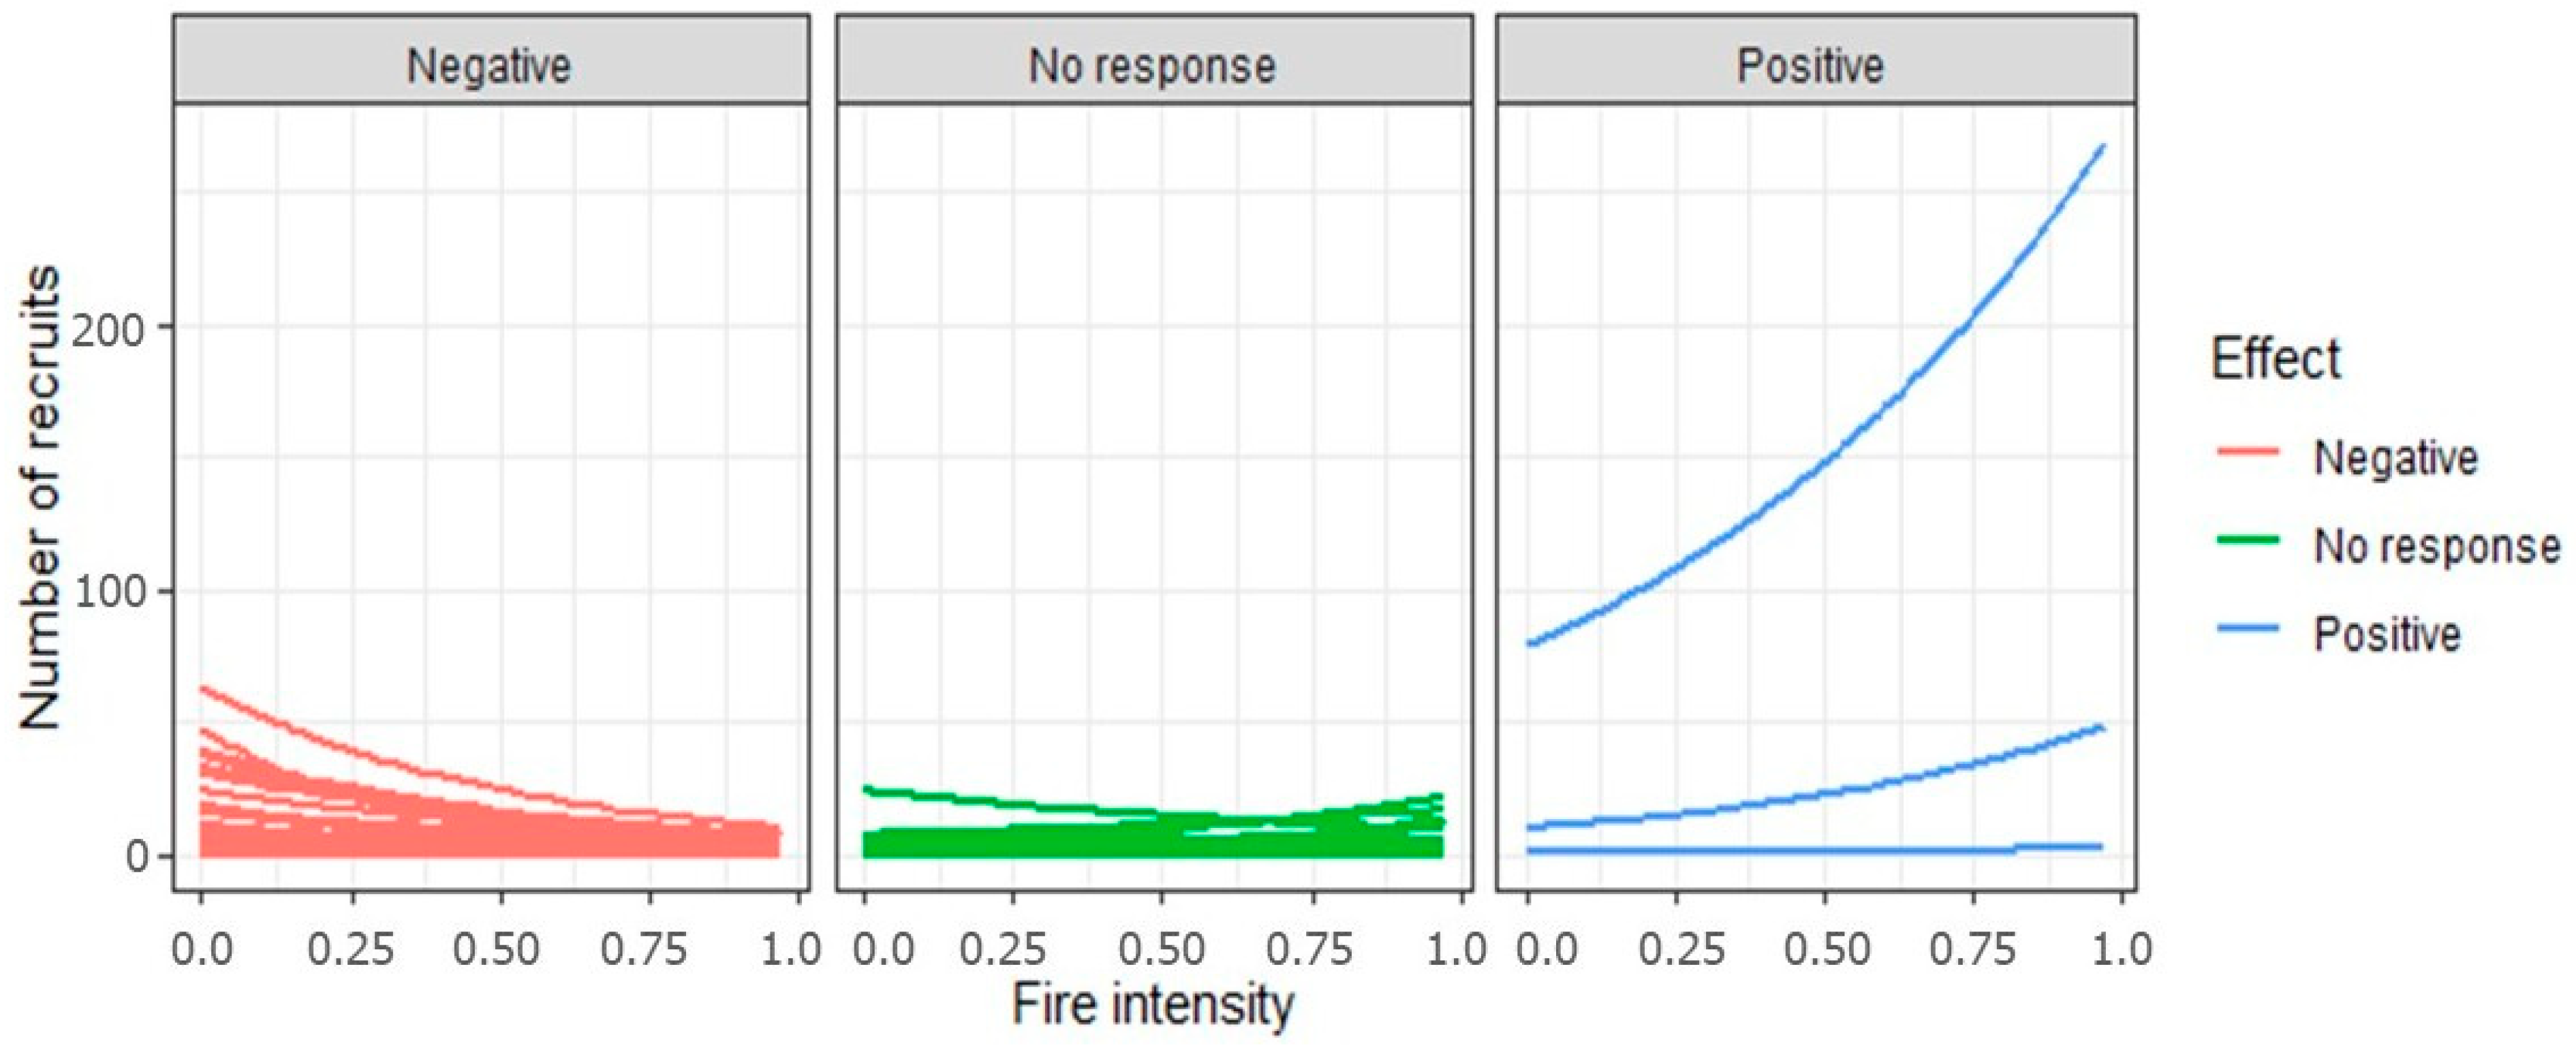
3.1. The Effect of Fire Intensity on Recruit Abundance for Overall Species and on a per Species Basis

Fire influenced recruitment patterns at the community and species levels. The numbers of recruits vary across the 200 50 × 50 quadrats (Figures S2 and S3). The zero-inflated generalized linear mixed model results indicate that the number of recruits per 50 × 50 m quadrat varied with fire intensity and among species (Figure 5). The model predicted that the number of recruits per quadrat was significantly negatively associated with the estimated fire-intensity scores from the HKK FDP (Appendix A). The slope of the relationship between the number of recruits per quadrat as a function of the fire-intensity index was estimated as −1.00 [CI −1.38, −0.63]. However, there were important species-specific differences in this relationship (Figure 5 and Table S1). Of the 89 species included in the analysis, 43 species had negative slopes, three species had positive slopes, and the other 43 species had no response (Table S1). Croton roxburghii had the largest intercept (Table S1), indicating that the abundance of recruits for this species was much higher than other species. Similarly, when we compared species-specific recruitment patterns across the three fire-intensity classes, we found 46 species with significant differences between at least two of the classes (Table S2). Of these, 43 species responded negatively to fire intensity, including Orophea polycarpa and Vatica harmandiana, three species responded positively to fire intensity, such as C. roxburghii, and Senna timoriensis (Figure 6 and Table S2), and the remaining species showed no response. The positively responding species showed clear differences in recruitment rates, particularly between unburnt quadrats and those that experienced high-intensity fire.

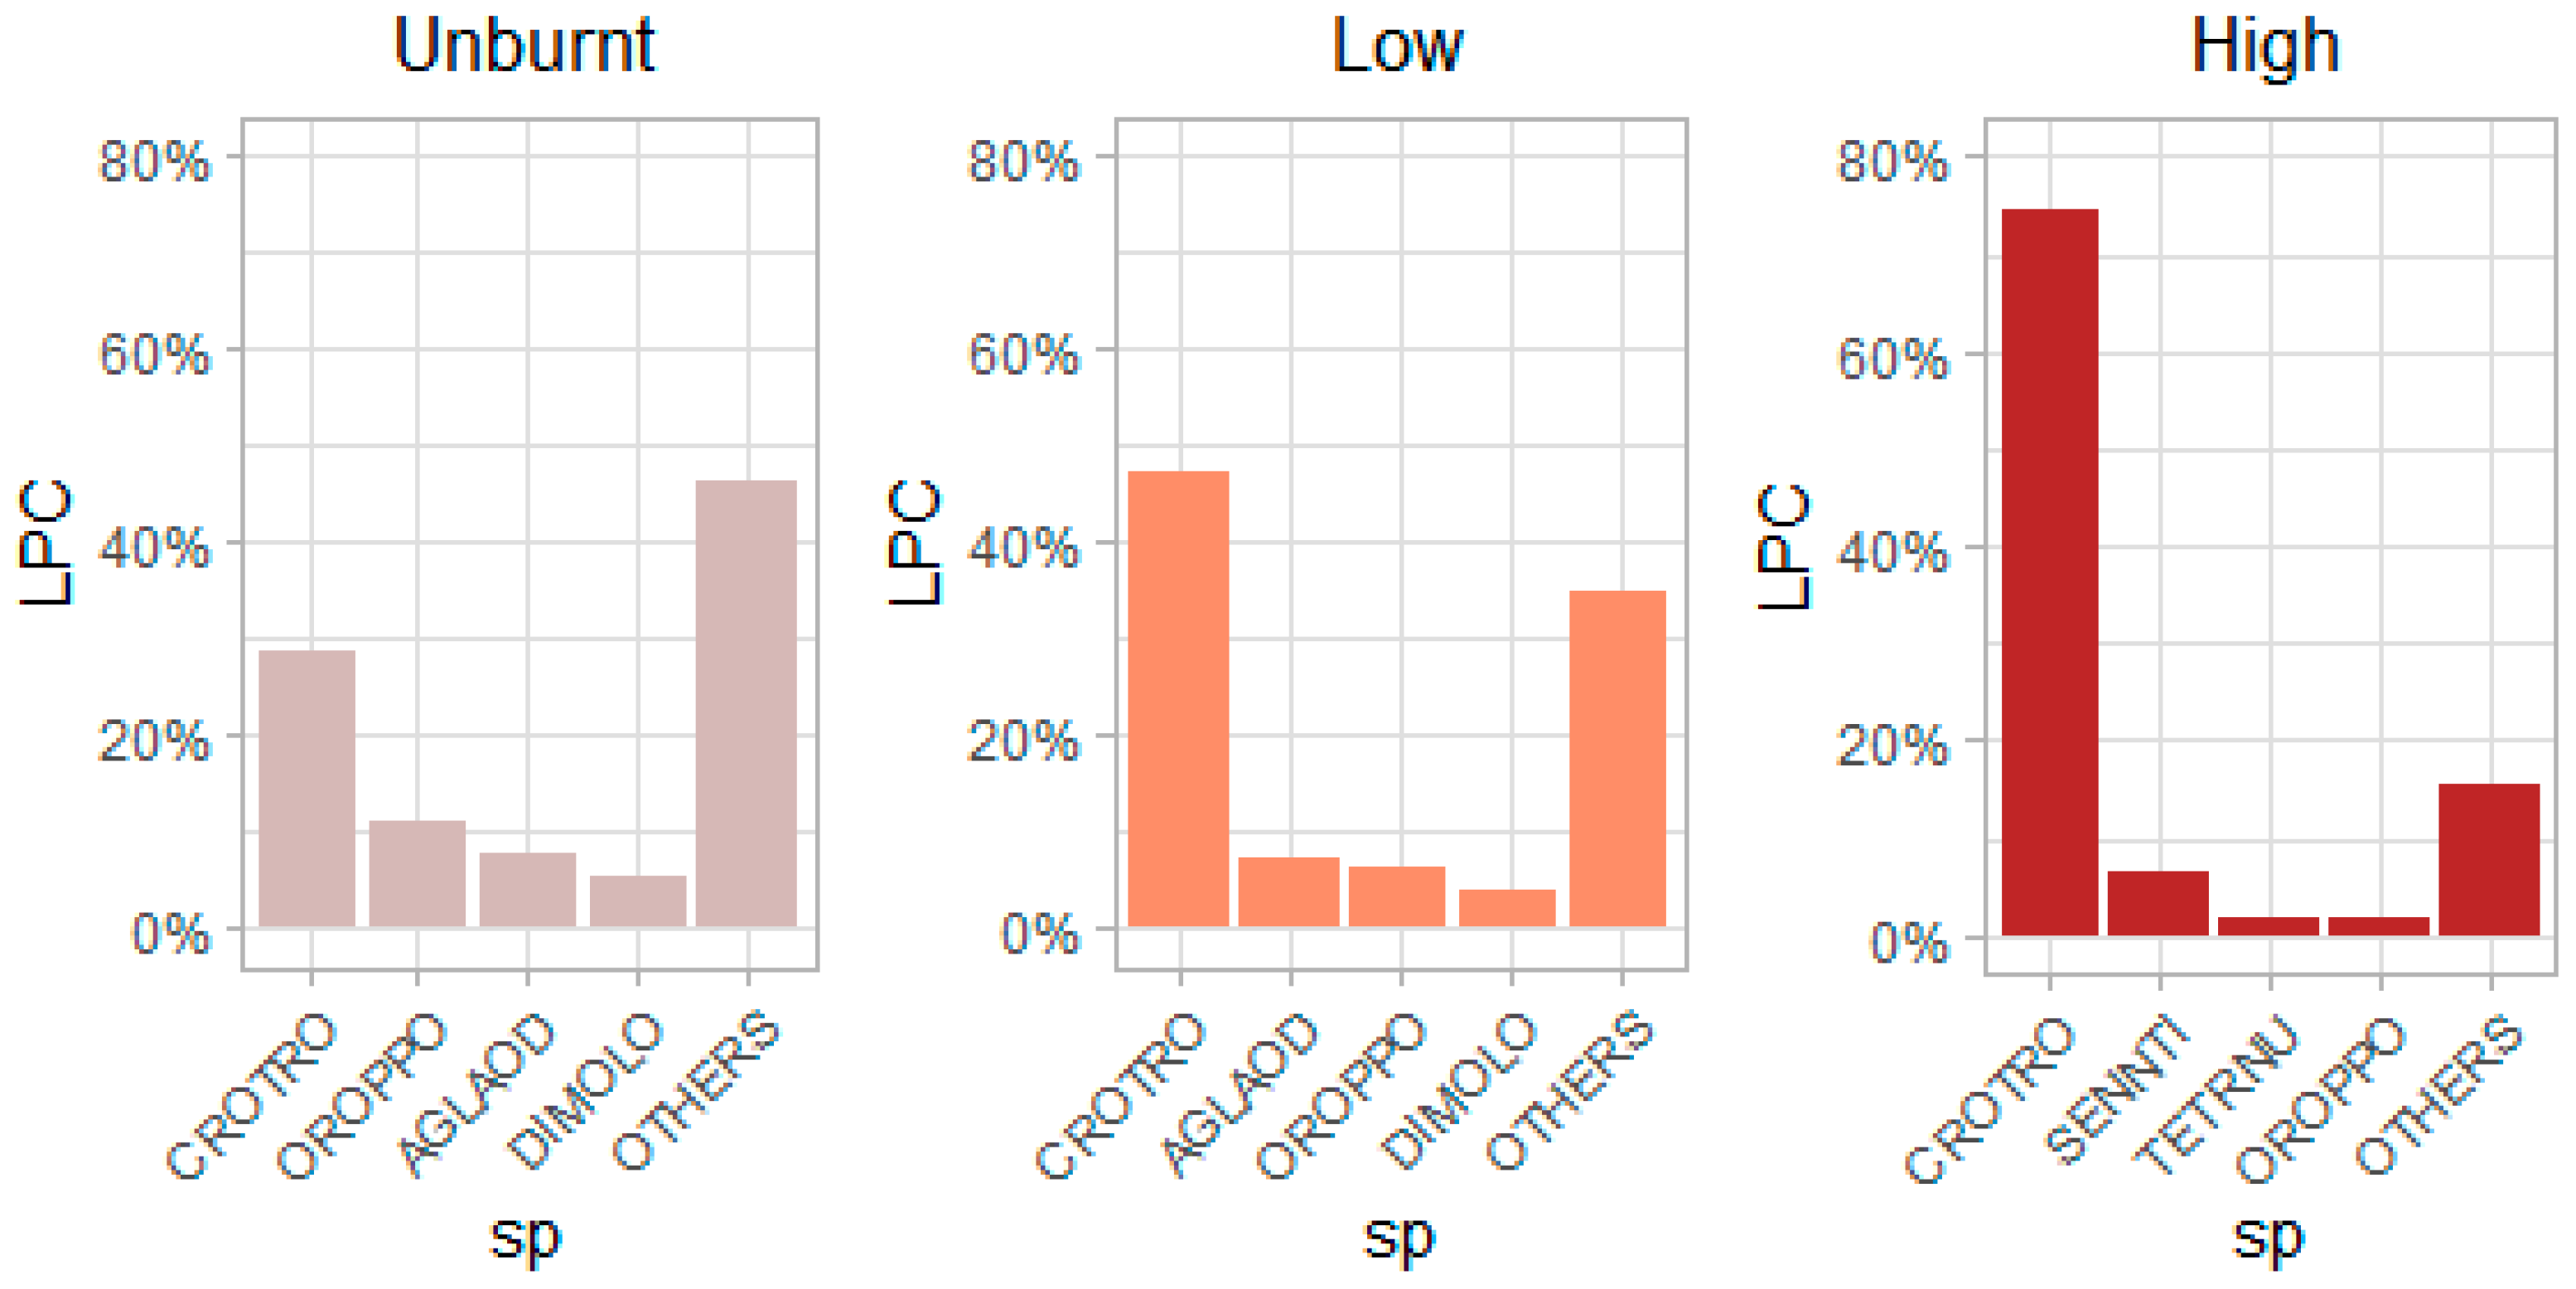
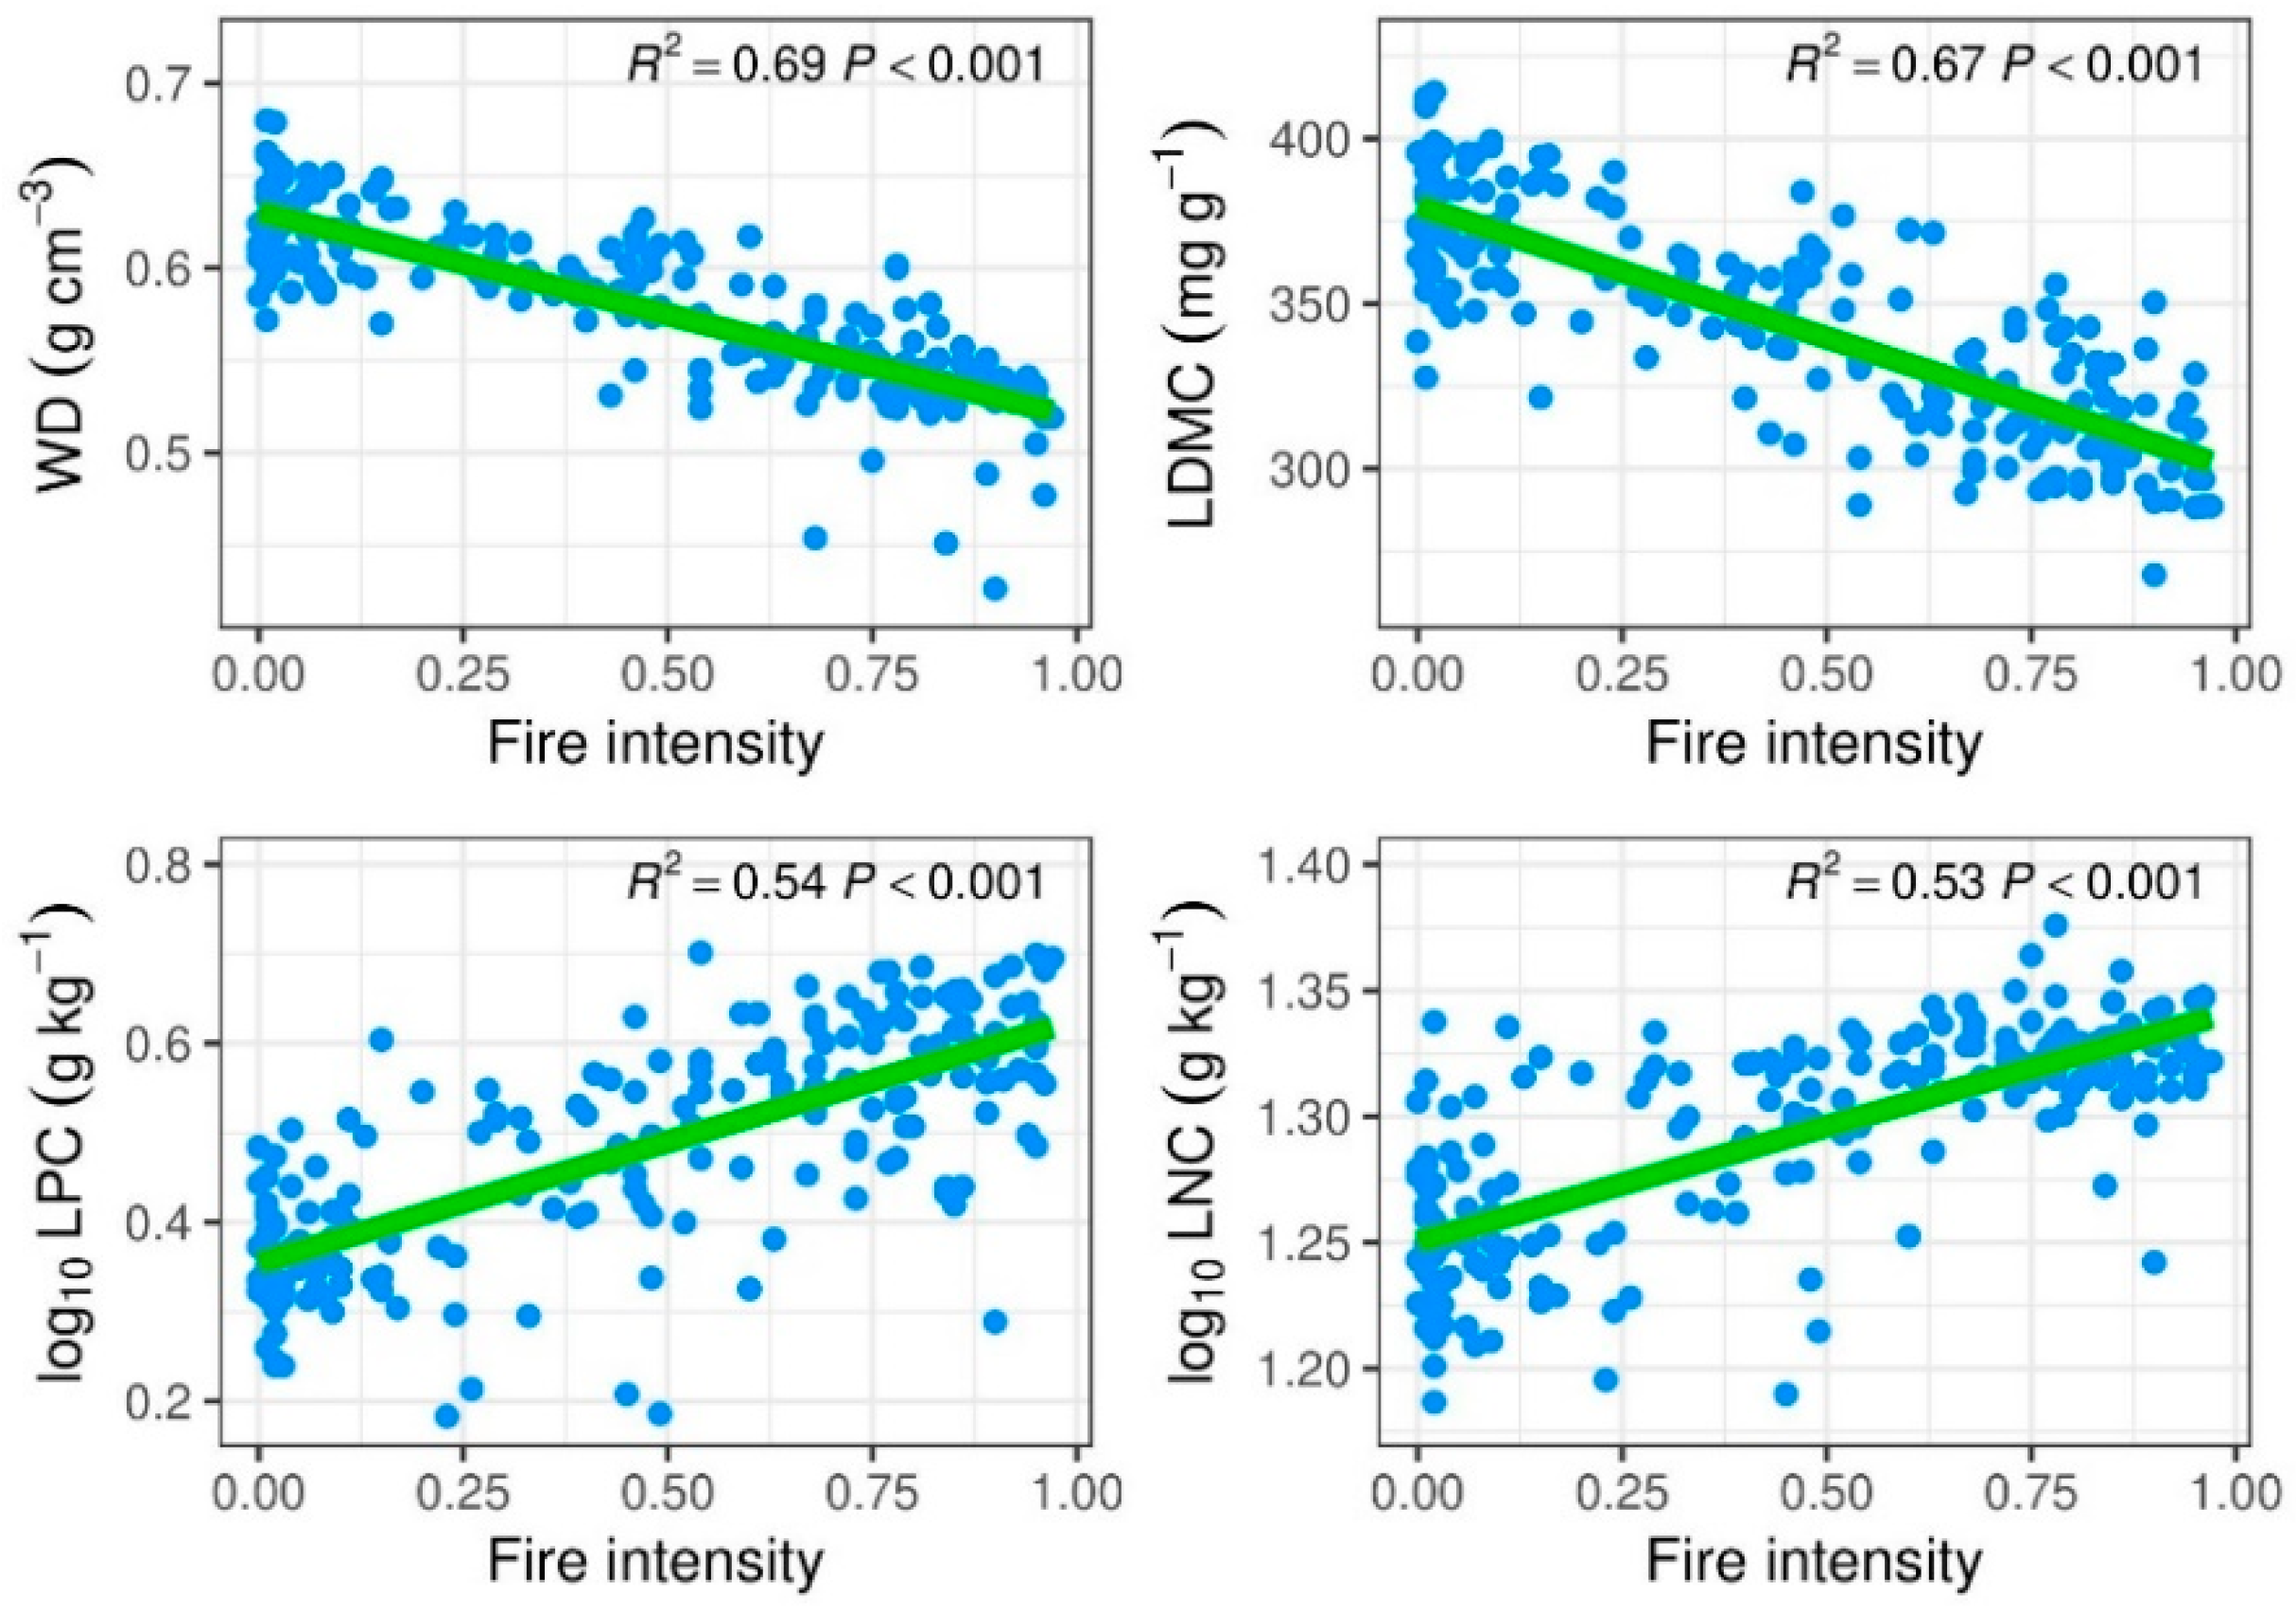
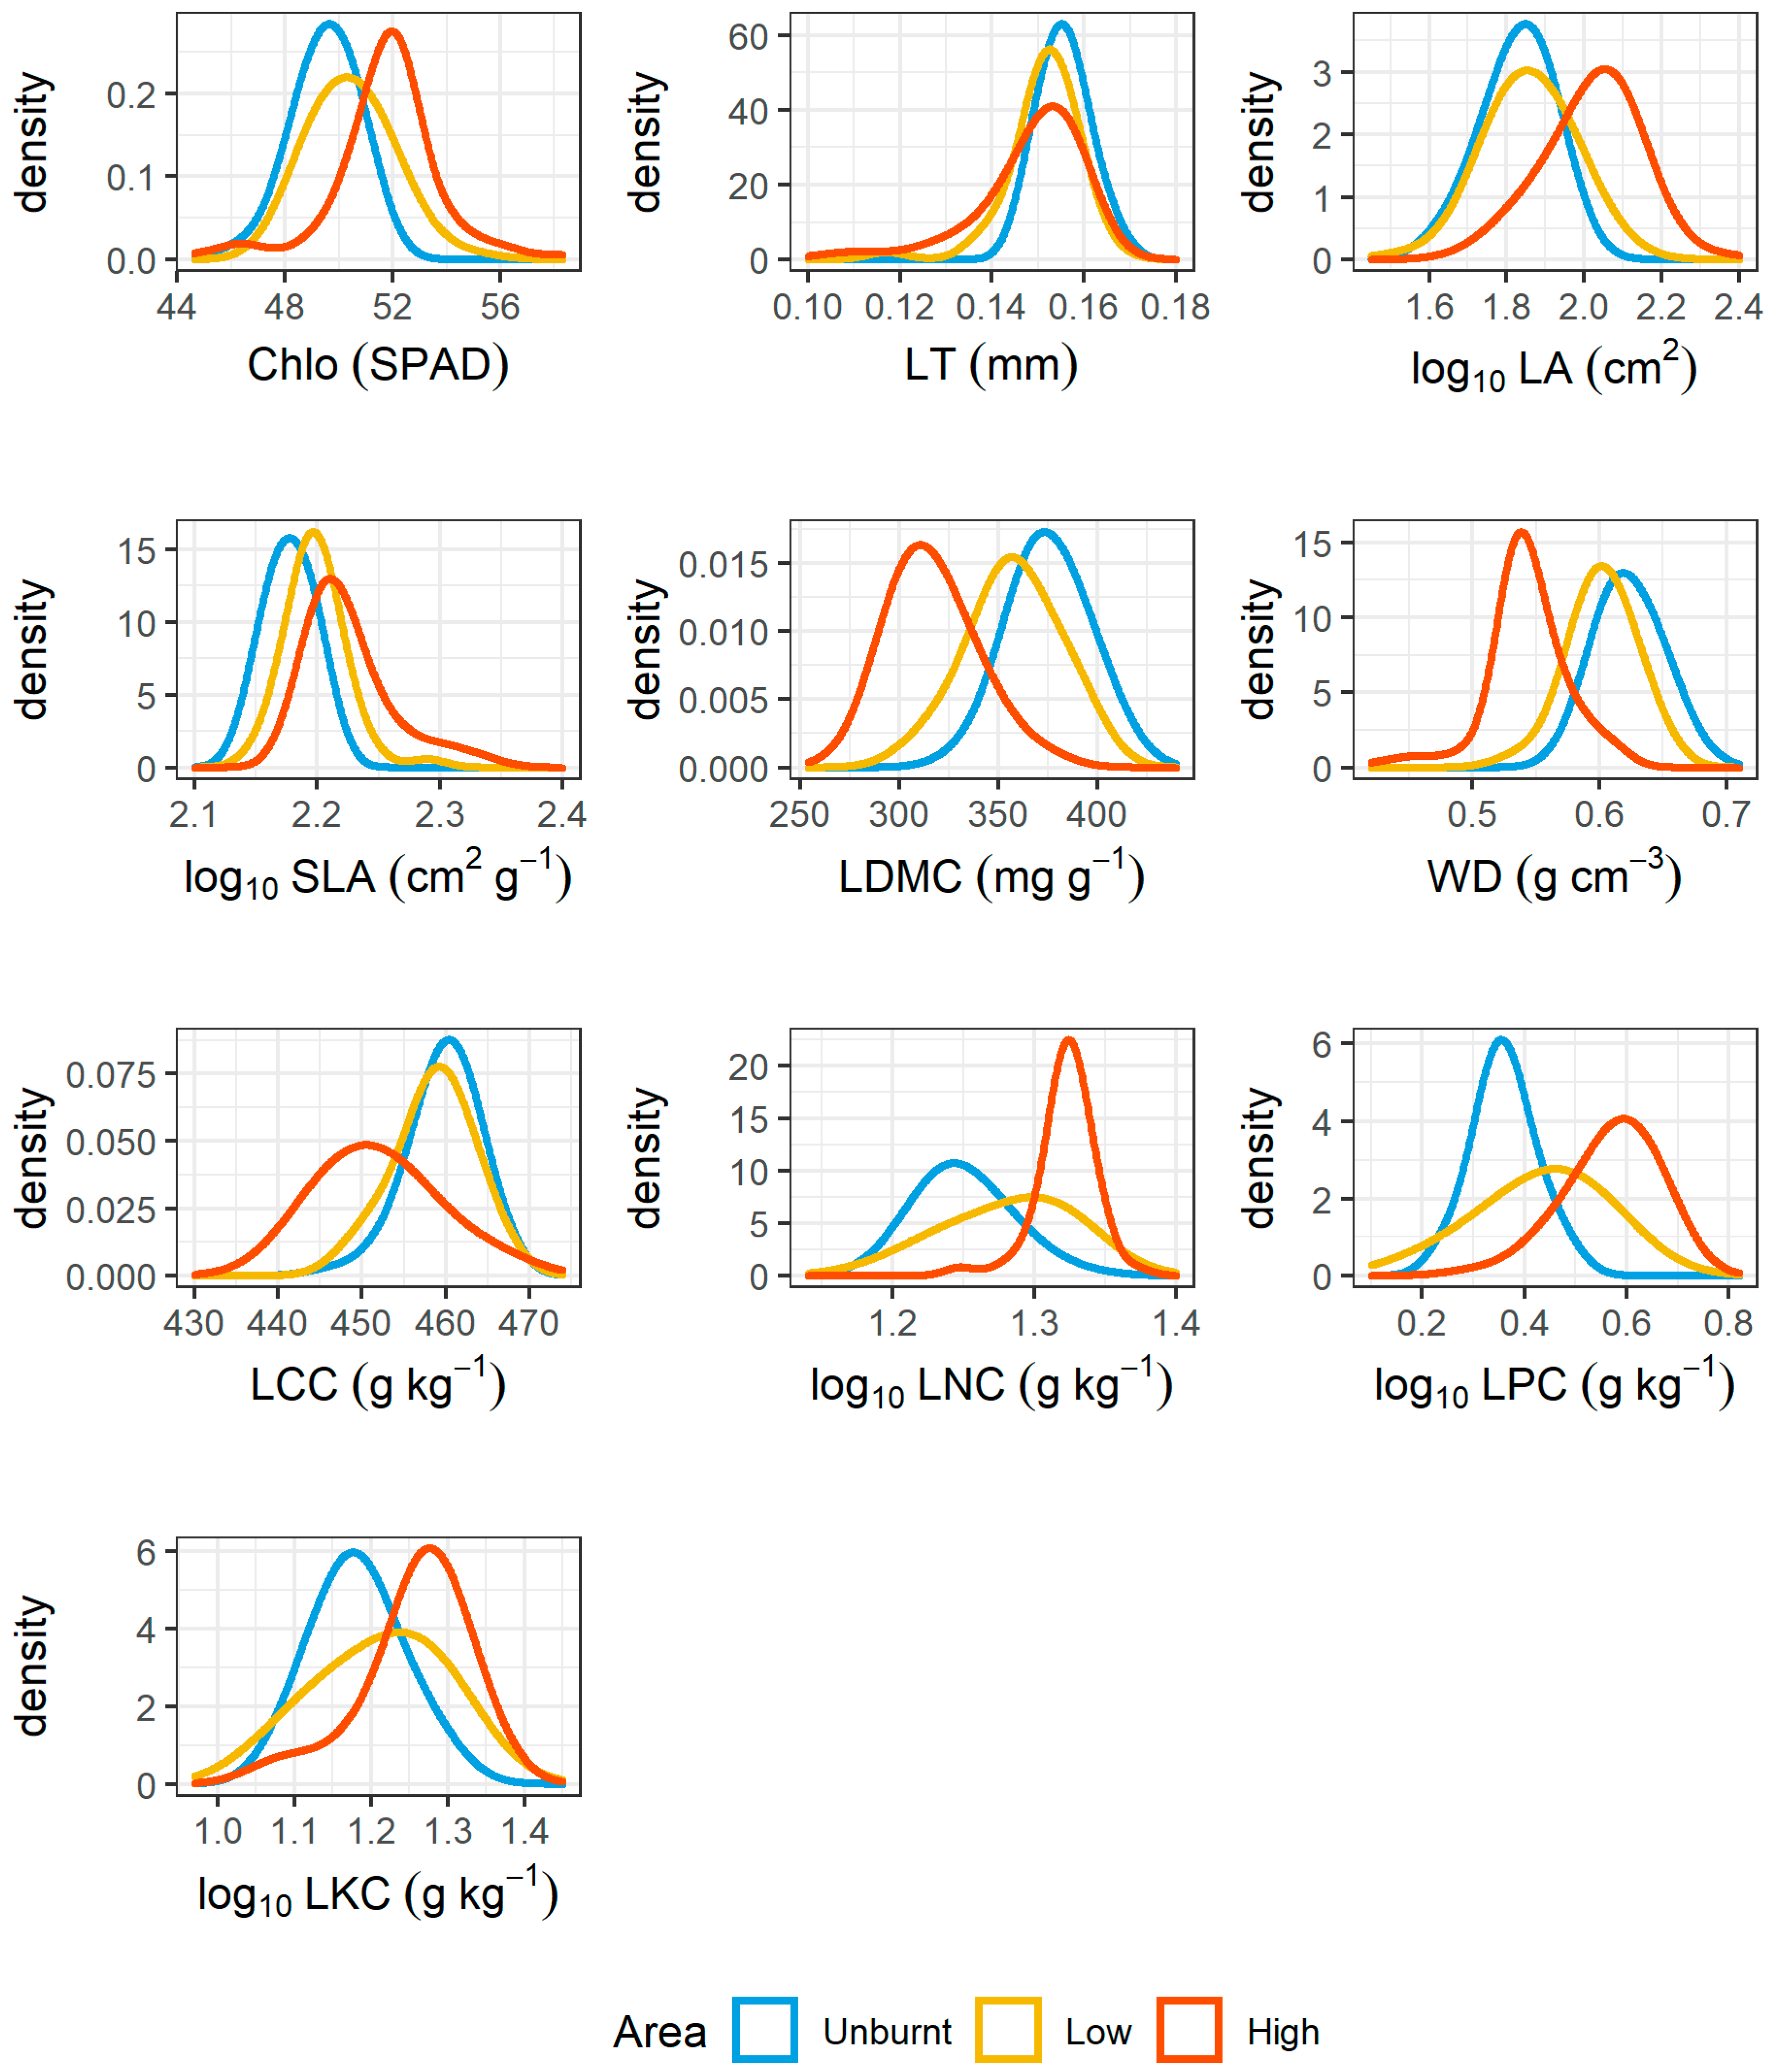
3.2. Post-Fire Community Trait Responses and Relationships with Recruitments

We firstly explored shifts in trait distributions of recruits that had established before and after the fire and found evidence of a shift in trait distributions (Table 2).
We evaluated relationships between functional traits of recruits and fire intensity and our results showed significant relationships. WD and LDMC were the traits most strongly associated with fire intensity; both were significantly negatively related to fire intensity (Figure 7 and Figure S4). LT and LCC were also significantly negatively associated with fire intensity (Figure S4). LPC and LNC displayed stronger positive relationships with fire than others. Other functional traits significantly positively associated with fire intensity were Chlo, LA, SLA, and LKC. We also observed that the distributions of CWMs varied by fire-intensity category, although the scale of these differences was trait specific (Figure 8). The percentages of species-specific contributions to CWMs varied among species (Figure S5). Croton roxburghii contributed the most to all CWMs and all areas, except for LDMC in unburnt areas (Figure S5). This species was particularly influential in CWMs of LPC. The contribution of LPC for this species was highest in the areas that burned at high intensity (74.7%) and lowest in areas that were unburnt (28.4%) (Figure 9 and Figure S5). Other species that contributed substantially to the CWM for LPC were O. polycarpa and S. timoriensis (Figure 9 and Figure S5).

4. Discussion

4.1. Effect of Fire Intensity on Recruitment Patterns

At the community-level, recruitment was negatively associated with fire intensity. In quadrats where the fire was most intense, recruitment was lower; in quadrats where there was no fire or low-intensity fire, recruitment was higher. We found that a one unit increase in fire intensity caused the number of recruits per quadrat to decrease by ~1 individual unit (Appendix A). One reason why most recruits responded negatively may be because most species in the HKK FDP are evergreen, particularly those tree species that are limited to the understorey and midstorey. These species require longer periods to reach a size that gives them a reasonable chance of surviving fire [21]. Short fire-return intervals may also prevent them from reaching fire-safe sizes. In addition, fire intensity may interact with other environmental factors to shape spatial patterns of recruitment success across the forest [21]. Most unburnt areas or low-fire intensities are in the central part of the HKK plot. These areas usually have high soil moisture and relatively dense ground cover (e.g., Zingibereaceae). As a consequence, evergreen trees dominate these areas. In contrast, high-fire intensities areas were in the southern part of the plot which is dominated by fast-growing species like C. roxburghii and deciduous species.
At the species level, fire intensity also influenced recruitment success. However, there was considerable variability in how different species responded to fire intensity. Recruitment was negatively affected (48.3%) or not affected (48.3%) by fire intensity (Figure 6 and Table S2). Only 3.4% of species exhibited a positive response to fire intensity. Most of the dominant canopy and mid-storey tree species in the HKK FDP showed a negative response. Many of these species reproduce irregularly and depend on seedlings persisting in the forest understorey to take advantage of canopy gaps [29]. While quadrats with higher fire intensity create gaps and increase light availability at the forest floor, they would also potentially kill all the pre-fire seedlings. Post-fire recruitment would then depend on a fruiting event or vigorous resprouting within a year or two of the fire to be recorded in the next census.
Only three species (Croton roxburghii, Sapindus rarak, and Senna timoriensis) had a positive recruitment response to fire intensity (Table S2). Sapindus rarak is a species which has a physical seed dormancy (i.e., hard seed coat and water-impermeable covering). The germination of S. rarak require suitable conditions to break physical seed dormancy, i.e., soften seeded by hot water [37]. This may indicate that heat and water would enhances the germination of this species. Although there are lack studies on the effect of surface fires on seed germination of this species, it is possible that surface fires might stimulate germination by breaking seed dormancy in this species as fire-prone forests often have species that require fires to stimulate seed germination [38]. Senna timoriensis is a fast-growing, short-lived species that benefits from the high-light environments created by fire-induced canopy gap formation. In contrast, Croton roxburghii is a mid-storey species that persists in relatively low to moderate light conditions. However, it is an extremely vigorous resprouting species and is able to increase its density very quickly after fire due to 5–15 sprouts emerging from the base of most fire-killed adults.

4.2. Effect of Fire in Relation to Functional Traits and the Key Species in Determining Functional Compositions

Overall, the results of this study indicate that variability in fire intensity plays an important role in determining spatial patterns of recruitment in these forests and that this may influence community-level trait distributions. Surface fires can alter the abiotic and biotic conditions in forests, such as changes in soil pH [39], soil nutrient cycling [40,41], number of herbivores [42], and relative competitive ability [43,44]. Fire can also have a filtering effect on recruit establishment. For example, Chai, Yue, Wang, Xu, Liu, Zhang and Wan [26] found that a community in the early stages of post-disturbance development was dominated by species with high SLA, LPC, LNC, values and low LDMC and LCC values—a pattern of functional traits common to shade-intolerant, disturbance-dependent species. The creation of canopy gaps as large trees collapse from fire-induced wounds at the base of their stem may allow enough sunlight to reach the forest floor to support shade-intolerant tree species [16,19]. We found that WD and LDMC were negatively and LPC and LNC were positively correlated to fire intensity (Figure S4). The quadrats that experienced higher fire intensity had recruits with lower WD and LDMC, and higher LPC and LNC than quadrats that experienced lower fire intensity. Our results display clear shifts in functional trait distributions among areas that experienced different fire intensities (Figure 8). Specifically, mean WD is lower and mean LNC is higher in areas that burned at high intensity than in areas that did not burn. In addition, the CWM distributions for these traits display very narrow distributions peaks in the areas that burned at high intensity suggesting that these areas are heavily dominated by recruits of tree species with lower WD and higher LNC. Other functional traits in high-intensity burn areas include higher Chlo, LA, SLA, and LKC. Observed functional trait patterns are more typically associated with strategies for rapid resource acquisition rather than resource conservation [25,26,34,45]. In contrast, traits associated with resource conservation, such as dense wood, low LPC and LNC, are common in shade-tolerant species [46].
A small group of species were driving community-level mean trait distributions of each area after the 2009 fire. We found that C. roxburghii had the greatest effect on functional trait distributions in all areas (with the exception of LDMC in unburnt area; Figure S5). However, the relative contribution of C. roxburghii was lowest in unburnt areas and highest in areas that burned at high intensity (Figure 9 and Figure S5). Variability in the relative contributions of different species is most likely the result of changes in recruit abundances that vary across burn intensities. The abundance of C. roxburghii greatly increased after the fire which likely drove increases in LPC particularly in areas that burned at high intensity. Orophea polycarpa and Senna timoriensis also had disproportionately large contributions to functional trait distributions (especially LPC) in unburnt and high-intensity burn areas, respectively (Figure 9). The number of recruits of the extremely shade-tolerant O. polycarpa was highest in the unburnt area (Figure 6) which contributed to the high LDMC values in the unburned areas (Figure S5). LDMC is an important trait for new recruits because it reflects the amount of structural tissue in leaves. It is associated with physical defense mechanisms that deter herbivores [34]. At the other extreme, S. timoriensis plays an important role in functional trait composition in areas that burnt at high intensity. Successful recruits in these areas tend to have high Chlo (10.7%) and low SLA (9.6%) (Figure S5). Where recruitment of one or a few species dominate a particular fire intensity, they may have a dominant influence on local functional trait distributions after the fire.
A recent study of this forest indicated that C. roxburghii needs to grow quickly to reach a size that makes them relatively immune to fire-induced mortality [21]. However, because this species is such a vigorous resprouter, many small individuals that died aboveground in the 2009 fire quickly recovered after the fire, particularly in areas where the fire was high intensity [16]. Variability in fire intensity, species-specific susceptibility, and resprouting capacity across the HKK FDP led to differences in the abundance of recruits. The variability in recruit abundance contributed to observed spatial patterns in community-weighted mean functional trait distributions across the plot.

4.3. Current Fire Disturbance and Forecasting Its Impact on Species and Functional Compositions

Fire occurrence in HKK FDP is presently decreasing, with no fire reported since 2005. The length of the dry season around this forest landscape slightly decreases and the annual total rainfall has little increase over the past 41 years (Figure S6). This indicates that climate trends are very weakly towards wetter conditions but are variable. In addition, despite several ENSO events since 1997–1998, there has only one serious fire season. As a consequence, Croton roxburghii has increased its abundance. Taken together with climate trends, the growing dominance of C. roxburghii is likely to continue. Functional compositions that are mainly contributed by recruits of this species which largely determine leaf nutrient concentrations especially in nitrogen and phosphorus also continue driven by this species.

5. Conclusions

We used a functional trait approach to explore the effects of fire intensity on recruitment dynamics in a species-rich seasonal evergreen forest in western Thailand. We found that spatial variability in fire intensity influenced species and functional composition across the study area after a single, low-intensity fire event. Fast-growing species that have functional traits well-suited to post-fire conditions are favoured over slower growing species, which will take longer to reach the recruitment threshold. Changing fire intensity or fire frequency over a long period of time may cause shifts in species and functional compositions. Our results identify a suit of species that can be used for fire-related rehabilitation based on their responses to fire. Forest management and biodiversity conservation in fire-prone forests must consider the potential impacts of changing fire regimes (i.e., fire frequency and fire intensity) in these ecosystems. There has been little progress in understanding recruitment dynamics in seasonal tropical forests that are prone to fires, particularly in continental Southeast Asia. Additional studies on recruitment dynamics and functional traits in other seasonal tropical forests in the region, and globally, will help to better understand how fire—and changing fire regimes—will shape these diverse ecosystems in the coming decades.

Supplementary Materials

The following are available online at https://www.mdpi.com/article/10.3390/f13010116/s1, Figure S1: histogram of number of recruits in each species per 50 × 50 m quadrat for 89 tree species in 50-ha Huai Kha Khaeng Forest Dynamics Plot, Thailand., Figure S2: boxplot of recruit abundances across areas in relation to fire-intensity between pre-fire and post-fire in Huai Kha Khaeng Forest Dynamics Plot, Thailand., Figure S3: variations in recruit abundances across 200 50 × 50 m quadrats between pre-fire and post-fire in Huai Kha Khaeng Forest Dynamics Plot, Thailand., Figure S4: simple linear regression analyses between community-weighted mean (CWM) of functional traits and fire intensity in Huai Kha Khaeng Forest Dynamics Plot, Thailand., Figure S5: species-specific contribution to community-weighted mean (CWM) of functional traits in Huai Kha Khaeng Forest Dynamics Plot, Thailand., Figure S6: time-series of length of dry season and total annual rainfall from the 41 years (1997–2018)., Table S1: the result of zero-inflated generalize linear mixed model of number of recruits per 50 × 50 m quadrat and fire intensity from 89 species in 50- Huai Kha Khaeng Forest Dynamics Plot, Thailand., Table S2: the result of Kruskal-Wallis test of number of recruits per quadrat across areas that experienced fire conditions from 89 species in 50-ha Huai Kha Khaeng Forest Dynamics Plot, Thailand.

Author Contributions

Conceptualization, K.K., D.J.J. and P.J.B.; methodology, K.K., D.J.J. and P.J.B.; software, K.K. and D.J.J.; formal analysis, K.K., D.J.J. and P.J.B.; resources, S.B. and P.J.B.; data curation, K.K.; writing—original draft preparation, K.K. and D.J.J.; writing—review and editing, K.K., D.J.J., S.B. and P.J.B. All authors have read and agreed to the published version of the manuscript.

Funding

This research received no external funding.

Institutional Review Board Statement

Not applicable.

Informed Consent Statement

Not applicable.

Data Availability Statement

The corresponding author can be requested to provide original data.

Acknowledgments

We appreciate the Smithsonian Institution’s Center for Tropical Forest Science for supporting tree census. We thank Thai staffs for their conduct tree census at the Huai Kha Khaeng Forest Dynamics Plot. We thank Lin Luxiang and XTBG staffs that allow us to use functional trait data for this analysis where their functional trait data collection is funded by Southeast Asia Biodiversity Research Institute, Chinese Academy of Sciences (151C53KYSB20200019). We are grateful to the 2019 ForestGEO Analytical Workshop for participants’ feedback and their effort and contribution towards our study progress.

Conflicts of Interest

The authors declare no conflict of interest.

Appendix A. Model of Zero-Inflated Generalized Linear Mixed Model

Zero-inflated model
 
mod = glmmTMB (AbsRec ~ FI + (1+FI|sp), zi= ~ FI, dat, family = poisson)
summary(mod)
## Family: poisson (log)
## Formula: AbsRec ~ FI + (1 + FI|sp)
## Zero inflation: ~FI
## Data: dat
##
## AIC BIC logLik deviance df.resid
## 49213.7 49268.2 −24599.8 49199.7 17793
##
## Random effects:
##
## Conditional model:
## Groups Name Variance Std.Dev. Corr
## sp (Intercept) 3.329 1.825
## FI 2.539 1.593 −0.33
## Number of obs: 17800, groups: sp, 89
##
## Conditional model:
## Estimate Std. Error z value Pr(>|z|)
## (Intercept) −0.4502 0.1972 −2.283 0.0224 *
## FI −1.0034 0.1911 −5.249 1.53 × 10⁻⁷ ***
## ---
## Signif. codes: 0 ‘***’ 0.001 ‘**’ 0.01 ‘*’ 0.05 ‘.’ 0.1 ‘ ’ 1
##
## Zero-inflation model:
## Estimate Std. Error z value Pr(>|z|)
## (Intercept) −0.97615 0.05511 −17.71 <2 × 10⁻¹⁶ ***
## FI 1.17907 0.09983 11.81 <2 × 10⁻¹⁶ ***
## ---
## Signif. codes: 0 ‘***’ 0.001 ‘**’ 0.01 ‘*’ 0.05 ‘.’ 0.1 ‘ ’ 1

References

  1. Woods, P. Effects of logging, drought, and fire on structure and composition of tropical forests in Sabah, Malaysia. Biotropica 1989, 21, 290–298. [Google Scholar] [CrossRef]
  2. Gilliam, F.S.; Platt, W.J. Effects of long-term fire exclusion on tree species composition and stand structure in an old-growth Pinus palustris (Longleaf pine) forest. Plant Ecol. 1999, 140, 15–26. [Google Scholar] [CrossRef]
  3. Oliveras, I.; Malhi, Y.; Salinas, N.; Huaman, V.; Urquiaga-Flores, E.; Kala-Mamani, J.; Quintano-Loaiza, J.A.; Cuba-Torres, I.; Lizarraga-Morales, N.; Román-Cuesta, R.-M. Changes in forest structure and composition after fire in tropical montane cloud forests near the Andean treeline. Plant Ecol. Divers. 2014, 7, 329–340. [Google Scholar] [CrossRef]
  4. McLauchlan, K.K.; Higuera, P.E.; Miesel, J.; Rogers, B.M.; Schweitzer, J.; Shuman, J.K.; Tepley, A.J.; Varner, J.M.; Veblen, T.T.; Adalsteinsson, S.A.; et al. Fire as a fundamental ecological process: Research advances and frontiers. J. Ecol. 2020, 108, 2047–2069. [Google Scholar] [CrossRef]
  5. Verma, S.; Singh, D.; Mani, S.; Jayakumar, S. Effect of forest fire on tree diversity and regeneration potential in a tropical dry deciduous forest of Mudumalai Tiger Reserve, Western Ghats, India. Ecol. Process. 2017, 6, 32. [Google Scholar] [CrossRef] [Green Version]
  6. Kodandapani, N.; Cochrane, M.; Sukumar, R. A comparative analysis of spatial, temporal, and ecological characteristics of forest fires in seasonally dry tropical ecosystems in the Western Ghats, India. For. Ecol. Manag. 2008, 256, 607–617. [Google Scholar] [CrossRef]
  7. Cochrane, M.A.; Schulze, M.D. Fire as a recurrent event in tropical forests of the eastern Amazon: Effects on forest structure, biomass, and species composition. Biotropica 1999, 31, 2–16. [Google Scholar] [CrossRef]
  8. González, M.E.; Veblen, T.T.; Sibold, J.S. Influence of fire severity on stand development of Araucaria araucanaNothofagus pumilio stands in the Andean cordillera of south-central Chile. Austral Ecol. 2010, 35, 597–615. [Google Scholar] [CrossRef]
  9. Mundo, I.A.; Holz, A.; González, M.E.; Paritsis, J. Fire History and Fire Regimes Shifts in Patagonian Temperate Forests. In Dendroecology: Tree-Ring Analyses Applied to Ecological Studies; Amoroso, M.M., Daniels, L.D., Baker, P.J., Camarero, J.J., Eds.; Springer International Publishing: Cham, Switzerland, 2017; pp. 211–229. [Google Scholar]
  10. Johnstone, J.F.; Chapin, F.S. Effects of soil burn severity on post-fire tree recruitment in boreal Forest. Ecosystems 2006, 9, 14–31. [Google Scholar] [CrossRef]
  11. Nguyen, T.T.; Murphy, B.P.; Baker, P.J. The existence of a fire-mediated tree-recruitment bottleneck in an Asian savanna. J. Biogeogr. 2019, 46, 745–756. [Google Scholar] [CrossRef]
  12. Otterstrom, S.M.; Schwartz, M.W.; Velázquez-Rocha, I. Responses to fire in selected tropical dry forest trees. Biotropica 2006, 38, 592–598. [Google Scholar] [CrossRef]
  13. Baker, P.J.; Bunyavejchewin, S.; Oliver, C.D.; Ashton, P.S. Disturbance history and historical stand dynamics of a seasonal tropical forest in western Thailand. Ecol. Monogr. 2005, 75, 317–343. [Google Scholar] [CrossRef]
  14. Amoroso, M.M.; Daniels, L.D.; Baker, P.J.; Camarero, J.J. Dendroecology: Tree-Ring Analyses Applied to Ecological Studies; Springer International Publishing: Cham, Switzerland, 2017. [Google Scholar]
  15. Syaufina, L.; Ainuddin, A.N. Impacts of Fire on SouthEast Asia tropical forests biodiversity: A review. Asian J. Plant Sci. 2011, 10, 238–244. [Google Scholar] [CrossRef]
  16. Baker, P.J.; Bunyavejchewin, S.; Robinson, A.P. The impacts of large-scale, low-intensity fires on the forests of continental South-east Asia. Int. J. Wildland Fire 2008, 17, 782–792. [Google Scholar] [CrossRef]
  17. Stott, P. The spatial pattern of dry season fires in the savanna forests of Thailand. J. Biogeogr. 1986, 13, 345–358. [Google Scholar] [CrossRef]
  18. Murphy, P.G.; Lugo, A.E. Ecology of tropical dry forest. Annu. Rev. Ecol. Syst. 1986, 17, 67–88. [Google Scholar] [CrossRef]
  19. Baker, P.J.; Bunyavejchewin, S. Fire behavior and fire effects across the forest landscape of continental Southeast Asia. In Tropical Fire Ecology: Climate Change, Land Use, and Ecosystem Dynamics; Springer: Berlin/Heidelberg, Germany, 2009; pp. 311–334. [Google Scholar]
  20. Williams, L.J.; Bunyavejchewin, S.; Baker, P.J. Deciduousness in a seasonal tropical forest in western Thailand: Interannual and intraspecific variation in timing, duration and environmental cues. Oecologia 2008, 155, 571–582. [Google Scholar] [CrossRef] [PubMed] [Green Version]
  21. Trouvé, R.; Bunyavejchewin, S.; Baker, P.J. Disentangling fire intensity and species’ susceptibility to fire in a species-rich seasonal tropical forest. J. Ecol. 2020, 108, 1664–1676. [Google Scholar] [CrossRef]
  22. Geber, M.A.; Griffen, L.R. Inheritance and natural selection on functional traits. Int. J. Plant Sci. 2003, 164, 21–42. [Google Scholar] [CrossRef] [Green Version]
  23. Violle, C.; Navas, M.-L.; Vile, D.; Kazakou, E.; Fortunel, C.; Hummel, I.; Garnier, E. Let the concept of trait be functional! Oikos 2007, 116, 882–892. [Google Scholar] [CrossRef]
  24. Cornelissen, J.H.C.; Lavorel, S.; Garnier, E.; Diaz, S.; Buchmann, N.; Gurvich, D.E.; Reich, P.B.; Steege, H.T.; Morgan, H.D.; Heijden, M.G.A.V.d.; et al. A handbook of protocols for standardised and easy measurement of plant functional traits worldwide. Aust. J. Bot. 2003, 51, 335–380. [Google Scholar] [CrossRef] [Green Version]
  25. Wright, I.J.; Reich, P.B.; Westoby, M.; Ackerly, D.D.; Baruch, Z.; Bongers, F.; Cavender-Bares, J.; Chapin, T.; Cornelissen, J.H.C.; Diemer, M.; et al. The worldwide leaf economics spectrum. Nature 2004, 428, 821–827. Available online: https://www.nature.com/articles/nature02403#supplementary-information (accessed on 1 February 2019). [CrossRef] [PubMed]
  26. Chai, Y.; Yue, M.; Wang, M.; Xu, J.; Liu, X.; Zhang, R.; Wan, P. Plant functional traits suggest a change in novel ecological strategies for dominant species in the stages of forest succession. Oecologia 2016, 180, 771–783. [Google Scholar] [CrossRef]
  27. Bunyavejchewin, S.; Lafrankie, J.V.; Pattapong, P.; Kanzaki, M.; Itoh, A.; Yamakura, T.; Ashton, P. Topographic analysis of a large-scale research plot in seasonal dry evergreen forest at Huai Kha Khaeng Wildlife Sanctuary, Thailand. Tropics 1998, 8, 45–60. [Google Scholar] [CrossRef] [Green Version]
  28. Baillie, I.C.; Bunyavejchewin, S.; Kaewfoo, M.; Baker, P.J.; Hallett, S.H. Stoichiometry of cationic nutrients in Phaeozems derived from skarn and Acrisols from other plant materials in lowland forests of Thailand. Geoderma Reg. 2018, 12, 1–9. [Google Scholar] [CrossRef]
  29. Bunyavejchewin, S.; LaFrankie, J.V.; Baker, P.J.; Davies, S.J.; Ashton, P.J. Forest Trees of Huai Kha Khaeng Wildlife Sanctuary, Thailand: Data from the 50-Hectare Forest Dynamics Plot; National Parks, Wildlife & Plant Conservation Department: Bangkok, Thailand, 2009. [Google Scholar]
  30. Condit, R. Tropical Forest Census Plot; Springer: Berlin, Germany, 1998. [Google Scholar]
  31. Anderson-Teixeira, K.J.; Davies, S.J.; Bennett, A.C.; Gonzalez-Akre, E.B.; Muller-Landau, H.C.; Joseph Wright, S.; Abu Salim, K.; Almeyda Zambrano, A.M.; Alonso, A.; Baltzer, J.L.; et al. CTFS-ForestGEO: A worldwide network monitoring forests in an era of global change. Glob. Chang. Biol. 2015, 21, 528–549. [Google Scholar] [CrossRef] [Green Version]
  32. Davies, S.J.; Abiem, I.; Abu Salim, K.; Aguilar, S.; Allen, D.; Alonso, A.; Anderson-Teixeira, K.; Andrade, A.; Arellano, G.; Ashton, P.S.; et al. ForestGEO: Understanding forest diversity and dynamics through a global observatory network. Biol. Conserv. 2021, 253, 108907. [Google Scholar] [CrossRef]
  33. Center for Tropical Forest Science. The CTFS R Package. Available online: http://ctfs.arnarb.harvard.edu/Public/CTFSRPackage (accessed on 30 June 2019).
  34. Pérez-Harguindeguy, N.; Díaz, S.; Garnier, E.; Lavorel, S.; Poorter, H.; Jaureguiberry, P.; Bret-Harte, M.S.; Cornwell, W.K.; Craine, J.M.; Gurvich, D.E.; et al. New handbook for standardised measurement of plant functional traits worldwide. Aust. J. Bot. 2013, 61, 167–234. [Google Scholar] [CrossRef]
  35. Brooks, M.E.; Kristensen, K.; Benthem, K.J.v.; Magnusson, A.; Berg, C.W.; Nielsen, A.; Skaug, H.J.; Maechler, M.; Bolker, B.M. glmmTMB Balances Speed and Flexibility Among Packages for Zero-inflated Generalized Linear Mixed Modeling. R J. 2017, 9, 378–400. [Google Scholar] [CrossRef] [Green Version]
  36. R Core Team. R: A Language and Environment for Statistical Computing. Available online: http://www.R-project.org/ (accessed on 15 April 2019).
  37. Sulisetijono, S.; Arumingtyas, E.L.; Mastuti, R.; Indriyani, S. Physical and chemical treatments to break seed dormancy on lerak (Sapindus rarak DC.). Int. J. Agric. Environ. Res. 2016, 2, 936–947. [Google Scholar]
  38. Moreira, B.; Pausas, J.G. Tanned or burned: The role of fire in shaping physical seed dormancy. PLoS ONE 2012, 7, e51523. [Google Scholar] [CrossRef] [Green Version]
  39. Ne’eman, G. Regeneration of natural pine forest—Review of work done after the 1989 fire in Mount Carmel, Israel. Int. J. Wildland Fire 1997, 7, 295–306. [Google Scholar] [CrossRef]
  40. Chapin, F.S.; Matson, P.A.; Mooney, H.A. Principles of Terrestrial Ecosystem Ecology; Springer: New York, NY, USA, 2002. [Google Scholar]
  41. Raison, R.J. A review of the role of fire in nutrient cycling in Australian native forests, and of methodology for studying the fire-nutrient interaction. Aust. J. Ecol. 1980, 5, 15–21. [Google Scholar] [CrossRef]
  42. Sabiiti, E.N.; Wein, R.W. Fire and Acacia seeds: A hypothesis of colonization success. J. Ecol. 1987, 75, 937–946. [Google Scholar] [CrossRef]
  43. Peterson, D.W.; Reich, P.B. Fire frequency and tree canopy structure influence plant species diversity in a forest-grassland ecotone. Plant Ecol. 2008, 194, 5–16. [Google Scholar] [CrossRef]
  44. Reilly, M.J.; Wimberly, M.C.; Newell, C.L. Wildfire effects on plant species richness at multiple spatial scales in forest communities of the southern Appalachians. J. Ecol. 2006, 94, 118–130. [Google Scholar] [CrossRef]
  45. Muscarella, R.; Uriarte, M.; Aide, T.M.; Erickson, D.L.; Forero-Montaña, J.; Kress, W.J.; Swenson, N.G.; Zimmerman, J.K. Functional convergence and phylogenetic divergence during secondary succession of subtropical wet forests in Puerto Rico. J. Veg. Sci. 2016, 27, 283–294. [Google Scholar] [CrossRef]
  46. Boukili, V.K.; Chazdon, R.L. Environmental filtering, local site factors and landscape context drive changes in functional trait composition during tropical forest succession. Perspect. Plant Ecol. Evol. Syst. 2017, 24, 37–47. [Google Scholar] [CrossRef]
Figure 1. Map of Huai Kha Khaeng (HKK) Wildlife Sanctuary where the study area is located within.
Forests 13 00116 g001
Figure 2. Huai Kha Khaeng Forests Dynamics Plot, Thailand. (a) tree species composition; (b) a large tree with buttress roots; (c) a large fire scar from repeated burns on Hopea Odorata.
Forests 13 00116 g002
Figure 3. Overview of analysis workflow for the effect of 2005 surface fire influence post-fire recruitment in 2009, using data of tree recruitment data from the Forest Dynamics Plot, plant functional traits (PFT), and fire intensity scores.
Forests 13 00116 g003
Figure 4. Map represents quadrat classifications according to fire intensity in Huai Kha Khaeng Forest Dynamics Plot, Thailand. Red coloring intensity refers to the increasing of fire intensity.
Forests 13 00116 g004
Figure 5. Relationship between the number of recruits in each each 200 50 × 50 m quadrat of each species for 89 species in Huai Kha Khaeng Forest Dynamics Plot, Thailand. Line colors represent effect of fire intensity on recruitment.
Forests 13 00116 g005
Figure 6. Boxplot of the Kruskal-Wallis test of number of recruits per quadrat across areas of Orophea polycarpa; OROPPO, Vatica harmandiana; VATIHA, Croton roxburghii; CROTRO, Senna timoriensis; SENNTI in Huai Kha Khaeng Forest Dynamics Plot, Thailand. Note the vertical axis differs among panels. The multiple-pairwise comparison in number of recruits between areas are applied by the Wilcoxon test. Asterisks indicate statistically significant difference: n.s. for p > 0.05; * for p ≤ 0.05; ** for p ≤ 0.01; **** for p ≤ 0.0001.
Forests 13 00116 g006
Figure 7. Simple linear regression analyses between community-weighted mean (CWM) of functional traits and fire intensity in Huai Kha Khaeng Forest Dynamics Plot, Thailand. WD, wood density; LDMC, leaf dry matter content; LPC, leaf phosphorus concentration; LNC, leaf total nitrogen concentration.
Forests 13 00116 g007
Figure 8. Kernel density estimate of post-fire community-weighted mean (CWM) of functional traits and fire intensity in Huai Kha Khaeng Forest Dynamics Plot, Thailand. Chlo, Chlorophyll content; LT, leaf thickness; LA, leaf area; SLA, specific leaf area; LDMC, leaf dry matter content; WD, wood density; LCC, leaf total carbon concentration; LNC, leaf total nitrogen concentration; and LPC, leaf total phosphorus concentration.
Forests 13 00116 g008
Figure 9. Percent of species-specific contribution of recruits to community-weighted mean trait of leaf phosphorus concentration (LPC) in Huai Kha Khaeng Forest Dynamics Plot, Thailand. Bar charts represent the top four species that their LPC contributed most to the community and all others. Alphabets on the x-axis are the species code (sp) (see Table S1) such as Croton roxburghii; CROTRO, Orophea polycarpa; OROPPO, Senna timoriensis; SENNTI, and OTHERS are other species excluding the top four species. Unburnt, Low, and High are unburnt area, low-intensity burn area, and high-intensity burn area, respectively.
Forests 13 00116 g009
Table 1. Summary of the variables, abbreviations, and measurement units of functional traits.
VariableAbbreviationMeasurement Unit
Leaf chlorophyll contentChloSPAD unit
Leaf thicknessLTmm
Leaf areaLAcm2
Leaf dry matter contentLDMCmg g−1
Specific leaf areaSLAcm2 g−1
Leaf total carbon concentrationLCCg kg−1
Leaf total potassium concentrationLKCg kg−1
Leaf total nitrogenconcentrationLNCg kg−1
Leaf total phosphorus concentrationLPCg kg−1
Table 2. Summary of paired sample t-test of community weighted-mean (CWM) of functional traits in Huai Kha Khaeng Forest Dynamics Plot, Thailand. Chlo, Chlorophyll content; LT, leaf thickness; LA, leaf area; SLA, specific leaf area; LDMC, leaf dry matter content; WD, wood density; LCC, leaf total carbon concentration; LNC, leaf total nitrogen concentration; and LPC, leaf total phosphorus concentration. CWM pre-fire shows the mean of CMWs of recruits in 2004 which are derived by 200 50 m × 50 m quadrats and CWM post-fire are accounted by CWMs of recruits in 2009. Asterisks indicate statistically significant difference: n.s. for p > 0.05; * for p ≤ 0.05; **** for p ≤ 0.0001.
Functional TraitCWM Pre-FireCWM Post-Firep ValueSignificance Level
Chlo (SPAD)50.850.80.7545ns
LT (mm)0.1530.1510.0541ns
log10 LA (cm2)1.971.923.10 × 10−8****
log10 SLA (cm2 g−1)2.212.20.8239ns
LDMC (mg g−1)3403450.0319*
WD (g cm−3)0.5690.5820.0001****
LCC (g kg−1)4554560.1275ns
LNC (g kg−1)1.31.290.0694ns
LPC (g kg−1)0.4990.4738.64 × 10−5****
LKC (g kg−1)1.231.220.5581ns
Publisher’s Note: MDPI stays neutral with regard to jurisdictional claims in published maps and institutional affiliations.

