Article

Exploring the Potential of Unmanned Aerial Vehicle (UAV) Remote Sensing for Mapping Plucking Area of Tea Plantations

1
School of Geography and Information Engineering, China University of Geosciences, Wuhan 430074, China
2
National Engineering Research Center of Geographic Information System, Wuhan 430074, China
3
Key Laboratory of Aquatic Botany and Watershed Ecology, Wuhan Botanical Garden, Chinese Academy of Sciences, Wuhan 430074, China
*
Author to whom correspondence should be addressed.
Forests 2021, 12(9), 1214; https://doi.org/10.3390/f12091214
Submission received: 5 July 2021 / Revised: 28 August 2021 / Accepted: 2 September 2021 / Published: 6 September 2021
(This article belongs to the Section Forest Inventory, Modeling and Remote Sensing)

Abstract

:
Mapping plucking areas of tea plantations is essential for tea plantation management and production estimation. However, on-ground survey methods are time-consuming and labor-intensive, and satellite-based remotely sensed data are not fine enough for plucking area mapping that is 0.5–1.5 m in width. Unmanned aerial vehicles (UAV) remote sensing can provide an alternative. This paper explores the potential of using UAV-derived remotely sensed data for identifying plucking areas of tea plantations. In particular, four classification models were built based on different UAV data (optical imagery, digital aerial photogrammetry, and lidar data). The results indicated that the integration of optical imagery and lidar data produced the highest overall accuracy using the random forest algorithm (94.39%), while the digital aerial photogrammetry data could be an alternative to lidar point clouds with only a ~3% accuracy loss. The plucking area of tea plantations in the Huashan Tea Garden was accurately measured for the first time with a total area of 6.41 ha, which accounts for 57.47% of the tea garden land. The most important features required for tea plantation mapping were the canopy height, variances of heights, blue band, and red band. Furthermore, a cost–benefit analysis was conducted. The novelty of this study is that it is the first specific exploration of UAV remote sensing in mapping plucking areas of tea plantations, demonstrating it to be an accurate and cost-effective method, and hence represents an advance in remote sensing of tea plantations.

1. Introduction

Tea plants grow globally, especially in China, India, Sri Lanka, and Kenya [1]. The area under tea cultivation globally was 500 × 104 ha in 2019, which was seven times greater than the area measured in 1946 (66 × 104 ha) [2]. To ensure the healthy growth of tea plants and maintain or increase the yield per unit area, it is necessary to regularly monitor the distribution and evaluate the status of tea plants to develop better management strategies. Tea plantation monitoring and management have traditionally relied on regular field surveys. This type of on-ground data collection is important because it provides first-hand information on tea plantations. However, these surveys are time- and labor-consuming and logically cannot be applied to large hilly or mountainous areas where tea plantations grow. Moreover, the structural characteristics of tea plants, such as the tree height and leaf area index, cannot be obtained continuously using traditional methods, and these characteristics determine the yield of tea plantations.
Remote sensing techniques, on the other hand, provide fast, repeatable, and cost-effective methods for mapping tea plants and estimating the biophysical and biochemical parameters of tea plants. Currently, various types of remote sensing platforms (satellite-, airborne-, and terrestrial-based) and various types of sensors (spectral, radar, lidar, photogrammetric, etc.) can be used for tea plantation monitoring depending on the scale and aim of the study. For example, Wang [3] mapped tea plantations from multiseasonal Landsat-8 images using a random forest classifier. Snapir et al. [4] monitored tea shoot growth using X-Band Synthetic Aperture Radar (SAR) images. Bian et al. [5] predicted the foliar biochemistry of tea based on hyperspectral technology. However, due to the elongated shapes of tea plantations (which have a typical width of 0.5–1.5 m, as illustrated in Figure 1), remotely sensed satellite data might not be suitable for the regular monitoring of tea plantations at finer scales, such as at the scale of a cluster or the plucking area [6]. Although manned aircraft data can provide the high resolution and high precision required for finer-scale monitoring, these data are expensive, not widely available, and not suitable for small area plantations (such as plantations ≤ 300 ha).
Unmanned aerial vehicles (UAVs) paired with digital cameras and lidar scanners have the potential to (1) provide imagery with very high spatial resolutions (≤0.20 m) and high-density lidar point clouds (footprint: 0.05–0.25 m, density: ≥20 points/m2), hence making the plucking area of tea plantations accessible [7]; (2) increase the efficiency of on-ground surveys by collecting full horizontal and vertical coverage information in less time than traditional field surveys [8]; and (3) provide high-mobility, cost-effective, widely available methods that serve as alternatives to manned aircraft surveys while maintaining and even increasing the resolution and accuracy of the obtained data [9,10].
UAV-derived remotely sensed data have been widely used to obtain precision agriculture and forest inventories over the past decade. Husson et al. [11] used visible images from UAVs to identify riparian species compositions in northern Sweden and rapidly mapped the distribution of vegetation along a shoreline. Senthilnath et al. [12] fused Sentinel-2 data with UAV images to map crop distributions at a finer spatial scale. Wang et al. [13] used UAV lidar as a sampling tool and combined it with Sentinel-2 images to estimate and map the height and aboveground biomass of mangrove forests on Hainan Island. Pourshamsi et al. [14] integrated PolInSAR and lidar data to obtain better estimates of forest canopy height. With the rapid development of sensors and UAVs, the implementation of very high-resolution data acquired from cost-effective UAVs will become an increasingly valuable method used to map and evaluate various crops and forests.
Tea plucking areas are directly related to the tea yield and are important for tea garden precision management. Despite the importance of accurately mapping tea plantations and evaluating the status of tea plants at a finer scale, mapping the plucking area of tea plantations has not been concerned and addressed to date [15]. Furthermore, to the best of our knowledge, no studies have explored the potential of UAV-derived remotely sensed data for mapping the plucking area of tea plantations. Few studies have used satellite or airborne imagery to map tea plantations. Dihkan et al. [16], for example, employed high-resolution multispectral digital aerial images to map tea plantation distributions. Zhu et al. [17] developed a method for identifying tea plantations based on multitemporal Sentinel-2 images and a multifeature random forest algorithm. Chuang and Shiu [18] identified tea crops in a subtropical region with real-time high-resolution WorldView-2 imagery using random forest and support vector machine algorithms. The existing studies have not paid attention to the plucking area of tea plantations, and the previous study areas have been limited to flat areas, which are not the main region in which tea plants grow.
This study aimed to explore the potential of UAV remotely sensed data for mapping the plucking area of tea plantations. To pursue this objective, we collected optical imagery, digital aerial photogrammetry, and lidar data of a tea garden by UAV and designed four classification models based on different UAV remotely sensed data. A recursive feature elimination algorithm was applied to select the important features from optical imagery and point clouds. Finally, a novel method for mapping the plucking area of tea plantations based on UAV-derived data is proposed.

2. Materials and Methods
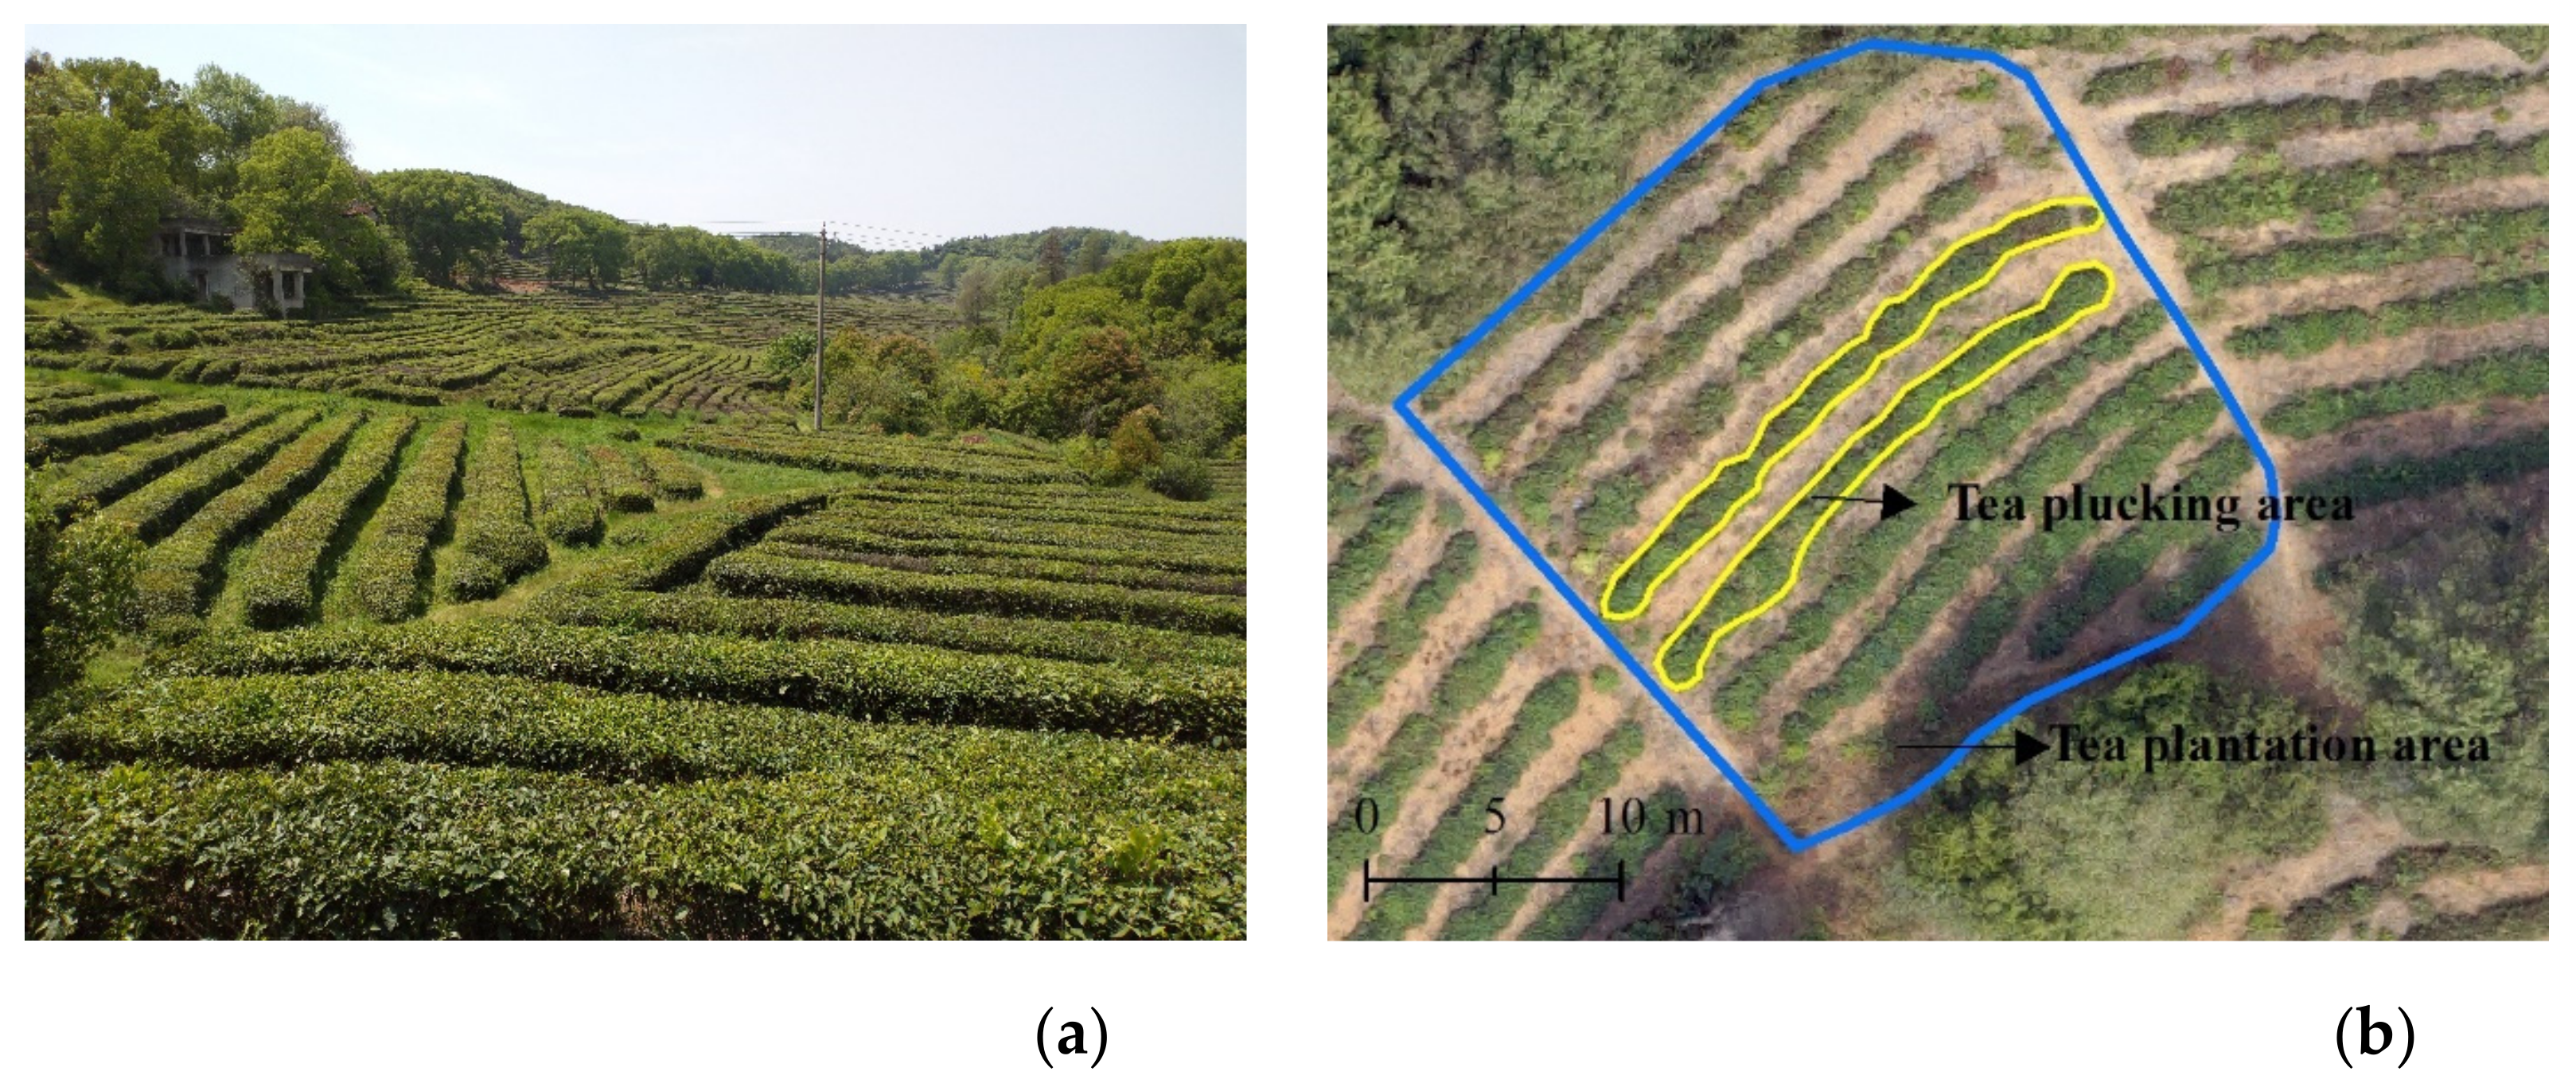
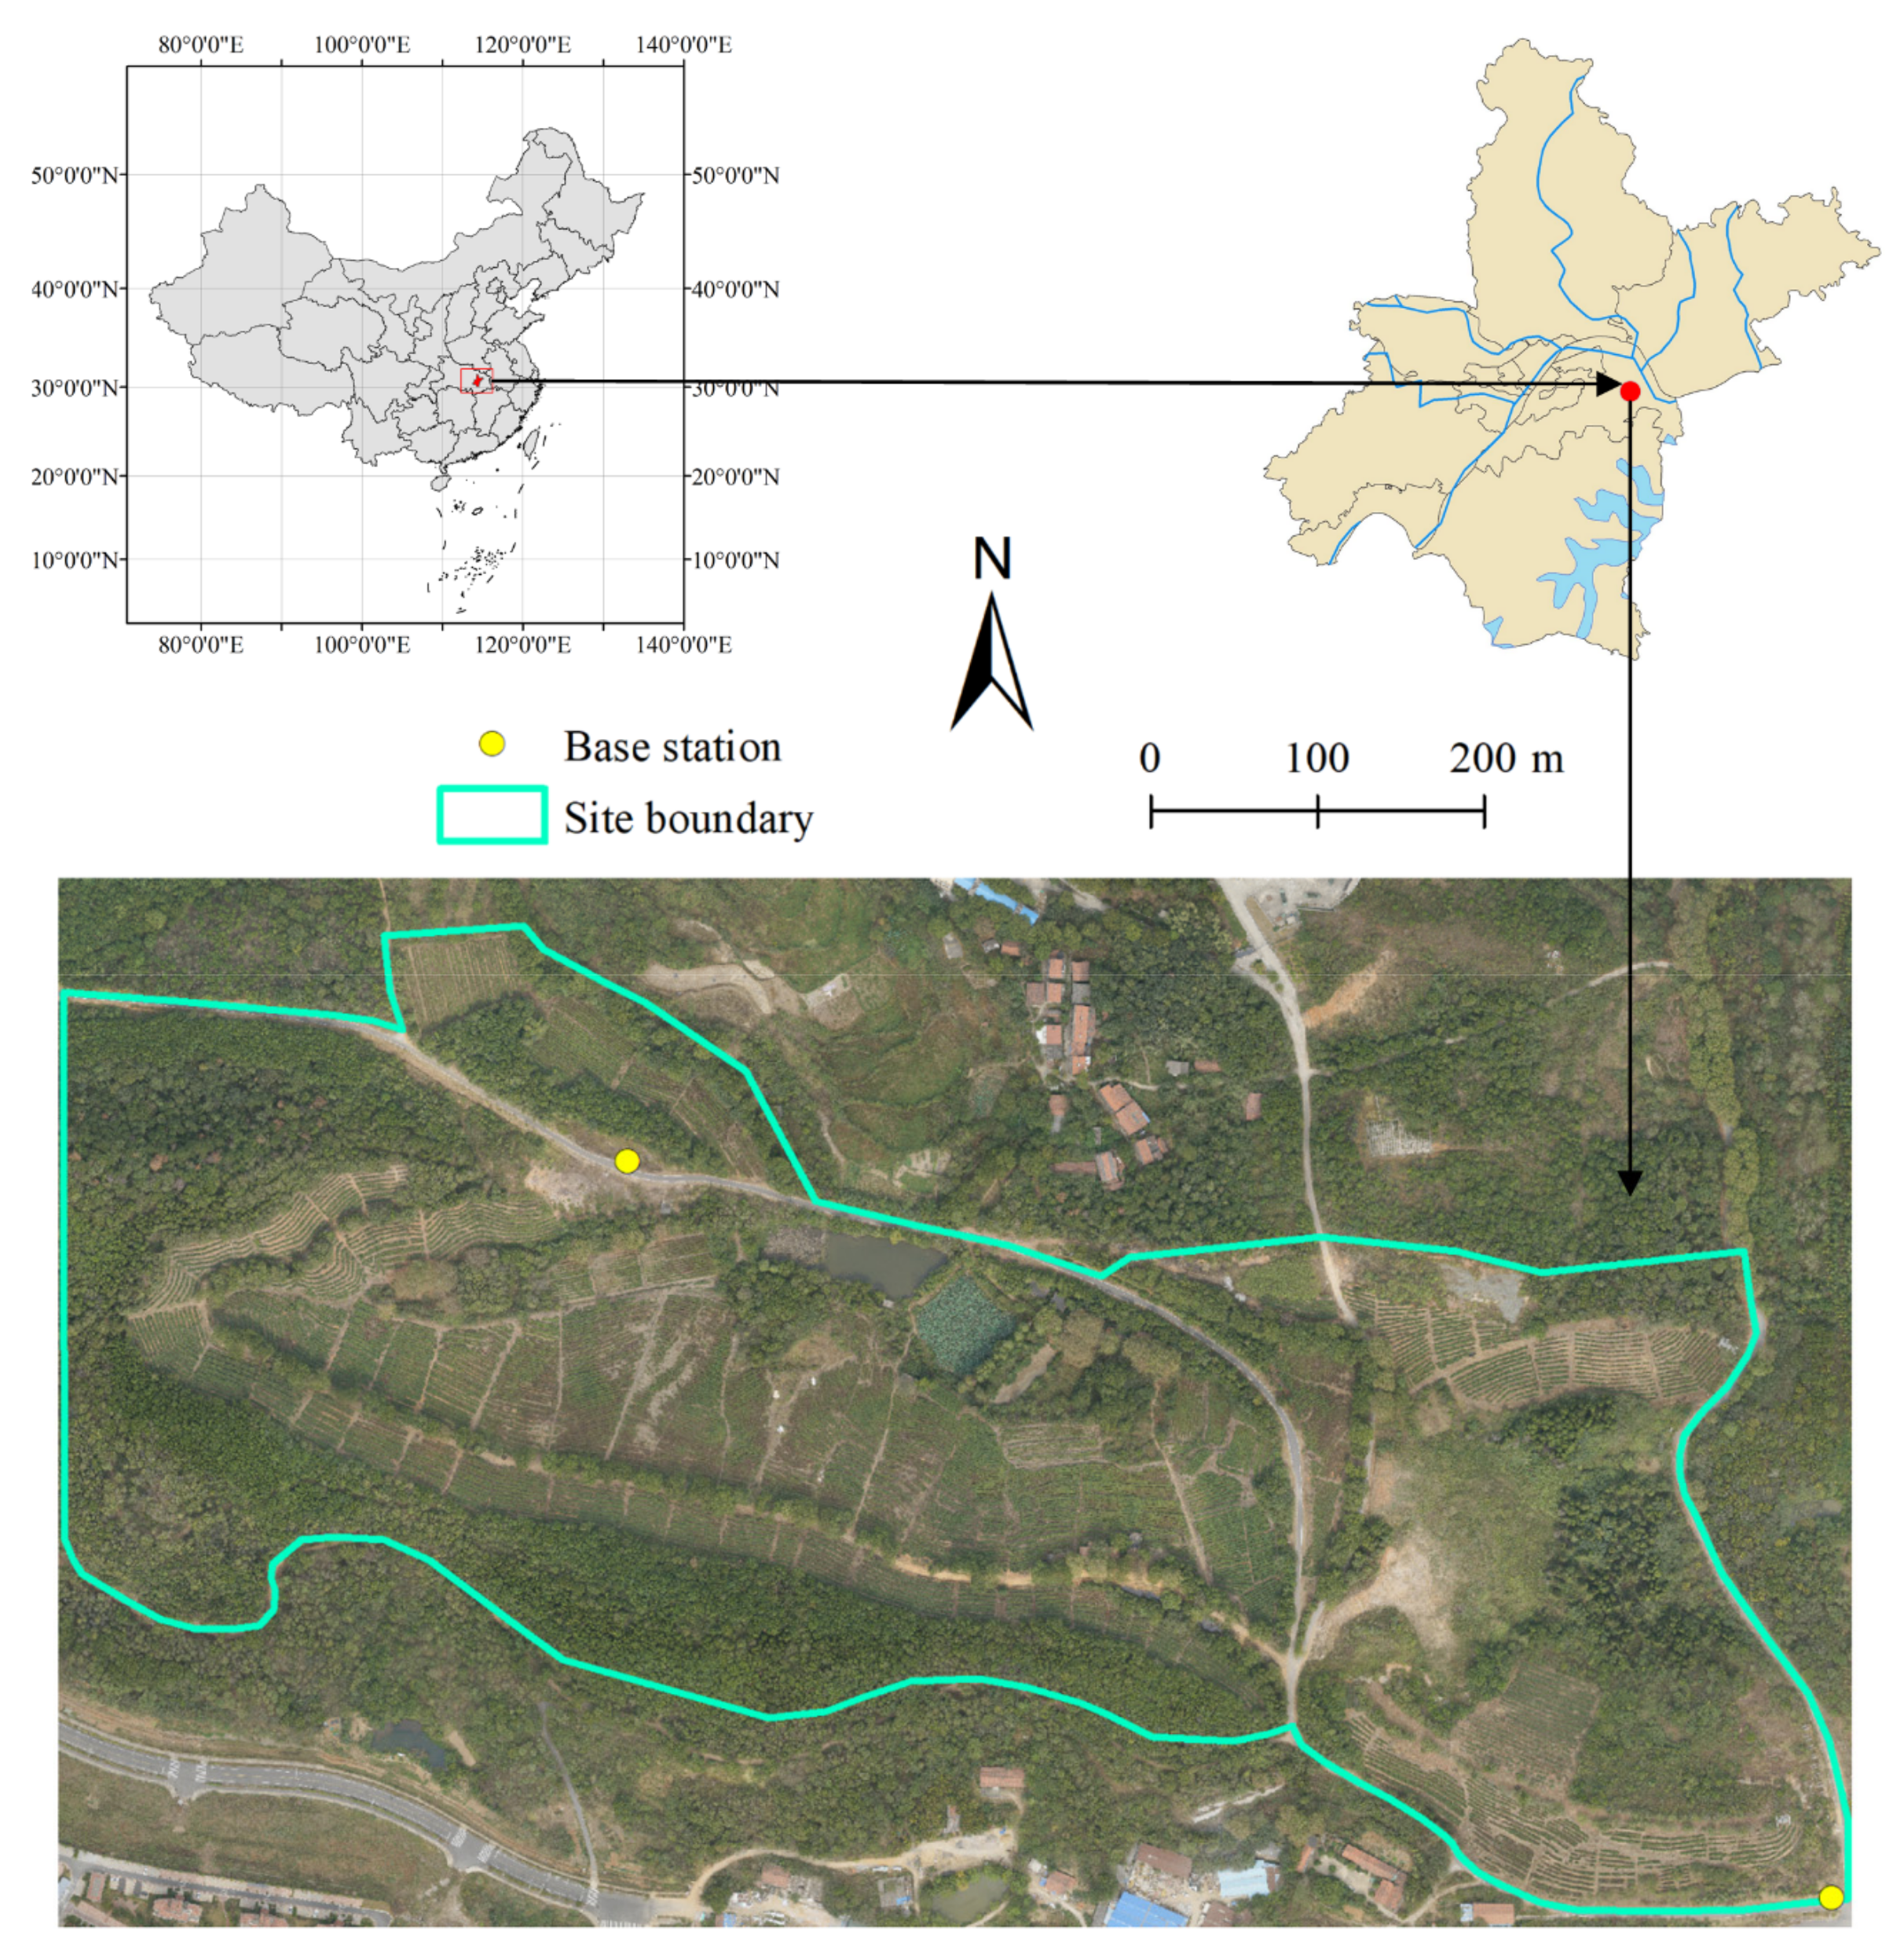
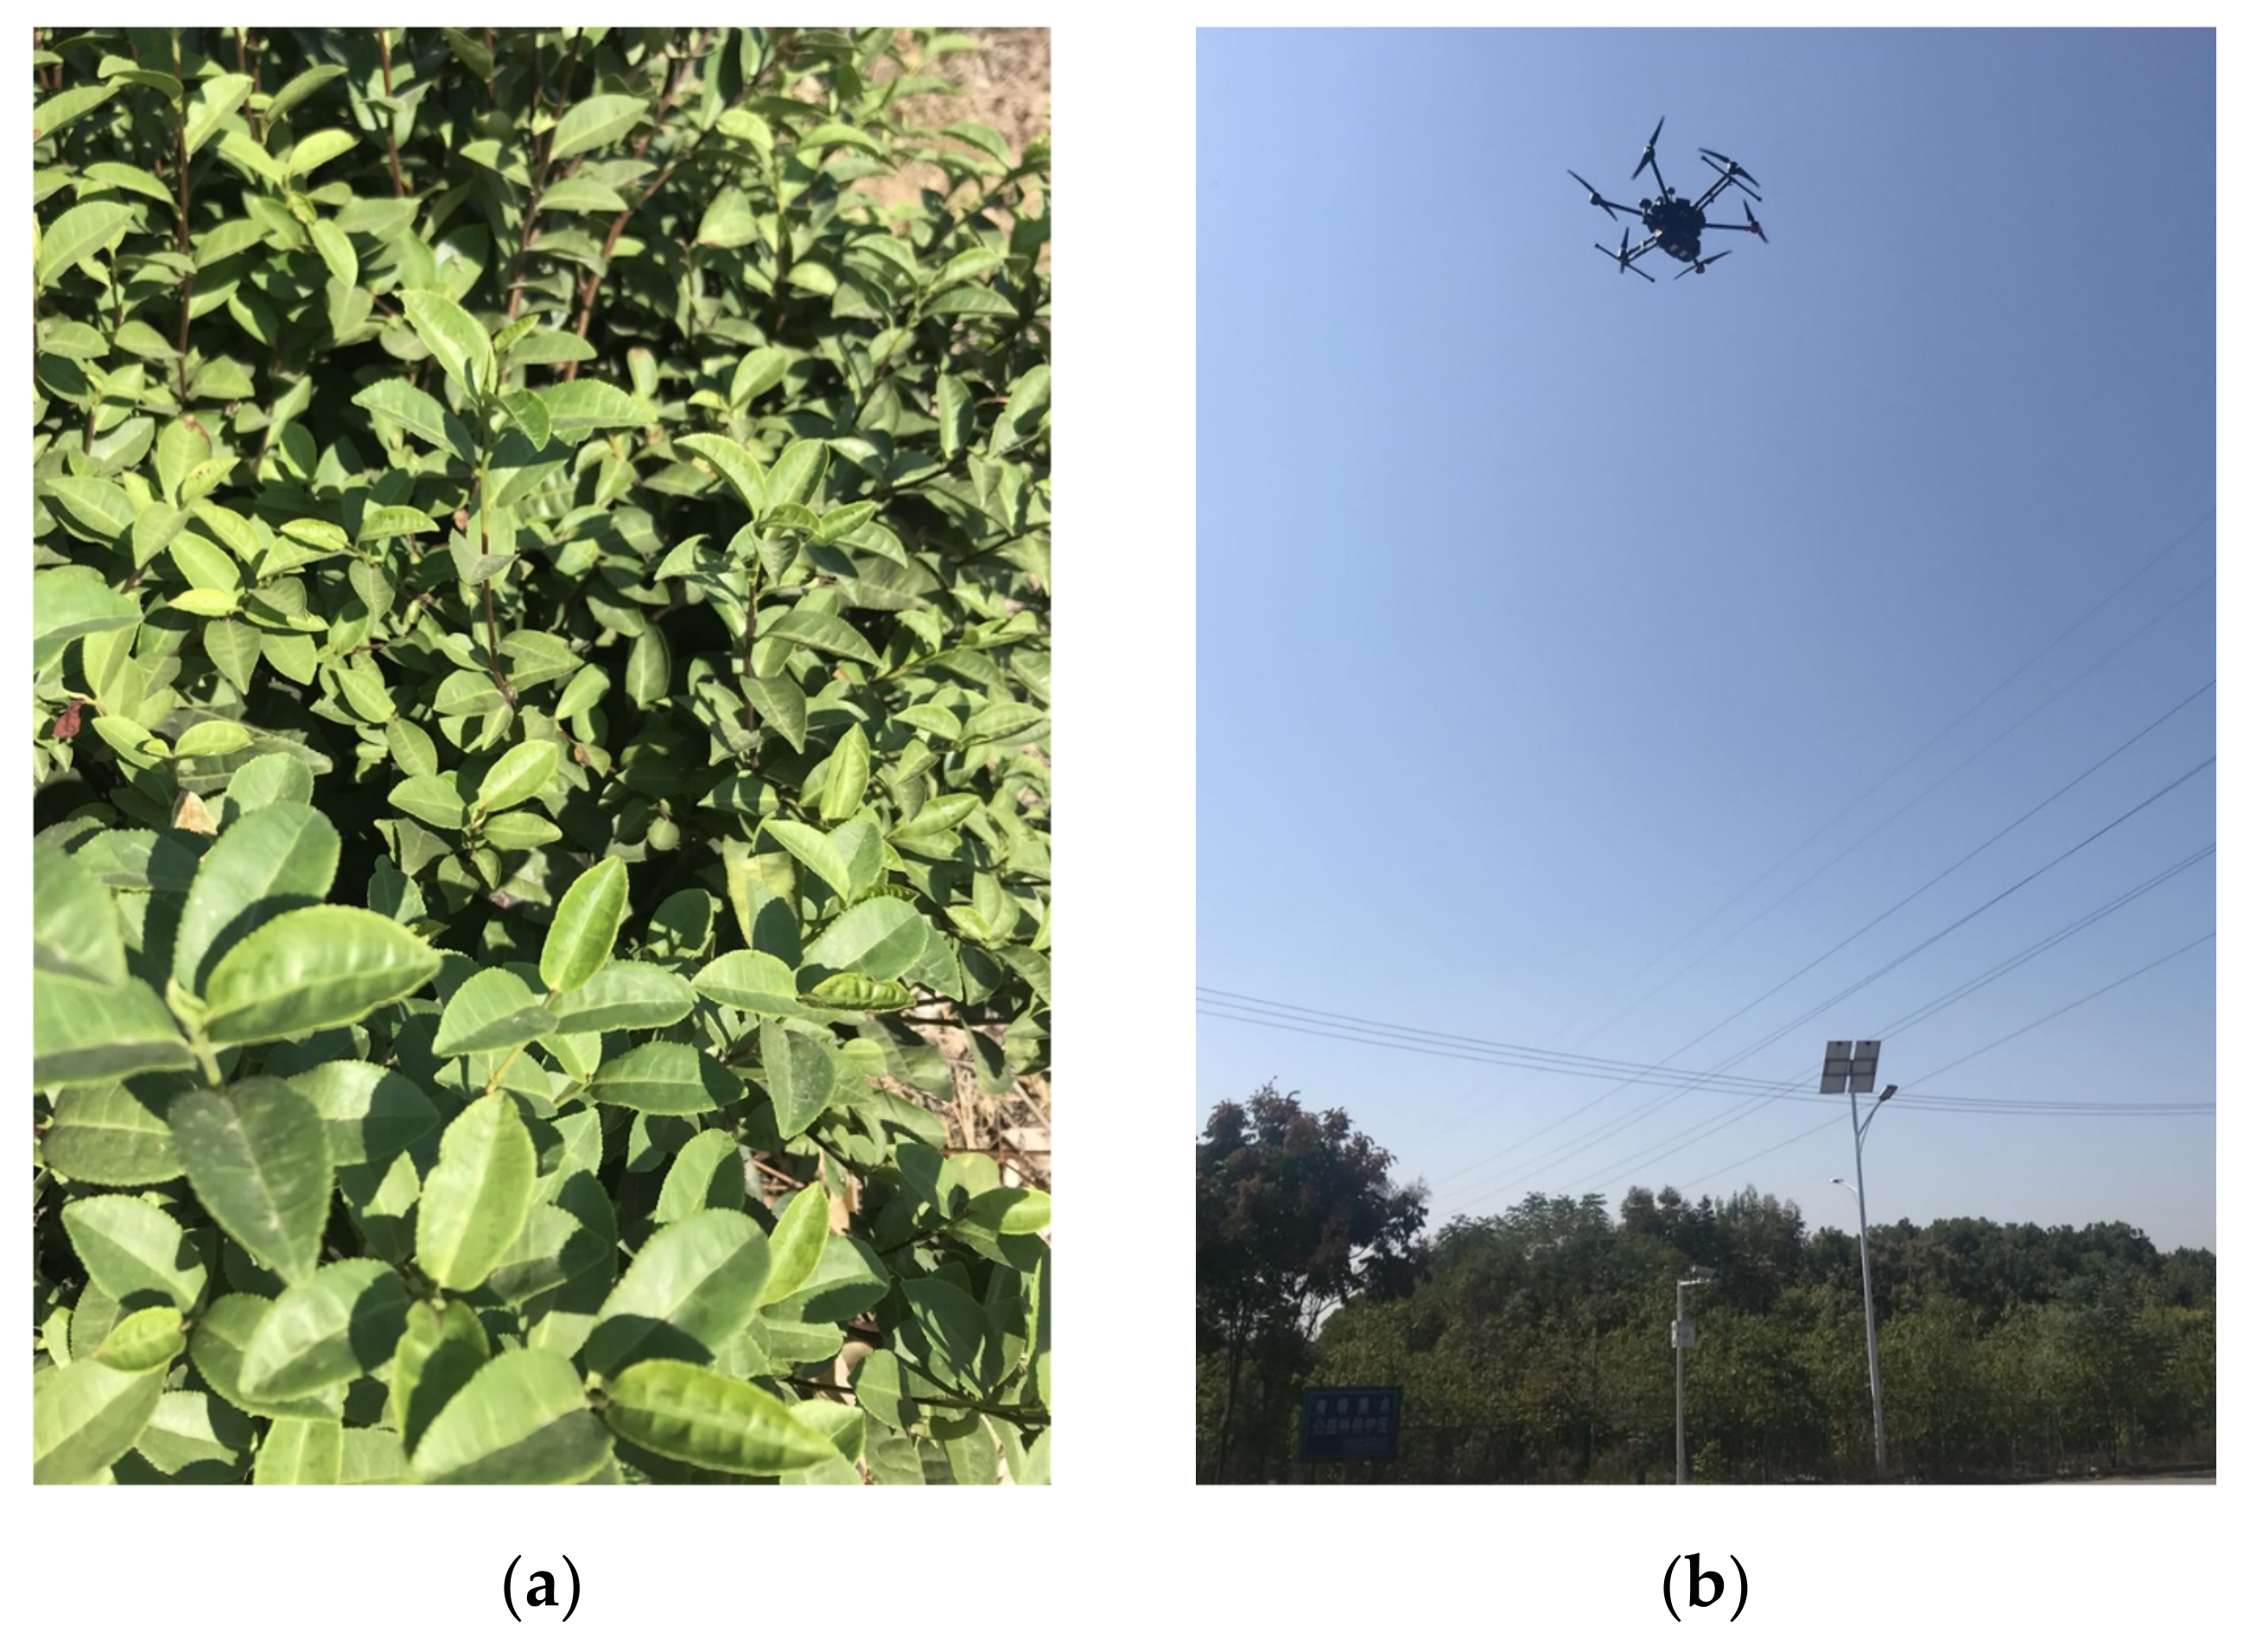
2.1. Study Area

The study area is located in Huashan (114°30′36.11″ E, 30°33′50.39″ N), Wuhan city, China (Figure 2). As an ecological park, the Huashan Tea Garden not only is a recreation and enjoyment area in which citizens can touch and experience tea plantations but also produces the local specialty green tea called “Huashan Tender Bud”. Wuhan is characterized by a humid subtropical climate with an average daily temperature ranging from 4.0 °C (January) to 29.1 °C (July) and average annual precipitation of 1269 mm. The study area is hilly, and the topography is high in the southwest and low in the northeast, with the lowest elevation of 8.1 m and the highest elevation of 83.51 m.

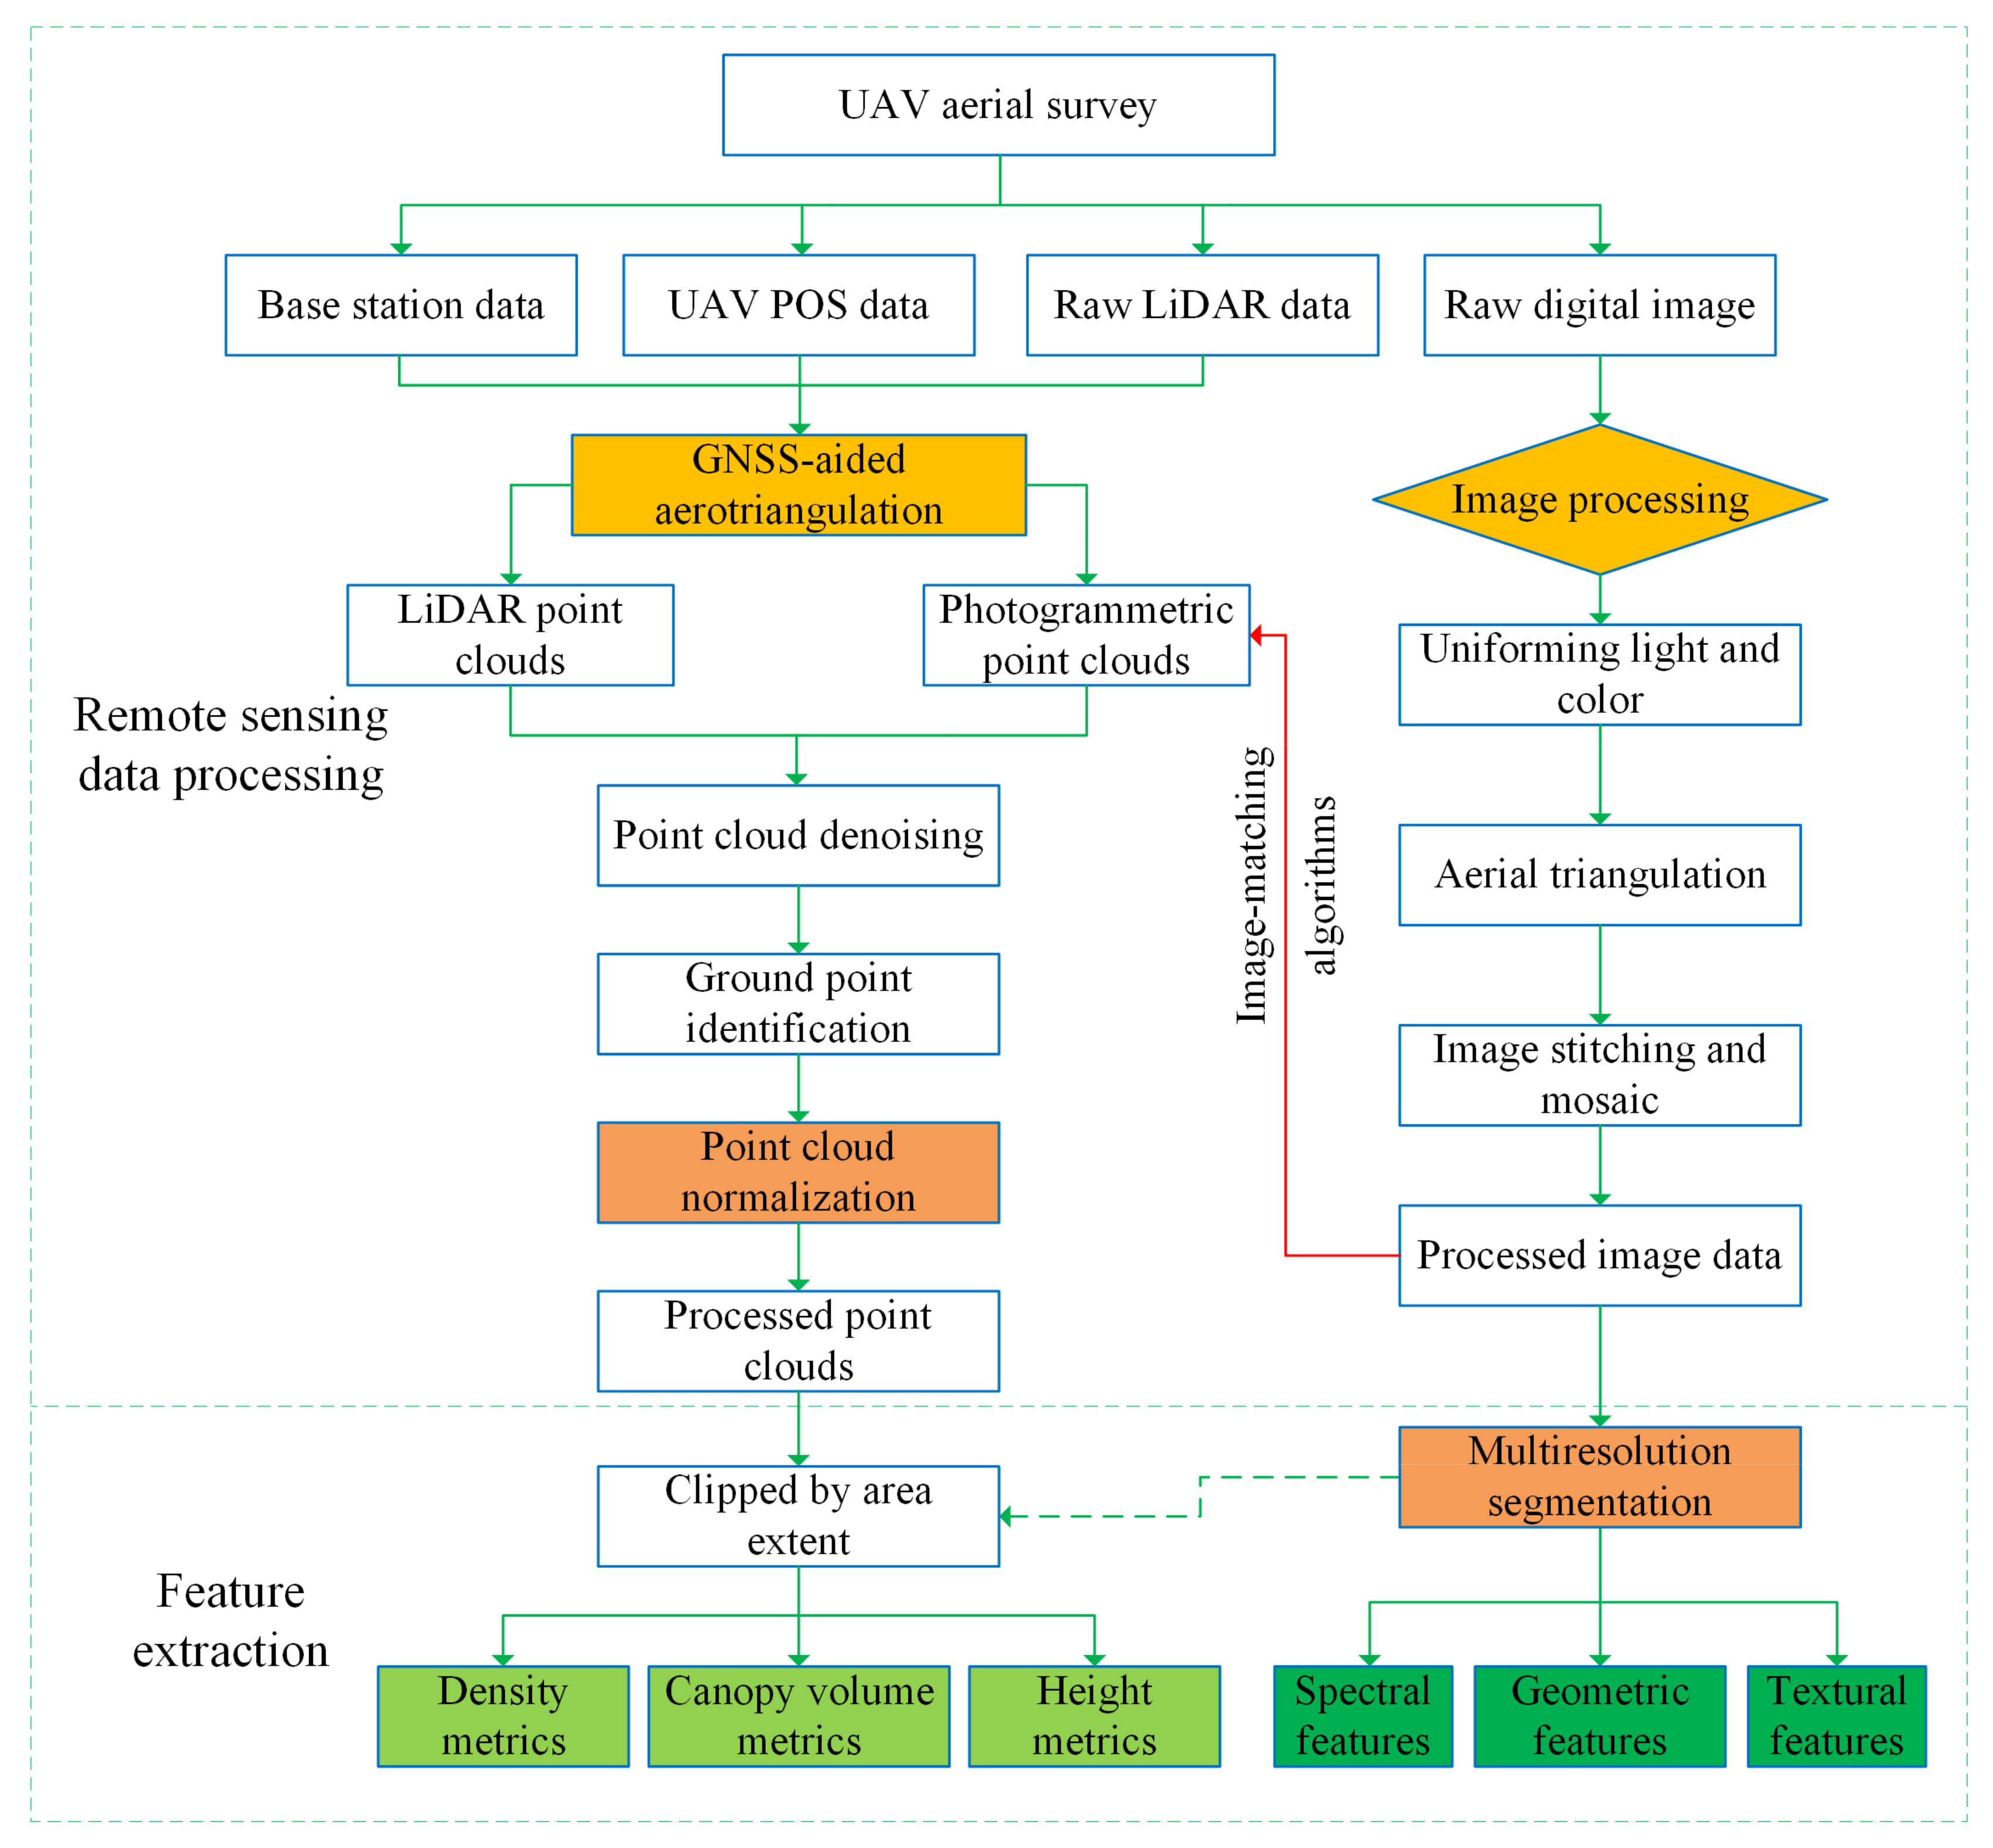
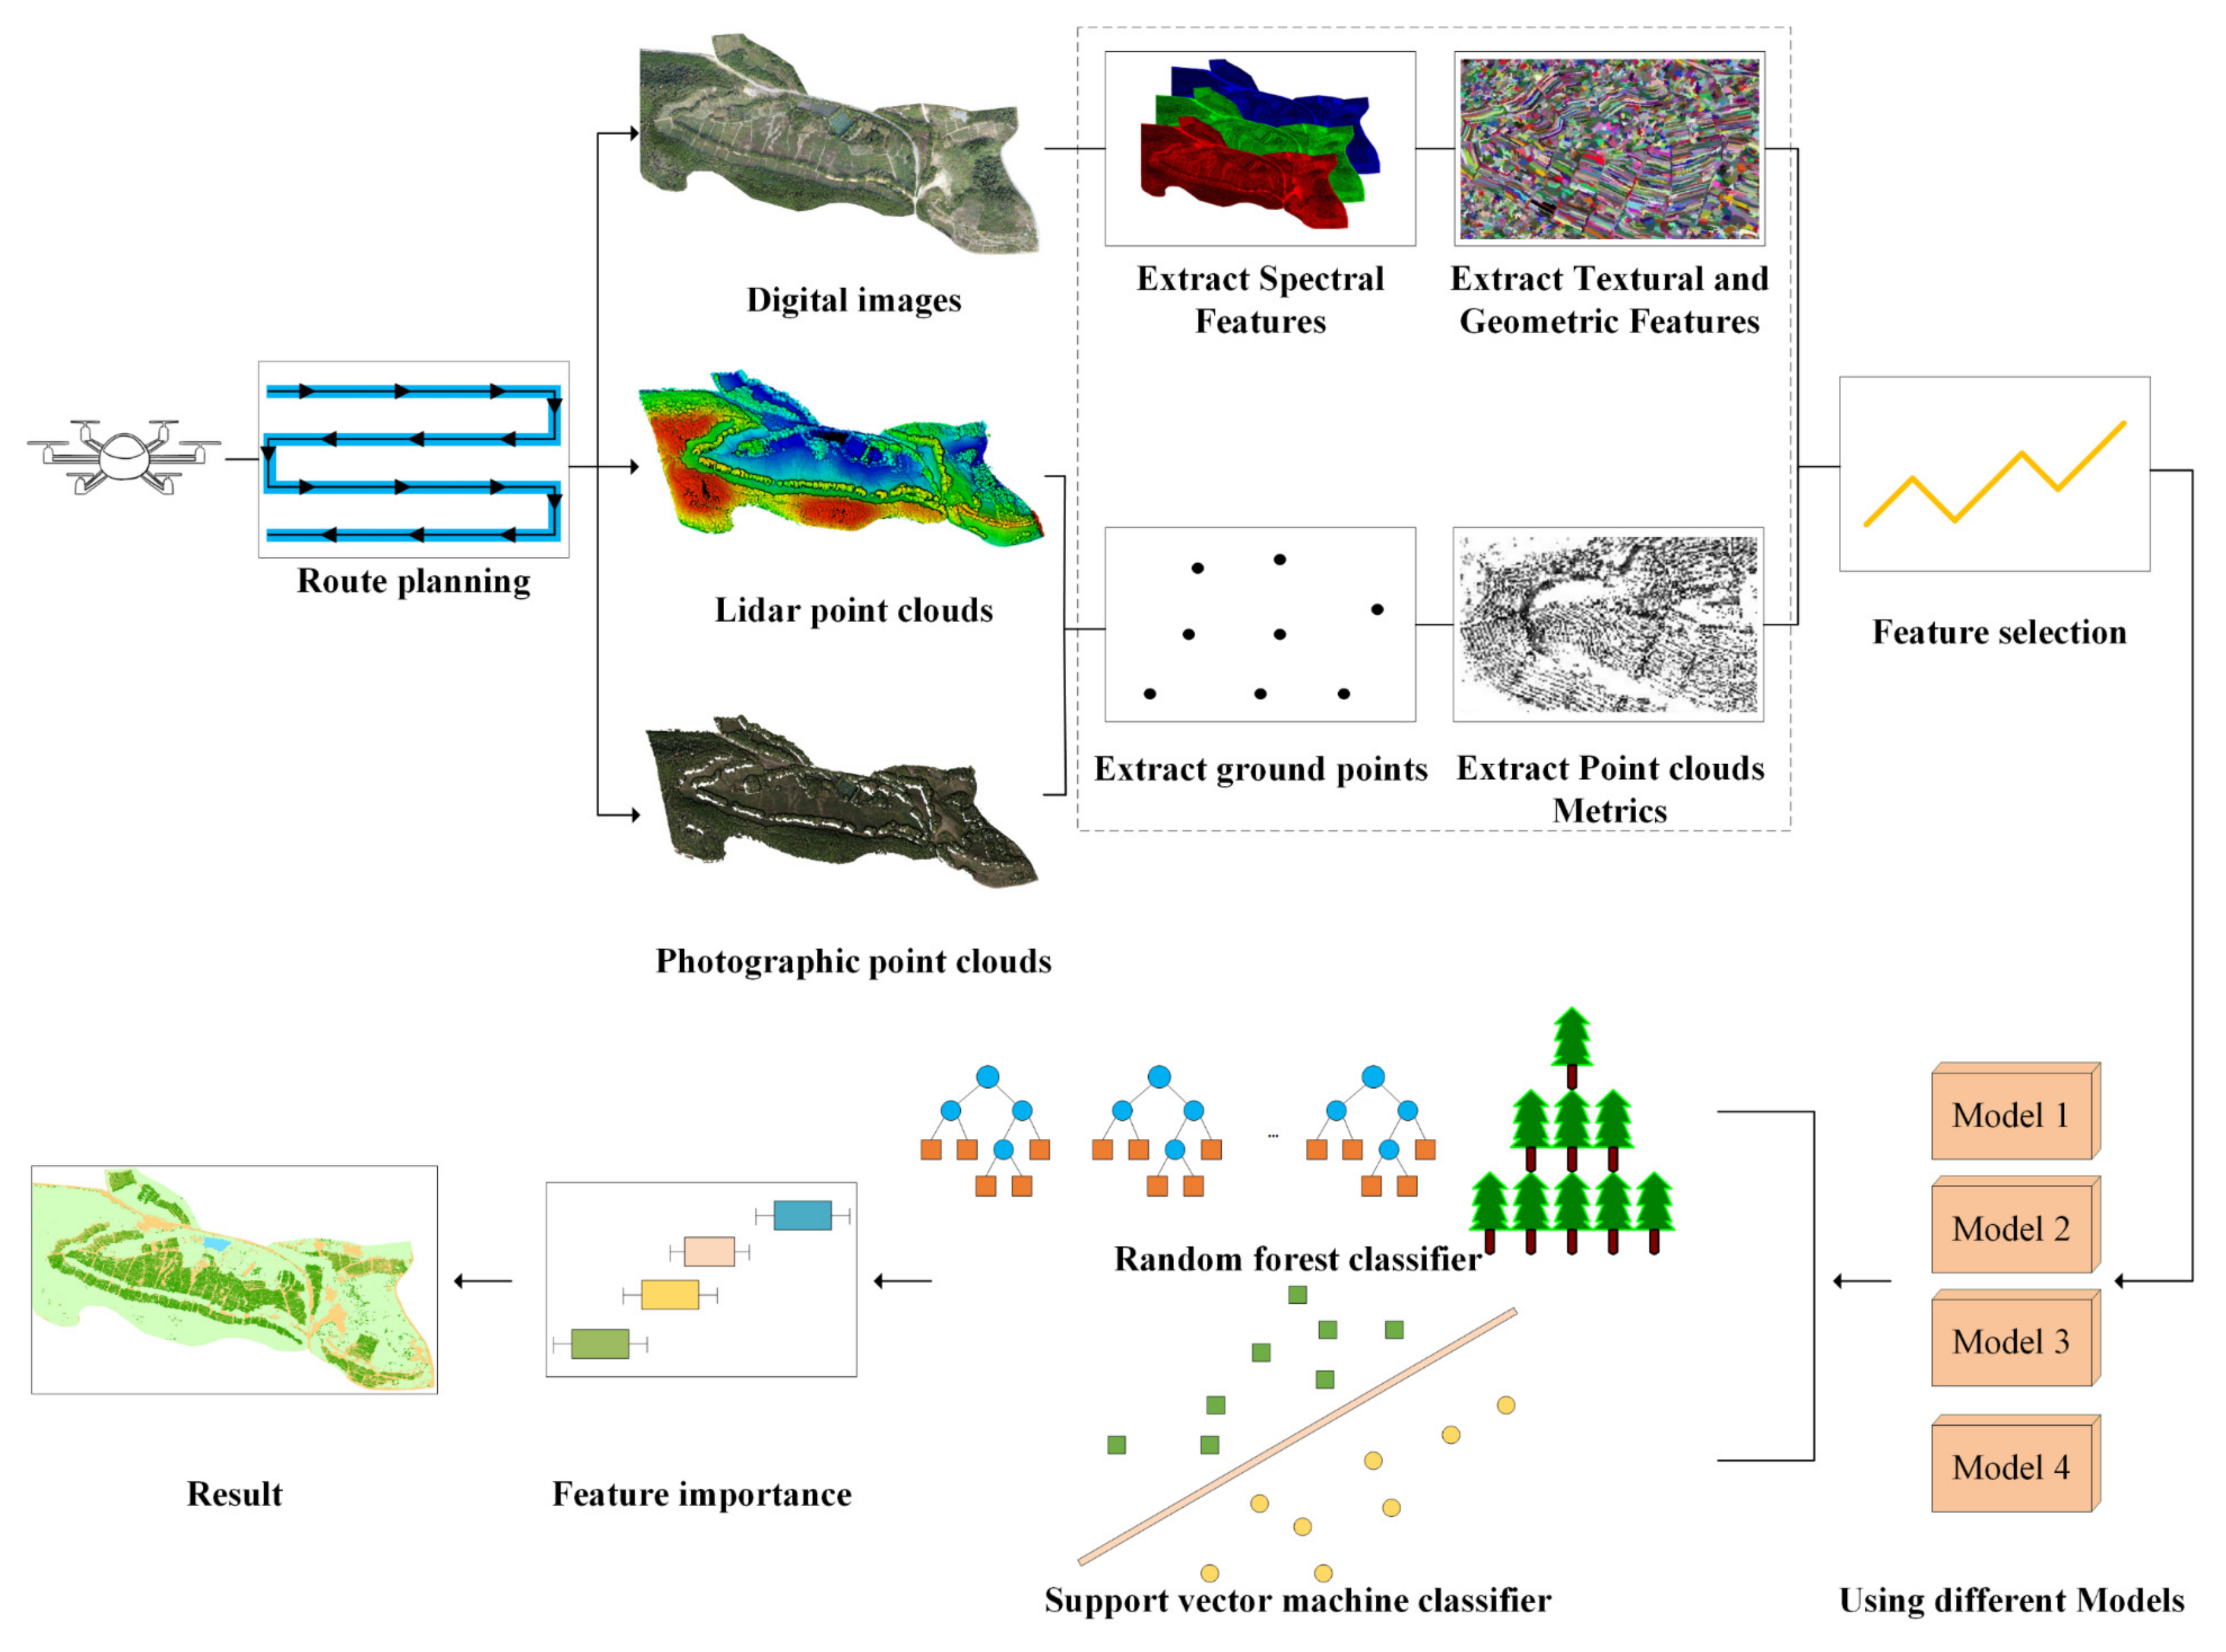
2.2. UAV Data and Feature Extraction

2.2.1. Lidar Point Clouds

The lidar point clouds were acquired on 1 October 2019 using a Velodyne LiDAR VLP-16 Puck sensor (Velodyne Lidar Inc, San Jose, CA, USA) mounted on a DJI M600 UAV. (DJI, Shenzhen, China) This laser sensor has 16 scanning channels and can generate 300,000 pulses per second with a range accuracy of 3 cm. The wavelength of the laser pulse is 905 nm. We performed three flights in the study area with a flight altitude of 60 m above ground level and a flight speed of 5 m/s (Figure 3). Overall, the average final point density was 25 points/m2.
Figure 4 depicts the workflow followed in processing the UAV-derived remotely sensed data. The main processing steps of the UAV-derived lidar data included global navigation satellite system (GNSS)-aided aerotriangulation, point cloud denoising, ground point identification, and point cloud normalization using a digital elevation model (DEM). GNSS-aided aerotriangulation was used to calculate the exact geographic locations of the point clouds based on the base station position (measured with a real-time kinematic global navigation satellite system (RTK-GNSS)) and the positioning system data of the UAV, which was performed using POSPac UAV 8.1 software (Applanix, Richmond Hill, Ontario, Canada). The point clouds were classified as ground or nonground points using an improved progressive triangulated irregular network (TIN) densification filtering algorithm [19]. The final ground point density was 0.84 points/m2. These ground points were then used to generate a DEM using the TIN interpolation algorithm. We also generated a digital surface model (DSM) based on all point clouds. To eliminate the influence of the ground topography on the point clouds, the nonground points were normalized using the obtained DEM. Finally, a canopy height model (CHM) was produced by subtracting the DEM from the DSM.
We extracted 34 commonly used lidar metrics (21 for height, 3 for canopy volume, and 10 for density), as represented in Table 1, based on previous studies related to crops and forests [20,21,22,23]. For example, the leaf area index (LAI) is defined as half of the surface area of all leaves projected on the surface area of a unit. LAI value was calculated according to Equations (1) and (2) provided by Richardson et al. [24]:
L A I   c o s a n g × l n G F k ,
G F = n g r o u n d n ,
where a n g is the average scan angle, k is the extinction coefficient and approximately equals 0.5, and G F is the gap fraction which was calculated as the ratio of ground points ( n g r o u n d ) and total points ( n ). These metrics were computed for each segmented polygon generated from the multiresolution segmentation algorithm (see details about the algorithm in Section 2.2.2).

2.2.2. Optical Imagery and Photogrammetric Point Clouds

Optical imagery was acquired by an EOS 5D camera mounted on a DJI M600 UAV on 1 October 2019, the same day as that of the lidar data collection. We performed one flight in the study area with a flight altitude of 300 m above ground level. The number of bands was three, namely red, green, and blue. The spatial resolution was 0.1 m.
We segmented the images into individual objects and obtained the corresponding feature parameters for the object-based image analysis. In addition to containing spectral information, objects have rich internal spatial information, such as geometric and textural information [25]. When conducting object-based image analyses, the multiresolution segmentation of image objects at different levels can allow more descriptive features to be obtained; these features express the actual characteristics of objects and effectively enhance the subsequent remote sensing classification. The images were segmented in the eCognition Developer 9.0.1 (Trimble, Sunnyvale, CO, USA) by the multiresolution segmentation algorithm. The multiresolution segmentation algorithm starts with pixel-sized objects and grows iteratively by merging the objects in pairs with neighboring objects [26]. The sizes and shapes of the image objects are determined by user-defined parameters, namely the scale, color/shape, and smoothness/compactness. The values of the image segmentation parameters used in this study are shown in Table 2. Figure 5 delineates a comparison of the segmentation performance using four different segmentation parameter sets. The image segmentation process was considered complete once an image object was produced that visually corresponded to a meaningful real-world object of interest [27]. We finally segmented the tea plants using the following parameters: scale: 20, color: 0.7, shape: 0.3, compactness: 0.5, and smoothness: 0.5. We extracted 10 features, as represented in Table 3.
The photogrammetric point clouds were generated using image-matching algorithms that operate in stereo or multi-image matching modes, depending on the image acquisition parameters and the degree of image overlap [28]. Pix4Dmapper software (Pix4D, Lausanne, Switzerland) was used to generate photogrammetric point clouds. This software uses still images of stationary objects to generate point clouds. Automatic tie points (ATPs) were first generated by automatic image detection and matching and produced a sparse point cloud. Then, a dense matching algorithm was used to generate the final dense point clouds. The X, Y, Z position and the color information are stored for each point of the Pix4D-derived point clouds. For details of photogrammetric point cloud generation, please refer to the support documentation of Pix4Dmapper (https://support.pix4d.com/hc/en-us/categories/360001503192 (accessed 6 June 2021)). The final photogrammetric point density was 22 points/m2. The photogrammetric point clouds were processed in the same way as the lidar point clouds, and the same 34 metrics were extracted from both datasets.

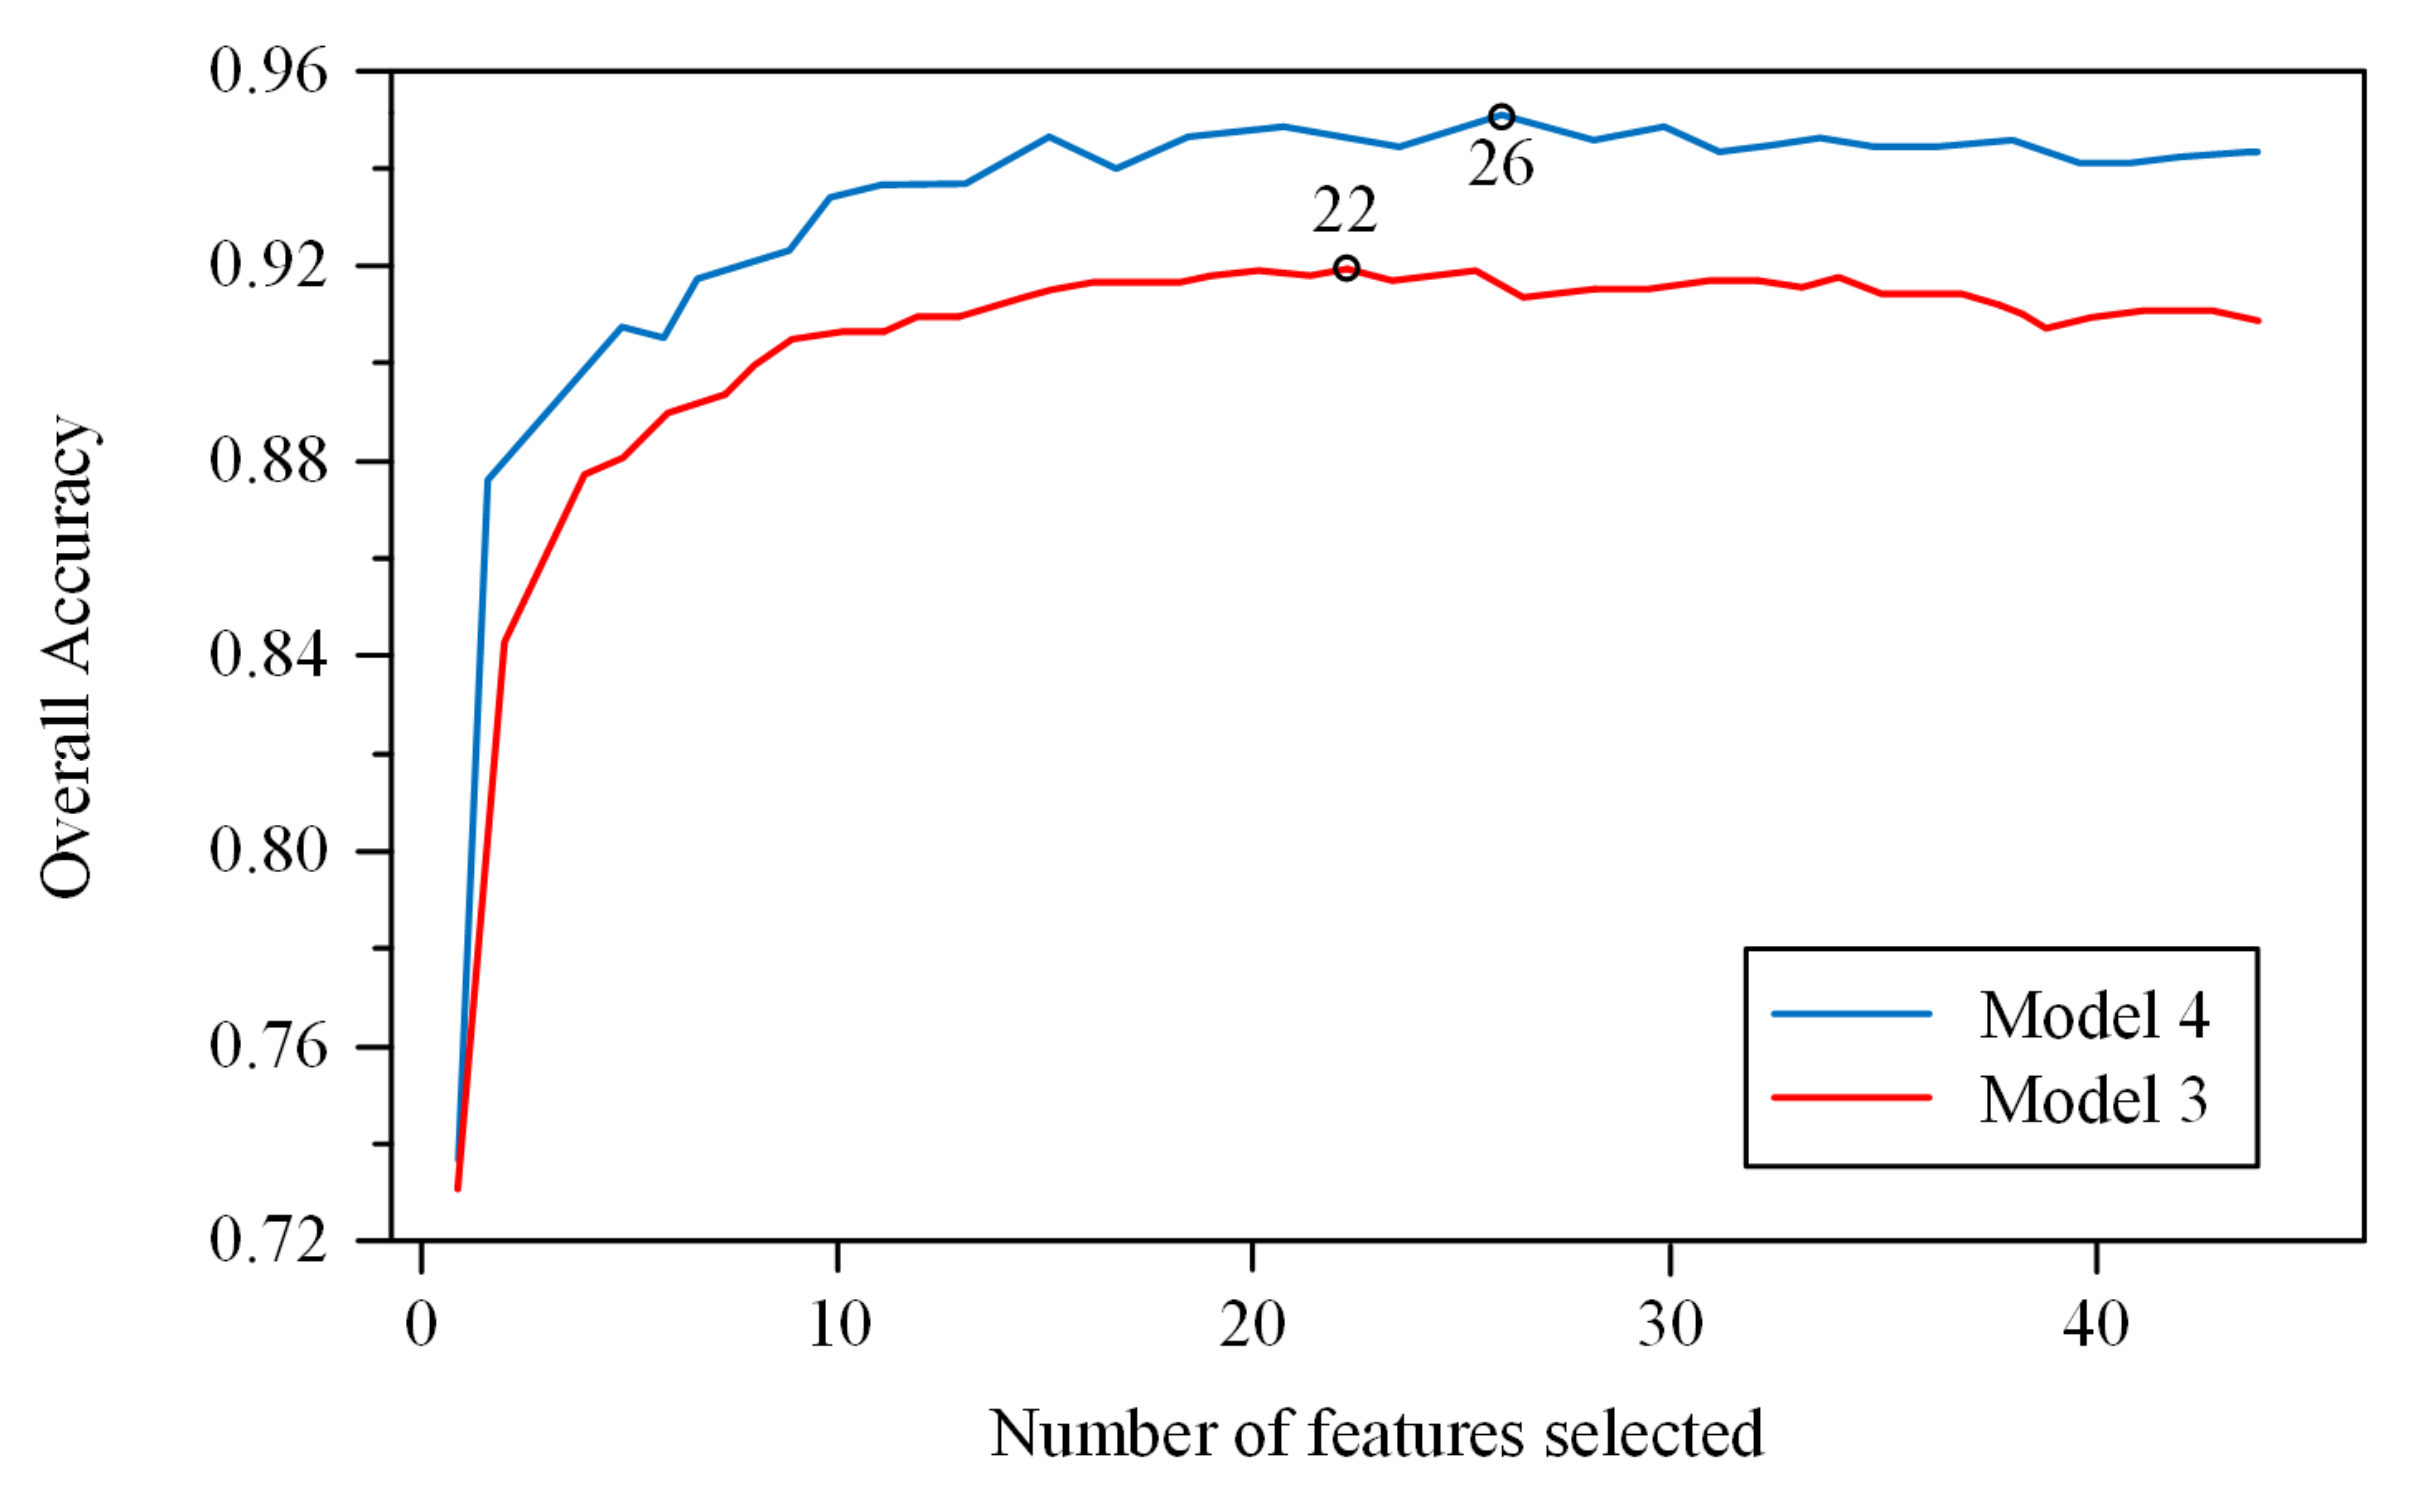
2.2.3. Feature Selection

A random forest (RF)-based recursive feature elimination (RFE) algorithm was used in this study to select the important features from optical imagery and point clouds. The RFE algorithm comprises a recursive process and compares the cross-validated classification performance of feature datasets as the number of features is reduced [30,31]. The key to the algorithm is to iteratively build the training model; then, the best feature dataset is retained based on the out-of-bag error. We implemented the RFE algorithm using Python 3.6 (Python Software Foundation, DE, USA) and the RFECV function from the scikit-learn 0.23.2 library. Two hyperparameters are crucial in the RFECV function: step and cv. The step parameter controls the number of features to be removed at each iteration. The cv parameter determines the number of folds in cross-validation. In this study, the step was set to 1, and the cv was set to 3. They were both the default values in the REECV function.

2.3. Classification Models

To systematically explore the potential of UAV remote sensing in mapping the plucking area of tea plantations, we designed four models for tea plucking area identification based on different combinations of UAV remotely sensed data with different features and compared their performance. The combination of multiple sources of data, and especially the integration of horizontal and vertical information, can often improve classification performance [32,33]. The study area was classified into four classes: tea, building, water, and vegetation (no tea).
Model 1: spectral features (red, green, and blue bands) from digital images;
Model 2: spectral, geometric (brightness, length/width, and shape index), and textural features from digital images;
Model 3: spectral, geometric, and textural features from digital images and features from photogrammetric point clouds;
Model 4: spectral, geometric, and textural features from digital images and features from lidar point clouds.
Then, support vector machine (SVM) and random forest (RF) algorithms were used in the classification models. Figure 6 shows a schematic graph of the tea plucking area identification obtained with the four different models.

2.4. Classification Algorithms

Due to the widespread use and consistent performances of support vector machine (SVM) and random forest (RF) algorithms, this study used these two classical algorithms to explore the potential of UAV-derived remotely sensed data in identifying tea plucking areas [34,35].
A support vector machine is an algorithm used to improve a classification performance based on the statistical learning theory of structural risk minimization (SRM). In this method, a training dataset is mapped by the support vector machine to a higher-dimensional space nonlinearly (called a Hilbert space). The linearly indistinguishable dataset in the input space is mapped to a divisible dataset in the higher-dimensional space; then, an optimal separating hyperplane with a maximum isolation distance is created [36]. An optimal nonlinear decision edge is created in the input space. The optimal separation of hyperplanes reduces the experiential risk of the learning machine, resulting in smaller generalization errors and minimal structural risks [37].
The random forest algorithm is a nonparametric statistical estimation technique comprising many decision trees [38]. Many decision trees are first built, and then the predicted values of all trees are averaged to obtain the final estimate. Two parameters are crucial when building the predictive model: ntree and mtry. The ntree parameter determines the maximum number of decision trees, while mtry controls the number of randomly selected features used to calculate the best partition for each node in the decision trees. In this study, ntree was set to 500; this value was large enough to allow error convergence. The mtry value was set to the default value, which is the square root of the number of input features. Through the feature importance assessment in the RF algorithm, the contribution of each feature was measured. The Gini index [39] or the out-of-bag (OOB) error rate [30] can be used as an evaluation metric. In this study, the Gini index was used to evaluate the feature importance.

2.5. Accuracy Assessment

The overall classification accuracy (OA), producer accuracy (PA), user accuracy (UA), and kappa coefficient were used to evaluate the classification accuracies. A classification confusion matrix was used to evaluate these values [40]. The sample set of this study was established using field survey data and optical images after multiresolution segmentation. We selected 2784 samples of the four classes (tea, building, water, and vegetation) as the training set. A randomly selected validation set was used to assess the classification accuracies; this dataset was also tested in the field. The number of samples for validation was 5076.

3. Results

3.1. Feature Selection

Figure 7 shows the feature selection results. The optimal numbers of features were 22 in Model 3 and 26 in Model 4. Ten features from digital images (red band, green band, blue band, brightness, length/width, shape index, entropy, contrast, homogeneity, and correlation) and 12 features from point clouds (Gap, CC0.2m, H10, H80, H90, H95, H99, HIQ, HAAD, HMean, HSD, and CHM) were selected in Model 3. Ten features from digital images (red band, green band, blue band, brightness, length/width, shape index, entropy, contrast, homogeneity, and correlation) and 16 features from point clouds (D0, D9, LAI, Gap, CC0.2m, H10, H80, H90, H95, H99, HVAR, HIQ, HAAD, HMean, HSD, and CHM) were selected in Model 4.
Figure 8 and Figure 9 portray the differences in the representative lidar and image features among the four classes, respectively. The performance of these features differed significantly among classes. The difference between tea and vegetation was small in the image features, while it was large in the lidar features. The feature selection results showed that lidar features might play important roles in separating tea from vegetation.

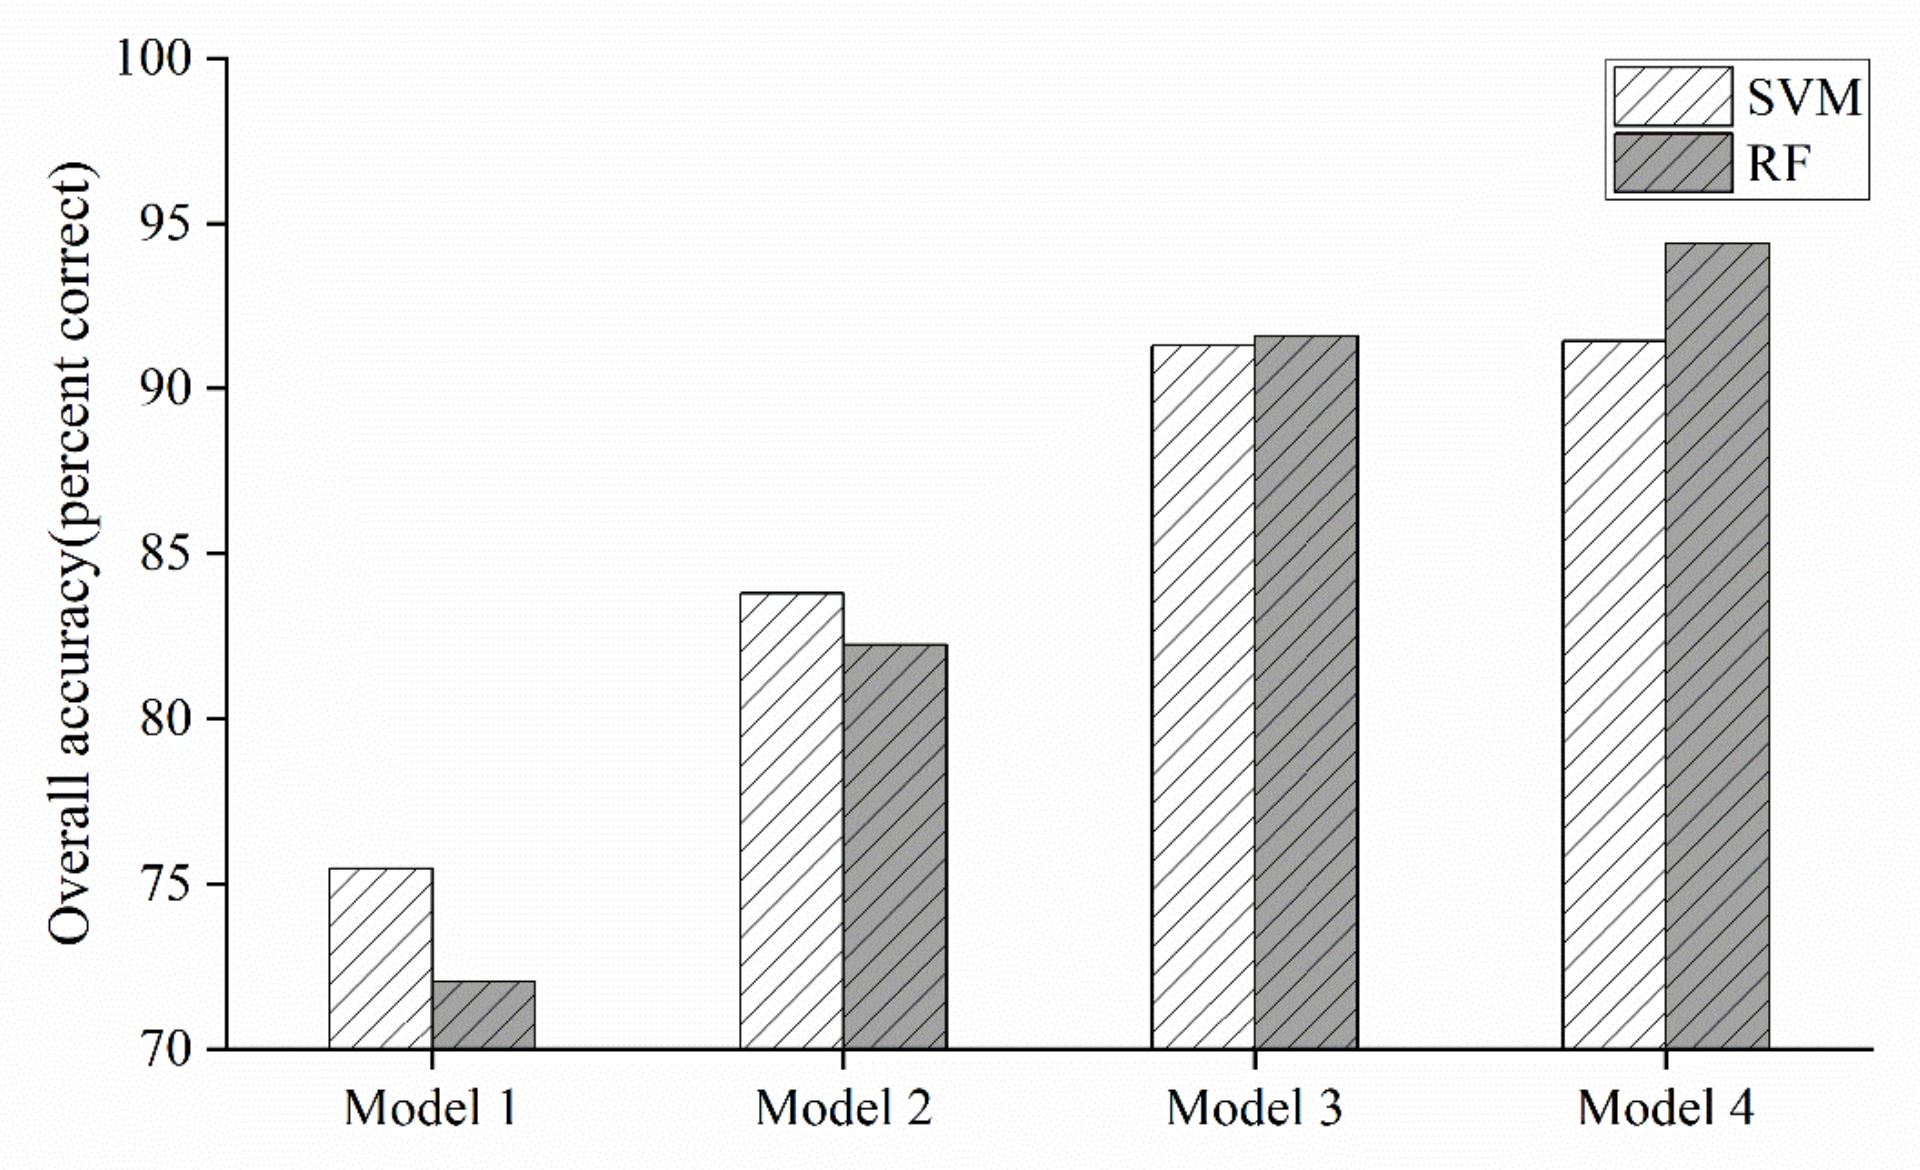
3.2. Accuracy Assessment

The classification accuracy results of the four models performed with the RF and SVM algorithms are presented in Table 4 and Table 5, respectively.
Overall, Model 4 achieved the highest classification accuracy, followed by Model 3, Model 2, and Model 1. The SVM-based and RF-based classifications performed similarly in terms of the overall classification accuracies. The highest accuracy (94.39%) was achieved by Model 4 using the RF algorithm.
Model 1 produced lower user accuracies for tea, vegetation, and water than those produced by the other models. The classification results obtained using only the spectral features (Model 1) showed that SVM and RF produced low overall accuracies (75.47% and 72.04%). In Model 2, with the textural features added, the accuracies of tea and vegetation were improved but did not exceed 85%. In Model 2, RF could better identify buildings, tea, and water than SVM, while SVM outperformed RF in identifying vegetation.
Regarding Model 3, with the photogrammetric point clouds further added, the classification accuracies of all four classes increased, with tea and vegetation showing the most significant accuracy improvement effects. For Model 4, features from the lidar point clouds were used instead of the photogrammetric point clouds used in Model 3. The SVM and RF algorithms produced overall accuracies for Model 4 of 91.43% (kappa: 0.86) and 94.39% (kappa: 0.91), respectively. Model 4 had a slightly higher accuracy than Model 3. The accuracies of Model 4 and Model 3 were similar when the SVM algorithm was used, while the accuracy of Model 4 was 2.81% higher than that of Model 3 when the RF algorithm was used.
Consequently, Table 4 and Table 5 indicate that with the gradual addition of features, the PA and UA of each class gradually and significantly improve overall. The PA and UA of tea over 85% were only achieved using the random forest algorithm in Model 3 and Model 4.
Figure 10 shows a comparison of the overall accuracies of the four models as assessed with the two machine learning algorithms. Overall, SVM and RF produced similar results. For Model 1 and Model 2, SVM (OA: 75.47% and 83.80%, respectively) identified slightly better accuracies than RF (OA: 72.04% and 82.25%, respectively); for Model 3 and Model 4, RF (91.58% and 94.39%, respectively) outperformed SVM (91.32% and 91.43%, respectively).

3.3. Visual Assessment

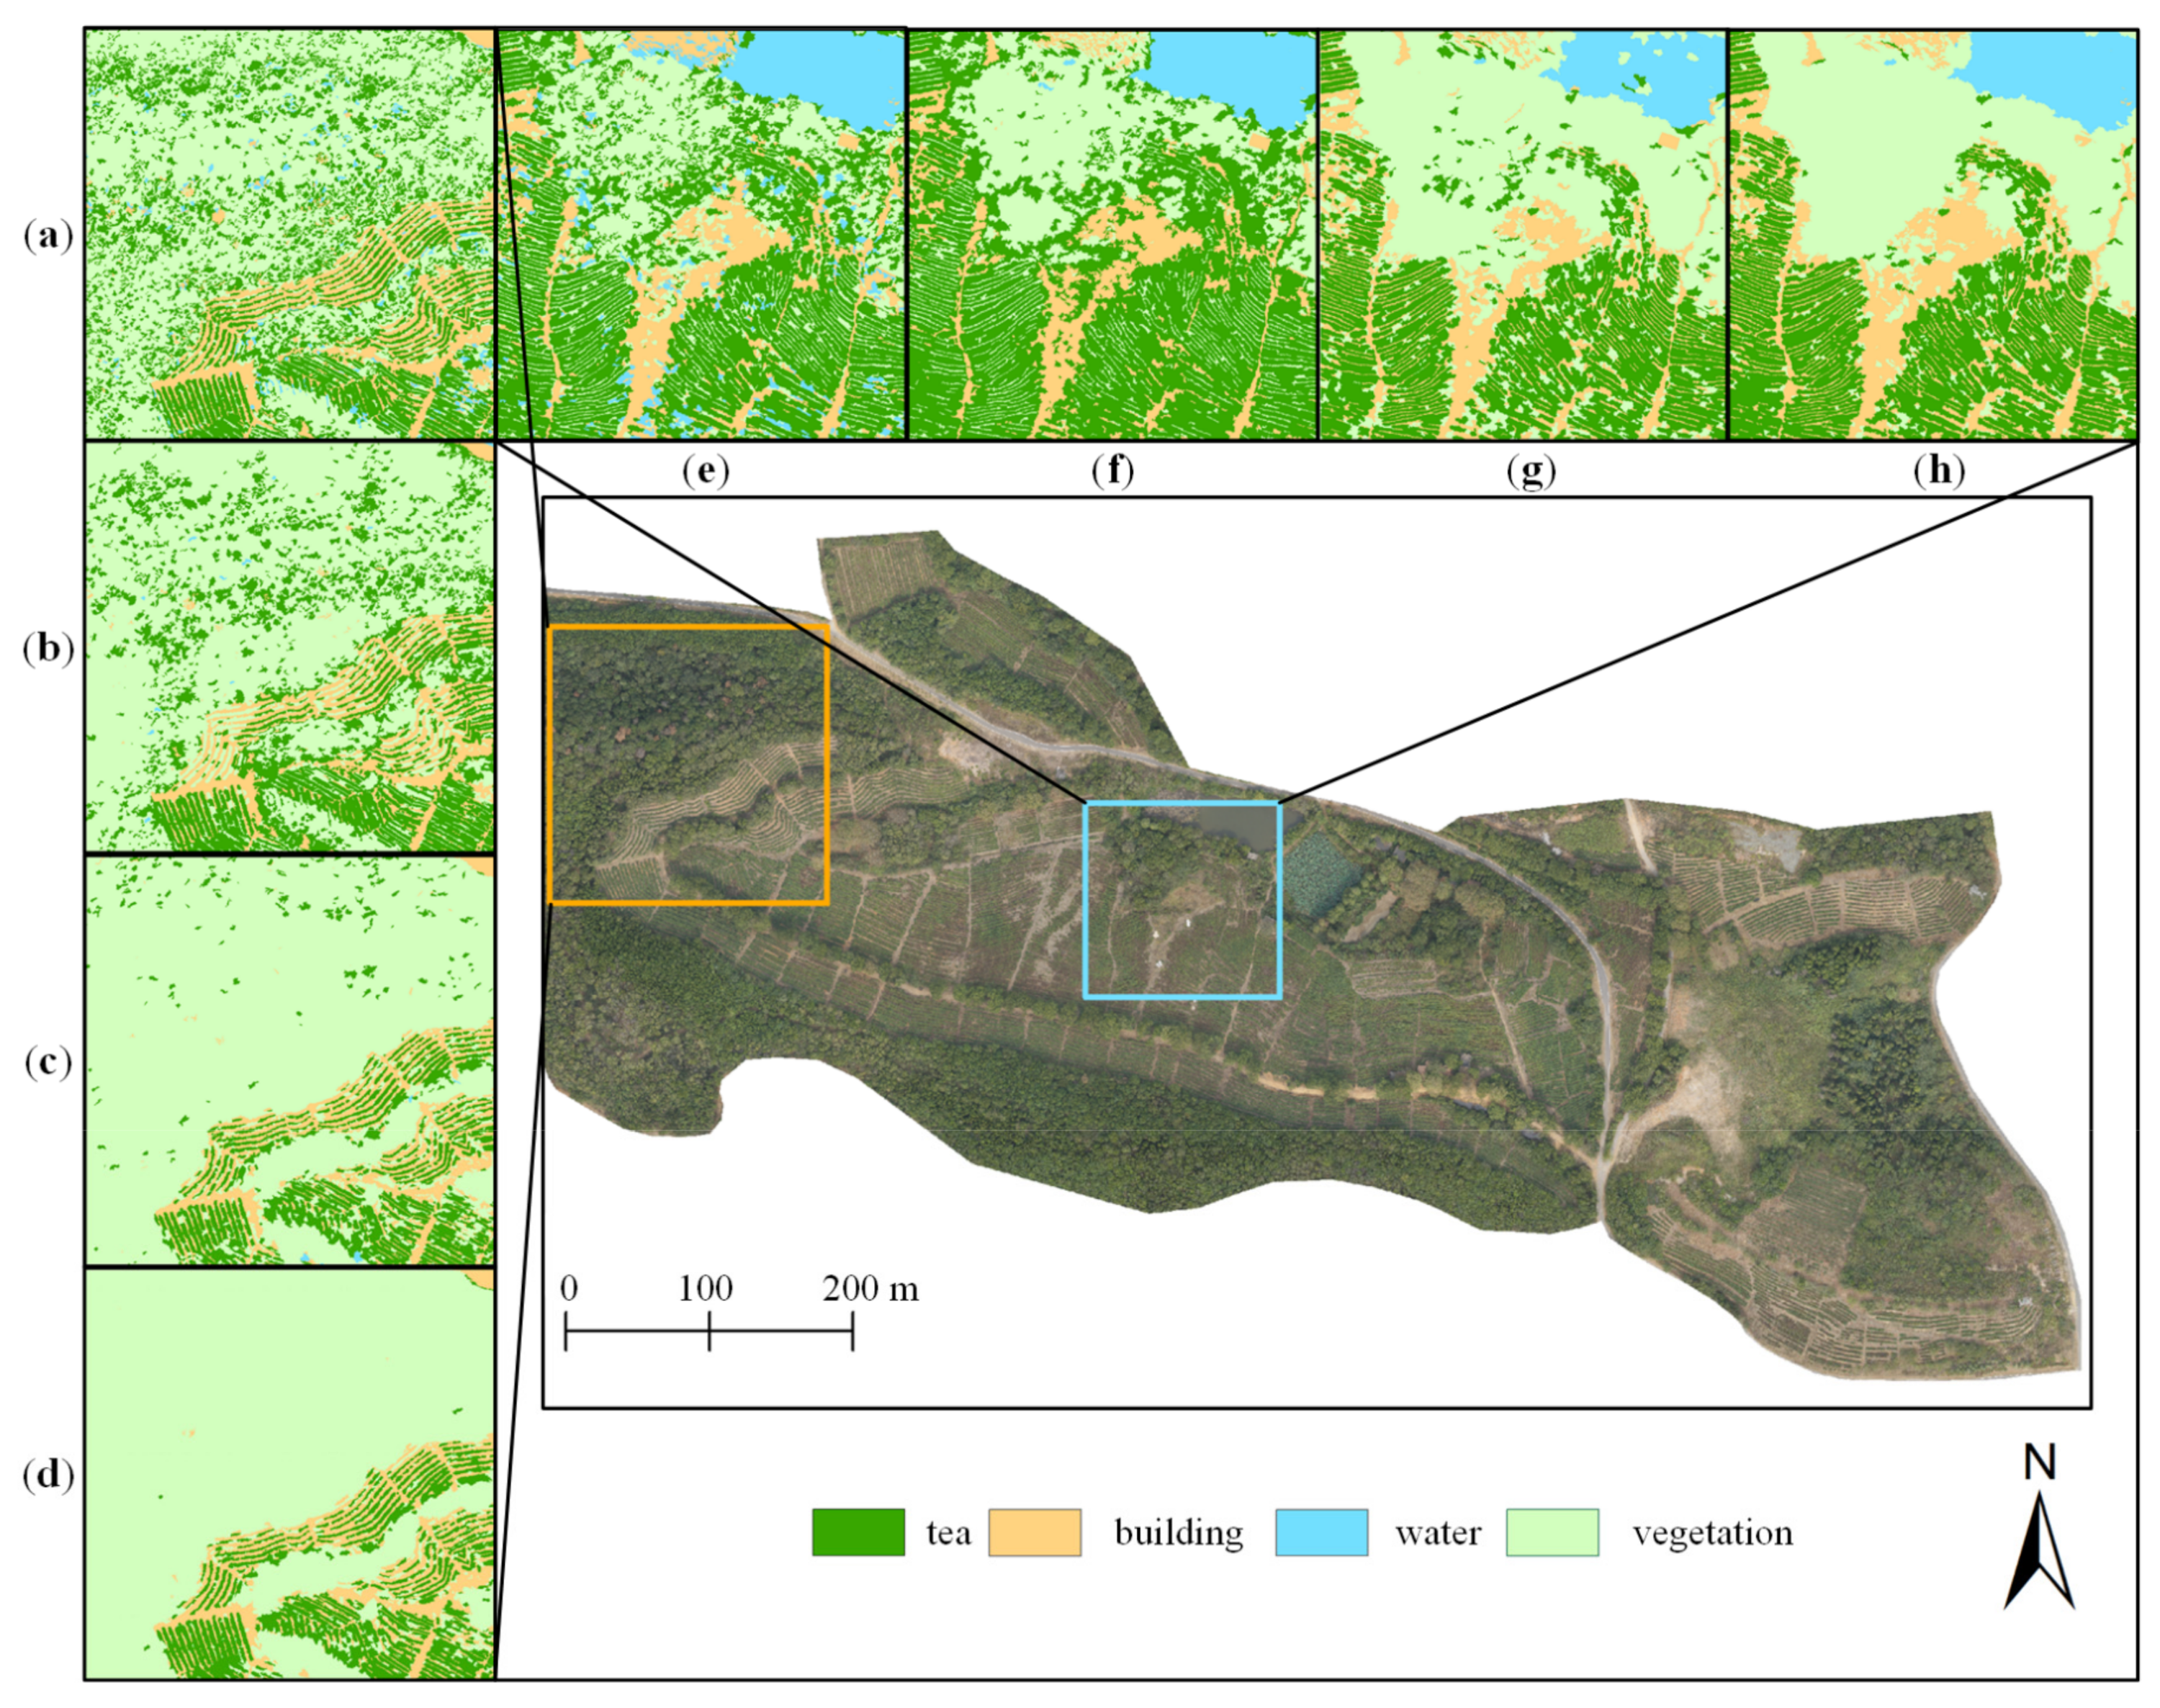
3.3.1. Global Assessment

Figure 11 and Figure 12 portray the classification results of the four models obtained using the SVM and RF algorithms. Model 3 and Model 4 performed better than Model 1 and Model 2. Both Model 3 and Model 4 obtained good classifications of tea and vegetation and output almost no misclassification of water. In contrast, tea and vegetation were roughly distinguished in the results of Model 1 and Model 2, but the two classes were mixed and confused over the whole study area. The use of digital images alone (as in Model 1 and Model 2) is not sufficient to distinguish tea and shrubs, and the addition of combined features from photogrammetric or lidar point clouds can reduce the mix of tea and vegetation. In addition, in Model 1 and Model 2, many nonwater areas were incorrectly identified as water. The main visual differences among the thematic maps generated by the four models lie in the identification of water in the central region of the study area and the identification of vegetation in the northwestern region of the study area. These two areas were further used for local visual comparisons.

3.3.2. Local Assessment

The local visual assessment indicated that the classification maps of Model 4 were more closely aligned with the realistic ground conditions than those of the other models and significantly decreased the possibility of salt-and-pepper noise. After adding the features from point clouds in Model 3 and Model 4, the results showed fewer errors in the classification of complex vegetation in the northwest region of the study area (Figure 13a–d). Model 1 and Model 2 misclassified shrubs as tea plants in these areas. The results indicated that the combination of features from point clouds provided more discriminative information than digital imagery used alone. When point cloud features were incorporated, the classifications between tea and nontea plants became more accurate. The confusing phenomenon of tea and vegetation observed in the outputs of Model 1 and Model 2 (Figure 13a,b,e,f) was greatly improved in Model 3 and Model 4 (Figure 13c,d,g,h). In addition, water was well identified by Model 3 and Model 4. Due to the lack of vertical information, some species were incorrectly identified as water by Model 1 and Model 2. In Model 3 and Model 4, the accuracy of water was enhanced by the incorporation of height metrics. Furthermore, the visual effects of Model 4 were still better than those of Model 3, indicating that photogrammetric point clouds cannot be used as a complete substitute for lidar point clouds, although the accuracy difference was not significant.

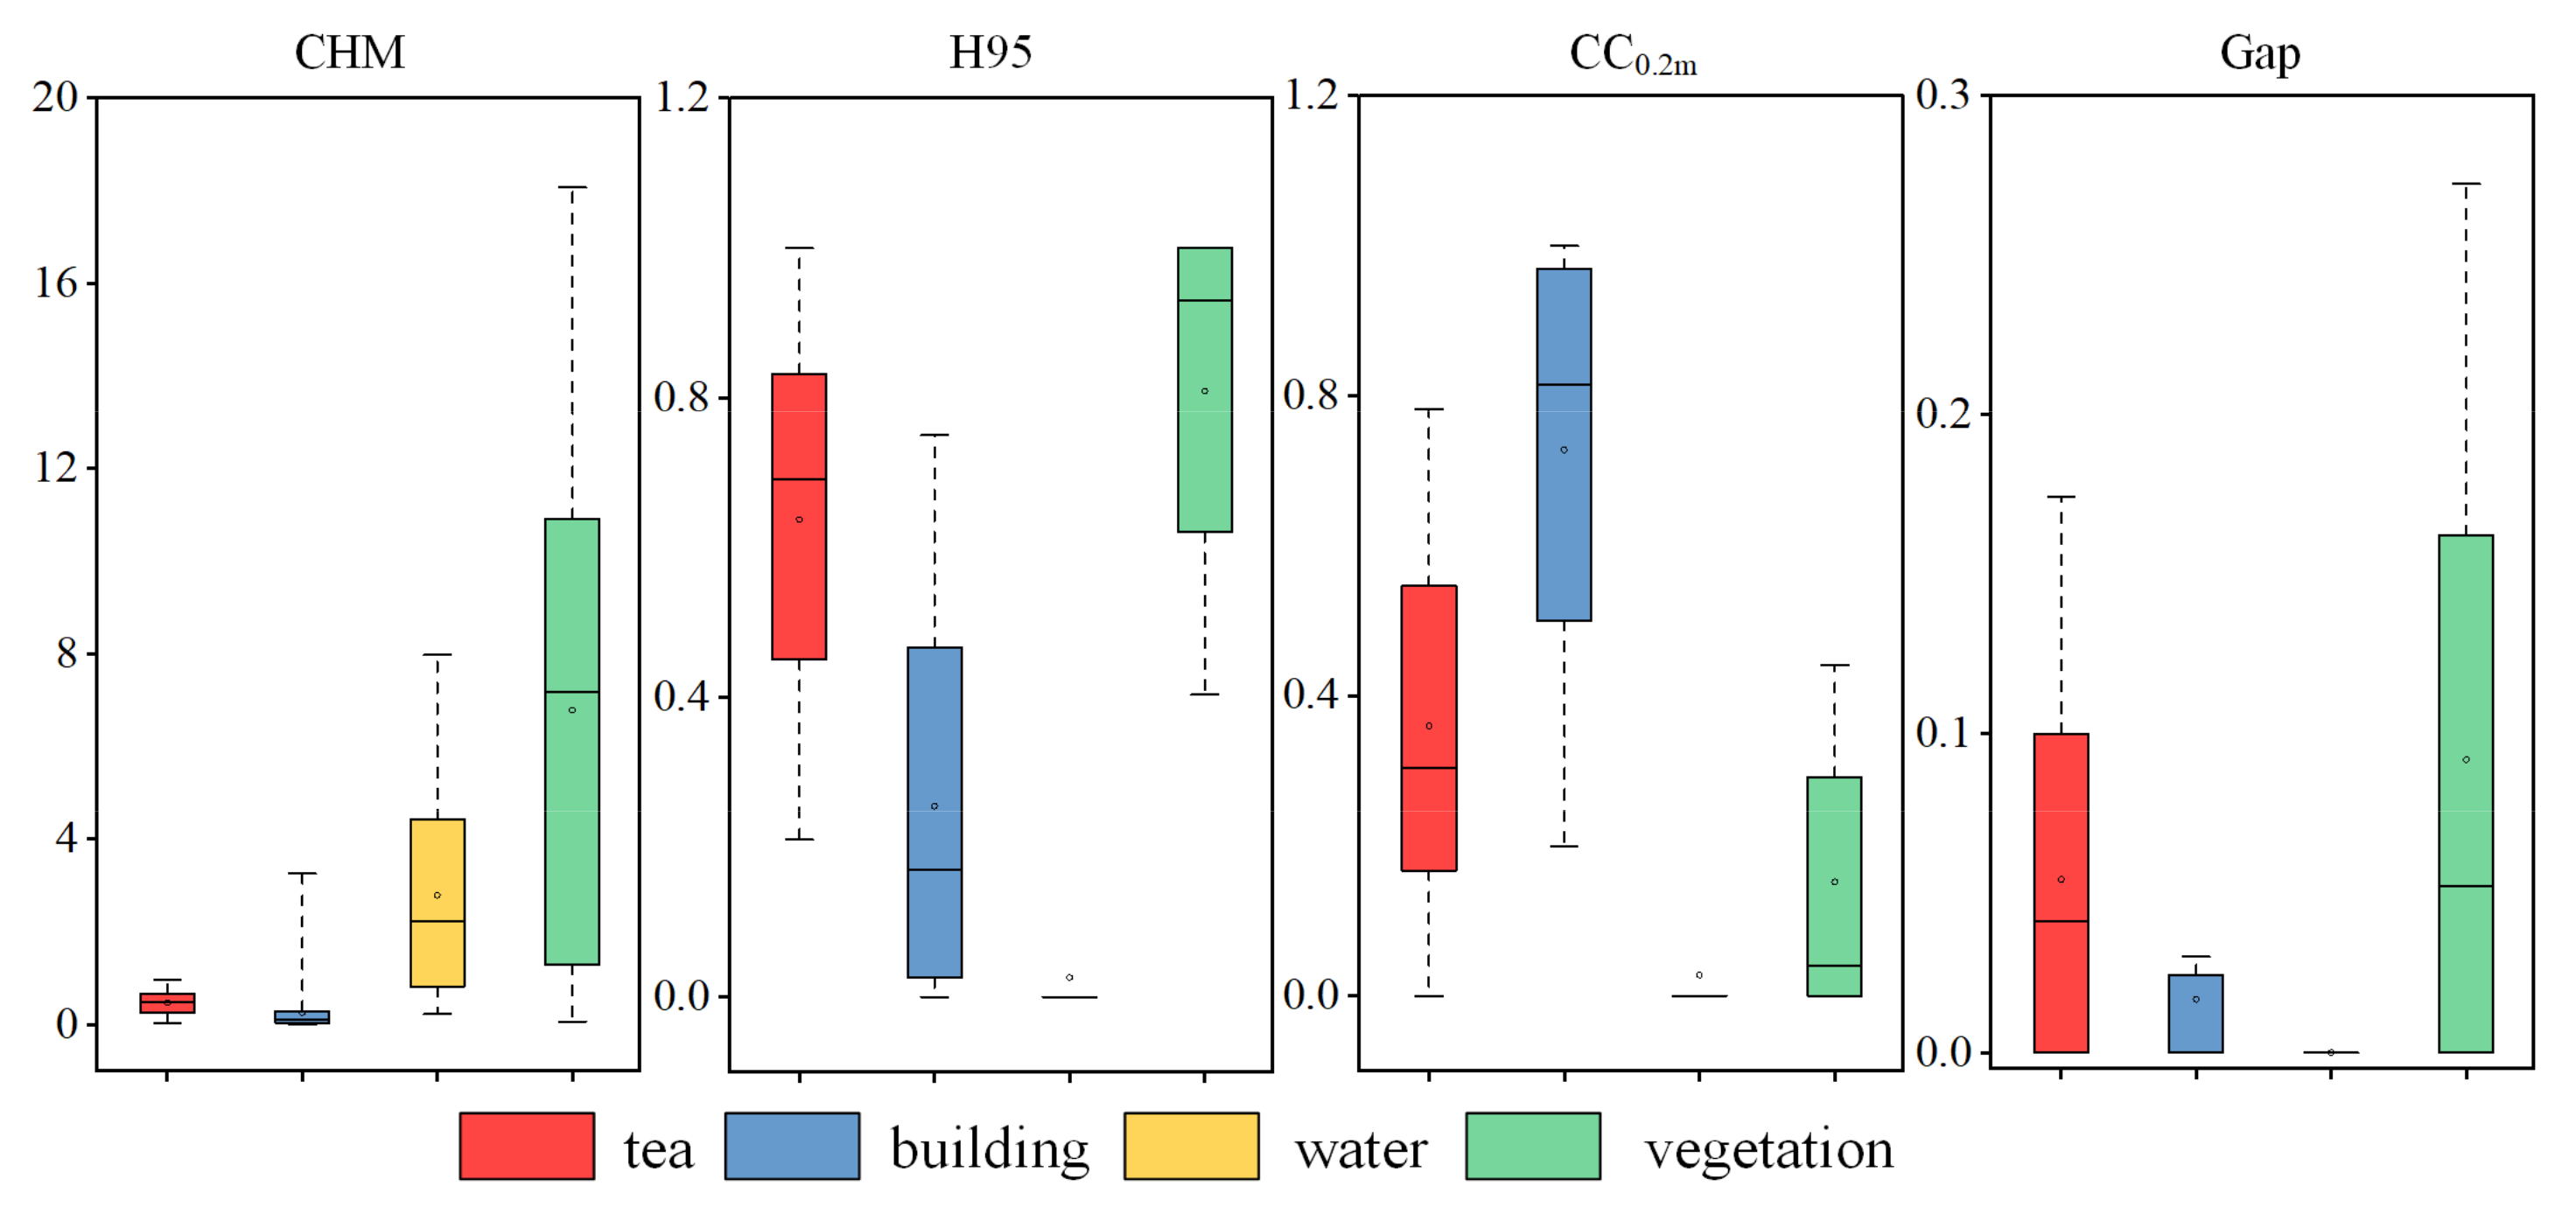
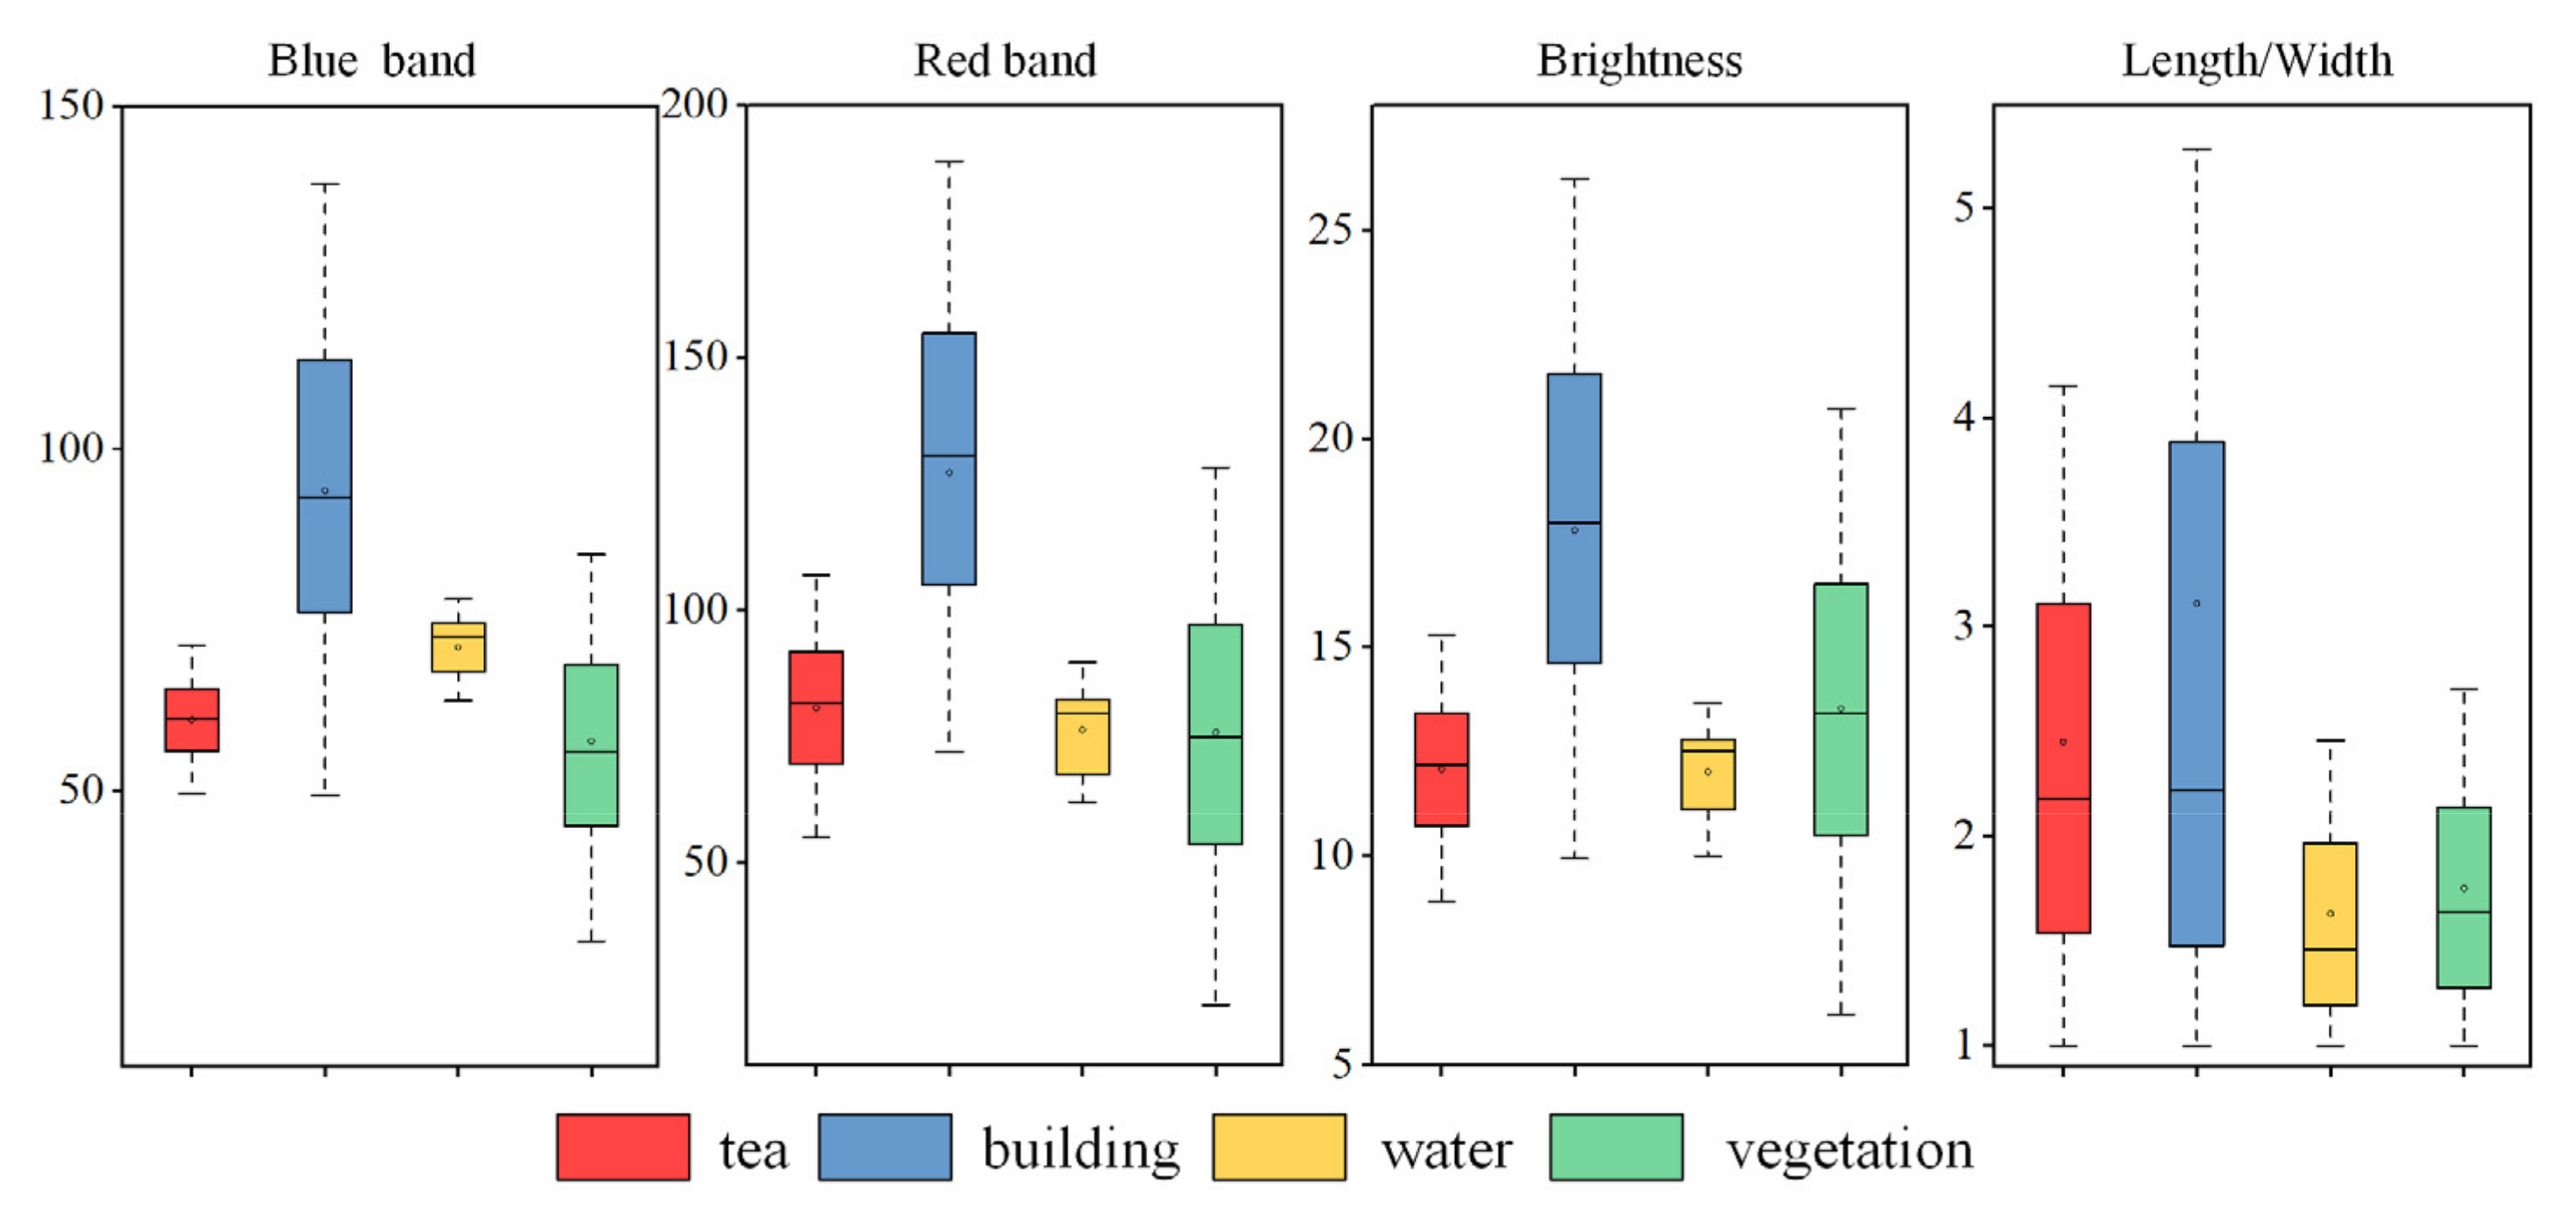
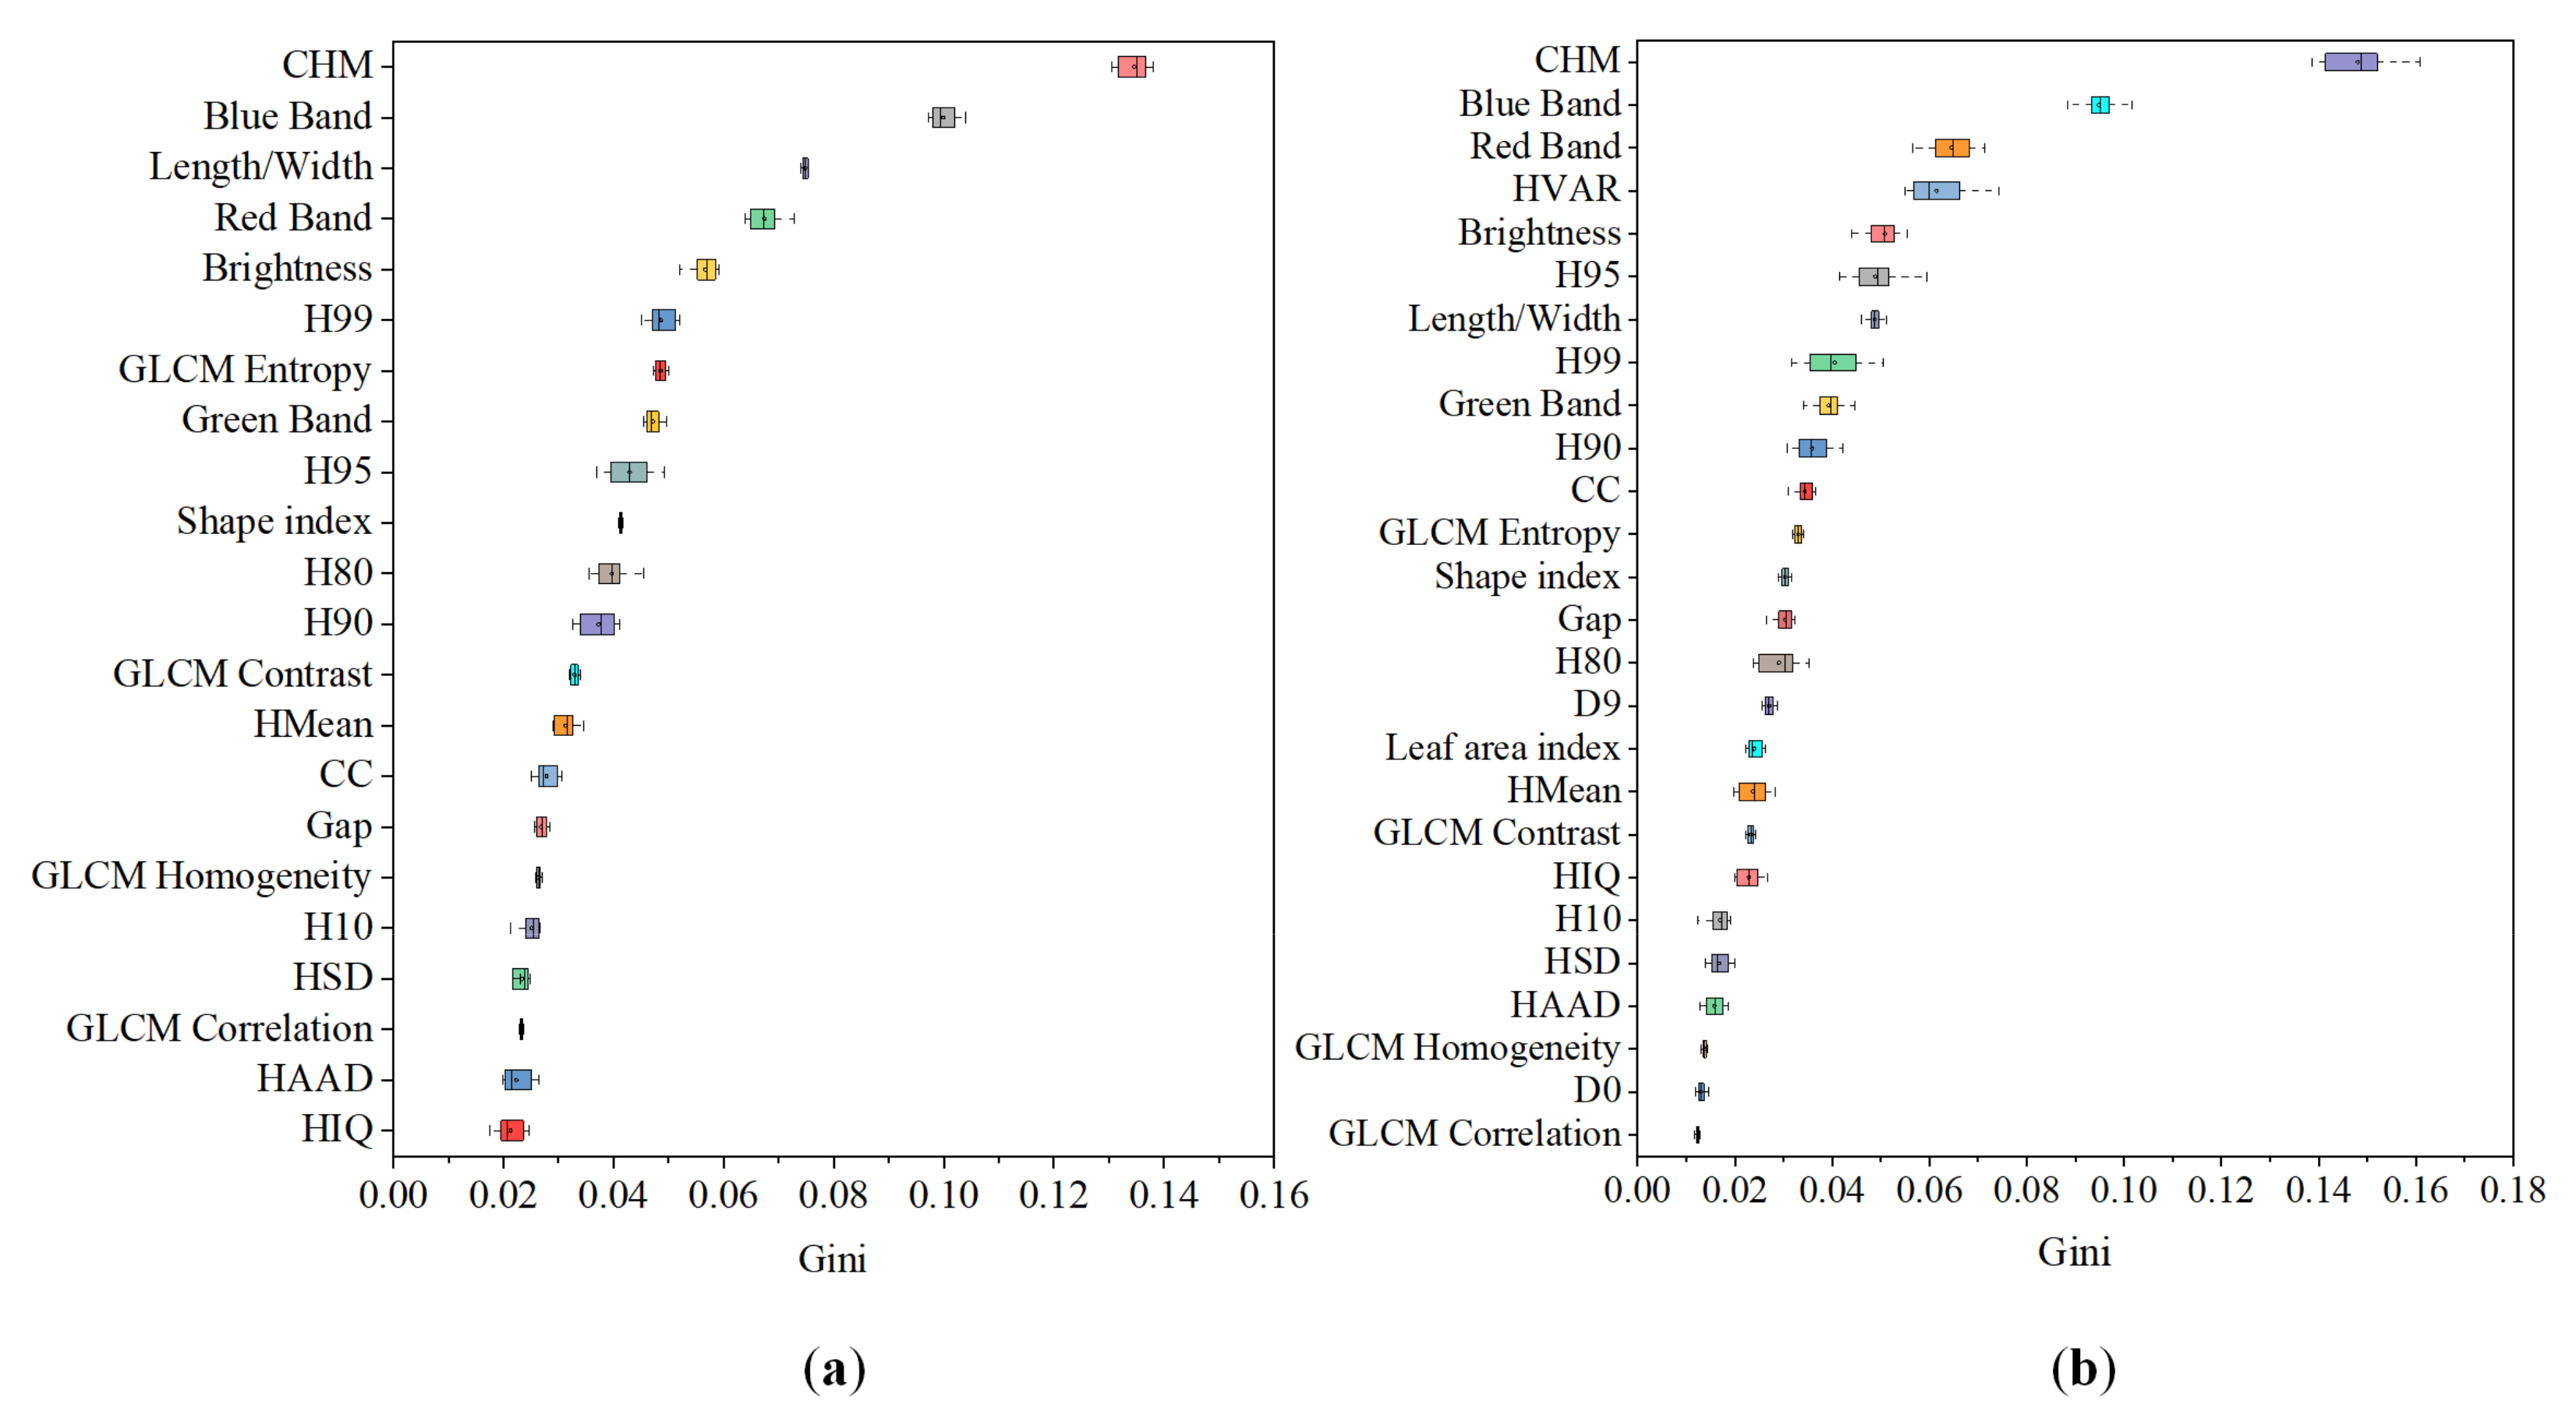
3.4. Feature Importance

The feature importance was assessed in Model 3 and Model 4 using the RF algorithm (Figure 14). The results were similar between the two models. The canopy height model derived from the point clouds and the blue band were the two most important features for tea plucking area identification in both Model 3 and Model 4. In Model 3, the length/width and the red band were ranked third and fourth, respectively. In Model 4, the red band and HVAR were ranked third and fourth, respectively, followed by the brightness and H95. The textural features and density features derived from the point clouds were of low importance overall.

3.5. Cost–Benefit Analysis

The equipment, time, and costs required to map the plucking area of a 10 km2 tea plantation four times (such as for monitoring changes over the four seasons) by Model 3, Model 4, and traditional on-ground survey methods are listed in Table 6. The costs were estimated in USD/km² based on the average salary provided for mapping and surveying fields in China. Overall, the on-ground survey methods cost 61,700 USD/km2, while the methods using UAV data perform more cost-effectively (14,397 USD/km2 for UAV images and 35,461 USD/km2 for the integration of UAV images and lidar). The on-ground survey method is similar to digital mapping and surveying, in which RTK is used to determine the positions of feature points and the boundary of each tea plucking area. The time required for mapping a 10-km² tea plantation four times was 128 person-hours using the UAV image method and 448 person-hours using the method fusing UAV images and lidar. Furthermore, collecting and processing UAV lidar requires more time and higher professional skills compared to UAV images alone. UAV-based methods had higher efficiencies than on-ground measurements (1600 person-hours).

4. Discussion

This study has demonstrated the ability of UAV-derived remote sensing data to identify and map the plucking area of tea plantations. To systematically explore the potential of UAV remote sensing in mapping the plucking area of tea plantations, four classification models were designed based on different UAV remotely sensed data with different features. The results indicated that the integration of UAV-derived digital images and point clouds (photogrammetric point clouds or lidar point clouds) could accurately identify the plucking area of tea plantations with accuracies higher than 90%. This is the first study focusing on mapping the plucking area of tea plantations. Additionally, the costs of different UAV-based methods used to map the plucking area of tea plantations were calculated and discussed.

4.1. Model and Classification Algorithm Analyses

UAVs and digital cameras are currently widely available. However, the drawbacks of digital imagery-based models (Model 1s and 2) were that there were obvious overestimations of tea plantations in the resultant maps with moderate accuracies (70–83%). In addition, tea trees and the surrounding woodlands (such as shrubs and some other woody vegetation types) were easily confused by these models, especially in arbor–shrub–arbor areas where shrubs grow between arbor trees (Figure 15b). In that case, the vegetation was incorrectly identified as tea because of the interspersed growth of shrubs and arbor trees. Similar spectral features and inconspicuous textural features led to misclassifications in Model 1 and Model 2. As a result, the measured plucking area of tea plantations might differ significantly from the actual situation. However, this phenomenon did not occur in vast stretches of shrublands because of the significant differences in shrublands’ textural and spatial features compared with those of tea plantations. Additionally, the digital imagery did not contain the near-infrared or red-edge bands that serve as essential spectral information in demarcating vegetation [29]. With the launch of consumer-grade multispectral UAVs, such as the DJI P4 Multispectral UAV (DJ, Shenzhen, China) with red-edge and near-infrared bands, this problem can be solved.
The advantages of point cloud-based models (Models 3 and 4) were that they could accurately demarcate tea plantations from other land cover types due to the point cloud features added that describe forest structural information (Figure 13). The horizontal and vertical information obtained from the point clouds led to significant improvements in mapping the plucking area of tea plantations (Figure 11 and Figure 12). The point clouds of the tea trees appeared to be neatly and densely spaced (Figure 15c,e), while the point clouds of the shrubs near the arbor trees were relatively scattered and sparse (Figure 15d,f) even though the heights of tea trees and shrubs are similar. Therefore, Model 3 and Model 4 performed well in identifying tea plantations, and most arbor–shrub–arbor areas were correctly classified as vegetation areas. Consequently, the synergy of optical imagery and point clouds can increase the identification and extraction ability of the tea plucking area. This finding is consistent with the results of previous studies on vegetation or plant species classifications [41,42,43,44].
Many studies have used lidar or photogrammetric point clouds for vegetation classifications and estimations [45,46]. However, no studies have used point clouds acquired by UAVs for tea plantation mapping, and the performances of lidar and photogrammetric point clouds for mapping the plucking area of tea plantations have not been explored and compared. Although both digital aerial photogrammetry and lidar data can provide three-dimensional information on plant structures, some differences exist between the two data types in capturing the vertical distribution of a canopy [47], resulting in differences in the performances of the datasets such as the classification differences observed between Model 3 and Model 4 in the current study. Therefore, whether using RF or SVM, Model 4 performed better than Model 3. Compared with the photogrammetric point clouds, the lidar point clouds could more precisely describe the horizontal and vertical structural complexities of the canopy due to the stronger penetration ability of laser beams. Additionally, optical imagery is influenced by plant shadows, leading to the necessity of collecting data at a specific time of day. Consequently, photogrammetric point clouds tend to be less accurate than lidar point clouds when mapping the plucking area of tea plantations, but photogrammetric data are cost-saving and could satisfy the requirements of the majority of tea plantation identification projects. The results of this study indicated that low-cost photogrammetric point cloud data could map the plucking area of tea plantations with similar accuracies to those provided by lidar point cloud data.
The importance of including spectral, geometric, and textural features and lidar metrics in tea plantation mapping has rarely been measured or discussed. The canopy height model, blue band, length/width, red band, HVAR, brightness, and H99 were considered the most important features in the tea plantation classifications conducted in this study. Tea plantations have particularities in high-resolution remotely sensed images compared with other crops. Tea trees are mostly planted in rows, displaying interlacing tea trees and bare soils in images, as illustrated in Figure 1. Therefore, the textural and spatial features of tea trees are useful when performing classifications between tea plantations and vegetation (Figure 14), which also explains why Model 2 performed better than Model 1. However, tea trees are easily confused with some other low vegetation types that have a similar spectrum to tea crops, causing tea trees to be difficult to distinguish by spectral images alone. The lidar features that contain vertical information can capture subtle morphological differences among these vegetation classes, such as height strata and canopy volume (Figure 15). Therefore, the features obtained from point clouds played more significant roles than spectral, geometric, or textural features for mapping the plucking area of tea plantations.
Regarding classification algorithms, when using the same data features, the SVM and RF algorithms performed similarly concerning the overall classification accuracies. This phenomenon was also found in a study by Chuang and Shiu [18], who employed WorldView-2 pan-sharpened imagery to map tea crops and produced similar overall classification accuracies. Since the motivation of this study was to explore the potential of UAV-derived remotely sensed data to map the plucking area of tea plantations and because these data are not limited to a specific type of machine learning algorithm, the RF and SVM algorithms are utilized for the model validations only.

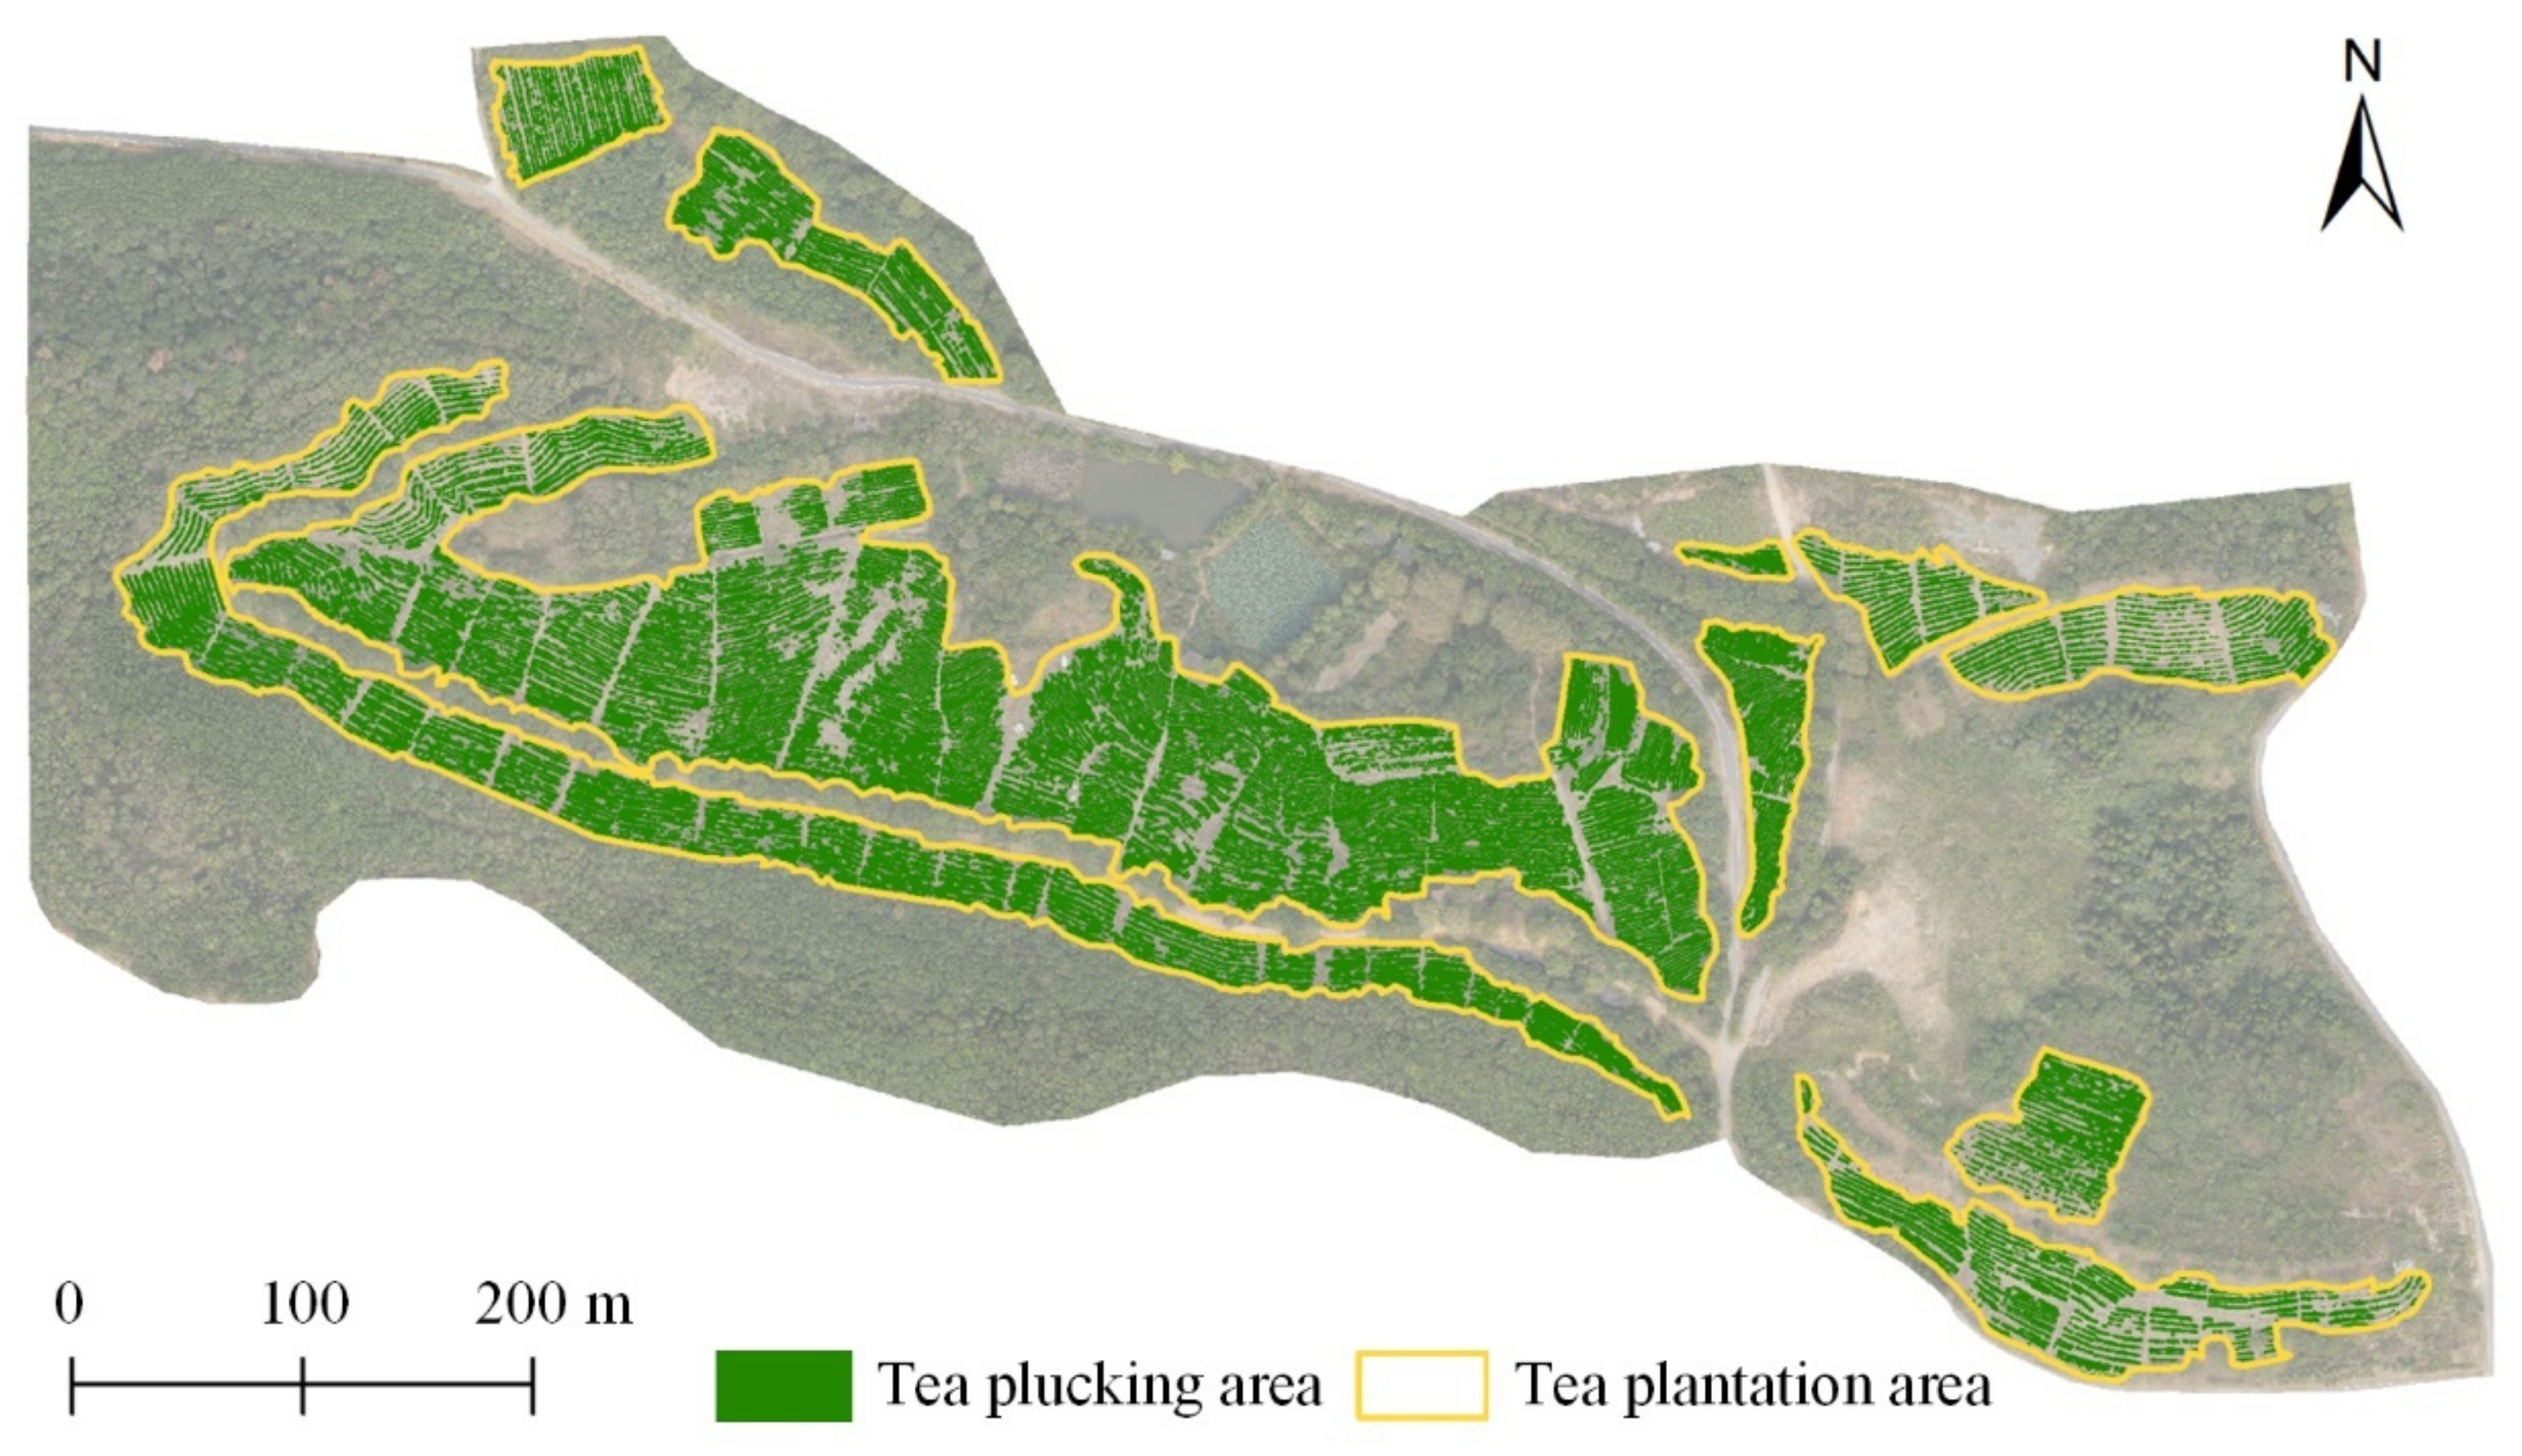
4.2. UAV Remote Sensing for Mapping the Plucking Area of Tea Plantations

The successful application of UAV remotely sensed data for mapping the plucking area of tea plantations conducted in this study represents a significant operational advancement in identifying and monitoring tea crop distribution and growing conditions. In this study, two types of UAV point clouds combined with digital imagery were applied to detect and map the plucking area of tea plantations for the first time. The first tea plantation distribution map was produced for the Huashan Tea Garden and could provide insights into the scientific management of tea plantations. Additionally, this finer-scale map could be used as basic data to estimate tea production in the Huashan Tea Garden.
Previous studies have employed the application of satellite imagery for mapping tea plantations [17,18]. Nevertheless, these studies have some limitations, such as relatively coarse scale, no structural information of plants, and spectral contamination by mist. UAV remote sensing technology can solve these problems to a large extent. First, previous studies have all focused on tea lands at large scales and ignored the plucking areas of tea plantations. In the tea plantation industry, the plucking area is one of the most important indicators used to monitor and assess tea plants, and the plucking area is directly related to the tea yield. Digital imagery and lidar point clouds have very high spatial resolutions while still covering large areas and can identify the plucking areas of the tea garden (Figure 13). Second, previous research did not involve the use or evaluation of the vertical structural information of vegetation, which is related to the growth status of tea trees. Third, tea trees tend to be planted in hilly or mountainous areas where mist frequently exists and might influence the spectral reflection of tea plantations. Digital images obtained by low-flying UAVs are less affected by thin clouds than satellite images are, while lidar is not affected by thin clouds. Therefore, our study could solve the above-described issues and represent an innovation and advance in finer-scale tea plantation identification. As shown in Figure 16, the plucking area of tea plantations in the Huashan Tea Garden was accurately measured with a total area of 6.41 ha, which accounted for 57.47% of the tea plantation area (11.15 ha, by manual visual interpretation).
UAVs also have corresponding drawbacks. The main drawback of UAV remote sensing is the limited coverage obtained by a single flight compared to satellite-based imagery; however, UAV remote sensing is adequate for tea plantations if several flight missions are conducted. Additionally, UAV data acquisition and processing require some professional knowledge background and skills, so these methods present some difficulties for nonspecialists.
Tea plantations are mostly located at elevations of approximately 50–800 m, with relative elevation differences less than 500 m and slopes between 15 and 25°, mostly oriented to the southeast (to ensure better light conditions) [17,48]. Based on the planting topography of the tea plantation considered in this study, the height of the UAV data acquisition must be set specifically. In this study, lidar point clouds were collected at an altitude of 60 m, and optical imagery was collected at an altitude of 300 m above ground level. If both datasets were collected at an altitude of 300 m, the efficiency of the data collection might have been improved significantly. If both datasets were collected at an altitude of 1000 m, the methods described herein would be suitable for areas with large altitude drop-offs, such as the tea plantation located in Changlong Town, Fujian, named the “tea town above the clouds”, where the highest elevation is 680 m. Under this condition, the VUX-UAV1 lidar scanner (RIGEL, Horn, Lower Austria, Austria) would be considered instead of the Velodyne VLP-16 Puck sensor.
The main cost–benefit advantage of using UAVs over traditional on-ground survey methods for mapping the plucking area of tea plantations is the ability to survey and map larger areas in a short time. It is possible for staff to map a 1 km2 plucking area of a tea plantation within 4 h with the support of UAV equipment, while the staff would spend 10 times longer to complete the same measurements using on-ground survey methods. Additionally, compared with on-ground survey methods, the cost-saving benefits afforded by UAV methods are obvious. The total cost required for mapping the plucking area of a 10 km2 tea plantation four times is USD 47,303 cheaper for the UAV image method than for the on-ground survey method. Even the method in which UAV images and lidar are fused to obtain the highest accuracy is USD 26,239 cheaper than traditional methods. Both the UAV and lidar industries are still developing at high speeds, and the method proposed in this study will become more applicable and less costly in the future. With the development of UAV technology, UAVs will become more cost-effective equipment for tea plantation mapping.
The proposed method in this study might also be suitable for regularly identifying relatively small vegetation and crops with pixels lower than 0.5 m, especially for banded plants. Kulawardhana et al. [49] proved that the UAV lidar was a potential tool for monitoring short vegetation, such as potato and winter wheat. In this study, point clouds and digital images were combined, and candidate features were selected. Therefore, the proposed method would have greater generalization ability to small vegetation identification.

5. Conclusions

This study developed a new approach for mapping the plucking area of tea plantations using UAV-derived remotely sensed data (optical imagery, digital aerial photogrammetry, and lidar data). Four classification models were designed using different UAV-derived data based on the SVM and RF algorithms. The results showed that Model 4 performed best among the models, achieving accuracies of 94.39% using the RF algorithm and 91.43% using the SVM algorithm. The results showed that the plucking area of tea plantations in Huashan, Wuhan, was 6.41 ha, and the average height of the tea trees was 0.51 m. Important features were selected from the optical imagery and point cloud data using the RFE algorithm. The study found that the features obtained from point clouds are more crucial than the features obtained from digital imagery when identifying tea plantations.
The significance of this study can be reflected in three aspects. First, the excellent performance of UAV remote sensing for mapping the plucking area of tea plantations has been demonstrated, which represents an advancement in remote sensing of tea plantations. Second, photogrammetric point clouds can be used as an alternative to lidar point clouds when lidar scanners are not available. Third, the time and financial costs of using UAV-derived data to map the plucking area of tea plantations are much lower than those required by the traditional on-ground methods.

Author Contributions

All authors contributed extensively to the study. Q.Z. (Qingfan Zhang) and Z.C. performed the experiments and analyzed the data; Q.Z. (Qingfan Zhang) and D.W. wrote the manuscript; and B.W., Q.Z. (Quanfa Zhang) and D.W. provided comments and suggestions to improve the manuscript. All authors contributed to the editing/discussion of the manuscript. All authors have read and agreed to the published version of the manuscript.

Funding

This research was funded by the National Natural Science Foundation of China (No. 32030069) and the National Key Research & Development (R&D) Plan of China (No. 2017YFB0503600).

Conflicts of Interest

The authors declare no conflict of interest.

References

  1. Dutta, R.; Stein, A.; Bhagat, R.M. Integrating satellite images and spectroscopy to measuring green and black tea quality. Food Chem. 2011, 127, 866–874. [Google Scholar] [CrossRef]
  2. Xiang, J.; Zhi, X. Spatial structure and evolution of tea trade in the world from 1946 to 2016. Conomic Geogr. 2020, 40, 123–130. [Google Scholar]
  3. Wang, B.; Li, J.; Jin, X.; Xiao, H. Mapping tea plantations from multi-seasonal Landsat-8 OLI imageries using a random forest classifier. J. Indian Soc. Remote Sens. 2019, 47, 1315–1329. [Google Scholar] [CrossRef]
  4. Snapir, B.; Waine, T.W.; Corstanje, R.; Redfern, S.; De Silva, J.; Kirui, C. Harvest monitoring of Kenyan Tea Plantations with X-band SAR. IEEE J. Sel. Top. Appl. Earth Observ. Remote Sens. 2018, 11, 930–938. [Google Scholar] [CrossRef]
  5. Bian, M.; Skidmore, A.K.; Schlerf, M.; Wang, T.; Liu, Y.; Zeng, R.; Fei, T. Predicting foliar biochemistry of tea (Camellia sinensis) using reflectance spectra measured at powder, leaf and canopy levels. ISPRS-J. Photogramm. Remote Sens. 2013, 78, 148–156. [Google Scholar] [CrossRef]
  6. Alvarez-Taboada, F.; Paredes, C.; Julián-Pelaz, J. Mapping of the invasive species hakea sericea using unmanned aerial vehicle (UAV) and WorldView-2 imagery and an object-oriented approach. Remote Sens. 2017, 9, 913. [Google Scholar] [CrossRef] [Green Version]
  7. Guo, Q.; Su, Y.; Hu, T.; Zhao, X.; Wu, F.; Li, Y.; Liu, J.; Chen, L.; Xu, G.; Lin, G.; et al. An integrated UAV-borne lidar system for 3D habitat mapping in three forest ecosystems across China. Int. J. Remote Sens. 2017, 38, 2954–2972. [Google Scholar] [CrossRef]
  8. Wang, D.; Wan, B.; Liu, J.; Su, Y.; Guo, Q.; Qiu, P.; Wu, X. Estimating aboveground biomass of the mangrove forests on northeast Hainan Island in China using an upscaling method from field plots, UAV-LiDAR data and Sentinel-2 imagery. Int. J. Appl. Earth Obs. Geoinf. 2020, 85, 101986. [Google Scholar] [CrossRef]
  9. Navarro, A.; Young, M.; Allan, B.; Carnell, P.; Macreadie, P.; Ierodiaconou, D. The application of unmanned aerial vehicles (UAVs) to estimate above-ground biomass of mangrove ecosystems. Remote Sens. Environ. 2020, 242, 111747. [Google Scholar] [CrossRef]
  10. Shao, Z.; Zhang, L.; Wang, L. Stacked sparse autoencoder modeling using the synergy of airborne LiDAR and satellite optical and SAR data to map forest above-ground biomass. IEEE J. Sel. Top. Appl. Earth Observ. Remote Sens. 2017, 10, 5569–5582. [Google Scholar] [CrossRef]
  11. Husson, E.; Lindgren, F.; Ecke, F. Assessing biomass and metal contents in riparian vegetation along a pollution gradient using an unmanned aircraft system. Water Air Soil Pollut. 2014, 225, 1957. [Google Scholar] [CrossRef]
  12. Senthilnath, J.; Kandukuri, M.; Dokania, A.; Ramesh, K.N. Application of UAV imaging platform for vegetation analysis based on spectral-spatial methods. Comput. Electron. Agric. 2017, 140, 8–24. [Google Scholar] [CrossRef]
  13. Wang, D.; Wan, B.; Qiu, P.; Zuo, Z.; Wang, R.; Wu, X. Mapping height and aboveground biomass of mangrove forests on Hainan Island using UAV-LiDAR sampling. Remote Sens. 2019, 11, 2156. [Google Scholar] [CrossRef] [Green Version]
  14. Pourshamsi, M.; Garcia, M.; Lavalle, M.; Balzter, H. A machine-learning approach to PolInSAR and LiDAR data fusion for improved tropical forest canopy height estimation using NASA AfriSAR Campaign data. IEEE J. Sel. Top. Appl. Earth Observ. 2018, 11, 3453–3463. [Google Scholar] [CrossRef]
  15. Akar, Ö.; Güngör, O. Integrating multiple texture methods and ndvi to the random forest classification algorithm to detect tea and hazelnut plantation areas in northeast Turkey. Int. J. Remote Sens. 2015, 36, 442–464. [Google Scholar] [CrossRef]
  16. Dihkan, M.; Guneroglu, N.; Karsli, F.; Guneroglu, A. Remote sensing of tea plantations using an SVM classifier and pattern-based accuracy assessment technique. Int. J. Remote Sens. 2013, 34, 8549–8565. [Google Scholar] [CrossRef]
  17. Zhu, J.; Pan, Z.; Wang, H.; Huang, P.; Sun, J.; Qin, F.; Liu, Z. An improved multi-temporal and multi-feature tea plantation identification method using Sentinel-2 imagery. Sensors 2019, 19, 2087. [Google Scholar] [CrossRef] [PubMed] [Green Version]
  18. Chuang, Y.-C.M.; Shiu, Y.-S. A comparative analysis of machine learning with WorldView-2 Pan-Sharpened imagery for tea crop mapping. Sensors 2016, 16, 594. [Google Scholar] [CrossRef] [Green Version]
  19. Zhao, X.; Guo, Q.; Su, Y.; Xue, B. Improved progressive TIN densification filtering algorithm for airborne LiDAR data in forested areas. ISPRS-J. Photogramm. Remote Sens. 2016, 117, 79–91. [Google Scholar] [CrossRef] [Green Version]
  20. Kim, S.; McGaughey, R.J.; Andersen, H.-E.; Schreuder, G. Tree species differentiation using intensity data derived from leaf-on and leaf-off airborne laser scanner data. Remote Sens. Environ. 2009, 113, 1575–1586. [Google Scholar] [CrossRef]
  21. Ritchie, J.C.; Evans, D.L.; Jacobs, D.; Everitt, J.H.; Weltz, M.A. Measuring canopy structure with an airborne laser altimeter. Trans. ASAE 1993, 36, 1235–1238. [Google Scholar] [CrossRef]
  22. Qiu, P.; Wang, D.; Zou, X.; Yang, X.; Xie, G.; Xu, S.; Zhong, Z. Finer resolution estimation and mapping of mangrove biomass using UAV LiDAR and worldview-2 data. Forests 2019, 10, 871. [Google Scholar] [CrossRef] [Green Version]
  23. Shi, Y.; Wang, T.; Skidmore, A.K.; Heurich, M. Important LiDAR metrics for discriminating forest tree species in Central Europe. ISPRS-J. Photogramm. Remote Sens. 2018, 137, 163–174. [Google Scholar] [CrossRef]
  24. Richardson, J.J.; Moskal, L.M.; Kim, S.-H. Modeling approaches to estimate effective leaf area index from aerial discrete-return LIDAR. Agric. For. Meteorol. 2009, 149, 1152–1160. [Google Scholar] [CrossRef]
  25. Haralick, R.M. Statistical and structural approaches to texture. Proc. IEEE 1979, 67, 786–804. [Google Scholar] [CrossRef]
  26. Castilla, G.; Hay, G.J. Image objects and geographic objects. In Object-Based Image Analysis: Spatial Concepts for Knowledge-Driven Remote Sensing Applications; Blaschke, T., Lang, S., Hay, G.J., Eds.; Springer: Berlin/Heidelberg, Gremany, 2008; pp. 91–110. [Google Scholar]
  27. Duro, D.C.; Franklin, S.E.; Dubé, M.G. A comparison of pixel-based and object-based image analysis with selected machine learning algorithms for the classification of agricultural landscapes using SPOT-5 HRG imagery. Remote Sens. Environ. 2012, 118, 259–272. [Google Scholar] [CrossRef]
  28. White, J.C.; Tompalski, P.; Coops, N.C.; Wulder, M.A. Comparison of airborne laser scanning and digital stereo imagery for characterizing forest canopy gaps in coastal temperate rainforests. Remote Sens. Environ. 2018, 208, 1–14. [Google Scholar] [CrossRef]
  29. Wang, D.; Wan, B.; Qiu, P.; Su, Y.; Guo, Q.; Wang, R.; Sun, F.; Wu, X. Evaluating the performance of Sentinel-2, Landsat 8 and Pléiades-1 in mapping mangrove extent and species. Remote Sens. 2018, 10, 1468. [Google Scholar] [CrossRef] [Green Version]
  30. Pham, L.T.H.; Brabyn, L. Monitoring mangrove biomass change in Vietnam using SPOT images and an object-based approach combined with machine learning algorithms. ISPRS-J. Photogramm. Remote Sens. 2017, 128, 86–97. [Google Scholar] [CrossRef]
  31. Granitto, P.M.; Furlanello, C.; Biasioli, F.; Gasperi, F. Recursive feature elimination with random forest for PTR-MS analysis of agroindustrial products. Chemom. Intell. Lab. Syst. 2006, 83, 83–90. [Google Scholar] [CrossRef]
  32. Chadwick, J. Integrated LiDAR and IKONOS multispectral imagery for mapping mangrove distribution and physical properties. Int. J. Remote Sens. 2011, 32, 6765–6781. [Google Scholar] [CrossRef]
  33. Zhang, Z.; Liu, X. WorldView-2 satellite imagery and airborne LiDAR data for object-based forest species classification in a cool temperate rainforest environment. In Developments in Multidimensional Spatial Data Models; Abdul Rahman, A., Boguslawski, P., Gold, C., Said, M.N., Eds.; Springer: Berlin/Heidelberg, Gremany, 2013; pp. 103–122. [Google Scholar]
  34. Candare, R.J.; Japitana, M.; Cubillas, J.E.; Ramirez, C.B. Mapping of high value crops through an object-based svm model using lidar data and orthophoto in Agusan del Norte Philippines. ISPRS Ann. Photogramm. Remote Sens. Spat. Inf. Sci. 2016, III-7, 165–172. [Google Scholar] [CrossRef] [Green Version]
  35. Raczko, E.; Zagajewski, B. Comparison of support vector machine, random forest and neural network classifiers for tree species classification on airborne hyperspectral APEX images. Eur. J. Remote Sens. 2017, 50, 144–154. [Google Scholar] [CrossRef] [Green Version]
  36. Mountrakis, G.; Im, J.; Ogole, C. Support vector machines in remote sensing: A review. ISPRS-J. Photogramm. Remote Sens. 2011, 66, 247–259. [Google Scholar] [CrossRef]
  37. Yu, H. Support vector machine. In Encyclopedia of Database Systems; Liu, L., ÖZsu, M.T., Eds.; Springer: Boston, MA, USA, 2009; pp. 2890–2892. [Google Scholar]
  38. Ahmed, O.S.; Franklin, S.E.; Wulder, M.A.; White, J.C. Characterizing stand-level forest canopy cover and height using Landsat time series, samples of airborne LiDAR, and the random forest algorithm. ISPRS-J. Photogramm. Remote Sens. 2015, 101, 89–101. [Google Scholar] [CrossRef]
  39. Raschka, S.; Patterson, J.; Nolet, C. Machine learning in python: Main developments and technology trends in data science, machine learning, and artificial intelligence. Information 2020, 11, 193. [Google Scholar] [CrossRef] [Green Version]
  40. Ghosh, A.; Joshi, P.K. A comparison of selected classification algorithms for mapping bamboo patches in lower Gangetic plains using very high resolution WorldView 2 imagery. Int. J. Appl. Earth Obs. Geoinf. 2014, 26, 298–311. [Google Scholar] [CrossRef]
  41. Jones, T.G.; Coops, N.C.; Sharma, T. Assessing the utility of airborne hyperspectral and LiDAR data for species distribution mapping in the coastal Pacific Northwest, Canada. Remote Sens. Environ. 2010, 114, 2841–2852. [Google Scholar] [CrossRef]
  42. Liu, L.; Coops, N.C.; Aven, N.W.; Pang, Y. Mapping urban tree species using integrated airborne hyperspectral and LiDAR remote sensing data. Remote Sens. Environ. 2017, 200, 170–182. [Google Scholar] [CrossRef]
  43. Li, Q.; Wong, F.K.K.; Fung, T. Classification of mangrove species using combined WordView-3 and LiDAR data in Mai Po Nature Reserve, Hong Kong. Remote Sens. 2019, 11, 2114. [Google Scholar] [CrossRef] [Green Version]
  44. Pitt, D.G.; Woods, M.; Penner, M. A comparison of point clouds derived from stereo imagery and airborne laser scanning for the area-based estimation of forest inventory attributes in boreal Ontario. Can. J. Remote Sens. 2014, 40, 214–232. [Google Scholar] [CrossRef]
  45. Goodbody, T.R.H.; Coops, N.C.; Tompalski, P.; Crawford, P.; Day, K.J.K. Updating residual stem volume estimates using ALS- and UAV-acquired stereo-photogrammetric point clouds. Int. J. Remote Sens. 2017, 38, 2938–2953. [Google Scholar] [CrossRef]
  46. Filippelli, S.K.; Lefsky, M.A.; Rocca, M.E. Comparison and integration of lidar and photogrammetric point clouds for mapping pre-fire forest structure. Remote Sens. Environ. 2019, 224, 154–166. [Google Scholar] [CrossRef]
  47. White, J.C.; Coops, N.C.; Wulder, M.A.; Vastaranta, M.; Hilker, T.; Tompalski, P. Remote sensing technologies for enhancing forest inventories: A review. Can. J. Remote Sens. 2016, 42, 619–641. [Google Scholar] [CrossRef] [Green Version]
  48. Li, N.; Zhang, D.; Li, L.; Zhang, Y. Mapping the spatial distribution of tea plantations using high-spatiotemporal-resolution imagery in northern Zhejiang, China. Forests 2019, 10, 856. [Google Scholar] [CrossRef] [Green Version]
  49. Kulawardhana, R.W.; Popescu, S.C.; Feagin, R.A. Fusion of lidar and multispectral data to quantify salt marsh carbon stocks. Remote Sens. Environ. 2014, 154, 345–357. [Google Scholar] [CrossRef]
Figure 1. (a) A close-up photo of Huashan Tea Garden (the study area); (b) illustration of tea plantation area and plucking area.
Forests 12 01214 g001
Figure 2. The study area is located in Huashan, Wuhan (digital images, 0.1 m resolution).
Forests 12 01214 g002
Figure 3. (a) Field survey; (b) UAV data acquisition in the field.
Forests 12 01214 g003
Figure 4. Workflow of the UAV data acquisition, processing, and feature extraction.
Forests 12 01214 g004
Figure 5. Comparison of the image segmentation levels in the study area. (a) Digital image of the sample at 0.1 m resolution; (b) image segmentation with MRS scale 20 (Shape/Color: 0.1/0.9); (c) image segmentation with MRS scale 20 (Shape/Color: 0.3/0.7); (d) image segmentation with MRS scale 40 (Shape/Color: 0.3/0.7).
Forests 12 01214 g005
Figure 6. A schematic graph of the tea plantation identification process with four different models.
Forests 12 01214 g006
Figure 7. Variations in the overall accuracy with the number of features selected by the recursive feature elimination (RFE) based on the random forest (RF) algorithm in Model 3 and Model 4.
Forests 12 01214 g007
Figure 8. The difference among classes in UAV lidar metrics.
Forests 12 01214 g008
Figure 9. The difference among classes in digital imagery features.
Forests 12 01214 g009
Figure 10. Comparison of the overall classification accuracies of the four object-based classification models obtained using two machine learning algorithms: support vector machine (SVM) and random forest (RF).
Forests 12 01214 g010
Figure 11. The classification results derived from the four models using SVM. (a) Model 1; (b) Model 2; (c) Model 3; (d) Model 4.
Forests 12 01214 g011
Figure 12. The classification results derived from the four models using RF. (a) Model 1; (b) Model 2; (c) Model 3; (d) Model 4.
Forests 12 01214 g012
Figure 13. Comparison of the recognition effects obtained using the four models in the northwest ((ad) Models 1–4) and middle ((eh) Models 1–4) regions of the study area.
Forests 12 01214 g013
Figure 14. The difference among classes in UAV lidar metrics. The importance of the features used in Model 3 (a) and Model 4 (b), obtained by running the random forest algorithm 20 times.
Forests 12 01214 g014
Figure 15. Comparison of tea trees and vegetation (incorrectly identified as tea trees in Model 2) based on UAV lidar data. (a) Digital image of tea trees; (b) digital image of vegetation; (c) horizontal picture of tea trees; (d) horizontal picture of vegetation; (e) vertical picture of tea trees; (f) vertical picture of vegetation; (g) 3D view of tea trees; (h) 3D view of vegetation.
Forests 12 01214 g015
Figure 16. Illustration of tea plantation areas (from manual interpretation) and tea plucking areas in the Huashan Tea Garden.
Forests 12 01214 g016
Table 1. List of metrics derived from UAV lidar point clouds.
Lidar MetricsImplication
Height metricsHMeanMean of heights
HSD, HVARStandard deviation of heights, variance of heights
HAADAverage absolute deviation of heights
HIQInterquartile distance of percentile height, H75th–H25th
Percentile heights (H1, H5, H10, H20, H25, H30, H40, H50, H60, H70, H75, H80, H90, H95, H99)Height percentiles. Point clouds are sorted according to the elevation. 15 height percentile metrics ranging from 1 to 99% height
Canopy height model valueValue of CHM:
CHM = DSM DEM
Canopy volume metricsCC0.2mCanopy cover above 0.2 m
GapCanopy volume-related metric
Leaf area indexDimensionless quantity that characterizes plant canopies
Density metricsCanopy return density (D0, D1, D2, D3, D4, D5, D6, D7, D8, D9)The proportion of points above the quantiles to the total number of points
Table 2. Parameter values used in the multiresolution segmentation (MRS) algorithm.
ScaleShape/ColorCompactness/SmoothnessNumber of Objects
200.3/0.70.5/0.5145,945
200.2/0.80.5/0.5153,366
200.1/0.90.5/0.5149,075
300.3/0.70.5/0.563,705
300.2/0.80.5/0.567,822
300.1/0.90.5/0.567,152
400.3/0.70.5/0.535,660
400.2/0.80.5/0.538,463
400.1/0.90.5/0.538,418
Image layers used: red band, green band, and blue band (weighted equally).
Table 3. List of features derived from UAV digital imagery.
FeatureImplication
Spectral mean values (RGB)The average of the spectral luminance values of all pixels in a wavelength band within an image object.
BrightnessReflects the total spectral luminance difference among image objects.
Length/widthRepresented by a minimal outsourcing rectangle.
Shape indexUsed to reflect the smoothness of image object boundaries.
Textural featureEntropy, contrast, homogeneity, and correlation, calculated through gray-level co-occurrence matrix (GLCM) with a distance of 1 [29]. GLCM is a matrix used to count the correlations between the gray levels of two pixels at a given spacing and orientation in an image.
Table 4. Confusion matrices of Models 1, 2, 3, and 4 obtained using SVM based on the validation samples.
Model 1 SVM
BuildingTeaVegetationWaterUA
building7621581591.15%
tea42867485262.10%
vegetation1324962164477.40%
water6043879.17%
PA80.90%63.56%79.82%64.40%
Kappa: 0.59   OA: 75.47%
Model 2 SVM
BuildingTeaVegetationWaterUA
building786348693.24%
tea451062308075.05%
vegetation1112992355285.11%
water000511
PA83.44%77.86%86.87%86.44%
Kappa: 0.73   OA: 83.80%
Model 3 SVM
BuildingTeaVegetationWaterUA
building8863551091.15%
tea32114297089.85%
vegetation221922570692.11%
water3135388.33%
PA93.96%83.36%94.45%89.83%
Kappa: 0.86   OA: 91.32%
Model 4 SVM
BuildingTeaVegetationWaterUA
building8742435493.28%
tea371143103089.09%
vegetation1311972573491.73%
water000511
PA92.78%83.80%94.90%86.30%
Kappa: 0.86   OA: 91.43%
Table 5. Confusion matrices of Models 1, 2, 3, and 4 obtained using RF based on the validation samples.
Model 1 RF
BuildingTeaVegetationWaterUA
building6904151081.66%
tea1091061705156.56%
vegetation1262991852481.20%
water17035472.97%
PA73.25%77.79%68.31%91.53
Kappa: 0.56   OA: 72.04%
Model 2 RF
BuildingTeaVegetationWaterUA
building79915157082.29%
tea951101326172.30%
vegetation2452452222588.80%
water18365366.25%
PA84.82%80.72%81.96%100%
Kappa: 0.71   OA: 82.25%
Model 3 RF
BuildingTeaVegetationWaterUA
building8442937293.57%
tea421209122387.86%
vegetation551422562592.70%
water3004996.08%
PA89.50%88.25%94.16%83.05%
Kappa: 0.86   OA: 91.58%
Model 4 RF
BuildingTeaVegetationWaterUA
building3352136093.76%
tea2128178091.90%
vegetation1622597396.00%
water4005688.89%
PA97.95%93.91%95.80%94.92%
Kappa: 0.91   OA: 94.39%
Table 6. Detailed costs and total costs of three different methods used for mapping the plucking area of a 10 km2 tea plantation four times (unit: USD).
ComponentDetailed Costs
UAV ImagesUAV Images and LidarOn-Ground Survey Method
EquipmentUAV: 5384UAV: 5384Tape measures: 100
Camera: 3053Lidar: 5000Rangefinder: 600
RTK: 3000Camera: 3053RTK: 3000
RTK: 3000
Data collectionstaff salaries: 2560staff salaries: 17,024staff salaries: 48,000
vehicle hire cost: 400vehicle hire cost: 2000vehicle hire cost: 10,000
Time consumed128 person-hours448 person-hours1600 person-hours
Total14,39735,46161,700
Total (per km²)3608861543
Publisher’s Note: MDPI stays neutral with regard to jurisdictional claims in published maps and institutional affiliations.

