Article

Do People Understand and Observe the Effects of Climate Crisis on Forests? The Case Study of Cyprus

by
Milto Miltiadou
1,2,*,
Efrosyni Antoniou
3,
Christos Theocharidis
1,2 and
Chris Danezis
1,2
1
Department of Civil Engineering and Geomatics, Faculty of Engineering and Technology, Cyprus University of Technology, Lemesos 3036, Cyprus
2
Eratosthenes Centre of Excellence, Lemesos 3036, Cyprus
3
Friends of the Earth (Cyprus), Lemesos 3035, Cyprus
*
Author to whom correspondence should be addressed.
Forests 2021, 12(9), 1152; https://doi.org/10.3390/f12091152
Submission received: 7 July 2021 / Revised: 9 August 2021 / Accepted: 20 August 2021 / Published: 25 August 2021

Abstract

:
Recent reports stress the vulnerability of forest ecosystems in the European Union (EU), especially in the south. Cyprus is an island in the south of EU and the eastern of the Mediterranean Sea. While Cyprus’ vulnerability is stressed, Cyprus was included in the worst-performing countries regarding EU carbon emission’s targets of 2020. For mitigating climate change, Cyprus could benefit for tailored education and improved policy making. This study analyses the perceptions of the Cypriot residents about climate change and forest degradation aiming (1) to gain a better understanding of whether Cypriot residents understand its importance, (2) to understand if the general public is able to observe the changes noted in the literature, (3) to understand how perceptions are differentiated across different demographic categories, and (4) to derive correlations between demographic data and perceptions. This is a quantitative study; a questionnaire was used as a tool and the responses received were 416. It was highlighted that 65.62% of the participants stated that they noticed moderate to very much degradation of Cypriot coniferous forests. A potential degradation reason was written down by 150 people, of whom 31.33% referred to tree die-back, while many stated decreased soil moisture and difficulty in regeneration. All these reasons of degradation were either stated or suspected in the literature. Additionally, the demographic analysis showed that there may be an association between employability and beliefs/observations about climate change. The results of the research could be used for tailored education, further research, and promoting environmentally friendly policies. This will support Cyprus and other countries in reaching their Green Deal targets and, consequently, mitigate the severe effects of climate change.

1. Introduction

Globally forests provide an important environmental and ecological resource acting as carbon sinks and providing food, clean water and habitat for humans and many other species. Biodiversity plays a substantial role in ecosystem resilience [1], while various human activities affect biological communities by altering their composition and leading species to extinction [2]. This argument is also supported by the in-depth report on “Ecosystem Services and Biodiversity” published by the European Commission in May 2015; many anthropogenic factors threaten these ecological benefits because they result into growing concentration of atmospheric greenhouse gas that leads to global warming. Climate change is a significant factor of the increased forest fires and tree species being unable to adapt to the severity and frequency of drought during the summer period. A significant number of forest hectares in Europe has been lost or are threatened because of extreme forest fires (e.g., Cyprus [3], Greece [4], Portugal [5]), and increased pests/diseases (e.g., bark beetles in Bulgaria [6]). According to Read et al., 2009 [7], the possibility of increased insect pests and tree diseases is high due trees been weakened by the extreme weather conditions.
Policy making and education plays a substantial role for mitigating the effects of climate change. For developing effecting educational and communicational approaches is essential to understand the perceptions of the public about climate change [8]. Knowing what people think and understand about climate change, as well as to what extend they have observed forest degradation, is critical for implementing robust, tailored, acceptable and effective mitigation policies aiming to tackle the effects of climate change. Additionally Weber et al., 2010 [9] claimed that there is a need of analysing the perceptions of scientists and the general public on climate change. They also stated that it is difficult for people to observe changes on phenomena caused by climate crisis. But nowadays do people observe the changes? Understanding whether changes and forest degradation is happening fast enough to be observable by the general public, as well as analysing what people believe about climate change is extremely important in policy making especially for countries, whose vulnerability to climate change has been highlighted.
Recent reports stressed the vulnerability of the forest ecosystem in the European Union (EU), especially to the south [10,11]. Impacts associated to climate change include incidence of pests, higher possibilities of forest fires, risk of coniferous forests decline and worsening the problem of invading species [10]. Shoukri and Zachariadis, 2012, also highlighted that Mediterranean Europe is expected to experience the most adverse climate change effects compared to other European regions [12]. This statement is further supported by Lider et al., 2008, who asserted that drought events are expected to be become more frequent and last longer in the Mediterranean region and this will lead to weakening of forest stands that could result in pest outbreaks [13]. Furthermore, according to Hódar et al., 2003 [14] the attacks of Thaumetopoea pityocampa to Scots pines (Pinus sylvestris L.) has been increased in Mediterranean due to climate change. This results in a significant reduction in pine growth and some deaths. Furthermore, Cleland et al., 2007 [15] showed that climate change confers shifts to blooming time [15] and according to Wolkovich et al., 2012, the phenological responses (i.e., alternations in blooming timing) of plants to warmer conditions are unpredicted [16]. Additionally, vegetation in mountainous areas could suffer more due to landslides and soil erosion [17].
Cyprus is an island that lies in the north-eastern end of the Mediterranean sea [18] (33 east of Greenwich and 35 north of the Equator) [19] and a hotspot in respect to climate change vulnerability. According to Eratosthenes and other ancient statements, Cyprus was covered by dense forests including its plains [20,21]. Nevertheless, Cypriots peasants that inhabited the forests consumed them irresponsibly according to their agricultural and livestock needs, leading to forest devastation and shrinkage [18]. The British administration introduced the first forest laws, established the Department of Forests, created a reforestation plan and promoted forest preservation [22]. According to the supervisor A.K. Bovill and D.E Hutchins (1909)—as reported in a statement—the demarcated forests in Cyprus were 10.7% and 19% including shrub-forests [21]. In 2008, the percentage of forested areas reported at [19], was 18.7%. Additionally, between 2005–2008, prolonged droughts affected the forest ecosystems in Cyprus resulting into intense stress, increased competition between forest species, higher land temperature and low soil moisture [23]. Shoukri and Zachariadis [12] stated that climate change may alter forest species distributions, increase fire risk and tree mortality.
For mitigating climate change, the European Green Deal aims to have no net Greenhouse Gas emissions by 2050. From 28 EU countries, Cyprus had one of the lowest national targets (5%) for reducing carbon emissions until 2020 but at the same time, it was listed as one of the worst-performing countries; noting that from the worst-performing countries, Cyprus had the highest emissions [24]. We can argue that the lack of environmental interest could be cultural related. Battagline and Barbeau [25] showed that a high percentage of German winegrowers stated that would consider growing different varieties for climate change adaptation, while Italian and French winegrowers were hesitant. Despite the fact that the Mediterranean culture of Cyprus and Italy resembles, the trend of greenhouse emissions of Italy from 2013–20 was decreasing, while in Cyprus was increasing [26,27].
Considering the percentage of the remaining forests in Cyprus, the risk they face due to climate change and the low performance of the country in reducing carbon emissions for reaching EU targets, it is crucial to understand the perception of Cypriot Residents in respect to climate change for building a preservation plan tailored to each demographic category. Bostrom et al., 1994 [28] and Read et al., 1994 [29] evaluated what people know about global climate change. Yousefpour et al., 2015 [30] targeted forestry professionals to understand their perceptions and forest-related adaptation strategies in south-west Germany. More specialised studies, examined how a person being affected by a natural disaster perceives and behaves in relation to climate change [31,32], while Crona et al, 2013 [33] extracted and compared cultural knowledge to examine human perceptions related to it.
This study, raises the question of how Cypriot residents perceive climate change, whether they believe that it is important and whether they understand its impact on Cypriot forests. The goals of the study are the following:
  • Due to the slow adaptation in Cyprus, in comparison to other EU countries, we are investigating how Cypriot residents perceive climate change, whether they believe that it is important and whether they understand its impact on Cypriot forests.
  • In 2010, Weber et al. [9] claimed that due to the slow rate of climate change, people are difficult to understand changes of phenomena. So, we want to examine if nowadays, people started observing the effects of climate change. The focus is on the forestry sector in a Mediterranean country that in comparison to other EU countries, Mediterranean countries are experiencing more intensively the harmful effects of climate change [34].
  • An analysis relating to demographic categories is also performed to understand how the perceptions differ according to age, educational level and employability status.
  • A correlations analysis is performed to understand deeper the relationship between a selection of questions and the demographic data. For example, if they could be used for prediction.
The results were compared with the literature, and it was shown that some facts that experts suspected (e.g., observed reduced ability of regeneration [23]) or stated (e.g., reduced soil moisture [10]) in the literature were observed and noted by the participants of the questionnaire. The results derived could be used as scientific evidence for promoting environmentally friendly policies aiming to mitigate the effects of climate change, preserve a healthy ecosystem and consequently maintain social stability and stimulate economic growth.

2. Materials and Methods

2.1. Materials

This is a quantitative study that collected views of the participants about the significance of climate change and its impacts on the forested areas in Cyprus. The survey held using as a tool a questionnaire for data collection, which became available to the public after being submitted to Cyprus National Bioethics Committee. It was distributed through social media, Facebook advertisement, by e-mail and in printed form. The questionnaire consisted of twenty closed-ended questions having a limited set of possible answers and eight open-ended questions. The questionnaire had two parts:
  • The first part had six demographic questions, of which five were multiple choice and one short answer question. The overarching aim of the demographic section was to justify that the answers were received from a wide range of audience regarding age, gender, employment sector, education level, municipality of residency and the engagement with organised groups and the civil society. The demographic data were also analysed to draw comparative conclusions between different groups.
  • The second part contained ten Likert scale questions, four multiple-choice questions, seven short-answer questions and one ranking question. Answers to Likert scale, multiple-choice and demographic questions were compulsory for the participation, while the ranking and short-answer were optional. This part allowed the collection of various data about the public observations, perspectives and understanding of climate change and its relation to potential forest threats in Cyprus.
Likert scale questions had six options in Greek, which translate in English as follow: (1) Not at all, (2) Slightly, (3) Somewhat, (4) Much, (5) Very Much, (6) N/A. Please note that due to the usage of this Greek Likert scale, the number (3) was not neutral as advised by [35] and this should be noted, since as mentioned in the Section 2.2, it is suspected that the unbalanced Likert scale driven the exceed usage of the “N/A” option. The questionnaire was distributed in both online and printed form in Greek for a month.
The participants were residents of the Republic of Cyprus, which is under the effective control of the government, with an age equal to or above 15 years old. The residents of Cyprus with an age over 15 years old were estimated to be 747,920 in 2019 [36]. We received 416 completed questionnaires, which corresponds to a 0.051% sample of the overall target population. It is also worth highlighting that the population in various demographic categories was adequately distributed. The results of the demographic data are given in Section 3. Figure 1 shows the geographical location of Cyprus and the names of its forested areas that lie within the study area.

2.2. Methods

The data were acquired from Google forms and analysed in R, Python and Microsoft Excel. The results of the open-ended and multiple-choice questions relating to forests are given in Section 4 and discussed in Section 5.1. The replies to the Likert scale questions were divided according to three demographic (Age, Education, Employment) questions to understand how the replies to the different Likert scale questions are modified according to each category. These replies are presented in the Results Section 4.1 and a discussion follows in Section 5.2.
This study further performs a deeper analysis by creating scatter-plots and calculating the Spearman rank correlation coefficient of the replies between demographic data versus Likert questions. A scatter-plot is a mathematical diagram that uses Cartesian coordinates for displaying the values between two variables as points; this enables visual observation of the relationship between the two variables. Further, the Spearman rank correlation coefficient provides a measurement about the relationship between two variables. Two groups of variables were created and at each observation two variables from different groups were used. The first group included a set of questions from three demographic categories (“D1:Age Category”, “D2: Educational level” and “D3:Employability Status—Employed or Not). The second group contained three Likert scale questions, which were selected according to distinct variations observed (e.g., 9.27% more likely to have observed forest degradation if you are employed) and for covering the main objectives of the article:
  • Q7: Has climate change been perceived in Cyprus?
  • Q11: Do you think that the weather phenomena mentioned above are important and will affect you in the future?
  • Q17*: Have you noticed any forest degradation in pine forests in Cyprus (e.g., reduced forest density, forest-related diseases or pests)?
* Please note that in Q17, it was observed a large number of N/A replies (where in Greek it was used the phrase “I do not know/I do not reply”) and it can be interpreted that the participants may have not observed any forest degradation. It was noted that 23.91% of the non-employed people selected that option at Q17 and it was, therefore decided by the authors to give the grade value of “Not at all” to the replies containing “N/A” in question Q17 instead of disregarding them. As aforementioned, it is suspected that the significant number of “N/A” replies was a consequence of the imbalance Likert scale.
Before correlation and generation of scatter-plots, the data were carefully re-sampled according to the demographic data so that equal number of samples existed in each demographic group. This was done to reduce bias similarly to [37]. As a result of the re-sampling, the Hypothesized Mean Difference of each paired sample correlated was equal to zero. The significance of the correlation coefficients is further calculated using the p-value both one-tailed and two-tailed; for testing the possibility of relationship in one and both directions. The correlation values were derived using the Spearman’s approach. The Spearman’s approach assumes that the distribution of values is discrete [38], while the Pearson’s method assumes continuous distributions of values [39]. Even though a discrete version of the Pearsons method exists that could be used for interpreting Likert questions [40], Winter et al., 2016 [41] showed that Spearman’s approach has a lower standard deviation—variability—in the results than the Pearson’s method, and it is, therefore, preferable to apply the Spearman’s correlation approach while analysing Likert-style datasets. Nevertheless, while interpreting Likert data, the process of correcting ties should not be performed, since it modifies the results by assigning average sum values. For that reason, the data are ranked and the Spearman rank correlation coefficient  r s is calculated using the following equation that does not perform tied correction:
r s = 1 6 i = 1 n d i 2 n 3 n
where d i is the difference between two ranked numeric values that correspond to two replies given by the participant i [42].
It further worth mentioning that the numeric values {0, 1, 2, 3, 4, N/A} were assigned to the possible Likert scale replies as shown in Table 1. Similarly numeric values were assigned to the demographic data “D1:Age Category” (Table 2), “D2: Educational level” (Table 3) and “D3:Employability Status (Employed or Not)” (Table 4) analysed.

3. Results

Demographic Data

There was an adequate distribution of samples in the demographic categories. From the 416 recipients, 222 were women (53.4%), 189 were men (45.4%), 2 people declared to be non-binary/individual self-determination (0.5%), and 3 people preferred not to answer the demographic question about gender (0.7%). Regrading the age category, the participants aged between 25–34 years were 35.3%, people aged between 35–44 years were 24.3%, participants between 15–24 years were 21.9%, 45–54 years (8.7%), 55–65 (6.7%), 65–74 years (2.4%) and finally people with 75 years old and older were 0.7% (Figure 2).
Participants’ level of education ranged from postgraduate study (PhD) to a primary school education. The PhD holders were 7.5% of the participants, Master’s degree holders were 43.3%, Bachelor’s degree holders were 30.3% of the participants, while primary and secondary school students were 11.9%. Finally, 7% of the participants had other types of higher education. This concludes that 88.1% of the participants attended higher education, while 50.8% completed postgraduate studies. This is reasonable considering that in 1993–94, according Eliophotou Menon (1998), 60% of the students entered higher education while 80% intended to (Eliophotou Menon, 1998), while this number has an increasing trend (Figure 3).
Regarding the work sector most participants worked in the private sector (42.8%). A percentage of 22.6% were civil servants, 10.8% were unemployed, 5.8% worked for semi-governmental organisations, 5% were self-employed, 2.9% worked in non-governmental organisations, 2% were retired and the rest 8.1% were students.
About the obligatory question about recipient’ engagement with organised groups and the civil society, 52.4% replied that they were not involved with such organisations and the other 47.6% that they were members of at least one civil society organisation, political party, religious group, sports group or non-governmental organisation. Finally, 70.19% of the recipients live in urban areas while only 29.81% lives in rural areas, from which only 11.05% lives in areas neighbouring forest areas in Cyprus. Most of the participants live in the province of Nicosia (52.59%), while the rest live in the provinces of Limassol (30.12%), Larnaca (8.89%), Paphos (6.92%) and Famagusta (1.48%) (Figure 4).

4. Specific Forest Related Questions

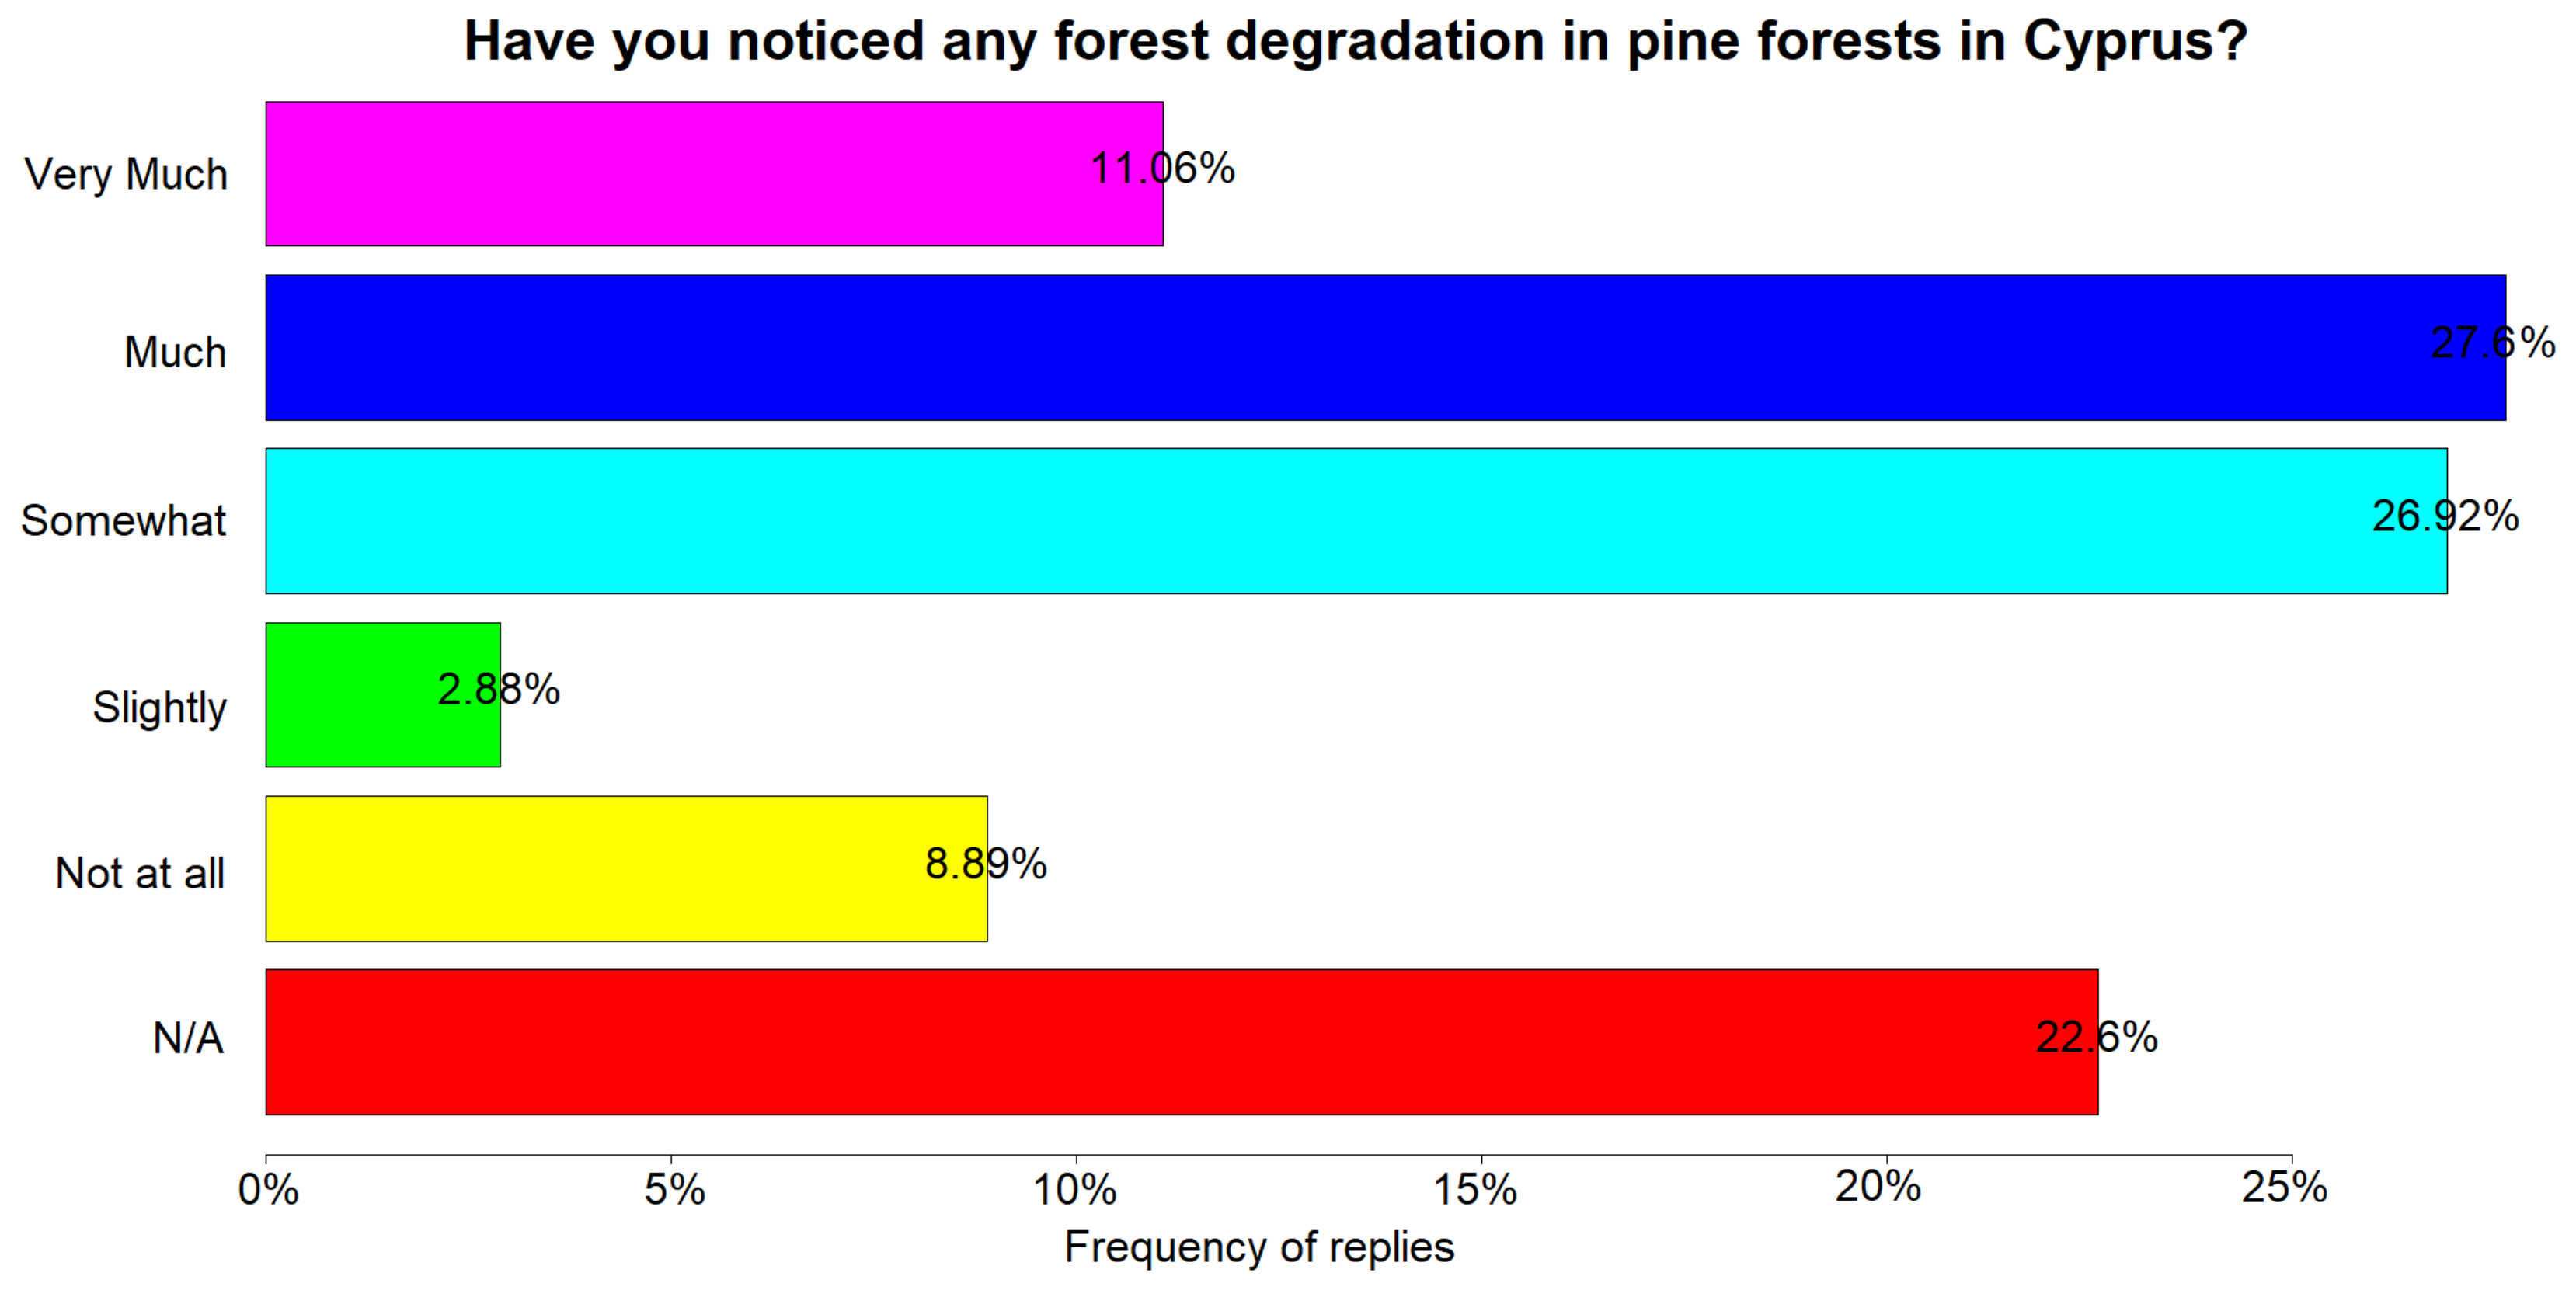
It worth highlighting that in the general question on whether people have noticed any forest degradation in coniferous forests in Cyprus, 38.7% of the participant declared that they have noticed “Much” or “Very Much”, while another 26.92% indicated that they saw some changes (Figure 5).
Significant attention was also drawn to the question asking people to write down what kind of forest degradation they had observed. A percentage of 36.06% of the participants (150 in numbers) included a reply. Most of the answers (31.33%) referred to drying trees either by providing the definition or by describing characteristics related to tree die-back. On top of that, further frequent replies included tree mortalities, soil erosion, drought, increased fire events, reduced soil moisture, and desertification. An important observation by the participants is the difficulty of coniferous forests to regenerate themselves. To be more precise 16 participants (10.67% of replies) either declared directly or indirectly that forests have difficulty regenerating themselves. Indirect replies included reduced blossoming and lack of young, regenerated trees.
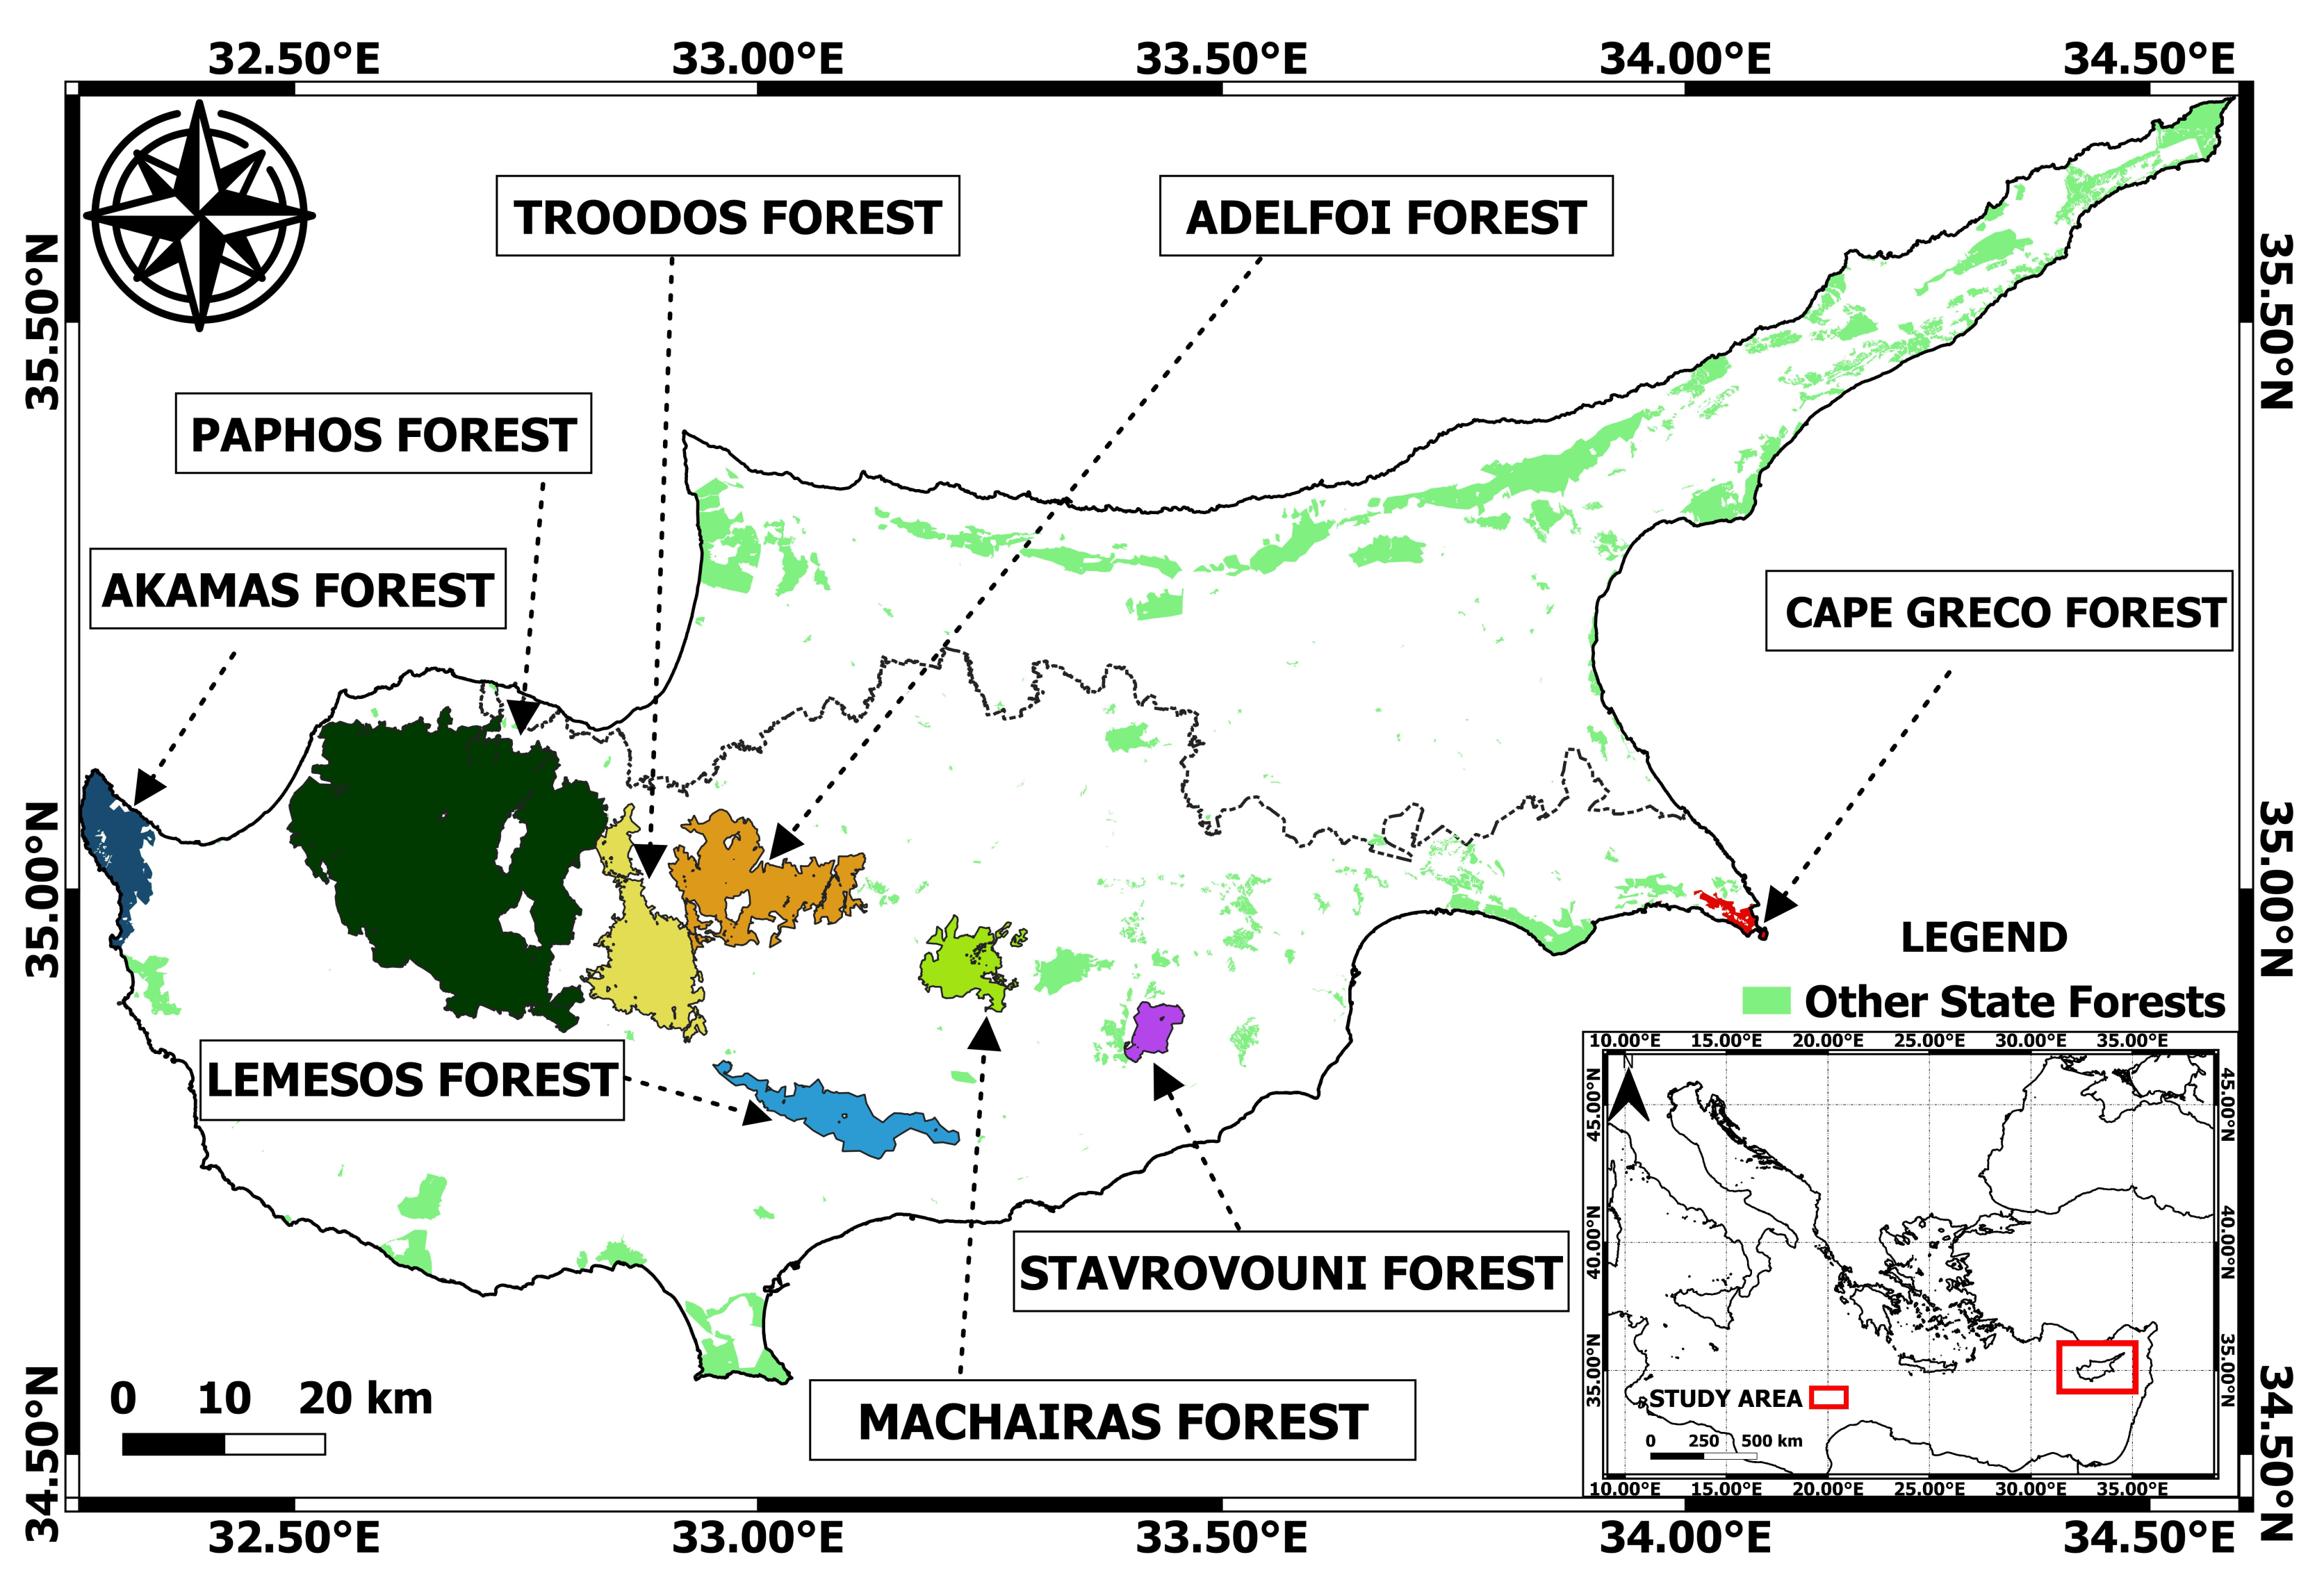
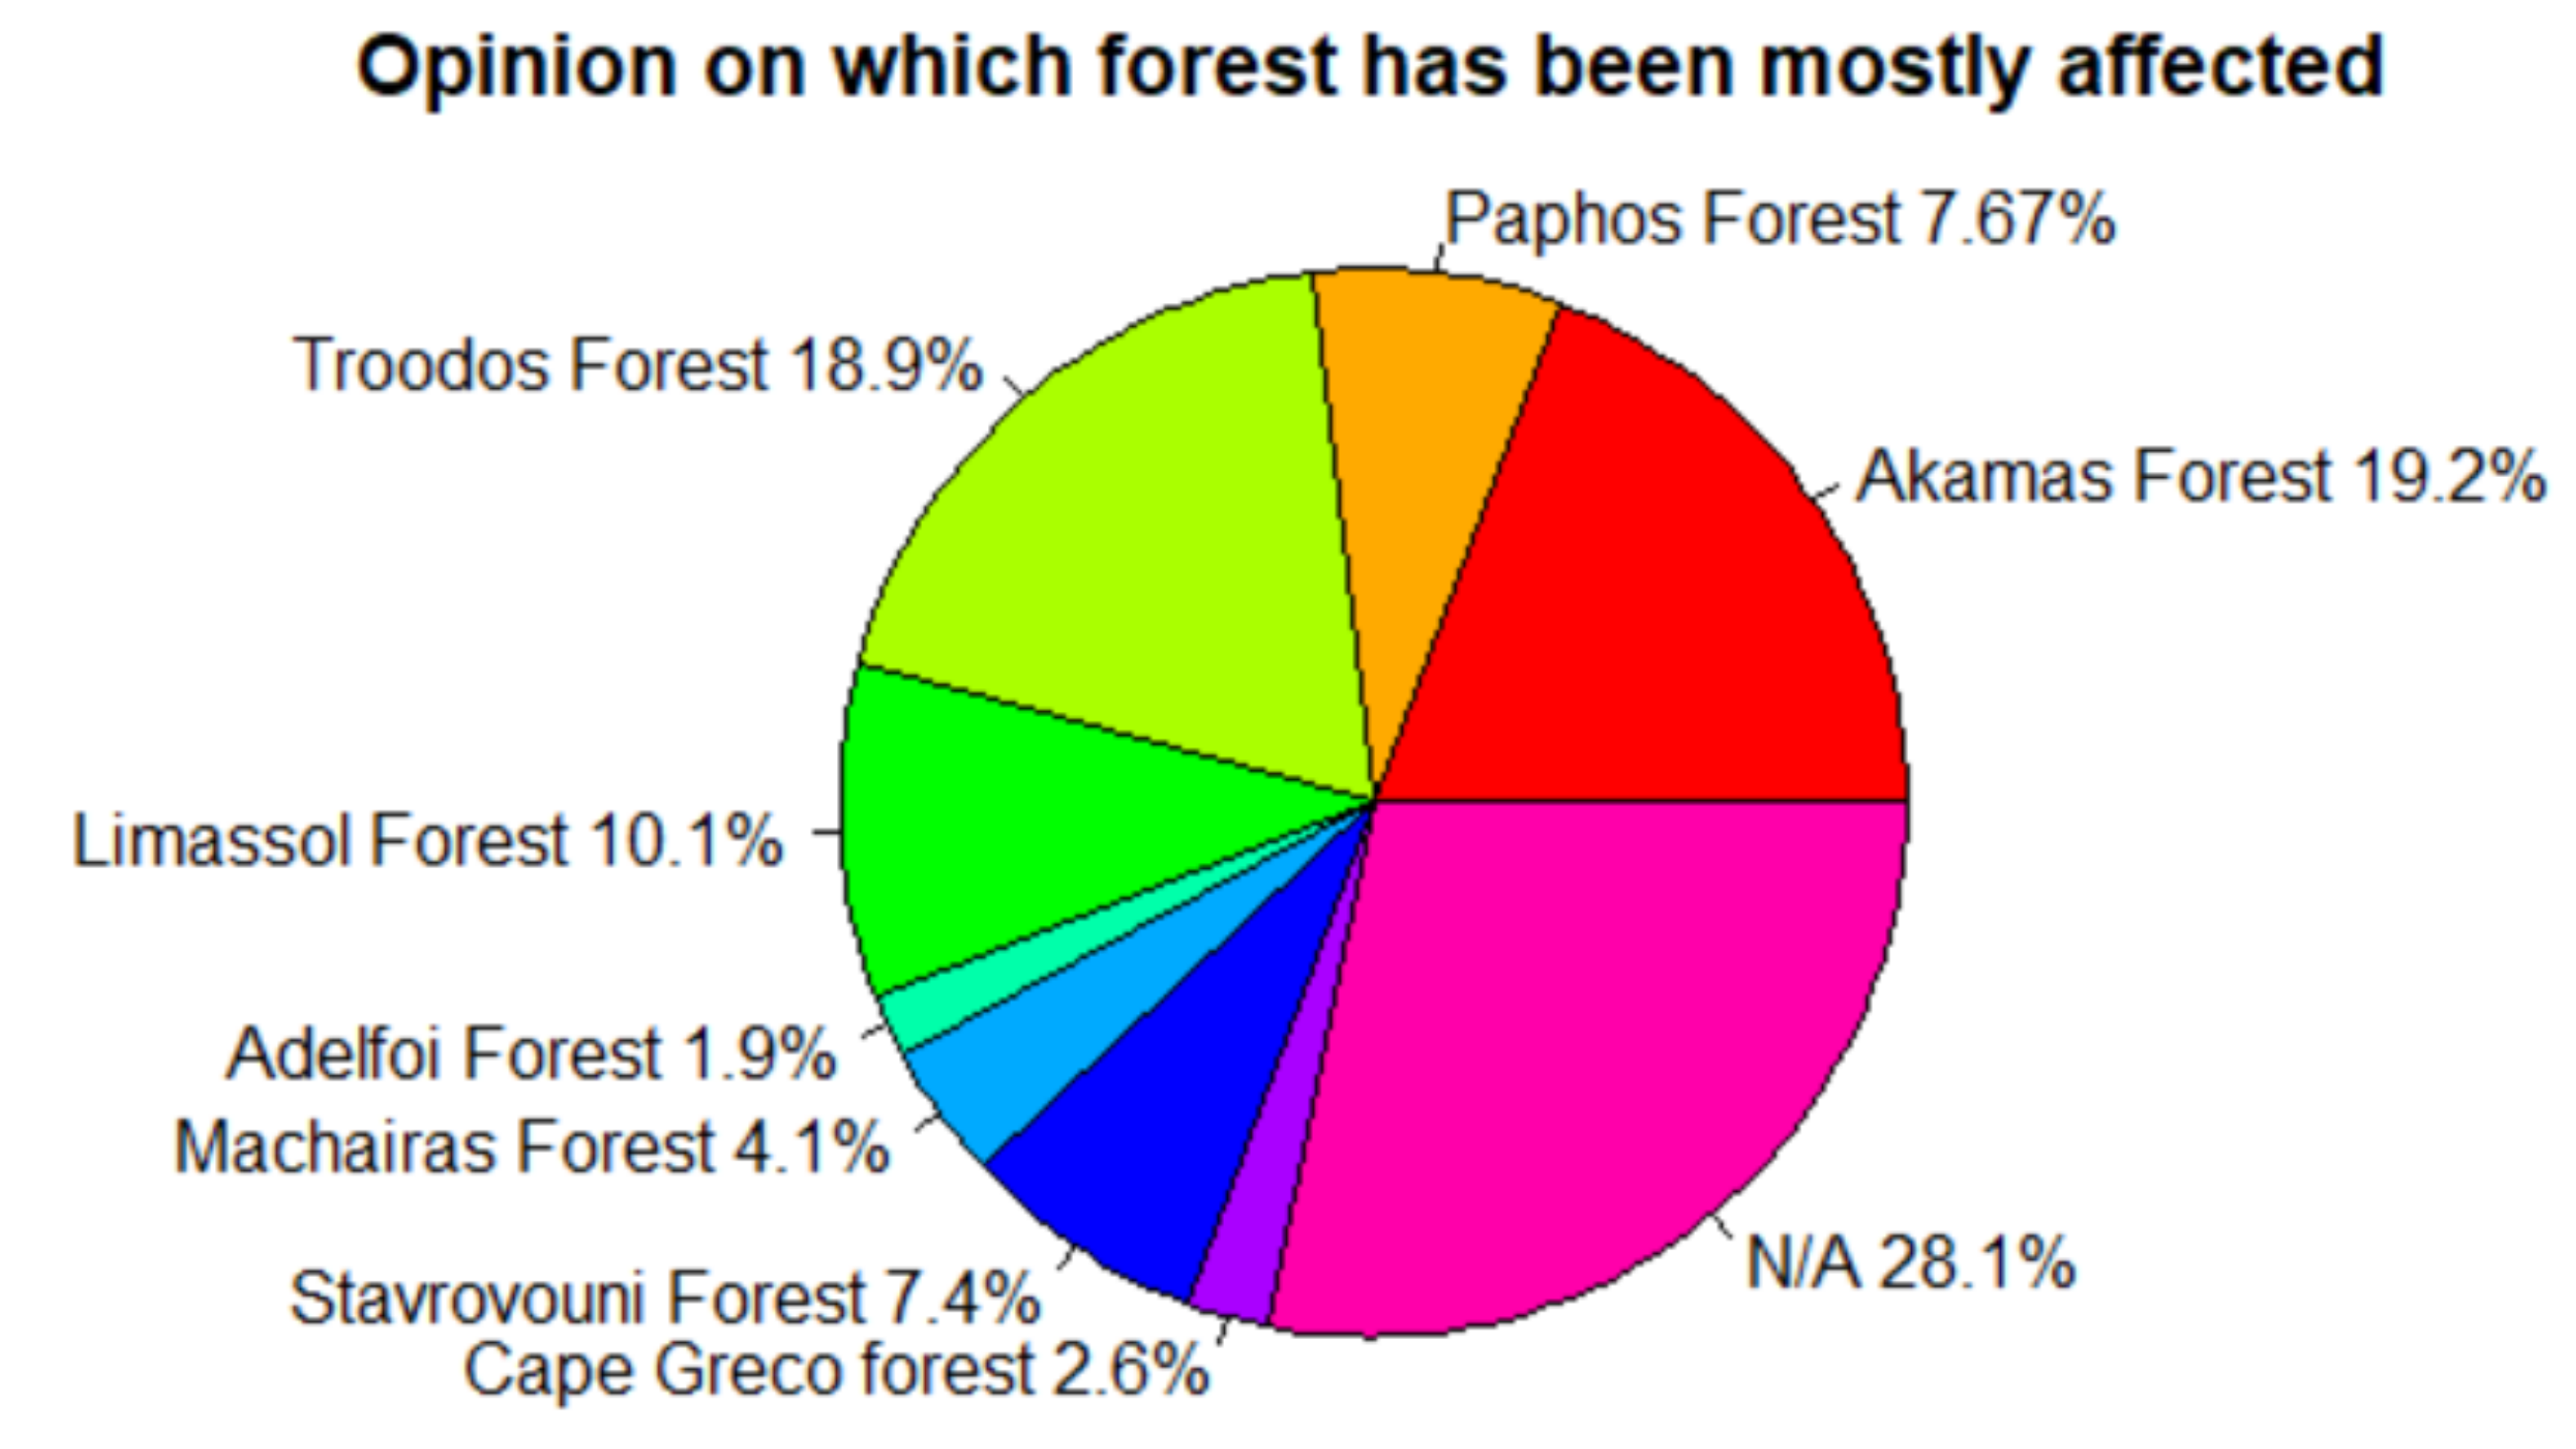
Not to be missed is which areas people believe have been mostly affected as indicated in Figure 6. Most people believe that the most affected forested areas are Akamas forest (19.2%) and Troodos forest (19%)—(
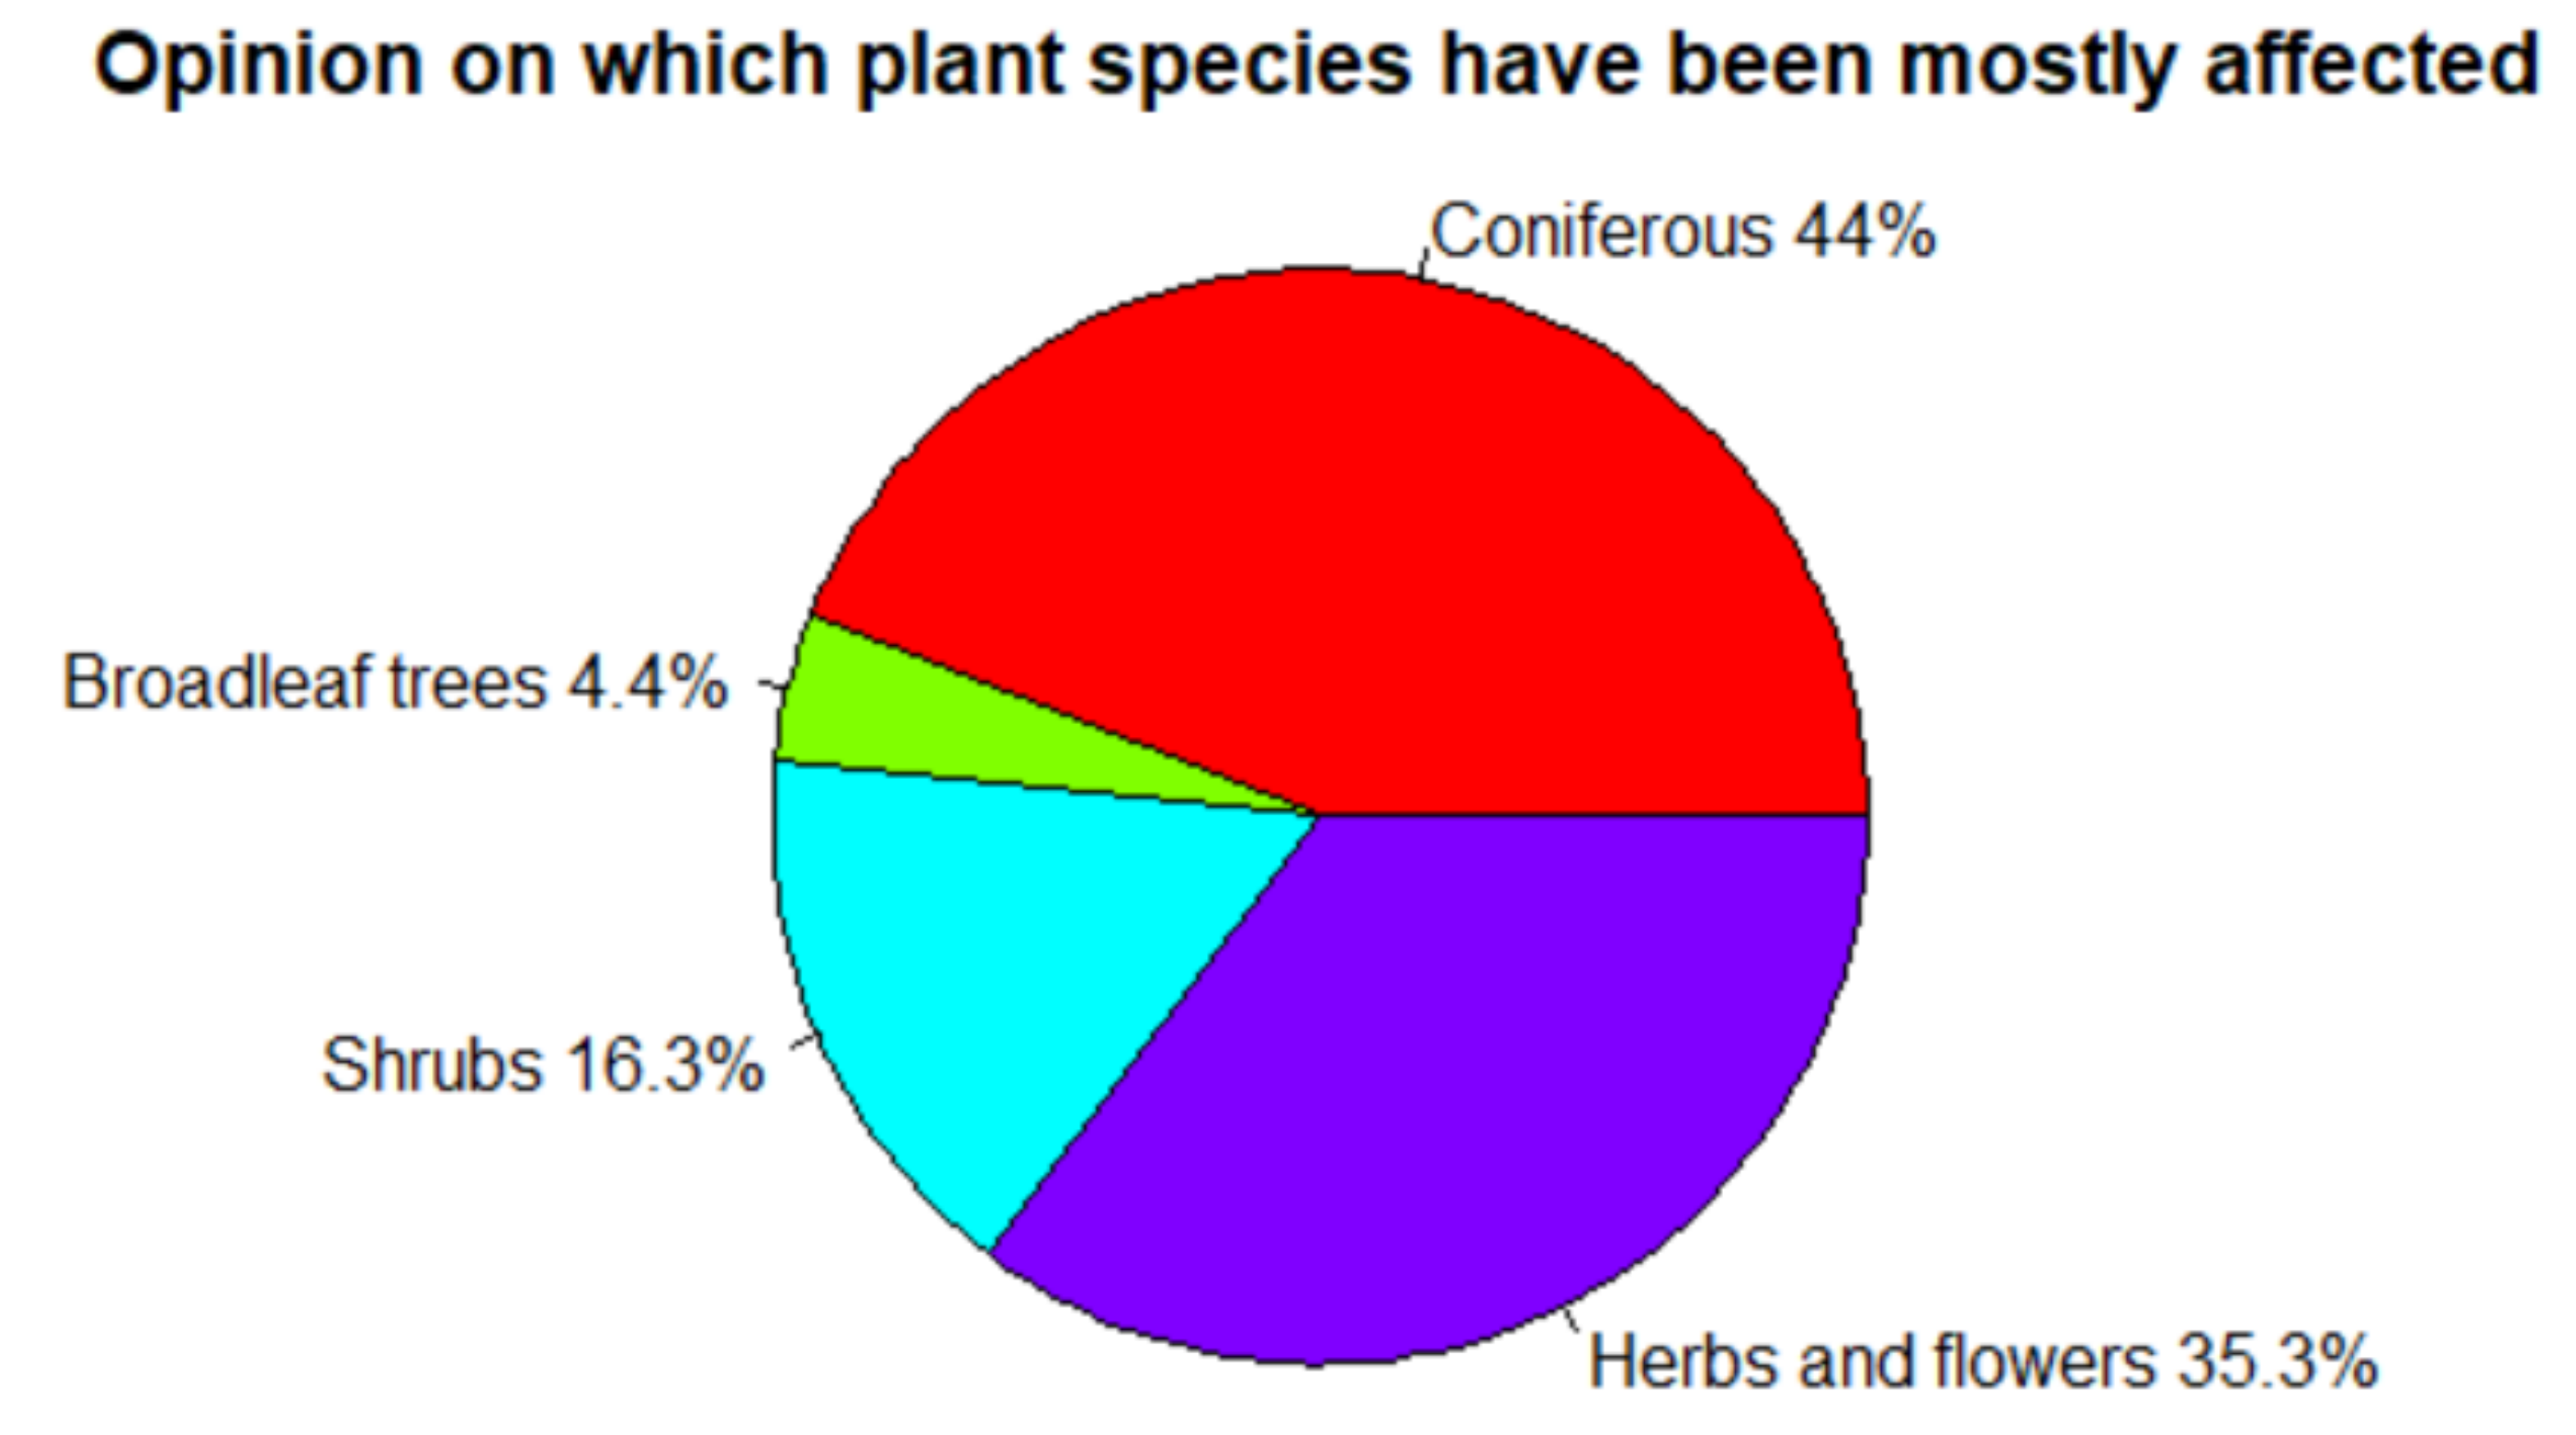
Figure 1 shows the locations of Akamas and Troodos forests). Finally, it is people’s answers on what they believed that the most affected plant species is. The majority (44%) stated that coniferous trees have been chiefly influenced, while 35.3% asserted Herbs and Flowers, 16.3% Broadleaf trees and 4.4% Shrubs (Figure 7).

4.1. Results of Likert Scale Questions versus Demographic Categories

The Likert scale questions have been analysed according to the various democratic data. Table 5, Table 6 and Table 7 present the percentages of the participants that replied positively (“Much” or “Very Much”) to the questions according to their “Educational Level”, “Age Category”, “Employability Status”. Due to an observed relationship between the beliefs of employed versus unemployed people, Table 8 was created to analyse further and understand the potential correlation. The numbering of the questions in Table 5, Table 6 and Table 7 is the same as the numbering used at the disseminated questionnaire and they are aligned with the supported data provided along with this paper. Additionally, question 10 and 11 refer to “above phenomena”, which according to the questionnaire are: (1) Increase in temperature, (2) Prolonged period of high temperatures, (4) More frequent and more intense heat waves, (5) Reduction in annual precipitation and (6) More intense precipitation (extreme precipitation).

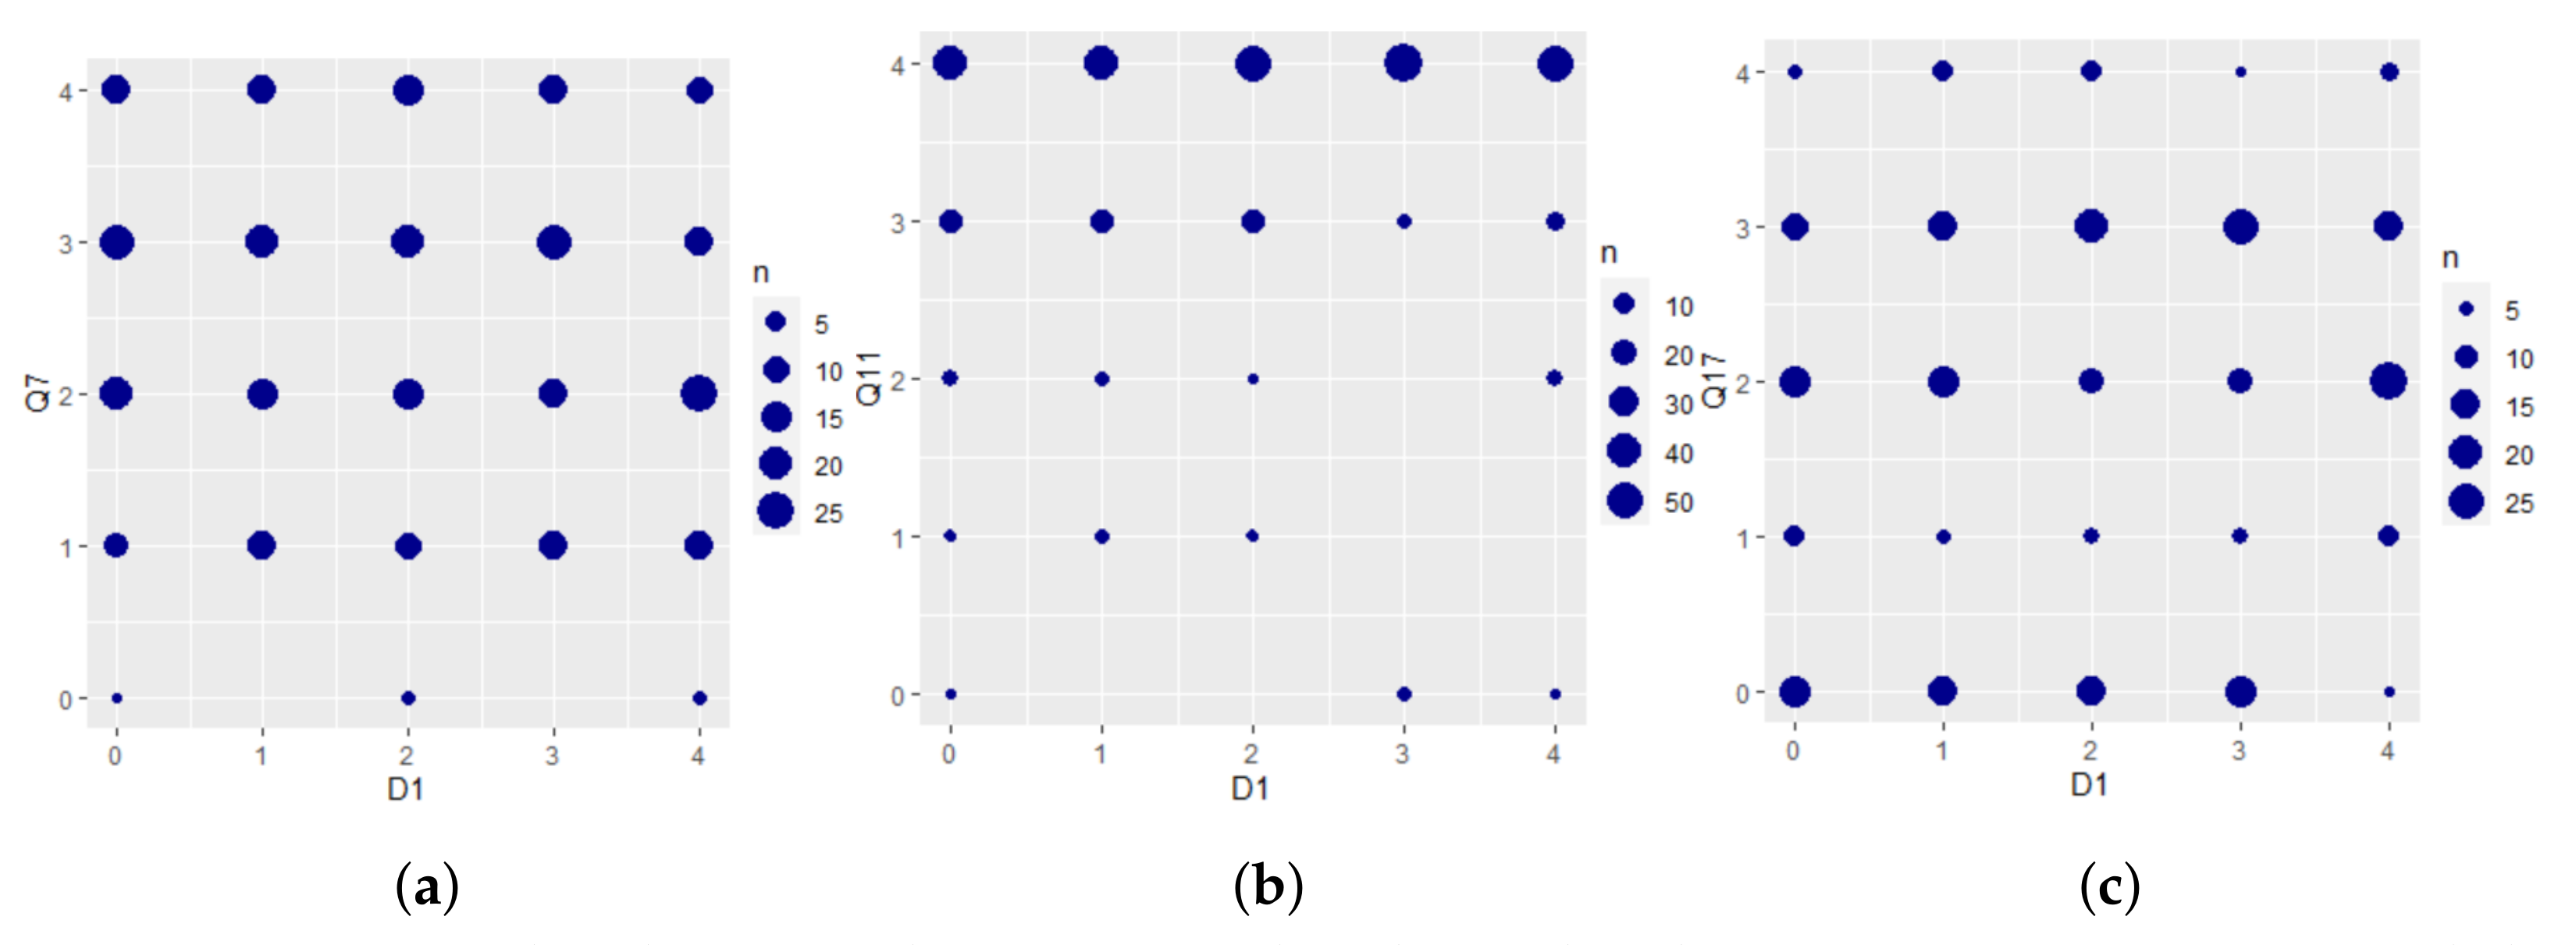
4.2. Scatter-Plots and Correlation Coefficients

This section shows the scatter-plots generated and provides the Spearman rank coefficient correlations derived. Figure 8 shows the scatter-plots generated for visually observing the relation between the “D1: Age Categories” and the three selected questions. Figure 9 shows the scatter-plots generated for observing “D2: Educational level” in relation to the three selected questions. Table 9 contains the Spearman rank correlation coefficients between three demographic categories (“D1: Age Category”, “D2: Educational level” and “D3: Employability Status—Employed or Not”) and three Likert scale questions were selected:
The significance values (p-values) of the coefficients are also denoted in Table 9. Correlations whose p-value is below 0.05 are considered statistically significant. It was shown that correlations of moderate and weak correlations are statistically significant, while combinations that indicated no correlation are not considered statistically significant.

5. Discussion

5.1. Specific Forest Related Questions

As shown by the high percentage of participants that noticed coniferous forest degradation—38.7% noted Much or Very Much and another 26.92% moderate, the effects of climate change on Cypriot forests are visual to the general public. This should draw the attention to scientist and policy makers for tackling climate change. Further, the decreased soil moisture observed by the people who completed the questionnaire is also noted in the report “Climate Change, Impacts and Vulnerability in Europe 2016” [10]. Similarly, the difficultly of regeneration has been suspected in a recent report of the Department of Forests due to fewer stems being recorded as the first class diameter than previous years [23].
Furthermore, the results of the most threatened forests in Cyprus are also aligned with the literature. Akamas forest (ranked 19.2% as most affected) has significantly suffered from forest fires but many fires, as affirmed by the Forestry Department Director Charalambos Alexandrou, were arson acts. Nevertheless, drought may have made fire spreading easier and more difficult to be eliminated [43]. In respect to Troodos forest (ranked 18.9% as most affected), the conservation of Black pine (Pinus nigra subsp. Palassiana) that resides on its highest elevations is under pressure; its distribution is restricted, and it is expected to suffer from climate change, while Calabrian pine (Pinus brutia) is favoured threatening to invade habitats of Black pine (Pinus nigra subsp. Palassiana) [34]. The fact that many other forested areas got a significant amount of votes (e.g., Stavrovouni Forest got a percentage of 7.4%) indicates that further research is required to understand how each forest has been affected and what people saw to consider them as the most threatened ones.
The high percentage of participants selecting coniferous species as the most affected species by climate changes leads to the conclusions that more studies like [44] are required to assess the vulnerability of Mediterranean conifers. Climate change negatively affects the vulnerability of populations of Black pine (Pinus nigra subsp. Palassiana) in Mediterranean mountain forests [45] and, as aforementioned, there is evidence that the conservation of Black pine (Pinus nigra subsp. Palassiana) on Troodos mountains is under pressure; its distribution is restricted and it is expected to suffer from climate change, while Calabrian pine (Pinus brutia) is favoured threatening to invade habitats of Black pine (Pinus nigra subsp. Palassiana) [19,34].

5.2. Likert Question Given

In respect to the Likert scale questions (results provided at Table 6, Table 7 and Table 8), observation were derived by separating the responses to different demographic categories. Table 5 (“D1. Age Category”) shows that older participants believed that climate change had not been perceived enough in Cyprus. They were also more convinced in comparison to the younger population that phenomena like prolonged period of high temperature and more intense heat-waves were important and affects us now. People over 55 were also more likely to have noticed more effects of climate change, while people aged between 35–44 were more likely to have noticed forest degradation. Additionally, it is interesting how people answered the question “Have you been personally affected by climate change?” according to their age; 43.96% of the participants aged between 15–24 replied “Much or Very Much”, then there is a peak at the age range 45–54 (65.89%) and the percentage drops at the older populations with 46.15% at participants aged 65+. It is suspected that this is happening because even though the older population understands the importance of climate change and they have noticed most of the changes occurred due to climate change, they were expecting the next generations to have to deal with the most severe effects and, therefore, not considered themselves as directly/personally affected by climate change.
From Table 6 (“D2. Educational Level”), it was observed that the more someone is educated the less likely is to believes that climate change is perceived, while the lower the education level was, the lower the probability was to acknowledge the importance of climate change. Furthermore, believing in the significance of climate change seems to be cross correlated to how well people perceive climate change. Concluding that the higher the education someone held the more likely was to believe that climate change was important but not being well perceived. It is further noticeable that in Table 6 the group of people that noticed the most differences (with a percentage of 46.67%) and a significant difference of at least 7.23% from the other groups is the “Other higher Education”. This may represent groups of foresters that graduated from Cyprus Forestry College at Prodromos or other relevant studies. This is suspected because the questionnaire was forwarded to the foresters’ community—among other communities.
Regarding Table 7 (“Job status”), people working at non-profit-organisations (NGOs) were more likely to believe that climate change related phenomena are important. Participants that work at NGOs were 71.43% likely to have noticed coniferous forest degradation, while the rest of the participants were on average only 37.56% likely to have noticed coniferous forest degradation. This is a total of 33.87% increased likelihood for someone that worked at NGO to have seen forest degradation in Cyprus. On the one hand, the sample of working to NGOs consists of only of 14 participants but on the other hand the 33.87% higher probability of noticing forest degradation cannot be dismissed.
Another remarkable finding is the difference in beliefs between people who are “Employed Vs Unemployed” and how being employed or not may relate to your believes/knowledge/observations about climate change. Table 4 the two groups is distinct. The only questions that show that un-employed people may have observed more forest-related changes are in the blooming timing of coniferous trees, but both percentages are low and the positive samples of unemployed participants are only 5. The most significant factor relating to unemployability is whether people believe that “climate change has been perceived in Cyprus”; 48.38% of the employed participants replied “Much” or “Very Much”, while 65.84% of the unemployed participants replied “Much” or Very Much”. There was a difference of 16.84% in those responses. It worth noting that, as aforementioned, it was also observed that the higher the education was the more likely was people to believe that climate change has not been perceived but it is important. So, this resembles with employability status. On top of that, while unemployed people were more convinced that climate change is perceived in Cyprus, they were less likely by 11.52% in comparison to employed people to believe in the importance of climate change, less likely by 8.09% versus employed people to believe that these phenomena will affect us in the future, less likely by 9.27 versus employed people to have noticed forest degradation and less likely by 7.05 versus employed people to notice changes in blossoming timing of forest plants in terms of initiation.

5.3. Scatterplots and Correlation Coefficients

From the correlation coefficients, it is shown that even though the belief on whether climate change was perceived in Cyprus was one of the highlighted questions in Section 5.2, Spearman correlation showed no relation between the three selected demographic categories (“D1. Age category”, “D2. Educational Level”, “D3. Employed or not”). It is suspected that this occurred because the relation identified was not linear. Additionally, according to how correlations are classified in psychological research [46], a weak correlation is observed between “D1. Educational Level” and Q11, which relates to whether climate change phenomena are important and will affect us in the future. The scatter-plot depicts a clear relationship between the highest education and the belief that climate change related phenomena are important and will affect us in the future. Nevertheless, the Cartesian points in the lower educational levels are more distributed, showing that it cannot be distinguished if the beliefs of someone with lower education are related to Q11. A moderate Spearman rank correlation coefficient was also derived between D1–Q11 and D1–Q17. Similarly to educational level, the older the participants were, the more likely was to believe that climate change is important and will affect us in the future. Additionally, the older the participants were, the more coniferous forests degradation they had observed in Cyprus. This is reasonable considering that they lived longer to notice the changes in relation to the younger populations. Last but not least, a moderate correlation was derived between people who are employed (D3) and Q11, as well as the weak correlation between employed people (D3) noticing more forest degradation (Q17) in relation to unemployed people. This is an interesting finding and it may imply increased intelligence and employability to people whose beliefs are aligned with climate change. As shown in Table 8 and explained in Section 4.1 unemployed people were less likely to believe that climate change related phenomena are important and will affect us now and in the future. They were also less likely to have observed forest degradation. According to Guilbert et al., 2016 [47] there are three main perspectives for analysing the employability prospects in the world of work: (1) Educational and governmental, (2) Organizational and (3) Individual. Research about identifying individual traits that increases employability stressed the importance of adaptation and change to working environment; they serve as a factor of increasing employability [48]. This study shows that employed people were more likely to believe in climate change and observe its effect. This may indicate that beliefs aligned with climate change may relate to increased employability. This aspect of potentially increased employability could be classified under the Individual pillar.

6. Conclusions

Climate change is universally recognized as a global issue of emergency as it could confer severe consequences for humanity and ecosystems [49]. Scientists have been monitoring, ongoing and future patterns of climate change and their effects at global and regional scales [50]. It is of crucial importance to develop localised policies and educational plans tailored to the understanding of the general public. This study measured through questionnaires what Cypriot residents believe about climate change and whether they have observed forest degradation. The responses were compared among various demographic categories (age, education and employability status). The question on whether they noticed degradation on Cypriot coniferous forest received 65.62% responses stating “moderate”, “much” or “very much”. A potential degradation reason was written down by 150 people, of whom 31.33% referred to tree die-back, while many stated decreased soil moisture and difficulty in regeneration. These degradation reasons were either suspected or noted in the literature [23,51]. Webel et at., 2010 [9] stressed the importance of comparing perceptions of scientist and general public and doubted that the general public was able to observe climate change on phenomena. In contrast—and after 10 years—in this study, we found that a small percentage of the general public was able to observe specific phenomena (e.g., reduced soil moisture), while a significant percentage noticed forest degradation. Employed people were also more likely to believe that climate change is important, raising the question whether believing in climate change is a personality trait that increases employability.
With respect to future directions, it will be interesting to see after a few years how the perceptions of people would have modified; whether they may observe more forest degradation and whether they may be more convinced about the importance of climate change. Another research direction is to look further into the employability perceptive and how the beliefs of people about climate change may increase their employability. Not to be missed is the comparison of perceptions between multiple countries for understanding how cultural differences influences people’s beliefs on the subject; this will help tailor education and policies for each country and possibly help the worst-performing countries, like Cyprus, to reach their Green Deal targets. This will contribute into preserving a healthy ecosystem that will maintain social stability and stimulate economic growth. In parallel, these data could be used as scientific evidence for promoting environmentally friendly policies aiming to mitigate the effects of climate change.

Author Contributions

Conceptualization, M.M.; methodology, M.M. and E.A.; software, M.M.; validation, M.M. and C.D.; formal analysis, M.M.; investigation, M.M. and E.A.; resources, M.M. and E.A.; data curation, M.M.; writing—original draft preparation, M.M.; writing—review and editing, M.M., C.T., E.A. and C.D.; visualization, M.M. and C.T.; supervision, C.D.; project administration, M.M. and C.D.; funding acquisition, M.M. and C.D. All authors have read and agreed to the published version of the manuscript.

Funding

This research is part of the ASTARTE"(EXCELLENCE/0918/0341) project, which is co-financed by the European Regional Development Fund and the Republic of Cyprus through the Research Innovation Foundation.

Institutional Review Board Statement

The study has been approved by the Cyprus National Bioethics Committee on 2 July 2019.

Informed Consent Statement

Informed consent was obtained from all subjects involved in the study.

Conflicts of Interest

The authors declare no conflict of interest.

Abbreviations

The following abbreviations are used in this manuscript:
DOAJDirectory of open access journals
EUEuropean Union
MDPIMultidisciplinary Digital Publishing Institute
NGONon Governmental Organisation
N/ANot Applicable
PhDDoctor of Philosophy
VsVersus

References

  1. Elmqvist, T.; Setälä, H.; Handel, S.; Van Der Ploeg, S.; Aronson, J.; Blignaut, J.N.; Gomez-Baggethun, E.; Nowak, D.; Kronenberg, J.; De Groot, R. Benefits of restoring ecosystem services in urban areas. Curr. Opin. Environ. Sustain. 2015, 14, 101–108. [Google Scholar] [CrossRef] [Green Version]
  2. Hooper, D.U.; Chapin, F.; Ewel, J.; Hector, A.; Inchausti, P.; Lavorel, S.; Lawton, J.; Lodge, D.; Loreau, M.; Naeem, S.; et al. Effects of biodiversity on ecosystem functioning: A consensus of current knowledge. Ecol. Monogr. 2005, 75, 3–35. [Google Scholar] [CrossRef]
  3. Boustras, G.; Bratskas, R.; Pourgouri, S.; Michaelides, A.; Efstathiades, A.; Katsaros, E. A report on forest fires in cyprus. Australas. J. Disaster Trauma Stud. 2008, 2008. [Google Scholar]
  4. Dimitrakopoulos, A.; Gogi, C.; Stamatelos, G.; Mitsopoulos, I. Statistical analysis of the fire environment of large forest fires (>1000 ha) in Greece. Pol. J. Environ. Stud. 2011, 20, 327–332. [Google Scholar]
  5. Mateus, P.; Fernandes, P.M. Forest fires in Portugal: Dynamics, causes and policies. In Forest Context and Policies in Portugal; Springer: Berlin/Heidelberg, Germany, 2014; pp. 97–115. [Google Scholar]
  6. Takov, D.; Doychev, D.; Linde, A.; Draganova, S.; Pilarska, D. Pathogens of bark beetles (Coleoptera: Curculionidae) in Bulgarian forests. Phytoparasitica 2011, 39, 343–352. [Google Scholar] [CrossRef]
  7. Read, D.J.; Freer-Smith, P.; Morison, J.; Hanley, N.; West, C.; Snowdon, P. Combating Climate Change: A Role for UK Forests. An Assessment of the Potential of the UK’s Trees and Woodlands to Mitigate and Adapt to Climate Change; The Stationery Office Limited: London, UK, 2009. [Google Scholar]
  8. Whitmarsh, L.; Capstick, S. Perceptions of climate change. In Psychology and Climate Change; Elsevier: Amsterdam, The Netherlands; New York, NY, USA, 2018; pp. 13–33. [Google Scholar] [CrossRef]
  9. Weber, E.U. What shapes perceptions of climate change? Wiley Interdiscip. Rev. Clim. Chang. 2010, 1, 332–342. [Google Scholar] [CrossRef]
  10. EEA. Climate Change, Impacts and Vulnerability in Europe 2016: An Indicator-Based Report; European Envirnment Agency: København, Denmark, 2017. [Google Scholar]
  11. CYPADAPT. Report on the Future Climate Change Impact, Vulnerability and Adaptation Assessment for the Case of Cyprus; CYPADAPT: Nicosia, Cyprus, 2016. [Google Scholar]
  12. Shoukri, E.; Zachariadis, T. Climate change in Cyprus: Impacts and adaptation policies. In Environmental Policy Research Group Report; Cyprus University of Technology: Limassol, Cyprus, 2012; pp. 1–12. [Google Scholar]
  13. Linder, M.; Garcia-Gonzalo, J.; Kolstrom, M.; Green, T.; Reguera, R.; Maroschek, M.; Seidl, R.; Lexer, M.J.; Netherer, S.; Schopf, A.; et al. Impacts of Climate Change on European Forests and Options for Adaptation. 2008. Available online: https://climate-adapt.eea.europa.eu/metadata/publications/impacts-of-climate-change-on-european-forests-and-options-for-adaptation and https://www.researchgate.net/publication/285320195_Impacts_of_climate_change_on_European_forests_and_options_for_adaptation (accessed on 19 August 2021).
  14. Hódar, J.A.; Castro, J.; Zamora, R. Pine processionary caterpillar Thaumetopoea pityocampa as a new threat for relict Mediterranean Scots pine forests under climatic warming. Biol. Conserv. 2003, 110, 123–129. [Google Scholar] [CrossRef]
  15. Cleland, E.E.; Chuine, I.; Menzel, A.; Mooney, H.A.; Schwartz, M.D. Shifting plant phenology in response to global change. Trends Ecol. Evol. 2007, 22, 357–365. [Google Scholar] [CrossRef]
  16. Wolkovich, E.M.; Cook, B.I.; Allen, J.M.; Crimmins, T.M.; Betancourt, J.L.; Travers, S.E.; Pau, S.; Regetz, J.; Davies, T.J.; Kraft, N.J.; et al. Warming experiments underpredict plant phenological responses to climate change. Nature 2012, 485, 494. [Google Scholar] [CrossRef]
  17. Beniston, M. Climatic change in mountain regions: A review of possible impacts. In Climate Variability and Change in High Elevation Regions: Past, Present & Future; Springer: Dordrecht, The Netherlands, 2003; pp. 5–31. [Google Scholar]
  18. Thirgood, J.V. Cyprus: A Chronicle of Its Forests, Land and People; University of British Columbia Press: Vancouver, BC, USA, 1987. [Google Scholar]
  19. Delipetrou, P.; Makhzoumi, J.; Dimopoulos, P.; Georghiou, K. Mediterranean Island Landscapes: Natural and Cultural Approaches: Cyprus; Springer: Reading, UK, 2008; pp. 170–203. [Google Scholar] [CrossRef]
  20. Meikle, R.D. Flora of Cyprus. Volume One; Bentham-Moxon Trust; Royal Botanic Gardens: Kew, UK, 1977. [Google Scholar]
  21. Holmboe, J. Studies on the Vegetation of Cyprus: Based upon Researches during the Spring and Summer 1905; John Griegs: Bergens, Norway, 1914; Volume 10. [Google Scholar]
  22. Kyriakou, A.; Toumasis, I.; Thomas, K. Remembrance Life: The Forestry of Yesterday: 1899–1969; Cyprus Foresters Association Graduates of the Cyprus Forestry College: Nicosia, Cyprus, 2002. [Google Scholar]
  23. Department of Forest. Criteria and Indicators for the Sustainable Forest Management in Cyprus; Ministry of Agriculture, Natural Resources and Environment: Nicosia, Cyprus, 2006. [Google Scholar]
  24. Mapped: Greenhouse Gas Emissions by EU Country. Available online: https://www.greenmatch.co.uk/blog/2019/10/greenhouse-gas-emissions-by-country (accessed on 30 July 2021).
  25. Battaglini, A.; Barbeau, G.; Bindi, M.; Badeck, F.W. European winegrowers’ perceptions of climate change impact and options for adaptation. Reg. Environ. Chang. 2009, 9, 61–73. [Google Scholar] [CrossRef]
  26. Europe 2020 Targets: Statistics and Indicators for Italy. Available online: https://ec.europa.eu/info/business-economy-euro/economic-and-fiscal-policy-coordination/eu-economic-governance-monitoring-prevention-correction/european-semester/european-semester-your-country/italy/europe-2020-targets-statistics-and-indicators-italy_en (accessed on 30 July 2021).
  27. Europe 2020 Targets: Statistics and Indicators for Cyprus. Available online: https://ec.europa.eu/info/business-economy-euro/economic-and-fiscal-policy-coordination/eu-economic-governance-monitoring-prevention-correction/european-semester/european-semester-your-country/cyprus/europe-2020-targets-statistics-and-indicators-cyprus_en (accessed on 30 July 2021).
  28. Bostrom, A.; Morgan, M.G.; Fischhoff, B.; Read, D. What do people know about global climate change? 1. Mental models. Risk Anal. 1994, 14, 959–970. [Google Scholar] [CrossRef]
  29. Read, D.; Bostrom, A.; Morgan, M.G.; Fischhoff, B.; Smuts, T. What do people know about global climate change? 2. Survey studies of educated laypeople. Risk Anal. 1994, 14, 971–982. [Google Scholar] [CrossRef]
  30. Yousefpour, R.; Hanewinkel, M. Forestry professionals’ perceptions of climate change, impacts and adaptation strategies for forests in south-west Germany. Clim. Chang. 2015, 130, 273–286. [Google Scholar] [CrossRef]
  31. Lujala, P.; Lein, H.; Rød, J.K. Climate change, natural hazards, and risk perception: The role of proximity and personal experience. Local Environ. 2015, 20, 489–509. [Google Scholar] [CrossRef] [Green Version]
  32. Whitmarsh, L. Are flood victims more concerned about climate change than other people? The role of direct experience in risk perception and behavioural response. J. Risk Res. 2008, 11, 351–374. [Google Scholar] [CrossRef]
  33. Crona, B.; Wutich, A.; Brewis, A.; Gartin, M. Perceptions of climate change: Linking local and global perceptions through a cultural knowledge approach. Clim. Chang. 2013, 119, 519–531. [Google Scholar] [CrossRef]
  34. Zachariadis, T. Climate Change in Cyprus: Review of the Impacts and Outline of an Adaptation Strategy; Springer: Berlin/Heidelberg, Germany, 2016. [Google Scholar]
  35. Vagias, W.M. Likert-Type Scale Response Anchors. Clemson International Institute for Tourism; Research Development, Department of Parks, Recreation and Tourism Management, Clemson University: Clemson, SC, USA, 2006; pp. 4–5. [Google Scholar]
  36. Republic of Cyprus. Demographic Statistics 2019; Ministry of Finance: Nicosia, Cyprus, 2019. [Google Scholar]
  37. Miltiadou, M.; Campbell, N.D.; Gonzalez Aracil, S.; Brown, T.; Grant, M.G. Detection of dead standing Eucalyptus camaldulensis without tree delineation for managing biodiversity in native Australian forest. Int. J. Appl. Earth Obs. Geoinf. 2018, 67, 135–147. [Google Scholar] [CrossRef]
  38. Sedgwick, P. Spearman’s rank correlation coefficient. BMJ 2014, 349, g7327. [Google Scholar] [CrossRef] [PubMed] [Green Version]
  39. Benesty, J.; Chen, J.; Huang, Y.; Cohen, I. Pearson correlation coefficient. In Noise Reduction in Speech Processing; Springer: New York, NY, USA, 2009; pp. 1–4. [Google Scholar]
  40. Vacanas, Y.; Danezis, C. Determination of Effective Delay-Avoidance Practices in Construction Projects. J. Legal Aff. Disput. Resolut. Eng. Constr. 2020, 13, 04520039. [Google Scholar] [CrossRef]
  41. de Winter, J.C.; Gosling, S.D.; Potter, J. Comparing the Pearson and Spearman correlation coefficients across distributions and sample sizes: A tutorial using simulations and empirical data. Psychol. Methods 2016, 21, 273. [Google Scholar] [CrossRef]
  42. Zar, J.H. Biostatistical Analysis; Pearson: Essex, UK, 1999. [Google Scholar]
  43. Keetch, J.J.; Byram, G.M. A Drought Index for Forest Fire Control; US Department of Agriculture, Forest Service, Southeastern Forest Experiment: Asheville, NC, USA, 1968; Volume 38. [Google Scholar]
  44. Serra-Varela, M.J.; Alía, R.; Daniels, R.R.; Zimmermann, N.E.; Gonzalo-Jiménez, J.; Grivet, D. Assessing vulnerability of two Mediterranean conifers to support genetic conservation management in the face of climate change. Divers. Distrib. 2017, 23, 507–516. [Google Scholar] [CrossRef]
  45. Linares, J.C.; Tíscar, P.A. Climate change impacts and vulnerability of the southern populations of Pinus nigra subsp. salzmannii. Tree Physiol. 2010, 30, 795–806. [Google Scholar] [CrossRef] [Green Version]
  46. Cohen, J. Statistical Power Analysis for the Behavioral Sciences, 2nd ed.; Lawrence Erlbaum Associates: New York, NY, USA, 1969. [Google Scholar]
  47. Guilbert, L.; Bernaud, J.L.; Gouvernet, B.; Rossier, J. Employability: Review and research prospects. Int. J. Educ. Vocat. Guid. 2016, 16, 69–89. [Google Scholar] [CrossRef]
  48. Fugate, M.; Kinicki, A.J. A dispositional approach to employability: Development of a measure and test of implications for employee reactions to organizational change. J. Occup. Organ. Psychol. 2008, 81, 503–527. [Google Scholar] [CrossRef]
  49. Levy, B.S.; Patz, J.A. Climate change, human rights, and social justice. Ann. Glob. Health 2015, 81, 310–322. [Google Scholar] [CrossRef]
  50. Pachauri, R.K.; Allen, M.R.; Barros, V.R.; Broome, J.; Cramer, W.; Christ, R.; Church, J.A.; Clarke, L.; Dahe, Q.; Dasgupta, P.; et al. Climate Change 2014: Synthesis Report. Contribution of Working Groups I, II and III to the Fifth Assessment Report of the Intergovernmental Panel on Climate Change; Cambridge University Press: New York, NY, USA, 2014. [Google Scholar]
  51. Kurnik, B.; Kajfež-Bogataj, L.; Horion, S. An assessment of actual evapotranspiration and soil water deficit in agricultural regions in Europe. Int. J. Climatol. 2015, 35, 2451–2471. [Google Scholar] [CrossRef]
Figure 1. Study Area—Location and names of forests in Cyprus according to the Department of Forests.
Forests 12 01152 g001
Figure 2. Study Area: Number of participants according to their age.
Forests 12 01152 g002
Figure 3. Study Area: Number of participants according to their educational level.
Forests 12 01152 g003
Figure 4. Study Area: Number of participants per province. The colours are relevant to the number of participants per province. The darker the colour is, the more people participated in the study from that province. Please note that the numbers on the map sum up to 415 instead of 416, since the name of residency provided by a participant was ambiguous.
Forests 12 01152 g004
Figure 5. Answers to question: Have you noticed any forest degradation in pine forests in Cyprus (e.g., reduced forest density, forest-related diseases or pests)?
Forests 12 01152 g005
Figure 6. Answers of Question: In Cypriot Forests, which the plant species according to your opinion, has been mostly affected due to climate change?—Figure 1 is a map depicting the location of those forested areas.
Forests 12 01152 g006
Figure 7. Answers of Question: In Cypriot Forests, which the plant species according to your opinion, has been mostly affected due to climate change? (no “N/A” option was available).
Forests 12 01152 g007
Figure 8. Scatter-plots between the Demographic data related to “D1: Age Category” and the three selected questions—Q7, Q11 and Q17 (Section 2.2). (a) Scatter-plot between D1 and Q7; (b) Scatter-plot between D1 and Q11; (c) Scatter-plot between D1 and Q17.
Forests 12 01152 g008
Figure 9. Scatter-plots between the Demographic data related to “D2: Educational Level” and the three selected questions—Q7, Q11 and Q17 (Section 2.2). (a) Scatter-plot between D2 and Q7; (b) Scatter-plot between D2 and Q11; (c) Scatter-plot between D2 and Q17.
Forests 12 01152 g009
Table 1. Numeric values for Likert replies of participants.
AnswerNot at AllSlightlySomewhatMuchVery MuchN/A
Numeric Value01234N/A
Table 2. Numeric values for the Age Category (D1) of the participants.
Answer15–2425–3435–4445–5455+N/A
Numeric Value01234N/A
Table 3. Numeric values for Educational level (D2) of participants.
AnswerLyceum Lower or NoneCollege/ApolyterionBA/BScMA/MScPhDN/A
Numeric Value01234N/A
Table 4. Numeric values on whether participants are employed or not (D3).
AnswerEmployedNot Employed
Numeric Value01
Table 5. Percentage of positive (“Much” and “Very Much”) replies of the Likert Questions according to the age category of the participants.
Age Category15–2425–3435–4445–5455–6465+
No of Samples91147101362813
QuestionsPercentage of Positive Replies
(“Much” and “Very Much” )
7. Has climate change been perceived in Cyprus?53.8546.9455.4552.7835.7130.77
10. Do you think that the weather phenomena mentioned above are important and affect you now?68.1373.4776.2488.8985.7184.62
11. Do you think that the weather phenomena mentioned above are important and will affect you in the future?80.2289.892.0886.1189.2984.62
12. Have you noticed the effects of climate change on the forests of Cyprus?45.0551.746.535053.5753.85
17. Have you noticed any forest degradation in pine forests in Cyprus (e.g., reduced forest density, forest related diseases or pests)?28.5737.4149.541.6742.8623.08
20. Have you noticed any changes in blossoming timing of forest plants? In terms of initiation.10.9921.0917.8233.3321.4323.08
20. Have you noticed any changes in blossoming timing of forest plants? In terms of duration.7.6921.7723.7619.4417.8615.38
20. Have you noticed any changes in blossoming timing of forest plants? In terms of termination.16.4821.0919.819.4410.7115.38
22. Have you noticed changes in the blossoming timing of coniferous (pine) forests in Cyprus? In terms of initiation.6.5910.8810.895.5610.717.69
22. Have you noticed changes in the blossoming timing of coniferous (pine) forests in Cyprus? In terms of duration.7.698.1610.8911.1107.69
22. Have you noticed changes in the blossoming timing of coniferous (pine) forests in Cyprus? In terms of termination.9.8910.8812.878.3307.69
24. How important is the issue of climate change to you personally?85.7194.5694.0686.1110092.31
25. Have you been personally affected by climate change?43.9648.344.5563.8957.1446.15
27. Have you adapted some habits of your daily life or work to cope with some phenomena that have been observed so far due to climate change?32.9727.8930.6933.3342.8630.77
Table 6. Percentage of positive (“Much” and “Very Much”) replies of the Likert Questions according to the educational level of the participants.
Educational LevelPhDMA/MScBA/BScCollege/ApolyteriomLyceumLower/None
No of Samples3118012630463
QuestionsPercentage of Positive Replies
(“Much” and “Very Much”)
7. Has climate change been perceived in Cyprus?45.1649.4449.2146.6756.5266.67
10. Do you think that the weather phenomena mentioned above are important and affect you now?77.4278.3373.8173.3367.39100
11. Do you think that the weather phenomena mentioned above are important and will affect you in the future?93.5591.1188.8976.6773.91100
12. Have you noticed the effects of climate change on the forests of Cyprus?48.3952.22575047.8333.33
17. Have you noticed any forest degradation in pine forests in Cyprus (e.g., reduced forest density, forest related diseases or pests)?35.4839.4438.8946.6732.6133.33
20. Have you noticed any changes in blossoming timing of forest plants? In terms of initiation.12.92017.463019.570
20. Have you noticed any changes in blossoming timing of forest plants? In terms of duration.9.6822.7815.872015.220
20. Have you noticed any changes in blossoming timing of forest plants? In terms of termination.9.6819.4415.8723.3328.260
22. Have you noticed changes in the blossoming timing of coniferous (pine) forests in Cyprus? In terms of initiation.6.459.445.5626.674.350
22. Have you noticed changes in the blossoming timing of coniferous (pine) forests in Cyprus? In terms of duration.3.2311.115.5613.336.520
22. Have you noticed changes in the blossoming timing of coniferous (pine) forests in Cyprus? In terms of termination.3.2310.567.14308.70
24. How important is the issue of climate change to you personally?93.559592.069080.43100
25. Have you been personally affected by climate change?54.8450.5644.4456.6741.333.33
27. Have you adapted some habits of your daily life or work to cope with some phenomena that have been observed so far due to climate change?32.2633.8927.783030.4333.33
Table 7. Percentage of positive (“Much” and “Very Much”) replies of the Likert Questions according to the employability status of the participants.
Employability StatusStudentRetiredNGOPrivate SectorSemi-Private SectorPublic SectorSelf-EmployedUnemployed
No of Samples29101417824942146
QuestionsPercentage of Positive Replies
(“Much” and “Very Much”)
7. Has climate change been perceived in Cyprus?51.72205042.75058.5147.6265.22
10. Do you think that the weather phenomena mentioned above are important and affect you now?75.868085.7173.683.3379.7976.1965.22
11. Do you think that the weather phenomena mentioned above are important and will affect you in the future?89.669010088.295.8384.0495.2480.43
12. Have you noticed the effects of climate change on the forests of Cyprus?51.7250505045.8347.8747.6247.83
17. Have you noticed any forest degradation in pine forests in Cyprus (e.g., reduced forest density, forest related diseases or pests)?27.594071.4339.3341.6738.338.132.61
20. Have you noticed any changes in blossoming timing of forest plants? In terms of initiation.10.343021.4320.7920.8320.2119.0513.04
20. Have you noticed any changes in blossoming timing of forest plants? In terms of duration.6.92021.4317.9820.8323.419.0515.22
20. Have you noticed any changes in blossoming timing of forest plants? In terms of termination.10.342014.2923.038.3318.099.5219.57
22. Have you noticed changes in the blossoming timing of coniferous (pine) forests in Cyprus? In terms of initiation.007.1412.368.336.38010.87
22. Have you noticed changes in the blossoming timing of coniferous (pine) forests in Cyprus? In terms of duration.10.3407.1411.248.334.26010.87
22. Have you noticed changes in the blossoming timing of coniferous (pine) forests in Cyprus? In terms of termination.10.34107.1414.618.335.3208.7
24. How important is the issue of climate change to you personally?1009010092.1395.8389.3695.2486.96
25. Have you been personally affected by climate change?55.175071.4345.5137.553.1947.6243.48
27. Have you adapted some habits of your daily life or work to cope with some phenomena that have been observed so far due to climate change?44.833057.1429.7829.1731.9114.2928.26
Table 8. Percentage of positive (“Much” and “Very Much”) replies of the Likert Questions according to whether someone was employed or not. Note that this table does not include replies of students and retired people.
Employed or UnemployedEmployedUnemployed
No of Samples33146
QuestionsPercentage of Positive Replies
(“Much and “Very Much”)
7. Has climate change been perceived in Cyprus?48.3465.22
10. Do you think that the weather phenomena mentioned above are important and affect you now?76.7465.22
11. Do you think that the weather phenomena mentioned above are important and will affect you in the future?88.5280.43
12. Have you noticed the effects of climate change on the forests of Cyprus?48.9447.83
17. Have you noticed any forest degradation in pine forests in Cyprus (e.g., reduced forest density, forest related diseases or pests)?41.8832.61
20. Have you noticed any changes in blossoming timing of forest plants? In terms of initiation.20.5413.04
20. Have you noticed any changes in blossoming timing of forest plants? In terms of duration.19.9415.22
20. Have you noticed any changes in blossoming timing of forest plants? In terms of termination.19.3419.57
22. Have you noticed changes in the blossoming timing of coniferous (pine) forests in Cyprus? In terms of initiation.9.3710.87
22. Have you noticed changes in the blossoming timing of coniferous (pine) forests in Cyprus? In terms of duration.8.1610.87
22. Have you noticed changes in the blossoming timing of coniferous (pine) forests in Cyprus? In terms of termination.10.278.7
24. How important is the issue of climate change to you personally?92.1586.96
25. Have you been personally affected by climate change?48.3443.48
27. Have you adapted some habits of your daily life or work to cope with some phenomena that have been observed so far due to climate change?43.4828.26
Table 9. Spearman Rank Correlation Coefficients.
Age CategoryEducational LevelEmployed or Not
Coefficientp-ValueCoefficientp-ValueCoefficientp-Value
7. Has climate change been perceived in Cyprus?0.0270.356−0.0050.9320.0050.944
11. Do you think that the weather phenomena mentioned above are important and will affect you in the future?0.356<0.0010.299<0.0010.335<0.001
17. Have you noticed any forest degradation in pine forests in Cyprus (e.g., reduced forest density, forest related diseases or pests)?0.356<0.001−0.0020.9730.2370.001
Publisher’s Note: MDPI stays neutral with regard to jurisdictional claims in published maps and institutional affiliations.

