Abstract
Forest productivity (increment of above-ground biomass) is determined by biodiversity but also by stand structure attributes. However, the relative strengths of these drivers in determining productivity remain controversial in subtropical forests. In this study, we analyzed a tree growth data from 500 plots with in a 20 ha mature subtropical forest in eastern China. We used spatial simultaneous autoregressive error models to examine the effects of diversity variables (species richness, evenness, and composition), stand structural attributes (stand density, tree size range and diversity), environmental factors (topography and soil), and initial above-ground biomass (AGB) on productivity. We also applied structural equation models to quantify the relative importance of diversity, stand structure, environmental factors, and initial AGB in determining forest productivity. Our results showed that stand structure together with diversity and initial AGB governed forest productivity. Tree size diversity (DBH Shannon’s diversity index) had the largest positive effect on forest productivity. These results provide new evidence that structural explanatory variables have greater contributions to productivity for mature subtropical forests, strongly supporting the niche complementarity hypothesis. Our work highlights the importance of tree size diversity in promoting high forest productivity, and suggests that regulating and conserving complexity of forest stand structure should be among the most important goals in subtropical forest management.
1. Introduction
The relationship between biodiversity and productivity is a central topic in both theoretical and applied ecology [1]. Classic examples of this research area were originally carried out in grassland ecosystems and commonly assumed that species diversity promoted ecosystem productivity [2,3]. However, increasing evidence suggests that the positive effect of species diversity can be influenced or neutralized by structural diversity, particularly in forest ecosystem which has complex vertical and horizontal structures [4,5,6]. It remains far from clear what the major drivers of forest ecosystem productivity are.
Two fundamental mechanisms wildly used to explain the positive effects of species diversity on forest productivity are the niche complementarity and the selection effect hypothesis [3,7,8,9]. The niche complementarity hypothesis postulates that species having different niches are able to utilize different resources or facilitate each other, and hence increase the productivity of a community [3,10,11]. The selection effect hypothesis states that increased productivity is due to the chance occurrence of a very productive species in the community [12]. On one hand, increasing diversity may lead to niche overlap (species that make use of the same resources), thus intensifying inter-species competition [13]; on the other hand, ontogenetic niche differences (resource requirements vary with individual size) of intraspecies are ignored [6]. This may explain why the relationship between species diversity and productivity/above-ground biomass sometimes does not support the niche complementarity hypothesis in high diversity natural forest ecosystems, where negative [4,14], or non-significant relationships are found [15,16].
Structural diversity is a key attribute of forests and it has long been recognized that complex and structurally diverse forests are critically important for providing higher productivity than simple structure stands [17]. However, the hypothesized relationships between stand structural attributes and productivity have only recently been recognized in natural forests, agroforests, and experimental plantation [5]. Structural attributes reflect the variation of individual size composition in the study area, which can be caused by both the inherent interspecific differences and the asymmetrical competition of intra- and interspecific individuals [18,19,20]. At the community level, complex stand structure results in trees of different diameters or heights occupying different niches [21], which increases the efficiency of resources utilization (such as light, water, and soil nutrients). This, in turn, improves community productivity, similar to the niche complementarity effect caused by species and functional diversity [6,22]. Many studies have concluded that structural diversity plays a more important role in determining productivity than species diversity [6,23,24].
Many confounding effects should be considered in analyzing the relative contribution of species diversity (including phylogenetic and functional) versus structural diversity on forest productivity [5]. For instance, vegetation quantity (e.g., initial biomass) is a major driver of community functional properties (e.g., productivity) [25]. A positive relationship between forest productivity and initial biomass has been found for mature forest ecosystems [13], and initial biomass was the only factor contributing significantly to productivity in a secondary tropical forest study in Mexico [25]. Moreover, mixed relationships between environmental factors, species diversity, and stand structural indices have been reported in different forest ecosystems. It was reported that forests with low soil fertility showed stronger species diversity effects than forests with high soil fertility [26,27].
Here, our objective was to disentangle the contributions of species and structural diversity on the productivity of a mature subtropical evergreen broadleaved forest (EBLF) ecosystem in eastern China. Note that while the term productivity may be used to refer different quantities in the literature, in this study we refer it specifically to the increment in above-ground biomass of surviving trees. We selected different species and structural attributes other than single indices to avoid underrepresentation, while simultaneously controlling for confounding factors such as initial above-ground biomass (AGB) and environmental factors (including soil nutrients, topography, etc.). We collected data in a large EBLF dynamic plot and applied structural equation models (SEMs) to test two hypotheses: (1) that structural variables are more predictive of forest productivity than species diversity and composition, and (2) that tree size diversity is the strongest structural explanatory variable, which promotes forest productivity.
2. Materials and Methods
2.1. Study Area
This study was conducted in the Tiantong National Forest Park (29°48′ N, 121°47′ E), Zhejiang Province, in eastern China (Figure 1A). This region supports EBLF, in which forests are dominated by species in the Fagaceae and Theaceae families. The annual mean temperature is nearly 16.2 °C, the warmest and coldest months are July and January with a mean temperature 28.1 °C and 4.2 °C, respectively. The average annual precipitation is 1374.7 mm, which mainly occurs from May to August [28]. The parent soil materials are Mesozoic sediments and acidic intrusive rocks, including quartzite and granite. The soil texture is mainly sandy to silty clay loam, and soil pH ranges from 4.4 to 5.1 [29].
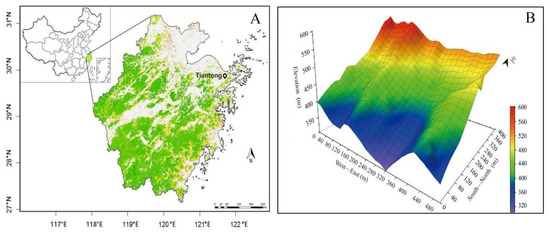
Figure 1.
The study area location in Zhejiang Province, China (A) and the perspective map of topography of the 20-ha Tiantong forest dynamics plot (B).
2.2. Data Collection
All forest stand and environmental data came from a 20 ha (500 m × 400 m) permanent forest plot that was established within Tiantong National Forest Park in 2010 (Figure 1B). Following the field protocol of the Forest Global Earth Observatory (Forest GEO) [30], the plot was divided into 500 quadrats (20 m × 20 m). Altimetric points of the corners of 20 m × 20 m grids were measured using an Electronic Total Station (Sokkia SET-4120). Soil samples were collected following John et al. [31] and then measured in the laboratory following [32]. Totally, 1292 soil samples covering the whole 20-ha plot at high resolution were collected by both regular and random sampling schemes (Figure S1). All free-standing trees and shrubs with diameters at breast height (DBH) ≥ 1 cm were tagged, mapped, measured, and identified to species, but only individuals with a DBH ≥ 5 cm were used in this study. The first census and re-census of the plot were carried out in 2010 and 2015, and recorded 28,167 and 29,103 individuals (DBH ≥ 5 cm), respectively.
2.3. Above-Ground Biomass and Productivity Calculation
The AGB of each individual was estimated from DBH using species-specific available allometric equations in local and regional forests (covering ~84.3% and ~84.6% of the whole plot AGB in 2010 and 2015, respectively), and a local generic allometric equation for the remaining species (Table S1). The total AGB for each quadrat at each time point was calculated by summing AGB of alive trees in the quadrat. AGB productivity (ΔAGB) of each quadrat was then determined as AGB increments from 2010 to 2015. The AGB in 2010 also served as an independent factor, initial AGB (AGBi), to explain the effect on productivity.
2.4. Species and Structural Variables
Species diversity was quantified in terms of richness, evenness, and composition. Species richness and evenness were calculated using the “vegan” package in R [33], and were defined as the number of observed species and Pielou’s evenness within each quadrat, respectively. Species composition was obtained by non-metric multidimensional scaling analysis (NMDS) [34]. The first axis of NMDS (NMDS1) was used to maximize the logarithmic transformation correlation with productivity. NMDS was done using “metaMDS” and “MDSRotate” functions [33] (Figure S3).
Structural variables used in this study included stand density, number of DBH classes (DBHcs), and DBH Shannon’s diversity index (DBHsi) of each quadrat. Stand density was the number of individual trees in a quadrat, representing the intensity of plant-plant interactions [4]. DBHcs quantified structural complexity, which was the number of the DBH classes in a given quadrat, and has a good correlation with tree height and canopy size [35]. In this study, DBH was divided into 17 grades: [5, 10), [10, 15), [15, 20) …… [85, ∞). Lastly, DBHsi was tree size diversity, calculated as the Shannon-Wiener biodiversity index (Equation (1)), which is commonly used in structural diversity-productivity studies [4]. The calculations of DBHsi were performed using the R package ‘vegan’.
where Pi is the proportion of the basal area of ith DBH class while d is the number of DBH classes within each quadrat.
2.5. Environmental Variables
In this study, the environmental factors of the 20 ha plot were defined in terms of three topographic and four soil properties. Topographic variables included elevation, slope, and aspect. Elevation was the average value of the four corner elevations of a 20 m × 20 m quadrat [36], ranging from 304.2 m to 602.8 m. Slope was defined as the average slope of the entire quadrat [36,37], ranging from 13.8° to 50.3°. Aspect referred to the direction in which slope faced [32]. Soil variables included soil total nitrogen (TN), total phosphorus (TP), pH, and soil depth, which were quantified by 1292 soil samples covering the entire 20 ha plot. Soil depth was measured by a long steel drill pipe at each sampling point. TN, TP, and pH were analyzed by an elemental analyzer (vario MICRO cube, Elementar, Germany), flow-injection autoanalyser (SAN++, Skalar, Netherlands), and Metterler Toledo pH meter (1:2, H2O), respectively (detail information can be found in [28]). For each soil variable, standard block kriging was used to obtain final depths for each 20 m × 20 m quadrat [32]. Principal component analyses (PCA) were used to reduce the number of environmental factors and to avoid strong correlations. Two PCs of soil properties (soil PC1, soil PC2) and two PCs of topographical variables (topography PC1 and topography PC2) were used to represent the two kinds of environmental variables, respectively (see Figures S4 and S5).
Summary of the productivity, AGBi, species diversity, species composition, structural factors, and environmental factors used in this study is provided in Table S3.
2.6. Statistical Analyses
Prior to all analyses, productivity was natural-log transformed and all explanatory variables were standardized to obtain a mean of 0 and a standard deviation of 1 to improve the interpretability of regression coefficients [38]. Pearson’s correlation analysis was used to examine correlations among all the individual predictor variables (Table S2).
Our study design may have confounded statistical results when there was spatial autocorrelation in the variables of interest. To account for this, we performed generalized least-squares (GLS) models [39] with (accounting for the spatial location of each quadrat) and without spatial autocorrelation among quadrats for each of the relationships between predictors and productivity, as recommended by previous studies [13,40]. GLS models are reliable methods for testing whether quadrats sharing similar abiotic conditions are independent of each other within a forest [41]. The goodness of fit of spatial and non-spatial GLS models were evaluated by AIC. Our results showed that models with spatial autocorrelation structures always had lower AIC values (Table S4).
We used spatial simultaneous autoregressive error models (SARs) to examine the effects of predictor variables on productivity. SARs allowed the inclusion of residual spatial autocorrelation in data, and are widely used in spatial ecology studies [42]. In order to remove multicollinear variables, we used variance inflation factors (VIF < 10; [43]) to identify any multicollinear variables in the SARs. VIFs were calculated using the R package ‘CAR’ [44]. Consequently, the full model included species richness, NMDS1, stand density, DBHsi, topography PC1, soil PC1, and AGBi (Table 1). The best model was selected using corrected AIC (AICc) by considering the lowest AICc and number of predictors [45] (Table S5), as implemented in the R package ‘MuMIn’ [46].

Table 1.
Optimal spatial simultaneous autoregressive error model of species diversity, species composition, stand structural attributes, initial above-ground biomass, and environmental factors on forest productivity.
Finally, structural equation models (SEMs) were used to examine both direct and indirect effects of all predictor factors on forest productivity. Using the standardization coefficient of each path in the model, the relative effect of different factors on productivity was quantitatively expressed, so as to compare the relative importance of different factors on productivity. Comparative fit index (CFI), Tucker Lewis index (TLI), root mean square error of approximation (RMSEA), and standardized root mean square residual (SRMR) were considered in SEM selection. SEMs were created using the R package “lavaan” [47]. All statistical analysis was implemented in R version 3.4.1 (R development core team, 2016).
3. Results
3.1. Correlations between Forest Productivity and Individual Predictor Variables
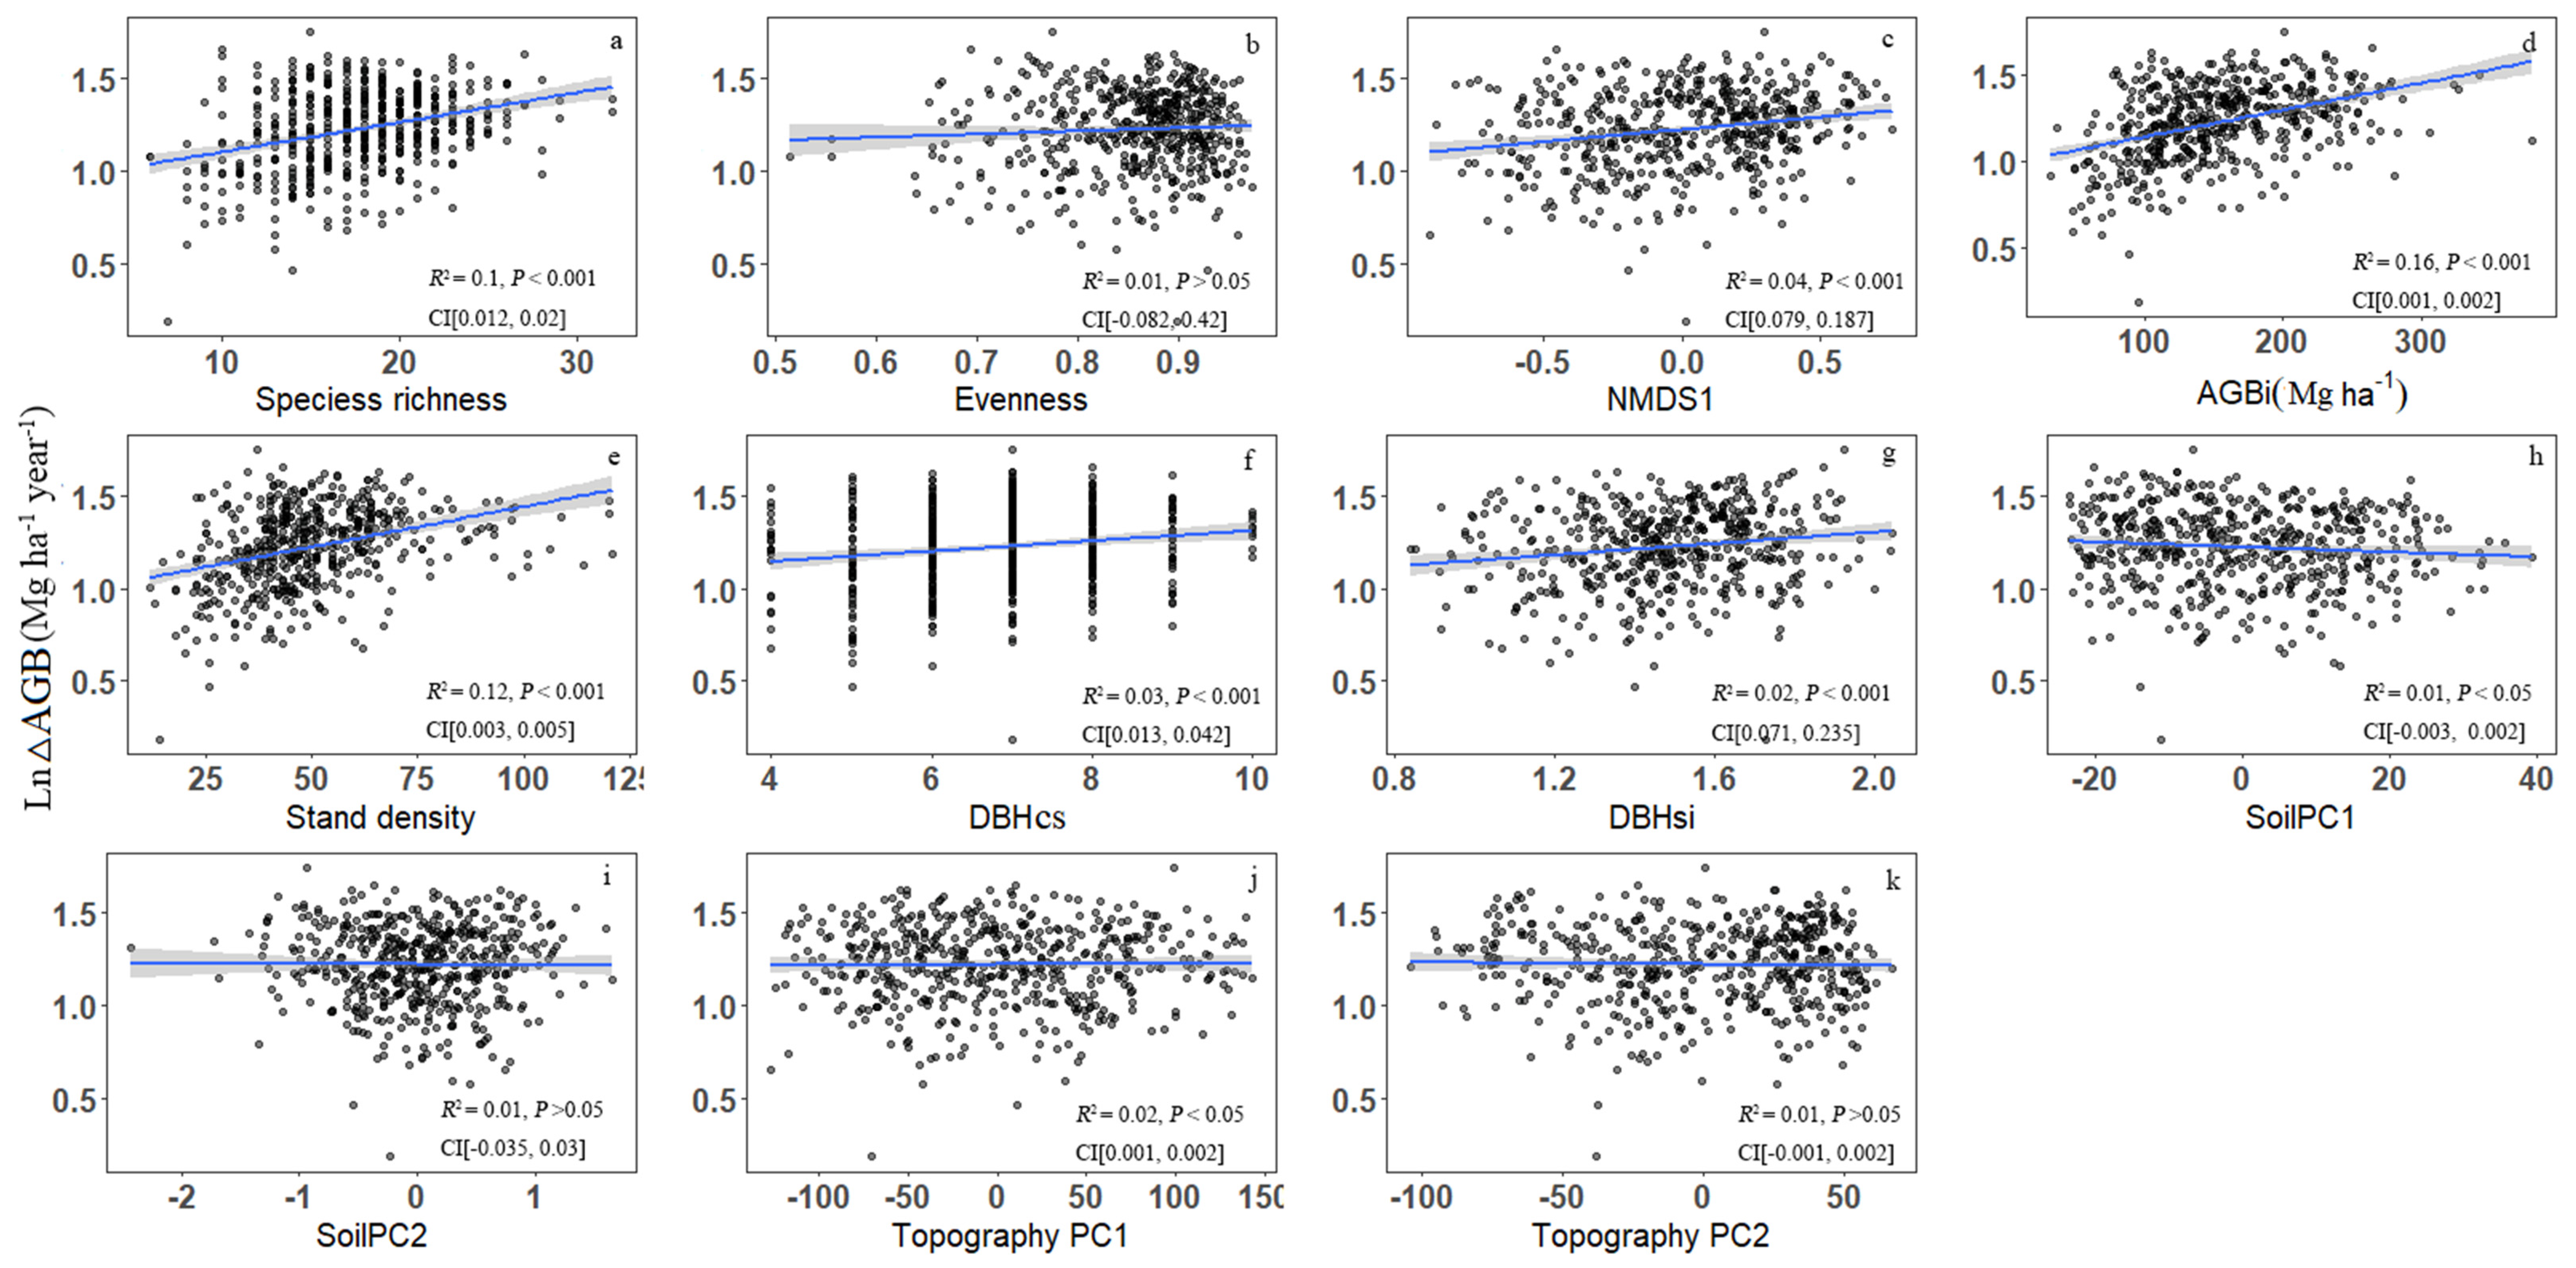
Based on linear regression tests, bivariate relationships indicated that forest productivity was positively associated with 7 of 11 predictor variables and negatively associated with 1 of 11 predictor variables (Figure 2). AGBi (R2 = 0.16, p < 0.001; Figure 2d) explained the most variation in forest productivity, followed by stand density (R2 = 0.12, p < 0.001; Figure 2e) and species richness (R2 = 0.1, p < 0.001; Figure 2a). All three structural diversity variables showed a significant positive impact on forest productivity (Figure 2e–g). Of the diversity metrics, species richness explained more variation in forest productivity than NMDS1 (R2 = 0.04, p < 0.001; Figure 2c), and of the environmental factors, topography PC1 (R2 = 0.02, p < 0.05; Figure 2j) explained more variance thank soil PC1 (R2 = 0.01, p < 0.05; Figure 2h). Other three predictor variables including evenness, soilPC2 and topography PC2 (p > 0.05; Figure 2b,i,k) do not show significant correlation with productivity.
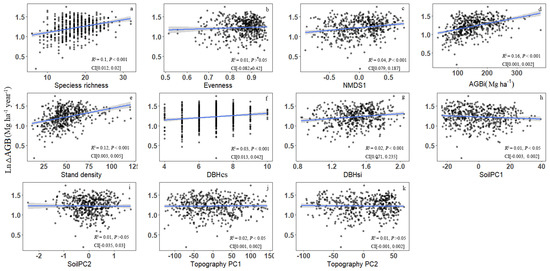
Figure 2.
Bivariate relationships between forest productivity (ln-transformed ΔAGB) and species diversity [(a) species richness, (b) evenness], species composition [(c) NMDS1], initial above-ground biomass [(d) AGBi], structural factors [(e) stand density, (f) DBH classes (DBHcs), and (g) tree size diversity (DBHsi)], environmental factors [(h) soil PC1, (i) soil PC2, (j) topography PC1, and (k) topography PC2] in Tiantong plot (CI, 95% confidence interval for the regression coefficients).
3.2. Relative Importance of Individual Predictor Variables on Forest Productivity
In the optimal spatial SARs model, only DBHsi, stand density, AGBi, species richness, and NMDS1 had significant positive effects on productivity (Table 1), while topography PC1 and soil PC1 had non-significant effects on productivity; other factors were not in the optimal model.
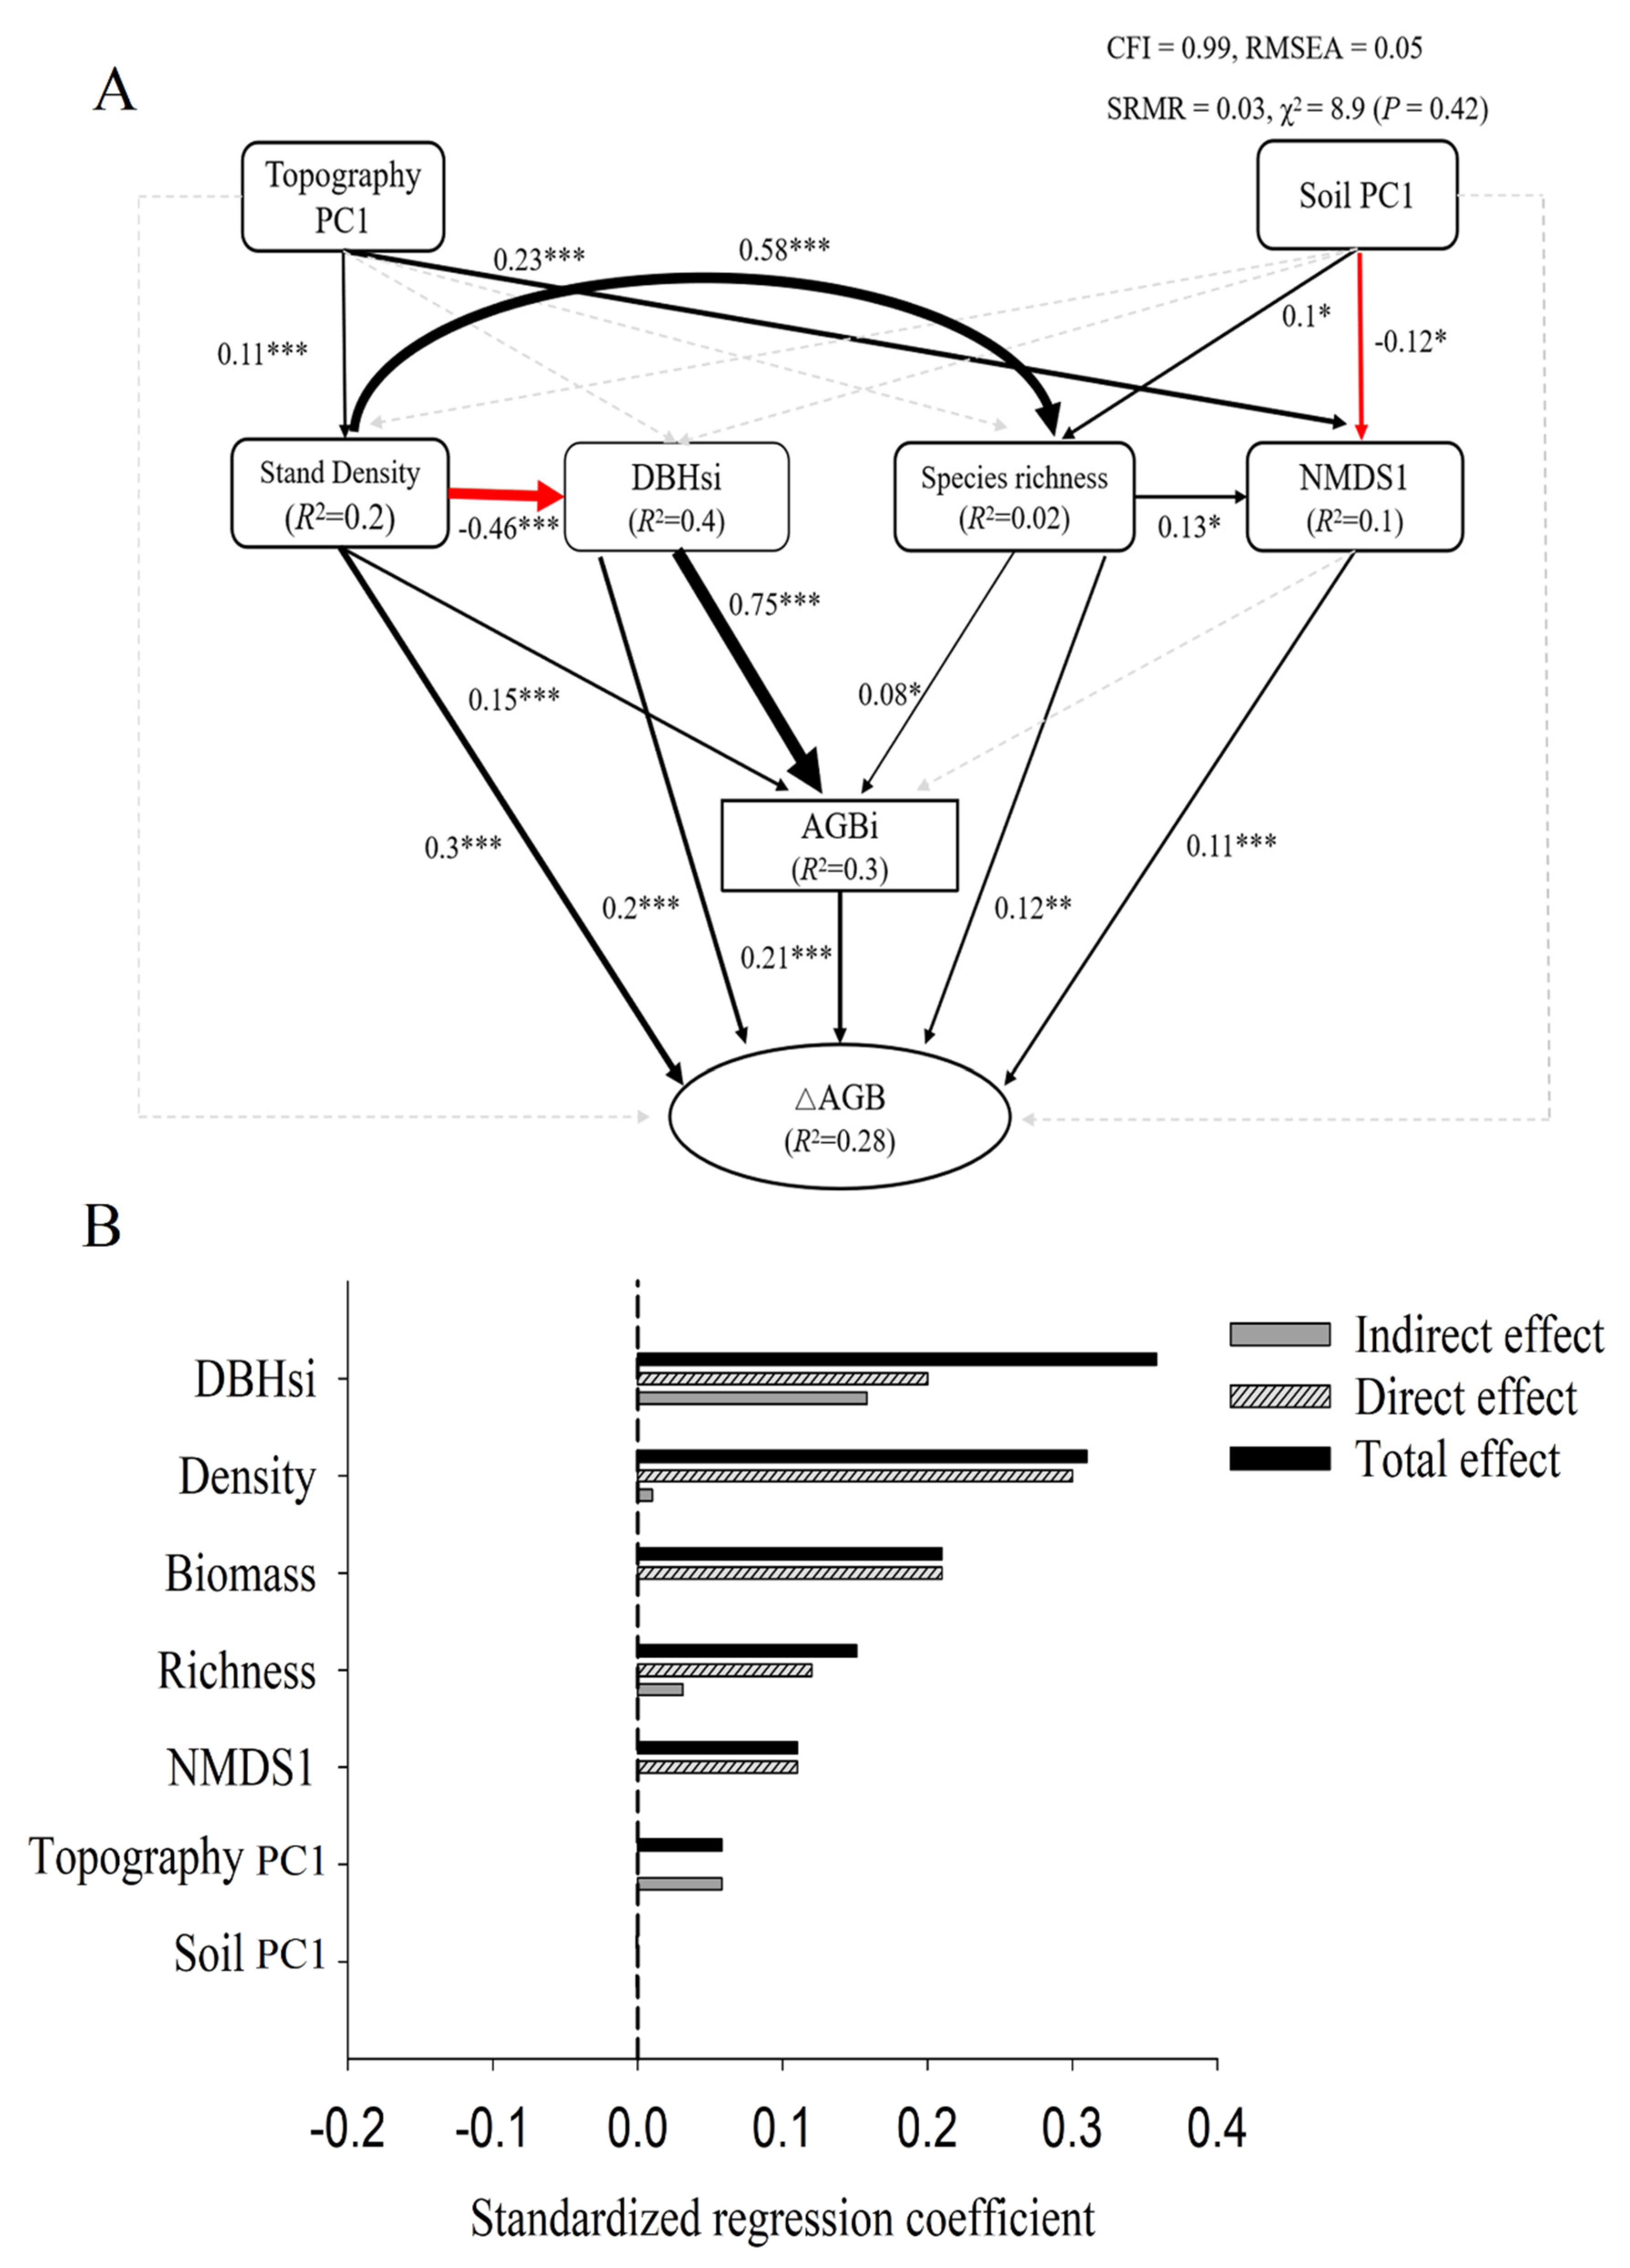
SEMs showed that all predictor variables together accounted for 28% of the variation in forest productivity (Figure 3A). DBHsi, stand density, AGBi, species richness, and NMDS1 all had significant positive effects on productivity (Figure 3A,B). Species richness had an indirect positive effect on productivity through NMDS1 (β = 0.014, p < 0.001) and AGBi (β = 0.016, p < 0.001). Stand density had an indirect positive effect on productivity through AGBi (β = 0.03, p < 0.001) and species richness (β = 0.07, p < 0.001), and indirect negative effects through tree size diversity (β = −0.09, p < 0.001). DBHsi had an indirect positive impact on productivity through AGBi (β = 0.16, p < 0.001). Topography PC1 had an indirect positive effect on productivity through stand density (β = 0.03, p < 0.001) and NMDS1 (β = 0.025, p < 0.001). Soil PC1 had an indirect positive effect on productivity through species richness (β = 0.012, p < 0.001), and indirect negative effects via NMDS1 (β = −0.013, p < 0.001).
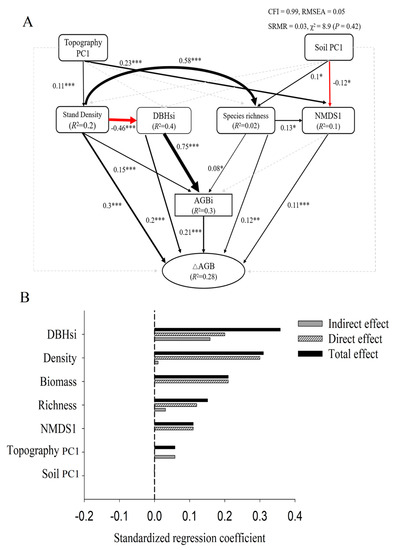
Figure 3.
The structural equation model of species diversity, species composition, structural diversity, above-ground biomass, and environmental factors and ΔAGB, as well as the effects of standardization (A); black and red solid lines represent positive and negative effects, respectively. Widths of solid lines indicate path strengths; dotted lines indicate non-significant correlations. Numbers and associated asterisks are standardized path coefficients and significance levels (* p < 0.05; ** p < 0.01; *** p < 0.001) for each path. (B) Standardized effects of each factor; black hatched bars show the direct effects, gray bars show indirect effects, and black bars show total effects.
Standardized total effects of each predictor variable on productivity showed that DBHsi (value of effects) had the largest effect on productivity, followed by stand density, initial biomass, species richness, NMDS1, and topography PC1.
4. Discussion
Assessing the drivers of forest productivity is vital for guiding forest management [4,5]. We found that species richness and composition had significant positive effects on forest productivity, regardless of the effects of structural attributes, initial biomass, and environmental variables. Structural attributes, including tree size diversity and stand density, were more important modulators of forest productivity than species diversity.
Our results are consistent with findings that species richness enhances forest productivity [40,48,49]. On one hand, our results support the niche complementarity effect because higher niche differentiation promotes higher resource capture, leading to more efficient resource use and higher productivity [13,50,51]; on the other hand, higher species richness also increases the chance of selection effects [52,53]. The direct significant positive effect of species composition on productivity indicated that the productivity increase in our study was related to selection effects. Dominant tree species constitute a central part of the community and are responsible for most of the energy and resource fluxes of the ecosystem [35]; thus they contribute more to productivity increases [24]. Similar studies in other subtropical forests have reported that dominant tree species predict local scale variation in forest above-ground carbon stocks and community productivity [54,55]. Species richness also had an indirect positive effect on productivity through species composition in our analysis. Our results indicate that productivity was simultaneously affected by niche complementarity and selection effects.
More importantly, as we hypothesized, structural variables had larger effects on forest productivity than other factors in our study, supporting the niche complementarity hypothesis [4,5,6]. Consistent with previous studies, stand density had a significant impact on forest productivity, indicating that there was a strong interaction between individuals [56,57]. From low to high stand densities, it is widely accepted that the interactions among trees will be more intensive, and trees will occupy more space and utilize more resources [20], possibly leading to an increase in complementarity [58,59].
In our study, tree size diversity was more predictive than stand density of forest productivity. We found that the total effect of tree size diversity on productivity was the largest among all explanatory variables. Theoretically, tree size diversity directly reflects the change of individual size in the horizontal structure and indirectly reflects the change of vertical structure (i.e., tree height) [6,22]. Within forests, complex tree size structures have been associated with increased light capture and use efficiencies [21,60]. Tree species with high size variation or variable tree sizes in forest communities are likely to have their own set of habitat requirements for water and soil nutrients [61]. Therefore, a multilayered forest structure allows for more efficient utilization of resources in species diverse forests, leading to enhanced productivity via niche differentiation [53]. Other studies have suggested that the impact of tree size diversity on productivity is mainly due to higher species diversity [6,62]. In stands with high species diversity, the canopy of different tree species occupies different niches, thus forming a dense and vertically stratified canopy with high tree size diversity [63,64]. However, our SEM results showed that there was no correlation between species diversity index and tree size diversity. Therefore, our results support that tree size diversity has an independent effect on forest productivity.
A similar study of the same subtropical forest showed that stand density was the most important modulator of productivity, but also that forest age plays an important role [4,23,65]. Our study included the number of DBH classes (DBHcs) as a structural variable, which served as a proxy for forest age, but DBHcs was not a significant factor in our SARs (Table 1). In the large scale study of Ouyang et al. [23], most forests were still young (age <45 year) due to afforestation and natural forest restoration projects. The mature forest in our study (age >100 years) with long-term natural gap dynamics promotes layer differentiation, while simple structures (e.g., planted forests) or young forests either do not, or the effects are well explained by species diversity [66]. The initial AGB was included in our analysis and showed a strong correlation with the number of DBH classes (AGBi in Table S2). Generally, AGB increases exponentially or as a power-function with tree diameter at tree scale [67,68], and therefore initial AGB can largely replace the effects of stand age. As demonstrated by previous studies [69,70], initial AGB had positive significant effects on forest productivity. Our results bolster our knowledge that structural explanatory variables are the greatest predictors of productivity in mature subtropical forests, regardless of initial biomass, which strongly supports the niche complementarity effect.
It is important to emphasize that all predictor variables together accounted only for 28% of the variation in forest productivity based on our SEMs analysis. This highlights the complex nature of the underlying determinants of forest productivity and further studies are needed to improve our understanding of this important problem. Indeed, low power of explanation of predictor variables on forest productivity is also found in similar studies e.g., [23,24,70]. The predictor variables only accounted for 27% of productivity variation (carbon gain of surviving trees) in a temperate mixed forest [70], 37% of productivity variation in a subtropical forest [24], and 37% of aboveground net primary productivity in a temperate deciduous forest [23]. One possible reason is that there are other important factors that are determining natural forest productivity [5]. In controlled experimental studies about the biodiversity-productivity relationship, the predictor variables can explain 40% to 60% of variation of productivity [48,71]. Moreover, low explanation may also be related to the complexity of the forest ecosystem itself. Forest ecosystem has complex vertical and horizontal structure, species diversity, environment factors, etc. Numerous factors may dilute the strength of the explanation on productivity. For instance, the same set of predictor variables can explain up to 69% of variation in productivity in the simple boreal forests, but only accounted for no more than 24% in temperate forest [57].
5. Conclusions
Our study provides evidence that structural explanatory variables predict productivity in mature subtropical forests. Furthermore, we show that tree size diversity plays a more important role than stand density and initial biomass on forest AGB productivity of surviving trees, and is independent of species richness and composition, supporting the niche complementarity hypothesis. In sum, our results suggest that regulating and conserving forest stand complexity should be among the most important goals to promote higher forest productivity in subtropical forest management.
Supplementary Materials
The following are available online at https://www.mdpi.com/article/10.3390/f12080998/s1, Table S1: Allometric equations for the calculation of tree species above-ground biomass. Table S2: Pearson correlation analysis of species diversity, structural diversity, aboveground biomass, and environmental factors. Table S3: Summary of variables used in analyses in Tiantong plot. Table S4: Summary of the generalized least-squares (GLS) models of productivity on predictors at Tiantong plot. Table S5: Model comparison results of multiple linear mixed models predicting the log response ratio of productivity (ΔAGB). Listed are the top 5 models. Standardized regression coefficients (Beta) for each predictor are given. Selected optimal models are highlighted in grey color. Figure S1: Soil sampling map in the 20-ha Tiantong forest dynamics plot. Figure S2: Non-metric multidimensional scaling ordination of Tiantong plot. NMDS output showing site scores (red dots) and species scores (blue text) of the ten most abundant species. Figure S3: Principal component analysis (PCA) of elevation, aspect, and slope. Figure S4: Principal component analysis (PCA) of total nitrogen (TN), total phosphorus (TP), pH value (pH), and soil depth (SD).
Author Contributions
S.R., X.W., and Q.Y. conceived and designed the study. H.L., S.Z., M.L., H.Y., and Z.Z. (Zhengkang Zhou) collected the data. S.R., Z.Z. (Zemei Zheng), G.S., and Q.Y. provided analysis tools and analyzed the data. Q.Y., S.R., and X.W. drafted and revised the article. All authors have read and agreed to the published version of the manuscript.
Funding
This study was financially supported by the National Natural Science Foundation of China (Grant No. 31901103, 31800351&31210103920), and by “Fundamental Research Funds for the Central Universities”.
Data Availability Statement
Data available for research upon request.
Acknowledgments
We thank Haibo Yang, Qingkai Lin, Xiyang Fei, Yi Zong, Binbin Li, Li Lin, Shu Dong, Mingjiao Yuan, Yuqin Su, and Xiaoying Sun for help with the field work.
Conflicts of Interest
The authors declare no conflict of interest.
References
- Naeem, S. Biodiversity, Ecosystem Functioning, and Human Wellbeing; Oxford University Press: Oxford, UK, 2009. [Google Scholar]
- Grace, J.B.; Anderson, T.M.; Seabloom, E.W.; Borer, E.T.; Adler, P.B.; Harpole, W.S.; Hautier, Y.; Hillebrand, H.; Lind, E.M.; Partel, M.; et al. Integrative modelling reveals mechanisms linking productivity and plant species richness. Nature 2016, 529, 390–393. [Google Scholar] [CrossRef] [PubMed]
- Tilman, D.; Reich, P.B.; Knops, J.M.H.; Wedin, D.A.; Mielke, T.; Lehman, C. Diversity and Productivity in a Long-Term Grassland Experiment. Science 2001, 294, 843–845. [Google Scholar] [CrossRef] [Green Version]
- Forrester, D.I.; Bauhus, J. A review of processes behind diversity—productivity relationships in forests. Curr. For. Rep. 2016, 2, 45–61. [Google Scholar] [CrossRef] [Green Version]
- Ali, A. Forest stand structure and functioning: Current knowledge and future challenges. Ecol. Indic. 2018, 98, 665–677. [Google Scholar] [CrossRef]
- Zhang, Y.; Chen, H.Y.H. Individual size inequality links forest diversity and above-ground biomass. J. Ecol. 2015, 103, 1245–1252. [Google Scholar] [CrossRef]
- Grime, J.P. Benefits of plant diversity to ecosystems: Immediate, filter and founder effects. J. Ecol. 1998, 86, 902–910. [Google Scholar] [CrossRef]
- Naeem, S.; Hahn, D.R.; Schuurman, G.W. Producer–decomposer co-dependency influences biodiversity effects. Nature 2000, 403, 762–764. [Google Scholar] [CrossRef]
- Huston, M.A. Hidden treatments in ecological experiments: Re-evaluating the ecosystem function of biodiversity. Oecologia 1997, 110, 449–460. [Google Scholar] [CrossRef]
- Tilman, D.; Knops, J.; Wedin, D.; Reich, P.; Ritchie, M.; Siemann, E. The influence of functional diversity and composition on ecosystem processes. Science 1997, 277, 1300–1302. [Google Scholar] [CrossRef] [Green Version]
- Díaz, S.; Lavorel, S.; de Bello, F.; Quétier, F.; Grigulis, K.; Robson, T.M. Incorporating plant functional diversity effects in ecosystem service assessments. Proc. Natl. Acad. Sci. USA 2007, 104, 20684–20689. [Google Scholar] [CrossRef] [Green Version]
- Loreau, M.; Hector, A. Partitioning selection and complementarity in biodiversity experiments. Nature 2001, 412, 72–76. [Google Scholar] [CrossRef] [PubMed]
- Chisholm, R.A.; Mullerlandau, H.C.; Rahman, K.A.; Bebber, D.P.; Bin, Y.; Bohlman, S.A.; Bourg, N.A.; Brinks, J.S.; Bunyavejchewin, S.; Butt, N. Scale-dependent relationships between tree species richness and ecosystem function in forests. J. Ecol. 2013, 101, 1214–1224. [Google Scholar] [CrossRef]
- Cavard, X.; Bergeron, Y.; Chen, H.Y.H.; Pare, D. Mixed-species effect on tree aboveground carbon pools in the east-central boreal forests. Can. J. For. Res. 2010, 40, 37–47. [Google Scholar] [CrossRef]
- Seidel, D.; Leuschner, C.; Scherber, C.; Beyer, F.; Wommelsdorf, T.; Cashman, M.J.; Fehrmann, L. The relationship between tree species richness, canopy space exploration and productivity in a temperate broad-leaf mixed forest. For. Ecol. Manag. 2013, 310, 366–374. [Google Scholar] [CrossRef]
- Vila, M.; Vayreda, J.; Gracia, C.; Ibanez, J.J. Does tree diversity increase wood production in pine forests. Oecologia 2003, 135, 299–303. [Google Scholar] [CrossRef]
- Buongiorno, J.; Dahir, S.E.; Lu, H.; Lin, C. Tree size diversity and economic returns in uneven-aged forest stands. For. Sci. 1994, 40, 83–103. [Google Scholar]
- Coomes, D.A.; Kunstler, G.; Canham, C.D.; Wright, E.F. A greater range of shade-tolerance niches in nutrient-rich forests: An explanation for positive richness–productivity relationships? J. Ecol. 2009, 97, 705–717. [Google Scholar] [CrossRef]
- Clark, J.S. Individuals and the variation needed forhigh species diversity in forest trees. Science 2010, 327, 1129–1132. [Google Scholar] [CrossRef] [Green Version]
- Morin, X. Species richness promotes canopy packing: A promising step towards a better understanding of the mechanisms driving the diversity effects on forest functioning. Funct. Ecol. 2015, 29, 993–994. [Google Scholar] [CrossRef] [Green Version]
- Dănescu, A.; Albrecht, A.; Bauhus, J. Structural diversity promotes productivity of mixed, uneven-aged forests in southwestern Germany. Oecologia 2016, 182, 319–333. [Google Scholar] [CrossRef]
- Yachi, S.; Loreau, M. Does complementary resource use enhance ecosystem functioning? A model of light competition in plant communities. Ecol. Lett. 2007, 10, 54–62. [Google Scholar] [CrossRef] [PubMed]
- Ouyang, S.; Xiang, W.; Wang, X.; Xiao, W.; Chen, L.; Li, S.; Sun, H.; Deng, X.; Forrester, D.I.; Zeng, L. Effects of stand age, richness and density on productivity in subtropical forests in China. J. Ecol. 2019, 107, 2266–2277. [Google Scholar] [CrossRef]
- Fotis, A.T.; Morin, T.H.; Fahey, R.T.; Hardiman, B.S.; Bohrer, G.; Curtis, P.S. Forest structure in space and time: Biotic and abiotic determinants of canopy complexity and their effects on net primary productivity. Agric. For. Meteorol. 2018, 250–251, 181–191. [Google Scholar] [CrossRef]
- Lohbeck, M.; Poorter, L.; Martinezramos, M.; Bongers, F. Biomass is the main driver of changes in ecosystem process rates during tropical forest succession. Ecology 2015, 96, 1242–1252. [Google Scholar] [CrossRef] [PubMed]
- Pretzsch, H.; Bielak, K.; Block, J.; Bruchwald, A.; Dieler, J.; Ehrhart, H.P.; Kohnle, U.; Nagel, J.; Spellmann, H.; Zasada, M.; et al. Productivity of mixed versus pure stands of oak (Quercus petraea (Matt.) Liebl. and Quercus robur L.) and European beech (Fagus sylvatica L.) along an ecological gradient. Eur. J. For. Res. 2013, 132, 263–280. [Google Scholar] [CrossRef]
- Toigo, M.; Vallet, P.; Perot, T.; Bontemps, J.; Piedallu, C.; Courbaud, B. Overyielding in mixed forests decreases with site productivity. J. Ecol. 2015, 103, 502–512. [Google Scholar] [CrossRef]
- Yang, Q.; Shen, G.; Liu, H.; Wang, Z.; Ma, Z.; Fang, X.; Zhang, J.; Wang, X. Detangling the effects of environmental filtering and dispersal limitation on aggregated distributions of tree and shrub species: Life stage matters. PLoS ONE 2016, 11, e0156326. [Google Scholar] [CrossRef]
- Wang, X.H.; Kent, M.; Fang, X.F. Evergreen broad-leaved forest in Eastern China: Its ecology and conservation and the importance of resprouting in forest restoration. For. Ecol. Manag. 2007, 245, 76–87. [Google Scholar] [CrossRef]
- Condit, R. Tropical Forest Census Plots Methods and Results from BARRO Colorado Island, Panama and a Comparison with Other Plots; Springer: Berlin/Heidelberg, Germany, 1998. [Google Scholar]
- John, R.; Dalling, J.W.; Harms, K.E.; Yavitt, J.B.; Stallard, R.F.; Mirabello, M.; Hubbell, S.P.; Valencia, R.; Navarrete, H.; Vallejo, M.; et al. Soil nutrients influence spatial distributions of tropical tree species. Proc. Natl. Acad. Sci. USA 2007, 104, 864–869. [Google Scholar] [CrossRef] [Green Version]
- Yang, Q.; Yang, H.; Fang, X.; Yan, E.; Wang, X.; Ma, Z.; Xie, Y.; Zhang, Z.; Wang, Z.; Liu, H.; et al. Community structure and species composition of an evergreen broad-leaved forest in Tiantong’s 20 ha dynamic plot, Zhejiang Province, eastern China. Biodiversity 2011, 19, 215–223. [Google Scholar]
- Oksanen, J.; Blanchet, F.G.; Kindt, R.; Legendre, P.; Wagner, H. Multivariate analysis of ecological communities in R: Vegan tutorial. R Package Version 2011, 1, 1–43. [Google Scholar]
- Fortin, M.J.; Dale, M.R.T. Spatial Analysis: A Guide for Ecologist; Cambridge University Press: Cambridge, UK, 2005. [Google Scholar]
- Fahey, R.T.; Fotis, A.T.; Woods, K.D. Quantifying canopy complexity and effects on productivity and resilience in late-successional hemlock–hardwood forests. Ecol. Appl. 2015, 25, 834–847. [Google Scholar] [CrossRef] [PubMed]
- Harms, K.E.; Condit, R.; Hubbell, S.P.; Foster, R.B. Habitat associations of trees and shrubs in a 50-ha Neotropical forest plot. J. Ecol. 2001, 89, 947–959. [Google Scholar] [CrossRef]
- Lai, J.; Mi, X.; Ren, H.; Ma, K. Species-habitat associations change in a subtropical forest of China. J. Veg. Sci. 2009, 20, 415–423. [Google Scholar] [CrossRef]
- Schielzeth, H. Simple means to improve the interpretability of regression coefficients. Methods Ecol. Evol. 2010, 1, 103–113. [Google Scholar] [CrossRef]
- Pinheiro, J.; Bates, D.; DebRoy, S.; Sarkar, D. nlme:Linear and nonlinear mixed effects models. R Package Version 2014, 3, 1–117. [Google Scholar]
- Yuan, Z.; Wang, S.; Ali, A.; Gazol, A.; Ruiz-Benito, P.; Wang, X.; Lin, F.; Ye, J.; Hao, Z.; Loreau, M. Aboveground carbon storage is driven by functional trait composition and stand structural attributes rather than biodiversity in temperate mixed forests recovering from disturbances. Ann. For. Sci. 2018, 75, 67. [Google Scholar] [CrossRef] [Green Version]
- Zuur, A.F.; Ieno, E.N.; Walker, N.J.; Saveliev, A.; Smith, G.M. Mixed Effects Models and Extensions in Ecology with R; Springer: New York, NY, USA, 2010; pp. 464–465. [Google Scholar]
- Kissling, W.D.; Carl, G. Spatial autocorrelation and the selection of simultaneous autoregressive models. Glob. Ecol. Biogeogr. 2008, 17, 59–71. [Google Scholar] [CrossRef]
- Graham, M. Confronting multicollinearity in ecological multiple regression. Ecology 2003, 84, 2809–2815. [Google Scholar] [CrossRef] [Green Version]
- Fox, J.; Weisberg, S.; Adler, D.; Bates, D.; Baudbovy, G.; Ellison, S.; Firth, D.; Friendly, M.; Gorjanc, G.; Graves, S.; et al. Package ‘car’ 2.0-25: Companion to Applied Regression. October 2015. Available online: http://cran.r-project.org/web/packages/car/index.html (accessed on 27 July 2021).
- Burnham, K.; Anderson, D.; Burnham, P.; Anderson, R. Model Selection and Multimodel Inference: A Practical Information-Theoretical Approach; Springer: Berlin/Heidelberg, Germany, 2010. [Google Scholar]
- Bartoń, K. Multi-model inference. Sociol. Methods Res. 2016, 33, 261–304. [Google Scholar]
- Fox, J. Teacher’s corner: Structural equation modeling with the sem package in R. Struct. Equ. Model. A Multidiscip. J. 2006, 13, 465–486. [Google Scholar] [CrossRef] [Green Version]
- Liang, J.; Crowther, T.W.; Picard, N.; Wiser, S.; Zhou, M.; Alberti, G.; Schulze, E.D.; McGuire, A.D.; Bozzato, F.; Pretzsch, H.; et al. Positive biodiversity-productivity relationship predominant in global forests. Science 2016, 354, 6309. [Google Scholar] [CrossRef] [Green Version]
- Liu, X.; Trogisch, S.; He, J.-S.; Niklaus, P.A.; Bruelheide, H.; Tang, Z.; Erfmeier, A.; Scherer-Lorenzen, M.; Pietsch, K.A.; Yang, B. Tree species richness increases ecosystem carbon storage in subtropical forests. Proc. R. Soc. B Biol. Sci. 2018, 285, 20181240. [Google Scholar] [CrossRef] [Green Version]
- Gamfeldt, L.; Snall, T.; Bagchi, R.; Jonsson, M.; Gustafsson, L.; Kjellander, P.; Ruizjaen, M.C.; Froberg, M.; Stendahl, J.; Philipson, C.D. Higher levels of multiple ecosystem services are found in forests with more tree species. Nat. Commun. 2013, 4, 1340. [Google Scholar] [CrossRef] [PubMed]
- Zhang, Y.; Chen, H.Y.H.; Reich, P.B. Forest productivity increases with evenness, species richness and trait variation: A global meta-analysis. J. Ecol. 2012, 100, 742–749. [Google Scholar] [CrossRef]
- Fotis, A.T.; Murphy, S.J.; Ricart, R.D.; Krishnadas, M.; Whitacre, J.; Wenzel, J.W.; Queenborough, S.A.; Comita, L.S.; Hector, A. Above-ground biomass is driven by mass-ratio effects and stand structural attributes in a temperate deciduous forest. J. Ecol. 2018, 106, 561–570. [Google Scholar] [CrossRef]
- Poorter, L.; Der Sande, M.T.V.; Thompson, J.; Arets, E.J.M.M.; Alarcon, A.; Alvarezsanchez, J.; Ascarrunz, N.; Balvanera, P.; Barajasguzman, G.; Boit, A. Diversity enhances carbon storage in tropical forests. Glob. Ecol. Biogeogr. 2015, 24, 1314–1328. [Google Scholar] [CrossRef]
- Song, K.; Yu, Q.; Shang, K.; Yang, T.; Da, L. The spatio-temporal pattern of historical disturbances of an evergreen broadleaved forest in East China: A dendroecological analysis. Plant Ecol. 2011, 212, 1313–1325. [Google Scholar] [CrossRef]
- Lin, D.; Andersonteixeira, K.J.; Lai, J.; Mi, X.; Ren, H.; Ma, K. Traits of dominant tree species predict local scale variation in forest aboveground and topsoil carbon stocks. Plant Soil 2016, 409, 435–446. [Google Scholar] [CrossRef]
- Forrester, J.A.; Mladenoff, D.J.; Gower, S.T. Experimental manipulation of forest structure: Near-term effects on gap and stand scale C dynamics. Ecosystems 2013, 16, 1455–1472. [Google Scholar] [CrossRef]
- Paquette, A.; Messier, C. The effect of biodiversity on tree productivity: From temperate to boreal forests. Glob. Ecol. Biogeogr. 2011, 20, 170–180. [Google Scholar] [CrossRef] [Green Version]
- Boyden, S.; Binkley, D.; Senock, R. Competition and facilitation between Eucalyptus and nitrogen-fixing Falcataria in relation to soil fertility. Ecology 2005, 86, 992–1001. [Google Scholar] [CrossRef]
- Forrester, D.I.; Kohnle, U.; Albrecht, A.T.; Bauhus, J. Complementarity in mixed-species stands of Abies alba and Picea abies varies with climate, site quality and stand density. For. Ecol. Manag. 2013, 304, 233–242. [Google Scholar] [CrossRef]
- Ali, A.; Yan, E.-R. The mediation roles of intraspecific and interspecific functional trait diversity for linking the response of aboveground biomass to species richness across forest strata in a subtropical forest. Ecol. Indic. 2018, 85, 493–501. [Google Scholar] [CrossRef]
- Lei, X.; Wang, W.; Peng, C. Relationships between stand growth and structural diversity in spruce-dominated forests in New Brunswick, Canada. Can. J. For. Res. 2009, 39, 1835–1847. [Google Scholar] [CrossRef]
- Chiang, J.M.; Spasojevic, M.J.; Muller-Landau, H.C.; Sun, I.F.; Lin, Y.; Su, S.H.; Chen, Z.S.; Chen, C.T.; Swenson, N.G.; McEwan, R.W. Functional composition drives ecosystem function through multiple mechanisms in a broadleaved subtropical forest. Oecologia 2016, 182, 829–840. [Google Scholar] [CrossRef] [Green Version]
- Pretzsch, H.; Schutze, G. Effect of tree species mixing on the size structure, density, and yield of forest stands. Eur. J. For. Res. 2016, 135, 1–22. [Google Scholar] [CrossRef]
- Williams, L.; Paquette, A.; Cavenderbares, J.; Messier, C.; Reich, P.B. Spatial complementarity in tree crowns explains overyielding in species mixtures. Nat. Ecol. Evol. 2017, 1, 0063. [Google Scholar] [CrossRef]
- Ali, A.; Yan, E.-R. The forest strata-dependent relationship between biodiversity and aboveground biomass within a subtropical forest. For. Ecol. Manag. 2017, 401, 125–134. [Google Scholar] [CrossRef]
- Pedro, M.S.; Rammer, W.; Seidl, R. Disentangling the effects of compositional and structural diversity on forest productivity. J. Veg. Sci. 2017, 28, 649–658. [Google Scholar] [CrossRef]
- Chave, J.; Rejoumechain, M.; Burquez, A.; Chidumayo, E.N.; Colgan, M.S.; Delitti, W.B.C.; Duque, A.; Eid, T.; Fearnside, P.M.; Goodman, R.C. Improved allometric models to estimate the aboveground biomass of tropical trees. Glob. Chang. Biol. 2014, 20, 3177–3190. [Google Scholar] [CrossRef] [PubMed]
- Ali, A.; Xu, M.S.; Zhao, Y.T.; Zhang, Q.Q.; Zhou, L.L.; Yang, X.D.; Yan, E.R. Allometric biomass equations for shrub and small tree species in subtropical China. Silva Fenn. 2015, 49, 1–10. [Google Scholar] [CrossRef] [Green Version]
- Prado-Junior, J.A.; Schiavini, I.; Vale, V.S.; Arantes, C.S.; van der Sande, M.T.; Lohbeck, M.; Poorter, L. Conservative species drive biomass productivity in tropical dry forests. J. Ecol. 2016, 104, 817–827. [Google Scholar] [CrossRef] [Green Version]
- Cai, H.; Li, F.; Jin, G. Soil nutrients, forest structure and species traits drive aboveground carbon dynamics in an old-growth temperate forest. Sci. Total Environ. 2020, 705, 135874. [Google Scholar] [CrossRef] [PubMed]
- Huang, Y.; Chen, Y.; Castroizaguirre, N.; Baruffol, M.; Brezzi, M.; Lang, A.C.; Li, Y.; Hardtle, W.; Von Oheimb, G.; Yang, X.; et al. Impacts of species richness on productivity in a large-scale subtropical forest experiment. Science 2018, 362, 80–83. [Google Scholar] [CrossRef] [PubMed] [Green Version]

Publisher’s Note: MDPI stays neutral with regard to jurisdictional claims in published maps and institutional affiliations. |
© 2021 by the authors. Licensee MDPI, Basel, Switzerland. This article is an open access article distributed under the terms and conditions of the Creative Commons Attribution (CC BY) license (https://creativecommons.org/licenses/by/4.0/).