Effect of Feller-Buncher Model, Slope Class and Cutting Area on the Productivity and Costs of Whole Tree Harvesting in Brazilian Eucalyptus Stands

 and
and
Abstract
1. Introduction
2. Materials and Methods
2.1. Study Area
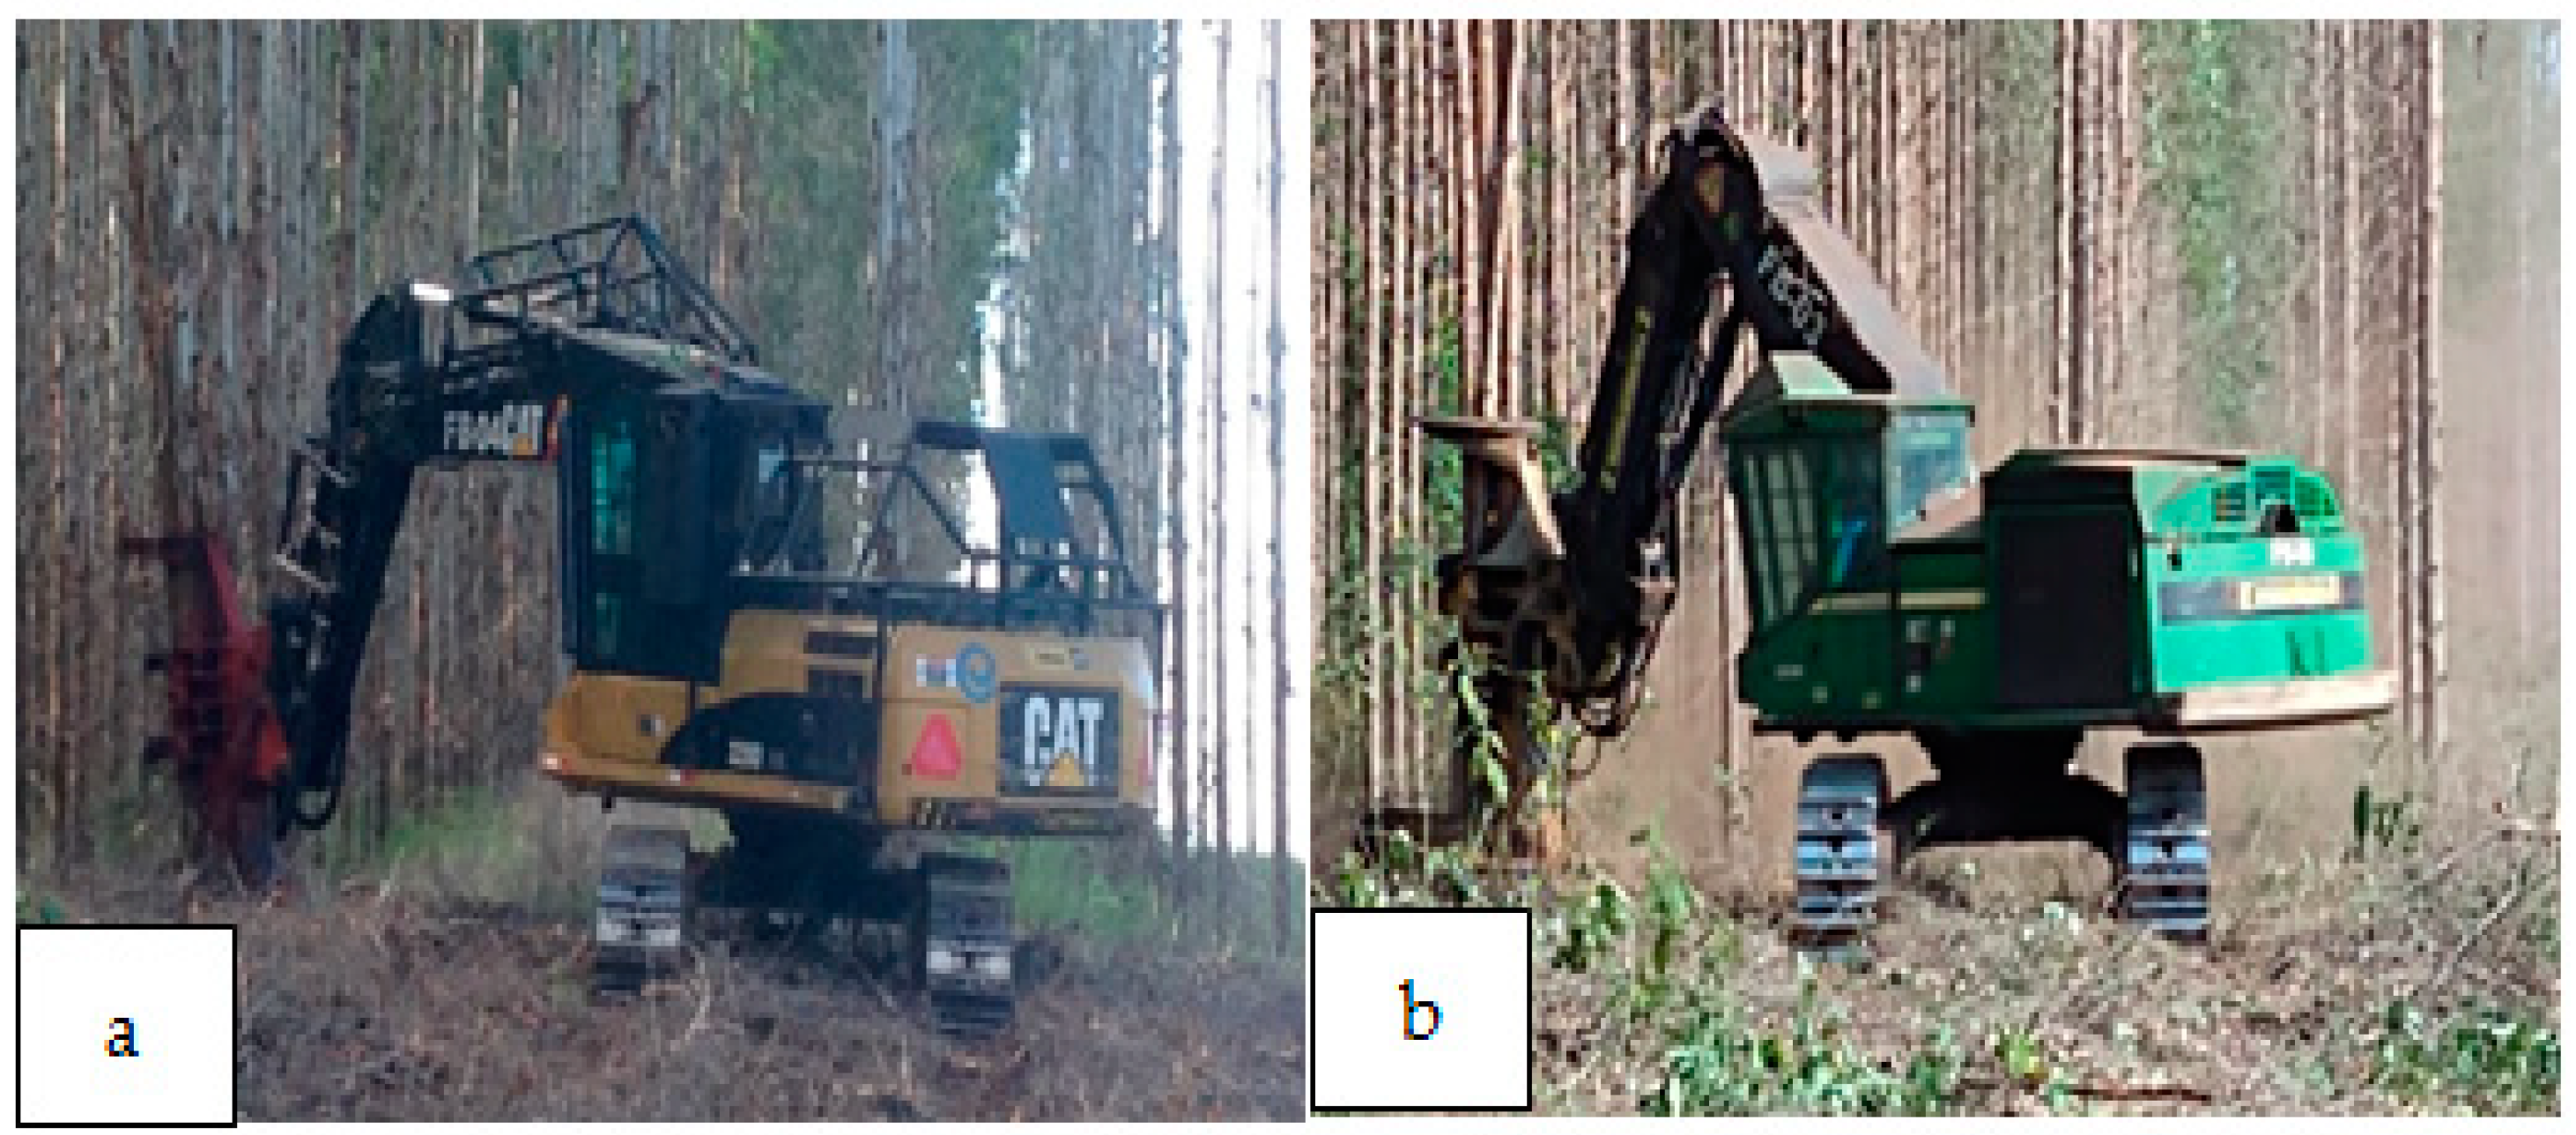
2.2. Data Collection
- is the sample size;
- is the abscissa of the standard normal distribution, with a level of confidence;
- is the standard deviation of the sample;
- is the allowable error.
- is the productivity (m3 h−1);
- is the volume of wood felled (m3);
- is the productive machine hour (h).
2.3. Economic Analysis
- is the third-party capital cost;
- is the income tax rate;
- is the present value of the debt holders’ wealth;
- is the present value of shareholders’ wealth;
- is the shareholders’ capital cost.
- is the expected return on the company’s common equity;
- is the risk-free rate of return—U. S. Treasury 10 Y bonds;
- is the beta coefficient, which represents the project-specific risk factor—Brazilian companies in the forest products sector;
- is the return rate of the market portfolio—S & P Global Timber & Forestry Index 10 year;
- is the market risk premium;
- is the Brazil risk premium—Emerging Markets Bond Index Plus.
- is the cost of the felling operation (USD m−3).
- is the machine cost per scheduled hour (USD h−1).
2.4. Statistical Design
- is the overall mean effect;
- is the effect of the th level of the factor A;
- is the effect of the th level of the factor B;
- is the effect of the th level of the factor C;
- is the effect of the interaction between and ;
- is the effect of the interaction between and ;
- is the effect of the interaction between and ;
- is the effect of the interaction between , and ;
- is a random error component.
3. Results
4. Discussion
5. Conclusions
Author Contributions
Funding
Conflicts of Interest
References
- Brazilian Tree Industry. Annual Report; Brazilian Tree Industry: Brasília, Brazil, 2020; pp. 1–66. [Google Scholar]
- Brazilian Institute of Geography and Statistics. Production of Plant Extraction and Forestry; Brazilian Institute of Geography and Statistics: Rio de Janeiro, Brazil, 2019; Volume 34, pp. 1–8. [Google Scholar]
- Ghaffariyan, M.R. General productivity predicting model for skidder working in Eucalypt plantations. Eur. J. For. Eng. 2020, 6, 8344. [Google Scholar] [CrossRef]
- Strandgard, M.; Mitchell, R.; Wiedemann, J. Comparison of productivity, cost and chip quality of four balanced harvest systems operating in Eucalyptus globulus plantation in Western Australia. Croat. J. For. Eng. J. Theory Appl. For. Eng. 2019, 40, 39–48. [Google Scholar]
- Gulci, N.; Yuksel, K.; Gulci, S.; Serin, H.; Bilici, E.; Akay, A.E. Analysis of a feller-buncher productivity: A case study of whole tree harvesting from Marmara region, Turkey. Ann. For. Res. 2021, 64, 99–110. [Google Scholar]
- Ackerman, P.; Martin, C.; Brewer, J.; Ackerman, S. Effect of slope on productivity and cost of Eucalyptus pulpwood harvesting using single-grip purpose-built and excavator-based harvesters. Int. J. For. Eng. 2018, 29, 74–82. [Google Scholar]
- Spinelli, R.; de Arruda Moura, A.C. Decreasing the fuel consumption and CO2 emissions of excavator-based harvesters with a machine control system. Forests 2019, 10, 43. [Google Scholar] [CrossRef]
- Holzleitner, F.; Stampfer, K.; Visser, R. Utilization rates and cost factors in timber harvesting based on long-term machine. Croat. J. For. Eng. 2011, 32, 501–508. [Google Scholar]
- Hiesl, P.; Benjamin, J.G. A multi-stem feller-buncher cycle-time model for partial harvest of small-diameter wood stands. Int. J. For. Eng. 2013, 24, 101–108. [Google Scholar] [CrossRef]
- Lindroos, O.; Cavalli, R. Cable yarding productivity models: A systematic review over the period 2000–2011. Int. J. For. Eng. 2016, 27, 79–94. [Google Scholar] [CrossRef]
- Di Fulvio, F.; Abbas, D.; Spinelli, R.; Acuna, M.; Ackerman, P.; Lindroos, O. Benchmarketing technical and cost factors in forest felling and processing operations in different global regions during the period 2013–2014. Int. J. For. Eng. 2017, 28, 94–105. [Google Scholar] [CrossRef]
- Bodaghi, A.I.; Nikooy, M.; Naghdi, R.; Venanzi, R.; Latterini, F.; Tavankar, F.; Picchio, R. Ground-based extraction on salvage logging in two high forests: A productivity and cost analysis. Forests 2018, 9, 1–18. [Google Scholar]
- MacDonald, A.J. Harvesting Systems and Equipment in British Columbia; British Columbia, Ministry of Forests, Forest Practices Branch: Victoria, BC, Canada, 1999; pp. 1–19. [Google Scholar]
- Silva, J.R.; Fenner, P.T.; Cataneo, A. Avaliação do desempenho operacional de trator florestal “Feller-Buncher”. Rev. Ciências Agroveterinárias 2007, 6, 29–34. [Google Scholar]
- Spinelli, R.; Cuchet, E.; Roux, P. A new feller-buncher for harvesting energy wood: Results from a European test programme. Biomass Bioenergy 2007, 31, 205–210. [Google Scholar] [CrossRef]
- Fernandes, H.C.; Lopes, S.E.; Teixeira, M.M.; Minette, L.J.; Rinaldi, P.C.N.; Bernardes, A.M. Avaliação das características técnica e econômica de um sistema de colheita florestal de árvores inteiras. Sci. For. 2009, 37, 225–232. [Google Scholar]
- Magagnotti, N.; Spinelli, R.; Güldner, O.; Erler, J. Site impact after motor-manual and mechanised thinning in Mediterranean pine plantations. Biosyst. Eng. 2012, 113, 140–147. [Google Scholar] [CrossRef]
- Lopes, S.E.; Fernandes, H.C.; Santos, N.R.; Rinaldi, P.C.N. Technical and economical evaluation of slacher, operating under differente productivities. Sci. For. 2008, 36, 215–222. [Google Scholar]
- Oliveira, D.D.; Lopes, E.D.S.; Fiedler, N.C. Technical and economical evaluation of the forwarder in the extraction of the pine logs. Sci. For. 2009, 37, 84–525. [Google Scholar]
- Visser, R.; Spinelli, R. Determining the shape of the productivity function for mechanized felling and felling-processing. J. For. Res. 2012, 17, 397–402. [Google Scholar] [CrossRef]
- Obi, O.F.; Visser, R. Influence of the operating environment on the technical efficiency of forest harvesting operations. Int. J. For. Eng. 2017, 28, 140–147. [Google Scholar] [CrossRef]
- Obi, O.F.; Visser, R. Including exogenous factors in the evaluation of harvesting crew technical efficiency using a multi-step data envelopment analysis procedure. Croat. J. For. Eng. 2018, 39, 153–162. [Google Scholar]
- Bilici, E.; Akay, A.E.; Abbas, D. Assessing the effects of site factors on the productivity of a feller buncher: A time and motion analysis. J. For. Res. 2019, 30, 1471–1478. [Google Scholar] [CrossRef]
- Blagojevic, B.; Jonsson, R.; Bjorheden, R.; Nordstrom, E.M.; Lindroos, O. Multi-criteria decision analysis (MCDA) in forest operations—An introductional review. Croat. J. For. Eng. 2019, 40, 191–205. [Google Scholar]
- Soman, H.; Kizha, A.R.; Roth, B.E. Impacts of silvicultural prescriptions and implementation of best management practices on timber harvesting costs. Int. J. For. Eng. 2019, 30, 14–25. [Google Scholar] [CrossRef]
- Melemez, K.; Tunay, M.; Emir, T. A comparison of productivity in five small-scale harvesting systems. Small-Scale For. 2014, 13, 35–45. [Google Scholar] [CrossRef]
- Schweier, J.; Spinelli, R.; Magagnotti, N.; Wolfslehner, B.; Lexer, M.J. Sustainability assessment of alternative thinning operations in mediterranean softwood plantations. Forests 2018, 9, 375. [Google Scholar] [CrossRef]
- Zhang, F.; Johnson, D.M.; Wang, J.; Yu, C. Cost, energy use and GHG emissions for forest biomass harvesting operations. Energy 2016, 114, 1053–1062. [Google Scholar] [CrossRef]
- Schweier, J.; Magagnotti, N.; Labelle, E.R.; Athanassiadis, D. Sustainability Impact Assessment of Forest Operations: A Review. Curr. For. Rep. 2019, 5, 101–113. [Google Scholar] [CrossRef]
- Cambero, C.; Sowlati, T. Assessment and optimization of forest biomass supply chains from economic, social and environmental perspectives—A review of literature. Renew. Sustain. Energy Rev. 2014, 36, 62–73. [Google Scholar] [CrossRef]
- Holzleitner, F.; Kastner, M.; Stampfer, K.; Holler, N.; Kanzian, C. Monitoring cable tensile forces of winch-assist harvester and forwarder operations in steep terrain. Forests 2018, 9, 53. [Google Scholar] [CrossRef]
- Machado, C.C. Sistema Brasileiro De Classificação De Estradas Florestais ( Sibracef ): Desenvolvimento e Relação com o meio de Transporte Florestal Rodoviário. Ph.D. Thesis, Universidade Federal do Paraná, Paraná, Brasil, 1989. [Google Scholar]
- Simões, D.; Andrés Daniluk Mosquera, G.; Cristina Batistela, G.; Raimundo de Souza Passos, J.; Torres Fenner, P. Quantitative analysis of uncertainty in financial risk assessment of road transportation of wood in Uruguay. Forests 2016, 7, 130. [Google Scholar] [CrossRef]
- Öhman, K.; Eriksson, L.O. Aggregating harvest activities in long term forest planning by minimizing harvest area perimeters. Silva. Fenn. 2010, 44, 77–89. [Google Scholar] [CrossRef]
- Helmes, K.L.; Stockbridge, R.H. Thinning and harvesting in stochastic forest models. J. Econ. Dyn. Control 2011, 35, 25–39. [Google Scholar] [CrossRef]
- Smaltschinski, T.; Seeling, U.; Becker, G. Clustering forest harvest stands on spatial networks for optimised harvest scheduling. Ann. For. Sci. 2012, 69, 651–657. [Google Scholar] [CrossRef]
- Norihiro, J.; Ackerman, P.; Spong, B.D.; Längin, D. Productivity model for cut-to-length harvester operation in South African eucalyptus pulpwood plantations. Croat. J. For. Eng. 2018, 39, 1–13. [Google Scholar]
- Pajkoš, M.; Klvač, R.; Neruda, J.; Mishra, P.K. Comparative time study of conventional cut-to-length and an integrated harvesting method—A case study. Forests 2018, 9, 194. [Google Scholar] [CrossRef]
- Lee, E.; Han, S.K.; Im, S. Performance analysis of log extraction by a small shovel operation in steep forests of South Korea. Forests 2019, 10, 585. [Google Scholar] [CrossRef]
- Alvares, C.A.; Stape, J.L.; Sentelhas, P.C.; Gonçalves, J.D.M.; Sparovek, G. Köppen’s climate classification map for Brazil. Meteorol. Z. 2013, 22, 711–728. [Google Scholar] [CrossRef]
- Santos, H.G.; Almeida, J.A.; Oliveira, J.B.; Lumbreras, J.F.; Anjos, L.H.C.; Coelho, M.R.; Jacomine, P.K.T.; Cunha, T.J.F.; Oliveira, V.A. Sistema Brasileiro de Classificação de Solos, 5th ed.; Editora EMBRAPA: Brasília, Brazil, 2018; p. 353. [Google Scholar]
- Schumacher, F.X.; Hall, F.S. Logarithmic expression of timber-tree volume. J. Agric. Res. 1933, 47, 719–734. [Google Scholar]
- Husch, B.; Beers, T.W.; Kershaw, J.A., Jr. Forest Mensuration, 4th ed.; New York, NY, USA, 2003; 456p, ISBN 978-0-471-01850-6. [Google Scholar]
- Banco Central Do Brasil. Available online: http://www4.bcb.gov.br/pec/conversao/conversao.asp (accessed on 3 April 2019).
- Food and Agriculture Organization of the United Nations. Cost control in Forest Harvesting and Road Construction; FAO: Rome, Italy, 1992; pp. 1–121. [Google Scholar]
- Neto, A.A. Uma proposta metodológica para o cálculo do custo de capital no Brasil. Rev. Adm. RAUSP 2008, 43, 72–83. [Google Scholar]
- Baker, H.; English, P. Capital Budgeting Valuation; John Wiley & Sons: Hoboken, NJ, USA, 2011; 528p, ISBN 9780470569504. [Google Scholar]
- Damodaran, A. Investment Valuation-Tools and Techniques for Determining the Value of Any Asset, 3rd ed.; John Wiley & Sons: Hoboken, NJ, USA, 2012; 992p, ISBN-10: 8126536004. [Google Scholar]
- Damodaran, A. The Dark Side of Valuation: Valuing Young, Distressed and Complex Businesses, 2nd ed.; Upper Saddle River FT Press: Upper Saddle River, NJ, USA, 2010; pp. 1–590, ISBN-10:0134431189. [Google Scholar]
- Montgomery, D.C. Design and Analysis of Experiments, 9th ed.; John Wiley & Sons: Hoboken, NJ, USA, 2017; 752p, ISBN 9781119113478. [Google Scholar]
- SAS Institute. Statistical Analysis System for Windows; release 9.2.; SAS Institute: Cary, NC, USA, 2012. [Google Scholar]
- Rao, C.R. Linear Statistical Inference and Its Application, 2nd ed.; John Wiley & Sons: Hoboken, NJ, USA, 1973; 625p, ISBN 0471218758. [Google Scholar]
- Mood, A.M.; Graybill, F.A.; Boes, D.C. Solution Manual: Introduction to the Theory of Statistics, 3rd ed.; McGraw-Hill Education: New York, NY, USA, 1974; 480p, ISBN-10: 0070854659. [Google Scholar]
- R Core Team. R: A Language and Environment for Statistical Computing; R Foundation for Statistical Computing: Vienna, Austria, 2020; Available online: https://www.R-project.org (accessed on 12 August 2021).
- Spinelli, R.; Hartsough, B.R.; Owende, P.M.O.; Ward, S.M. Productivity and cost of mechanized whole-tree harvesting of Fast-Growing eucalypt stands. Int. J. For. Eng. 2002, 13, 49–60. [Google Scholar] [CrossRef]
- de Oliveira Júnior, E.D.; Seixas, F.; Batista, J.L.F. Produtividade De Feller-Buncher Em Povoamento De Eucalipto Em Relevo Acidentado. Floresta 2009, 39, 905–912. [Google Scholar] [CrossRef]
- Diniz, C.C.C.; Nakajima, N.Y.; Robert, R.C.G.; Dolácio, C.J.F.; Silva, F.A. da Desempenho de um Feller Buncher em extrema variação da declividade do terreno. Adv. For. Sci. 2018, 5, 381–384. [Google Scholar]
- Acuna, M.; Skinnell, J.; Evanson, T.; Mitchell, R. Bunching with a self-levelling feller-buncher on steep terrain for efficient yarder extraction. Croat. J. For. Eng. 2011, 32, 521–531. [Google Scholar]
- Acuna, M.; Kellog, L.D. Evaluation of alternative cut-to-length harvesting technology for native forest thinning in Australia. Int. J. For. Eng. 2009, 20, 17–25. [Google Scholar] [CrossRef]
- Simões, D.; Iamonti, I.C.; Fenner, P.T. Avaliação técnica e econômica do corte de eucalipto com feller buncher em diferentes condições operacionais. Cienc. Florest. 2010, 20, 649–656. [Google Scholar] [CrossRef]
- Fernandes, H.C.; Lopes, S.E.; Teixeira, M.M.; Rinaldi, P.C.N.; Fernandes, P.S. Avaliação técnica e econômica de um feller buncher operando em diferentes produtividades. Rev. Eng. Agric. Reveng 2011, 19, 210–218. [Google Scholar]
- Ghaffariyan, M.R.; Acuna, M.; Kellogg, L. Productivity of roadside processing system in western Australia. Silva. Balc. 2012, 13, 49–60. [Google Scholar]
- Pereira, A.L.N.; Lopes, E.D.S.; Dias, A.N. Análise técnica e de custo do feller buncher e skidder na colheita de madeira em diferentes produtividades do povoamento. Cienc. Florest. 2015, 25, 981–989. [Google Scholar] [CrossRef]
- Anderson, B.; Evans, C.M. Harvesting Overmature Aspen Stands in Central Alberta; Special Report Forest Engineering Research Institute of Canada: Edmond, AB, Canada, 1996; p. 42. [Google Scholar]
- Nascimento, A.C.; Leite, Â.M.P.; Soares, T.S.; de Freitas, L.C. Avaliação técnica e econômica da collheita florestal com feller buncher. Cerne 2011, 17, 9–15. [Google Scholar] [CrossRef]
- Simões, D.; Fenner, P.T.; Esperancini, M.S.T. Productivity and costs of feller buncher and forest processor in stands of eucalyptus in first cut. Cienc. Florest. 2014, 24, 621–630. [Google Scholar] [CrossRef]
- Simões, D.; Fenner, P.T. Infuěncia do relevo na produtividade e custos do harvester. Sci. For. Sci. 2010, 38, 107–114. [Google Scholar]
- Alam, M.; Acuna, M.; Brown, M. Self-levelling feller-buncher productivity based on LiDAR-derived slope. Croat. J. For. Eng. 2013, 34, 273–281. [Google Scholar]
- Hiesl, P.; Benjamin, J.G. Applicability of international harvesting equipment productivity studies in Maine, USA: A literature review. Forests 2013, 4, 898–921. [Google Scholar] [CrossRef]
- Seixas, F.; Batista, J.L.F. Comparação técnica e econômica entre harvesters de pneus e com máquina base de esteiras. Ciência Florest. 2014, 24, 185–191. [Google Scholar] [CrossRef]
- Holtzscher, M.; Lanford, B. Tree diameter effects on cost and productivl,ty of cut-to-length systems. For. Prod. J. 1997, 47, 25–30. [Google Scholar]
- Fiedler, N.C.; da Rocha, E.B.; Lopes, E.d.S. Análise da Produtividade de um Sistema de Colheita de Árvores Inteiras no Norte do Estado de Goiás. Floresta 2008, 38, 577–586. [Google Scholar] [CrossRef]
- Rocha, E.B.; Fiedler, N.C.; Alves, R.T.; Guimarães, P.P.; da Silva Lopes, E.; Peroni, L. Produtividade e custos de um sistema de colheita de árvores inteiras. Cerne 2009, 15, 372–381. [Google Scholar]
- Spinelli, R.; Hartsough, B.R.; Magagnotti, N. Productivity standards for harvesters and processors in Italy. For. Prod. J. 2010, 60, 226–235. [Google Scholar] [CrossRef]
- Schettino, S.; Minette, L.J.; Souza, A.P. Correlação entre volumetria de florestas de eucalipto e produtividade e custos de máquinas de colheita de madeira. Rev. Arvore 2015, 39, 935–942. [Google Scholar] [CrossRef]
- Tolosana, E.; Spinelli, R.; Aminti, G.; Laina, R.; López-Vicens, I. Productivity, efficiency and environmental effects of whole-tree harvesting in Spanish coppice stands using a drive-to-tree disc saw Feller-Buncher. Croat. J. For. Eng. 2018, 39, 163–172. [Google Scholar]
- Harrill, H.; Han, H.-S. Productivity and Cost of Integrated Harvesting of Wood Chips and Sawlogs in Stand Conversion Operations. Int. J. For. Res. 2012, 1–10. [Google Scholar] [CrossRef]
- Williams, C.; Ackerman, P. Cost-productivity analysis of South African pine sawtimber mechanised cut-to-length harvesting. South. For. J. For. Sci. 2016, 78, 267–274. [Google Scholar] [CrossRef]
- Schweier, J.; Spinelli, R.; Magagnotti, N.; Becker, G. Mechanized coppice harvesting with new small-scale feller-bunchers: Results from harvesting trials with newly manufactured felling heads in Italy. Biomass Bioenergy 2015, 72, 85–94. [Google Scholar] [CrossRef]
- Simões, D.; Miyajima, R.H.; Tonin, R.P.; Fenner, P.T.; Batistela, G.C. Incorporation of uncertainty in technical and economic analysis of a feller-buncher. Floresta. 2018, 48, 403–412. [Google Scholar] [CrossRef]
- Wang, J.; Long, C.; Mcneel, J. Production and cost analysis of a feller-buncher and grapple skidder in central Appalachian hardwood forests. For. Prod. J. 2004, 54, 159–167. [Google Scholar]


| FB | SC | CA | |
|---|---|---|---|
| 1 | 2 | ||
| 1 | 1 | (236; 3; 8; 5.390) | (308; 3;9; 5.484) |
| 2 | (218; 3; 8; 5.509) | (249; 4; 8; 5.582) | |
| 2 | 1 | (205; 2; 11; 7.190) | (214; 3; 10; 7.584) |
| 2 | (185; 2; 10; 6.735) | (222; 4; 10; 6.784) | |
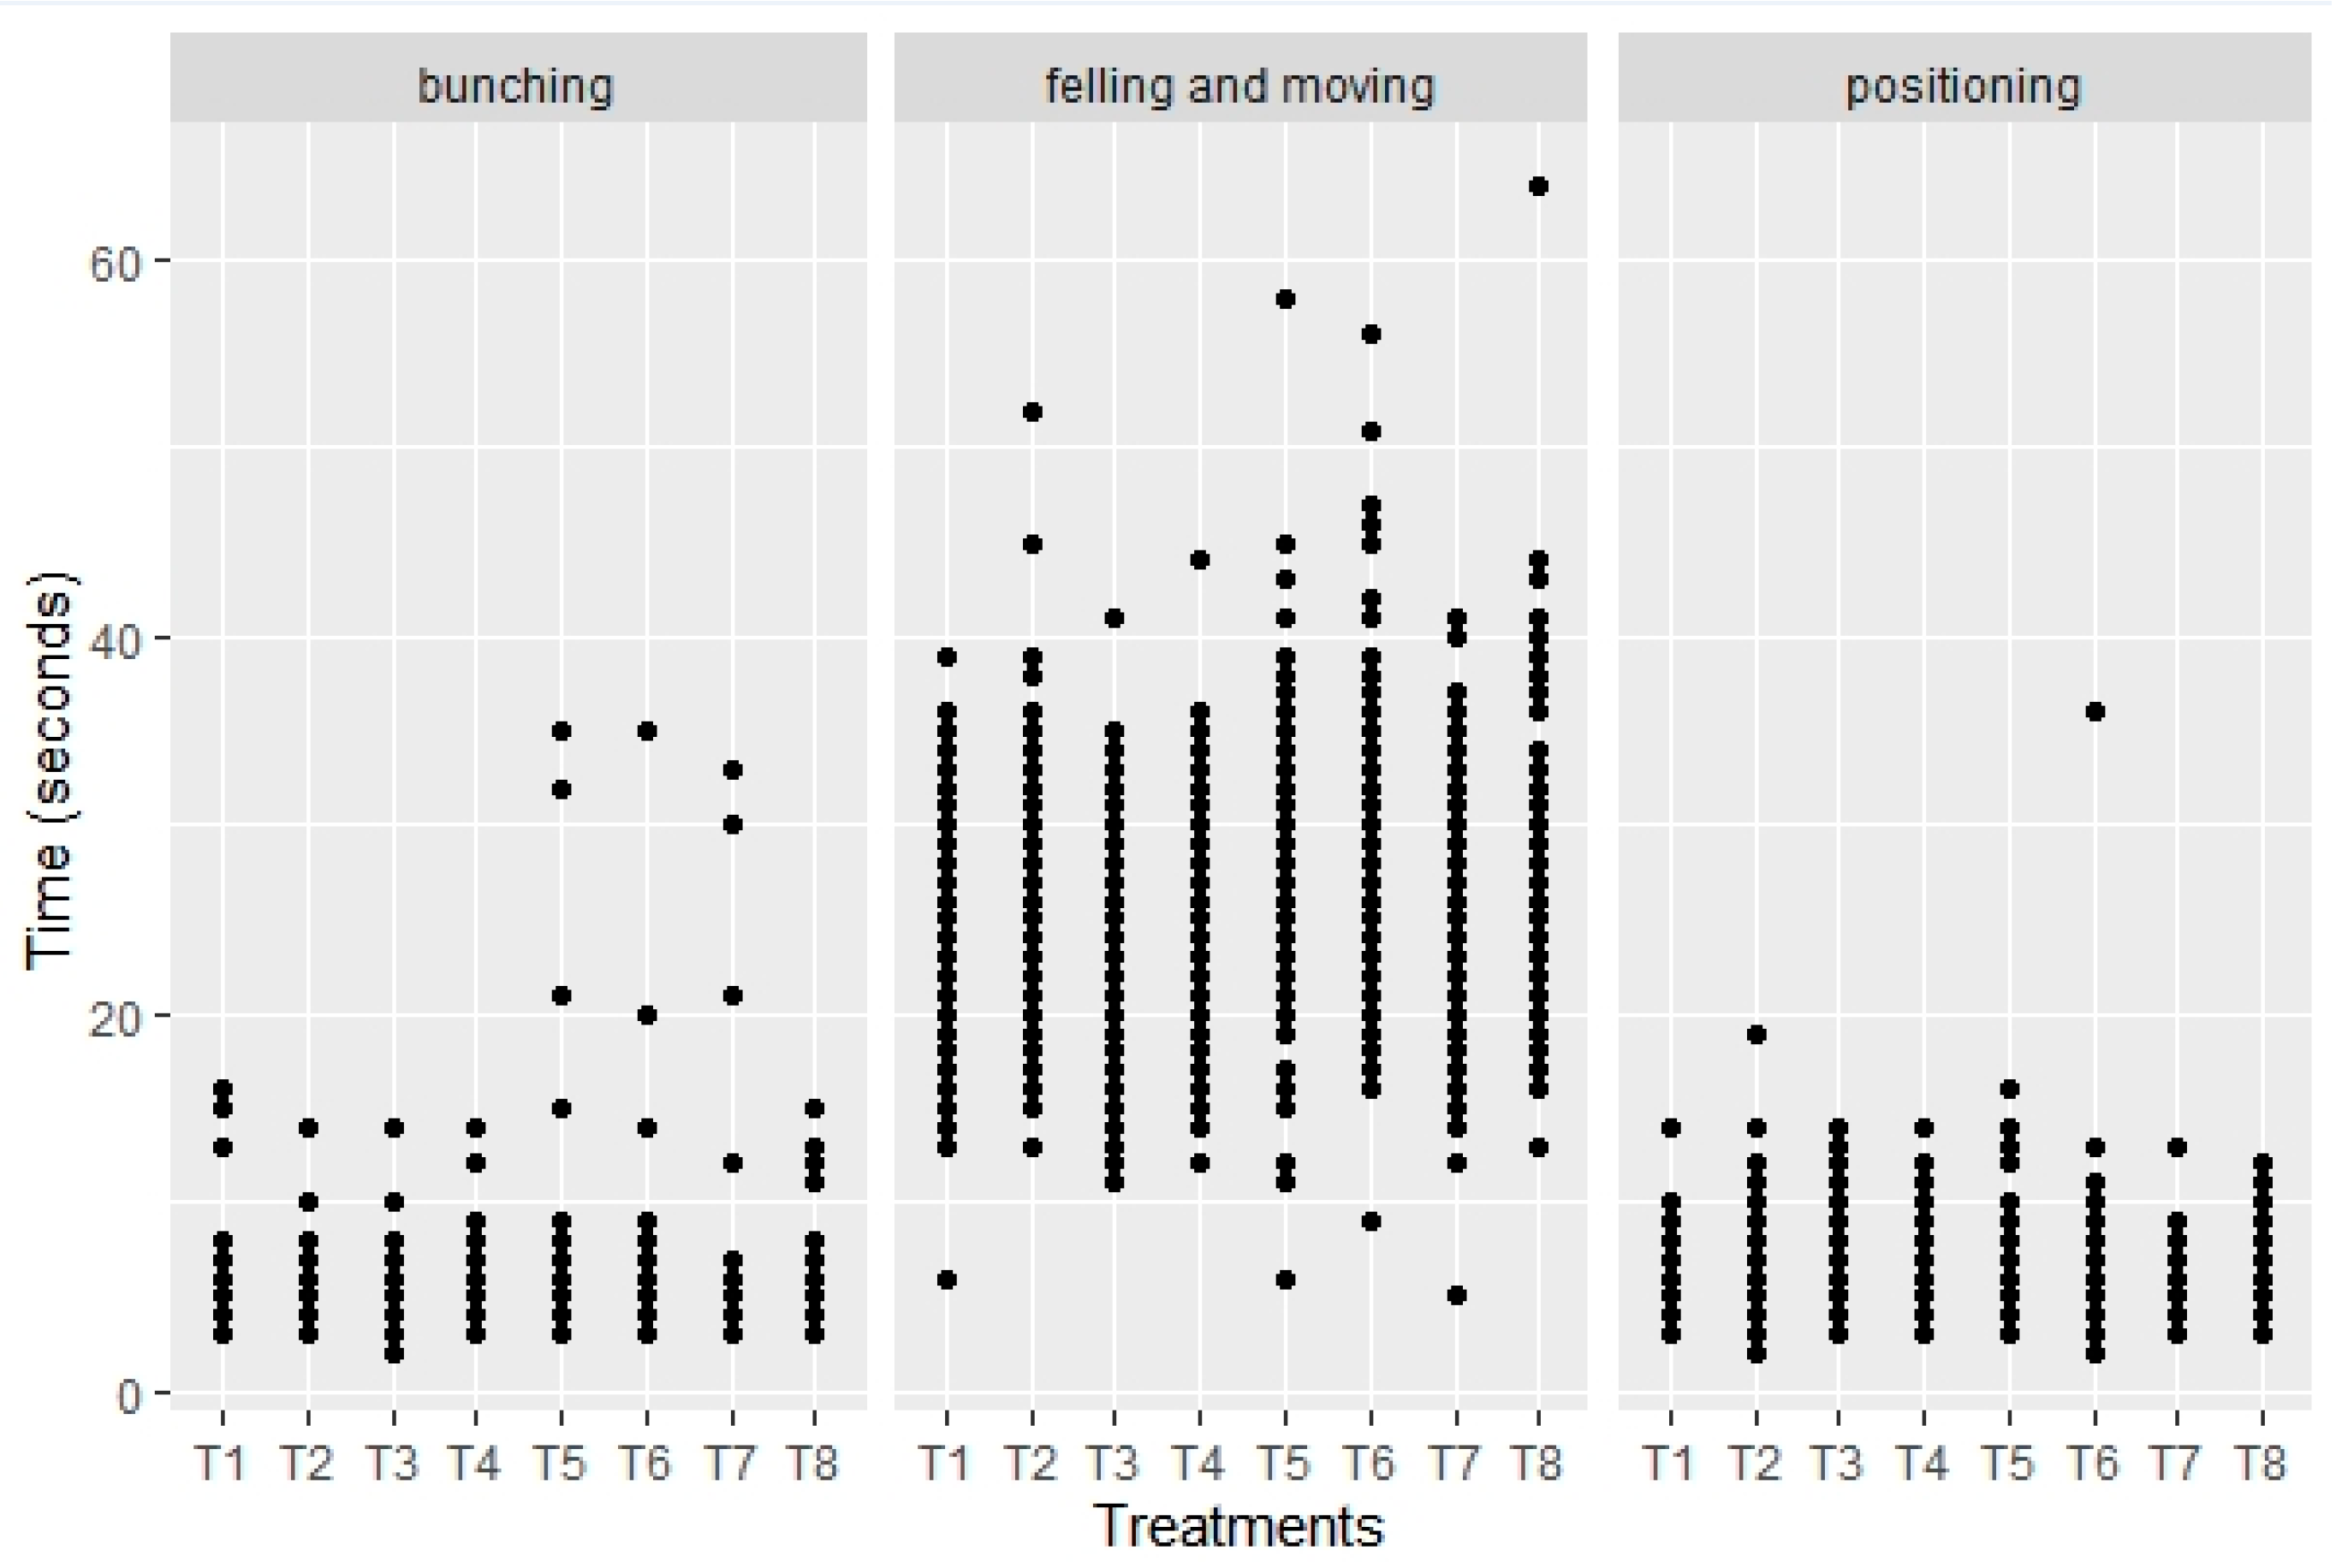
| FB | SC | CA | Felling | Bunching | Turn |
|---|---|---|---|---|---|
| 1 | 1 | 1 | 23.619 ± 4.918 a A α | 5.030 ± 1.534 a A α | 6.280 ± 1.587 a A α |
| (236; 6; 39) | (236; 3; 16) | (236; 3; 14) | |||
| 2 | 25.857 ± 4.646 b B α | 4.701 ± 1.219 a A α | 6.299 ± 1.785 a A α | ||
| (308; 13; 52) | (308; 3; 14) | (308; 2; 19) | |||
| 2 | 1 | 22.940 ± 4.807 a A α | 5.165 ± 1.378 b A α | 6.633 ± 1.697 a B α | |
| (218; 11; 41) | (218; 2; 14) | (218; 3; 14) | |||
| 2 | 24.217 ± 4.485 b A α | 4.763 ± 1.291 a A α | 6.494 ± 1.535 a A β | ||
| (249; 12; 44) | (249; 3; 14) | (249; 3; 14) | |||
| 2 | 1 | 1 | 27.044 ± 5.597 a B β | 5.298 ± 3.261 a A α | 6.380 ± 1.958 a B α |
| (205; 6; 58) | (205; 3; 35) | (205; 3; 16) | |||
| 2 | 29.794 ± 5.938 b B β | 4.808 ± 2.561 b A α | 6.089 ± 2.581 a A α | ||
| (214; 9; 56) | (214; 3; 35) | (214; 2; 36) | |||
| 2 | 1 | 24.065 ± 5.077 a A β | 5.497 ± 3.107 a A α | 5.816 ± 1.233 a A β | |
| (185; 5; 41) | (185; 3; 33) | (185; 3; 3) | |||
| 2 | 25.630 ± 5.432 b A β | 5.248 ± 1.429 a B β | 5.941 ± 1.386 a A α | ||
| (222; 13; 64) | (222; 3; 15) | (222; 3; 12) |
| FB | SC | CA | |
|---|---|---|---|
| 1 | 2 | ||
| 1 | 1 | 112.775 ± 20.054 a A α (236; 67.924; 213.333) | 107.834 ± 14.314 a B α (308; 55.385; 150.698) |
| 2 | 114.805 ± 17.746 a A α (218; 65.455; 201.600) | 113.840 ± 15.371 a A α (249; 72.000; 180.000) | |
| 2 | 1 | 133.897 ±24.956 a B β (205; 14.845; 174.546) | 136.026 ±14.424 a A β (214; 13.884; 216.000) |
| 2 | 137.436 ± 18.217 a A β (185; 59.016; 166.154) | 132.603 ± 17.311 a A β (222; 73.469; 185.807) | |
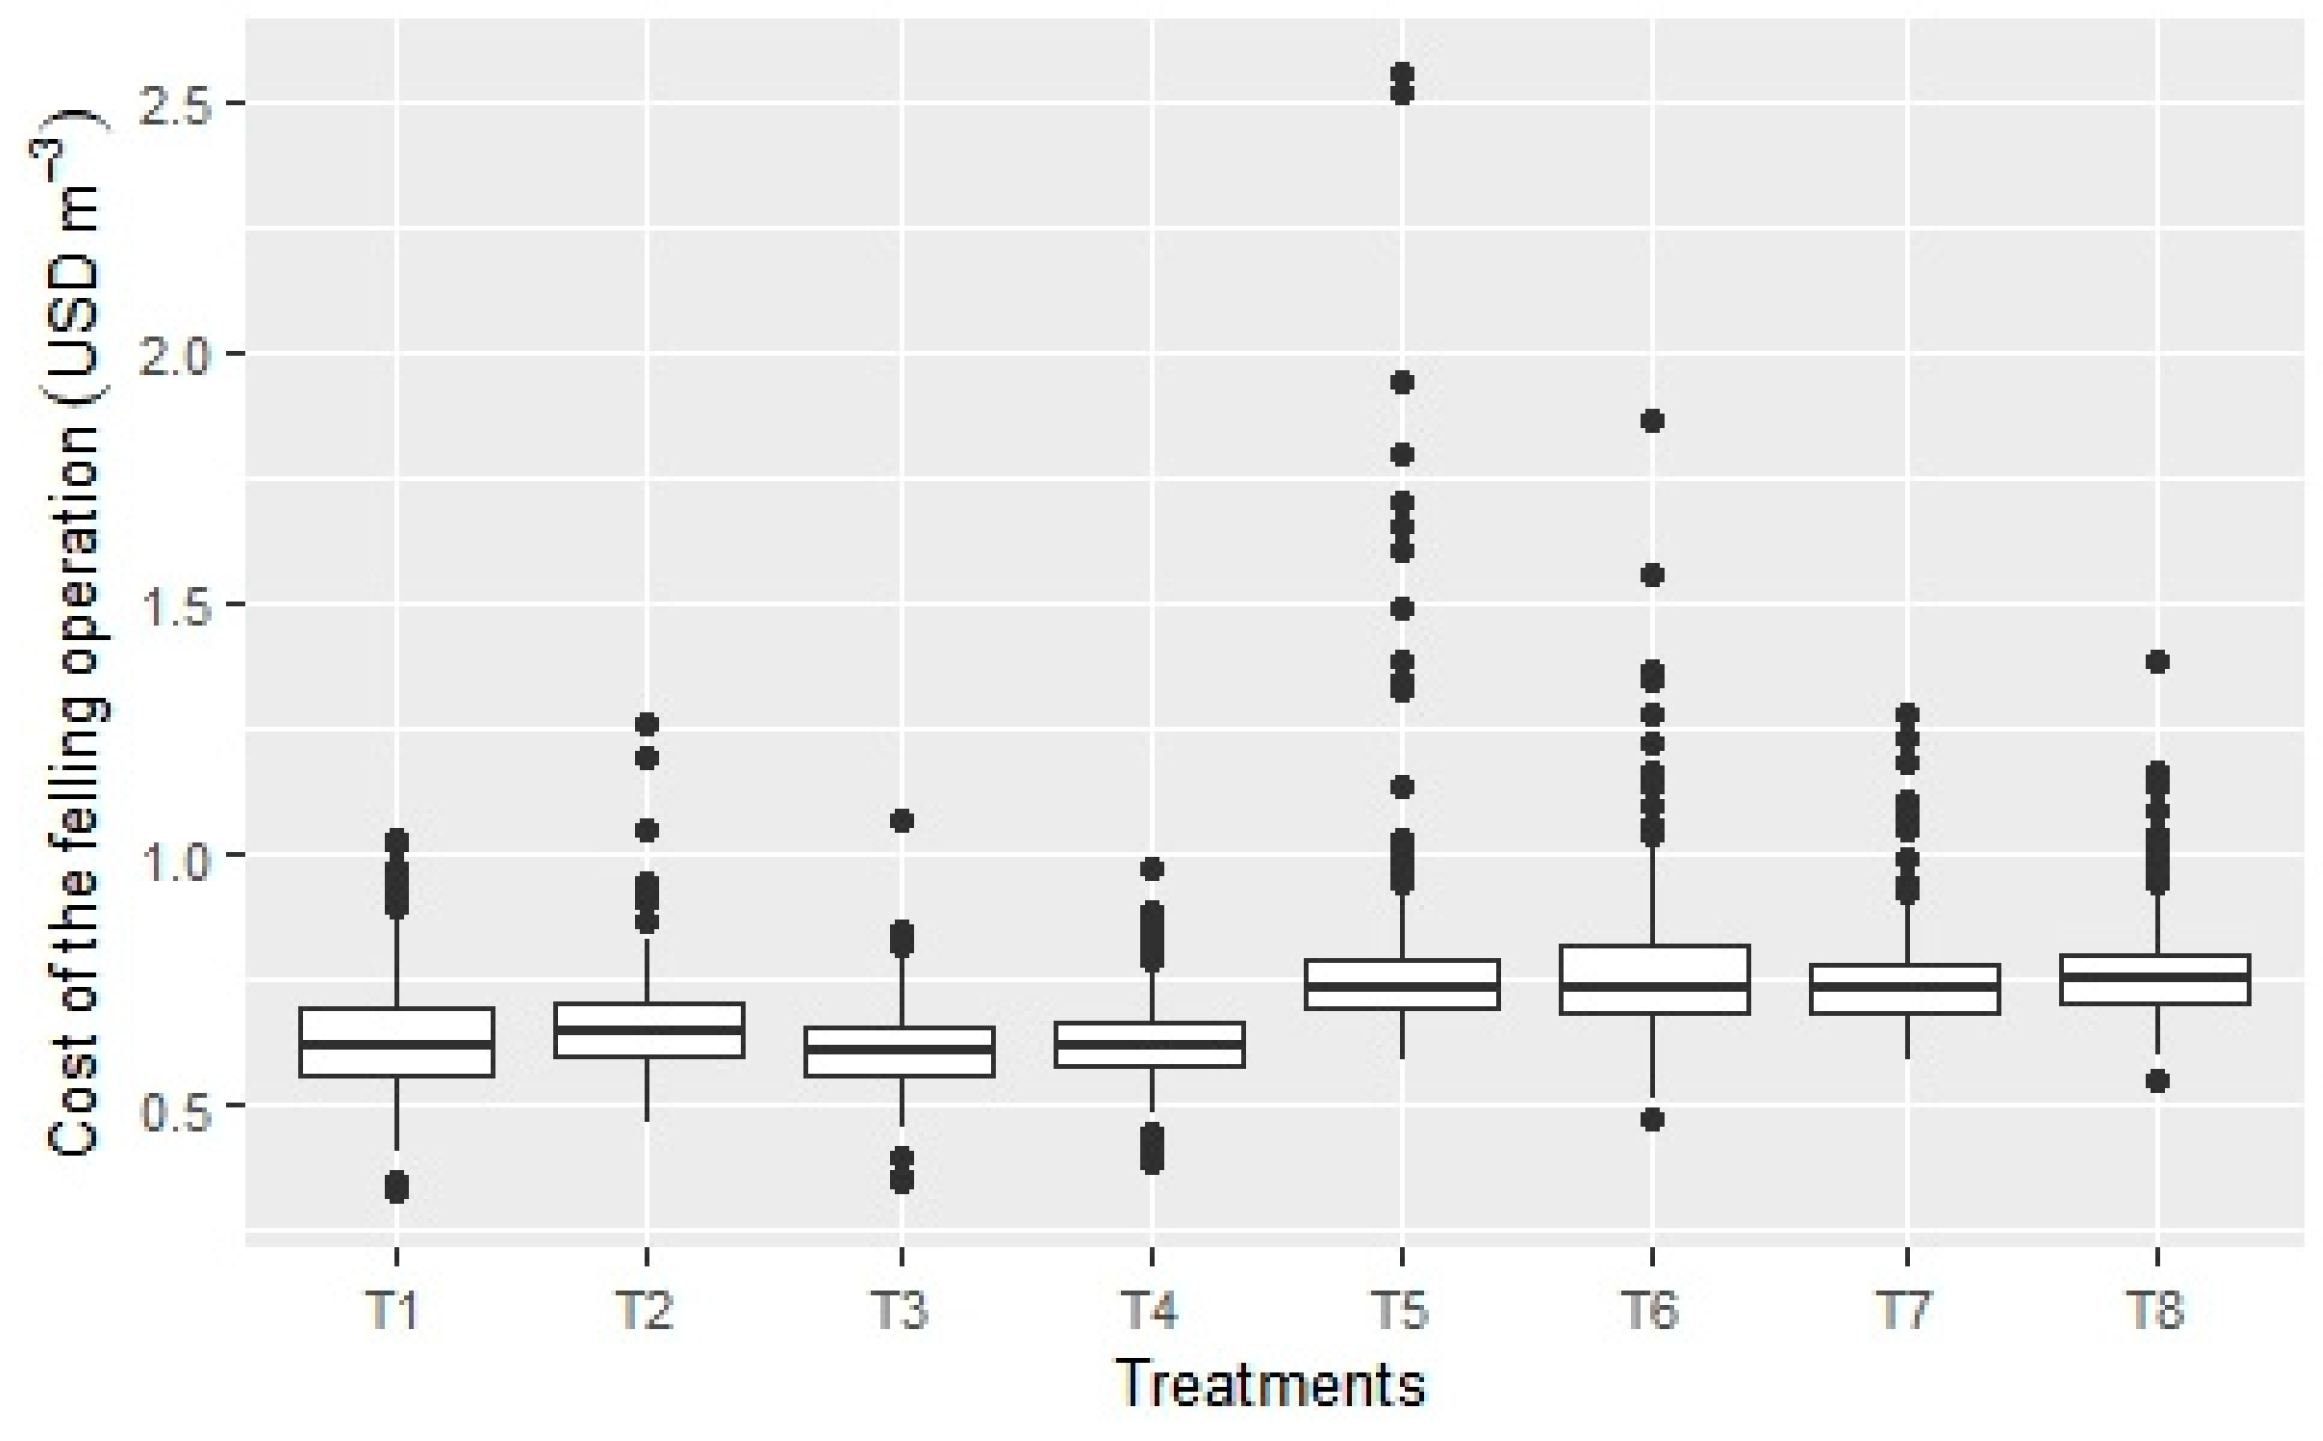
| FB | SC | CA | |
|---|---|---|---|
| 1 | 2 | ||
| 1 | 1 | 0.637 ± 0.113 a A α (236; 0.327; 1.026) | 0.659 ± 0.098 a B α (308; 0.462; 1.258) |
| 2 | 0.621 ± 0.094 a A α (218; 0.346; 1.065) | 0.623 ± 0.083 a A α (249; 0.387; 0.968) | |
| 2 | 1 | 0.799 ± 0.263 a B β (205; 0.585; 2.551) | 0.774 ± 0.171 a A β (214; 0.472; 1.860) |
| 2 | 0.753 ± 0.117 a A β (185; 0.585; 1.275) | 0.778 ± 0.115 a A β (222; 0.549; 1.389) | |
Publisher’s Note: MDPI stays neutral with regard to jurisdictional claims in published maps and institutional affiliations. |
© 2021 by the authors. Licensee MDPI, Basel, Switzerland. This article is an open access article distributed under the terms and conditions of the Creative Commons Attribution (CC BY) license (https://creativecommons.org/licenses/by/4.0/).
Share and Cite
Miyajima, R.H.; Fenner, P.T.; Batistela, G.C.; Simões, D. Effect of Feller-Buncher Model, Slope Class and Cutting Area on the Productivity and Costs of Whole Tree Harvesting in Brazilian Eucalyptus Stands. Forests 2021, 12, 1092. https://doi.org/10.3390/f12081092
Miyajima RH, Fenner PT, Batistela GC, Simões D. Effect of Feller-Buncher Model, Slope Class and Cutting Area on the Productivity and Costs of Whole Tree Harvesting in Brazilian Eucalyptus Stands. Forests. 2021; 12(8):1092. https://doi.org/10.3390/f12081092
Chicago/Turabian StyleMiyajima, Ricardo Hideaki, Paulo Torres Fenner, Gislaine Cristina Batistela, and Danilo Simões. 2021. "Effect of Feller-Buncher Model, Slope Class and Cutting Area on the Productivity and Costs of Whole Tree Harvesting in Brazilian Eucalyptus Stands" Forests 12, no. 8: 1092. https://doi.org/10.3390/f12081092
APA StyleMiyajima, R. H., Fenner, P. T., Batistela, G. C., & Simões, D. (2021). Effect of Feller-Buncher Model, Slope Class and Cutting Area on the Productivity and Costs of Whole Tree Harvesting in Brazilian Eucalyptus Stands. Forests, 12(8), 1092. https://doi.org/10.3390/f12081092