Article

Effect of Plant Diversity on the Occurrence of Diplodia Tip Blight in Natural Secondary Japanese Red Pine Forests

1
Key Laboratory of Forest Protection of National Forestry and Grassland Administration, Research Institute of Forest Ecology, Environment and Protection, Chinese Academy of Forestry, Beijing 100091, China
2
Observation and Research Station of Kunyushan, National Forestry and Grassland Administration, Yantai 264100, China
*
Author to whom correspondence should be addressed.
Forests 2021, 12(8), 1083; https://doi.org/10.3390/f12081083
Submission received: 10 June 2021 / Revised: 8 August 2021 / Accepted: 11 August 2021 / Published: 13 August 2021
(This article belongs to the Special Issue Forest Pathology and Entomology)

Abstract

:
Diplodia tip blight caused by Sphaeropsis sapinea (Fr.) Dyko and B. Sutton is a serious threat to the health of natural secondary Japanese red pine (Pinus densiflora Sieb. et Zucc.) forests. To explore the effect of plant diversity on Diplodia tip blight disease occurrence, the correlation between Diplodia tip blight in P. densiflora and plant diversity in various stand types and vertical structure layers were analyzed by Pearson correlation coefficients and generalized linear model while keeping environmental factors relatively consistent. Disease index of Diplodia tip blight in P. densiflora was positively correlated with the plant diversity indices in the tree layers of P. densiflora–conifer mixed forest. In contrast, it was negatively correlated with the plant diversity indices in the tree layers of P. densiflora–hardwood mixed forest and P. densiflora pure forest. In shrub–herb layers of all stands except the P. densiflora pure forest herb layer, the disease index was positively correlated with the plant diversity indices. The prediction models for the disease index of Diplodia tip blight in the P. densiflora–hardwood mixed forest, P. densiflora–conifer mixed forest, and P. densiflora pure forest were also established. The foregoing results suggest that in the Kunyu Mountains of China, the differences in plant diversity among various stand types and vertical structure layers have different effects on the occurrence of Diplodia tip blight in P. densiflora. Plant diversity largely reflects the occurrence of Diplodia tip blight disease. However, if the effect of plant diversity on Diplodia tip blight is fully reflected, the plant species characteristics, especially tree genetic relationships, should be considered. In this way, plant species diversity structure in natural secondary Japanese red pine forests may be modified through forest management to lower the incidence of Diplodia tip blight.

1. Introduction

The fungus 
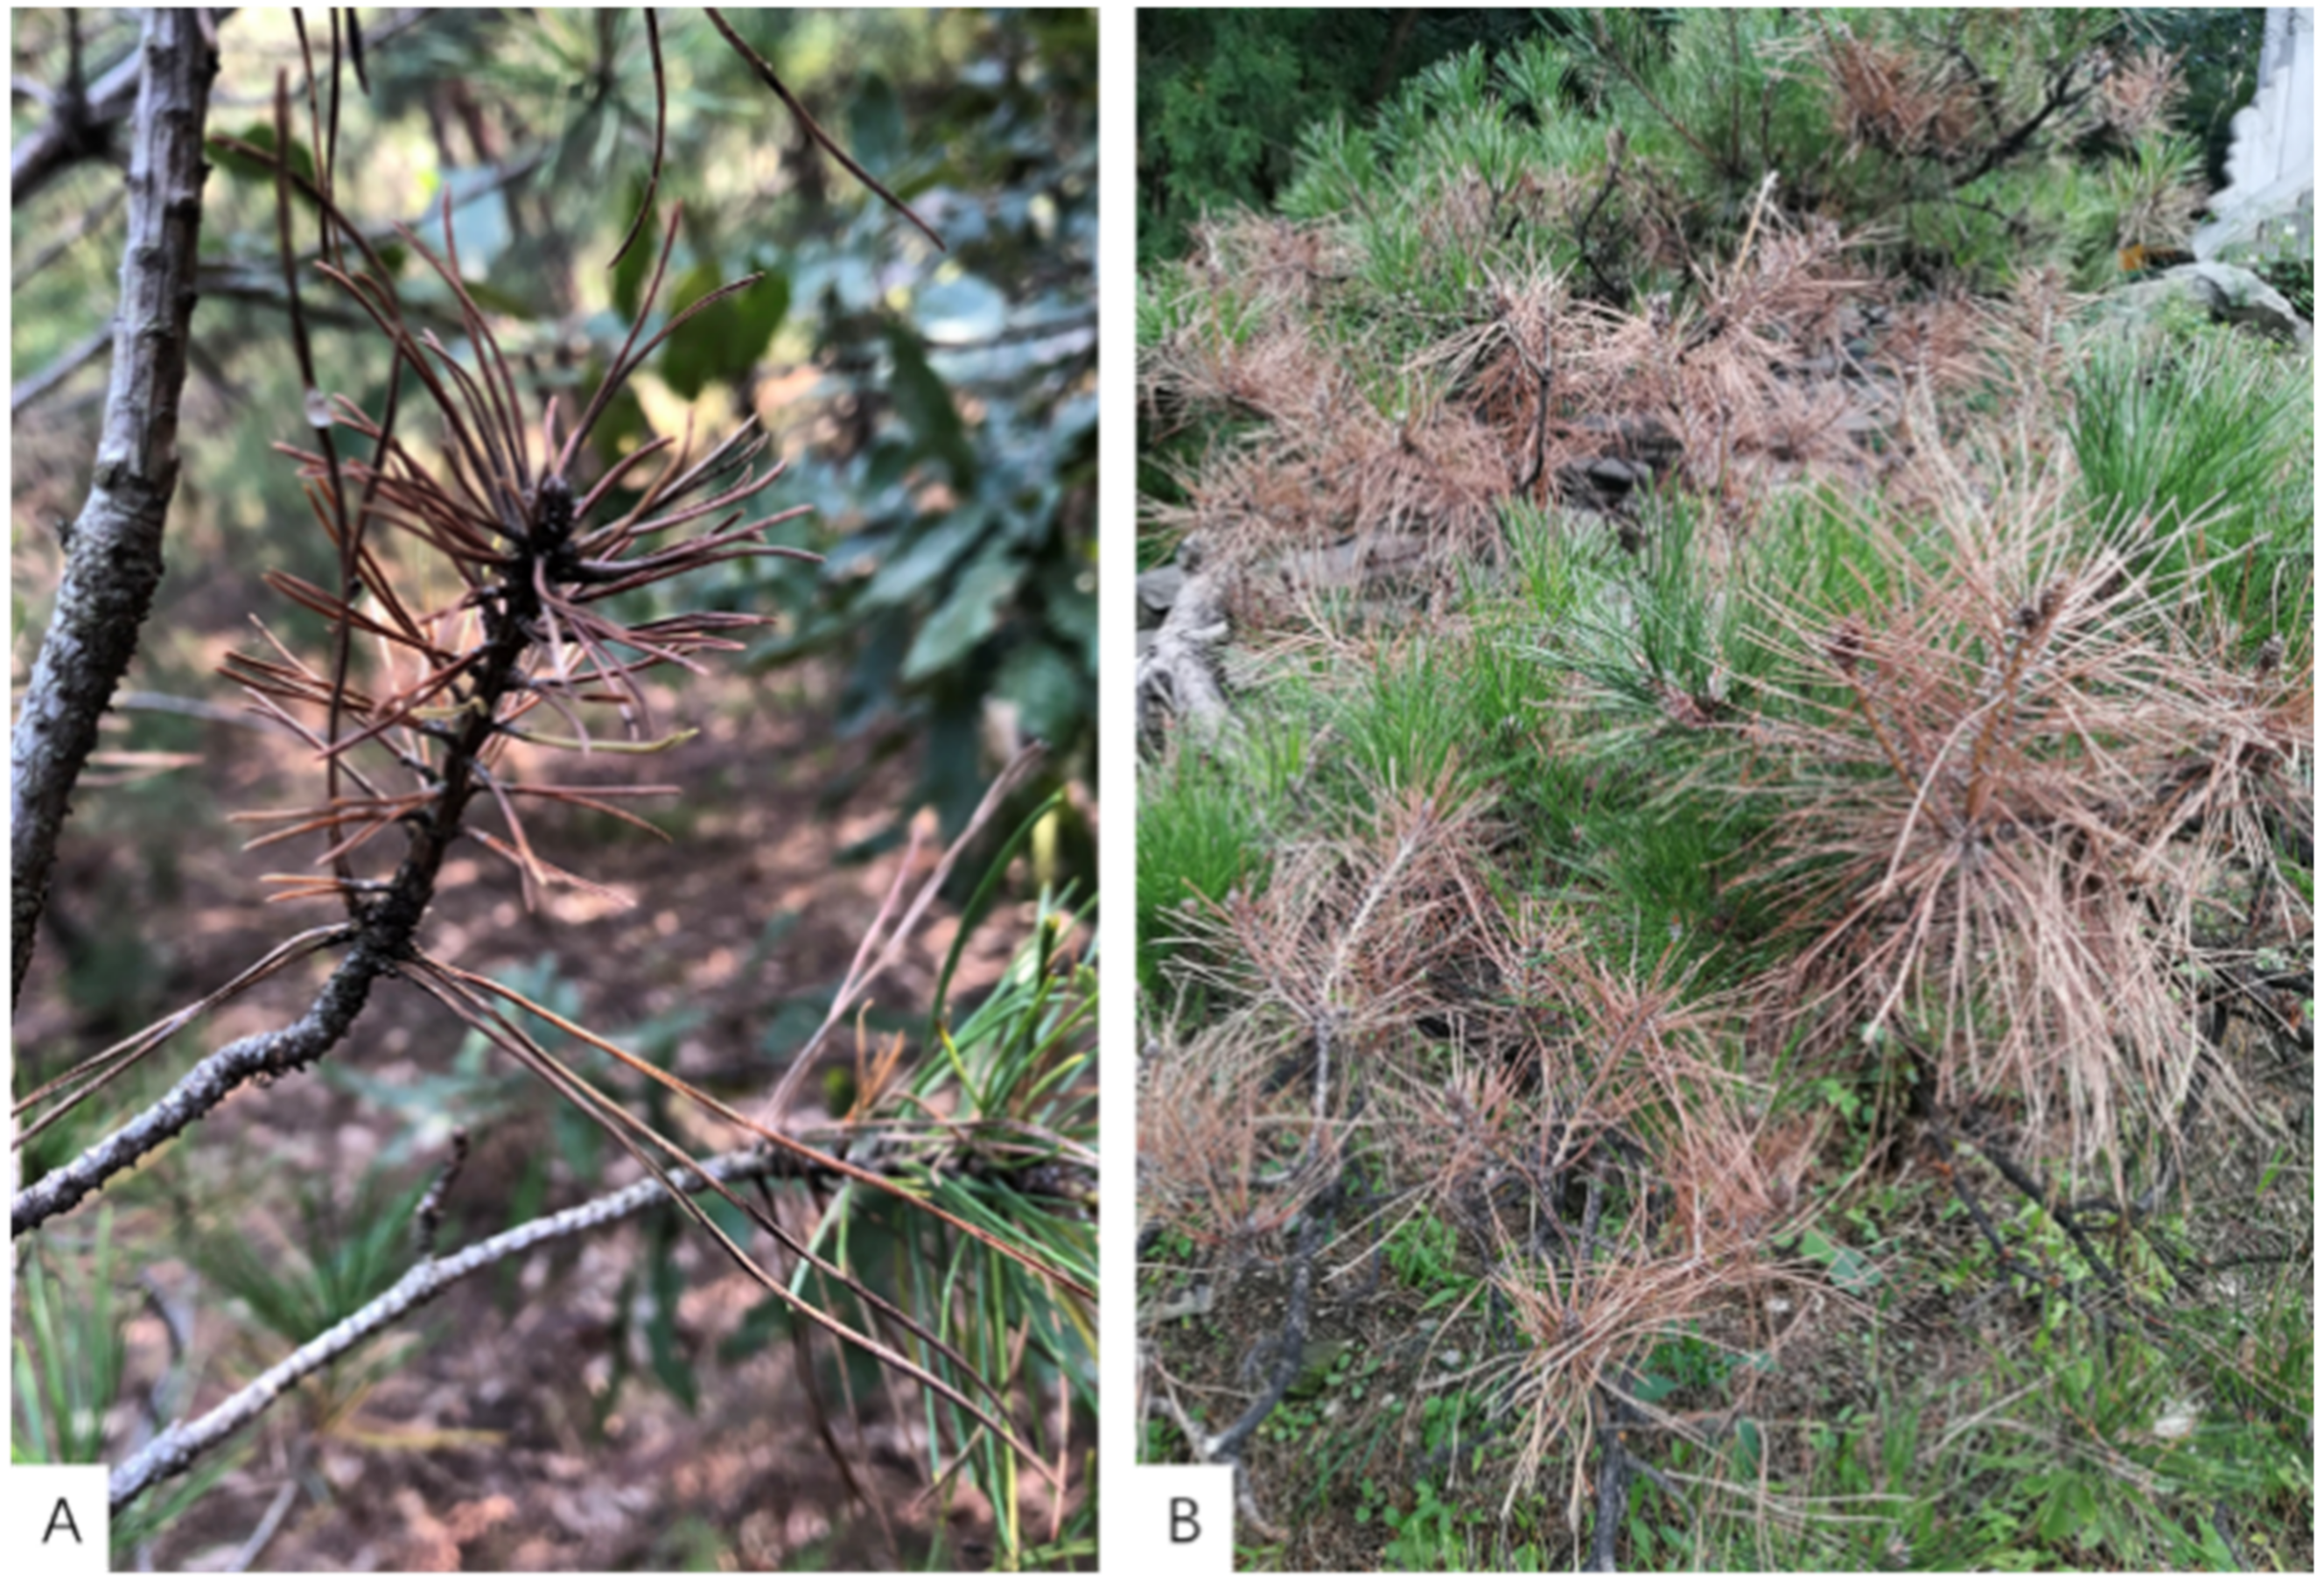
Sphaeropsis sapinea (Fr.) Dyko and B. Sutton is a critical pathogen for almost 60 conifer species that belong to Abies, Cedrus, Juniperus, Larix, Picea, Pinus, Pseudotsuga, and Thuja [1] (p. 186). It causes tip blight, stem canker, rhizome decay, and sapstain and has serious threats to forest health in nearly 40 countries such as New Zealand, Australia, South Africa, the United States of America, Finland, Germany, and China [2,3,4,5,6,7,8] (pp. 224–227). As an endophyte, it may occur as a latent pathogen and produces no visible symptoms in the hosts [9]. Sphaeropsis sapinea infesting coniferous trees of any age can induce disease when the hosts are subjected to physiological stress or physical damage [10]. A high incidence of the disease results in extensive forest blight, and adversely affects the integrity and stability of forest ecosystems [11,12,13,14].
The natural secondary Japanese red pine (Pinus densiflora Sieb. et Zucc.) forests of the Kunyu Mountains are the original habitats and distribution centers of Japanese red pine in China and even Northeast Asia. They have abundant species, genetic, and ecosystem diversity. Their germplasms are considered to have high scientific research and practical value [15,16]. However, Diplodia tip blight caused by S. sapinea is a major disease affecting the natural secondary Japanese red pine forests of the Kunyu Mountains. It threatens the healthy and stable development of forests. Nevertheless, it is unknown why this pathogen has induced an epidemic in this region.
Studies on the relationships between Diplodia tip blight in pine and environmental factors showed that S. sapinea, as an endophyte, can become pathogenic, when its hosts have been weakened by abiotic stresses such as precipitation deficits, elevated temperatures, drought, and hailstorms [6,7,17,18,19].
Theoretical studies revealed that tree species diversity has a significant impact on disease prevalence. For example, the risk of Picea abies (L.) H. Karsten root rot caused by Heterobasidion annosum (Fr.) Bref. is lower in the P. abies mixed forest than it is in the P. abies pure forest [20]. Hantsch et al. [21] found a negative correlation between the disease index of oak powdery mildew (Erysiphe alphitoides (Griffon and Maubl.) U. Braun and S. Takam. and Erysiphe hypophylla (Nevod.) U. Braun and Cunningt.) and tree species diversity. By contrast, Menges and Loucks [22] suggested that the mortality of certain host tree species, such as Quercus velutina Lam., Quercus borealis Michx., and Quercus ellipsoidalis E. J. Hill infested with Ceratocystis fagacearum (Bretz.) Hunt) rise with the increase of Quercus species diversity. Furthermore, the relationship between plant diversity and disease is highly complex in multi-host forest ecosystems [23]. For instance, most plants in forest ecosystems are hosts of Phytophthora ramorum Werres, De Cock and Man in’t Veld [24,25]. However, substitute hosts can impede disease spread in highly susceptible hosts and reduce the impact of the pathogen on host plants [26]. Xie and Liang [27] identified that the disease index of moso bamboo (Phyllostachys edulis (Carriere) J. Houzeau) shoot blight (Ceratosphaeria phyllostachydis Zhang) is highest in the moso bamboo–conifer mixed forest, moderate in the moso bamboo–hardwood mixed forest, and lowest in the moso bamboo pure forest. Meanwhile, the shrub–herb plants are important components of the forest community. Their diversity may alter humidity, soil, light, and other factors inside the forest, and further affect tree growth and the forest environment, which act on the occurrence and development of diseases [28,29]. Plant diversity in the shrub and herb layers of different moso bamboo stands have different effects on the development of moso bamboo shoot blight [27]. While the species richness and Shannon–Wiener index increased and Simpson index decreased in the shrub–herb layers of Dalbergia odorifera T. Chen mixed forest, the disease index of black scurf (Phyllachora dalbergiicola Henn.) in D. odorifera sharply decreased [30]. These studies demonstrate that there are explicit relationships between disease and environmental factors. Nevertheless, the relationship between plant diversity and disease is complex. The differences in plant diversity among different stand types and vertical structure layers have different influences on disease occurrence.
In the present study, we focused on whether the plant diversity has an impact on the occurrence of Diplodia tip blight in P. densiflora. The effect between plant diversity and Diplodia tip blight in P. densiflora in various stand types and vertical structure layers of natural secondary Japanese red pine forests in the Kunyu Mountains in China was expounded. In this analysis, environmental factors were kept relatively consistent. The assumption was that plant diversity has significantly different effects on the disease occurrence in different forest types. It could infer the feasibility of a method for adjusting plant diversity structure to control the prevalence of Diplodia tip blight in P. densiflora, based on this effect.

2. Materials and Methods

2.1. Study Area and Plot Layout

The Kunyu Mountains (121°41′34′′–121°48′04′′ E; 37°11′50′′–37°17′22′′ N) are located on the Jiaodong Peninsula of Eastern China. The region has a warm temperate monsoon climate with mean annual temperature of 12.3 °C, mean annual precipitation of 800–1200 mm, mean annual relative humidity of 62.6%, and frost-free period of 200–220 d. The forest soil is mainly brown sandy loam [31,32]. Pinus densiflora is the main constructive species. Between June and October 2020, a total of 120 temporary sample plots, each with an area of 20 m × 20 m, were set up in natural secondary Japanese red pine forests of the Kunyu Mountains. All stand plots distributed evenly and had similar conditions of altitude 200 ± 25 m, middle slope position, slope 30° ± 3°, sunny slope aspect, brown sandy loam, and forest age 40 ± 4 years. There were 40 plots of P. densiflora–hardwood mixed forest, 40 plots of P. densiflora–conifer mixed forest and 40 plots of P. densiflora pure forest. Plots were considered to contain pure forest if their ratios of cross-sectional area at breast height of P. densiflora to the cross-sectional area at breast height of all tree species were ≥70%. Otherwise, the plots were deemed mixed forests. Shrub plots of 5 m × 5 m were established by the five-point method at each 20 m × 20 m tree plot. In this method, the center and four corners of each plots were selected. Herb plots of 2 m × 2 m were established in each shrub plot.

2.2. Plant Diversity Analysis

Plant species and quantity were counted in the tree, shrub, and herb layers in the plots of P. densiflora–hardwood mixed forest, P. densiflora–conifer mixed forest and P. densiflora pure forest. For the tree layers, the diameter at breast height (DBH) of living trees was ≥ 5 cm. Plant species richness, and the Shannon–Wiener, Simpson, and Pielou indices were calculated. Each plant diversity index has its own unique meaning. Plant species richness refers to the total number of species in plant communities. All plant species are treated equally and only the presence of the plant species is considered, and relative species abundance is not assessed here. The Pielou index measures the distribution of individuals of plant species in plant communities. The Shannon–Wiener index predicts that plant individuals randomly selected within plant communities belong to the uncertainty of a certain plant species. It considers the abundance and evenness of plant species. The Simpson index indicates the probability that two plant species selected randomly within the plant community are the same plant species [33] (pp. 7–10), [34,35]. It also considers both plant species abundance and evenness. However, the Simpson index is more strongly affected by evenness than the Shannon–Wiener index. The formulae for the above four indices are as follows [35,36,37]:
Species   richness   S = Total   plant   species   per   plot
Shannon Wiener   index   ( H ) = i = 1 s n i N ln n i N
Simpson   index   D = 1 i = 1 s ( n i N ) 2
Pielou   index   J = i = 1 s n i N ln n i N / ln S
where ni is the total abundance of a single plant species per plot and N is the total abundance of all plant species per plot.

2.3. Disease Index

The disease index of Diplodia tip blight in P. dentiflora was measured by the five-point method, in that six trees were taken from each of the four corners and the center of each plot. These 30 P. densiflora were divided into upper, middle, and lower layers, for which one branch from each direction (east, south, west, and north) were selected [34]. The needles are treated as cylinders with equal radii. Hence, the ratios of the lesion areas on the needles with tip blight symptoms (Figure 1) to the total needle areas could be transformed into the length ratios. Total needle lesion lengths and total needle lengths for all sampled branches per tree were measured with a steel tape. The ratios of the former to the latter were calculated and then the representative values per tree were determined according to the plant disease classification standard in Table 1. The representative values and the corresponding total numbers of P. densiflora were substituted into the formula to calculate the sample plot disease index. The formulae are as follows [38,39]:
D I T P = N D P d × R V T P d × M R V × 100
D I S P = T D I S P T N S P
where DITP is the Diplodia tip blight disease index in each temporary sample plot, NDPd is the number of diseased P. densiflora at a certain disease grade, TPd is the total number of P. densiflora (30), RV is the representative value of the corresponding grade, and MRV is the maximum representative value of the corresponding grade (4). DISP is the disease index of a certain stand type, TDISP is the sum of all DITP values in a single stand type, and TNSP is the sum of temporary sample plots in a single stand type (40).

2.4. Data Analysis

The variables of disease indices and plant diversity indices of each P. densiflora stand conformed to the normal distribution according to quantile–quantile (Q–Q) plot tests. Brown-Forsythe variance analysis followed by Tamhane’s T2 test at p < 0.05 level [40] (pp. 114–115) was used to compare the means of the Diplodia tip blight disease indices in all plots of the three Japanese red pine stand types and the plant diversity indices in all plots of various Japanese red pine stand types and vertical structure layers. The scatter plots had linear trends between the plant diversity indices and the disease indices of Diplodia tip blight in P. densiflora, thus Pearson correlation coefficients based on these two normally distributed sets of variables were calculated to determine the correlations [41,42]. Generalized linear model (GLM) analysis for all test factors (namely plant species richness and the Shannon–Wiener, Simpson, and Pielou indices among various vertical structure layers and the same stand type) was performed to examine plant diversity indices that had significant impacts on the disease indices of Diplodia tip blight in P. densiflora. The optimal model for each stand was selected by Akaike information criterion (AIC) and Bayesian information criterion (BIC). Plant species richness and the Shannon–Wiener, Simpson, and Pielou indices for each stand were replaced with x1–x4 for the tree layer, x5–x8 for the shrub layer, and x9–x12 for the herb layer, respectively. In this manner, the prediction models for the Diplodia tip blight disease indices in each stand were respectively acquired. Data processing and statistical analyses were performed by R v4.0.2 (R Core Team, Vienna, Austria), Microsoft Excel 2016 (Microsoft Corp., Redmond, WA, USA), and SPSS v23.0 (IBM Corp., Armonk, NY, USA).

3. Results

3.1. Disease Indices in Three Different Japanese Red Pine Stand Types

The disease indices of Diplodia tip blight in P. densiflora in three Japanese red pine stand types significantly differed (F (2, 117) = 415.197; p < 0.01) as follows: P. densiflora–conifer mixed forest (44.215 ± 2.288), P. densiflora pure forest (36.202 ± 2.444), and P. densiflora–hardwood mixed forest (29.875 ± 1.930).

3.2. Plant Species Composition and Diversity

3.2.1. Plant Species Composition

The sum of the tree species in the tree layers of the three Japanese red pine stands was in the range of 13–19 (Table 2). In the P. densiflora–hardwood mixed forest, a total of 19 tree species in 15 genera and 11 families were identified. The highest relative abundance was of P. densiflora (47.85%), followed by Quercus variabilis (22.30%), Q. acutissima (15.96%), etc. In the P. densiflora–conifer mixed forest, one tree variety and 16 tree species in 12 genera and eight families were found, the highest relative abundance was of P. densiflora (52.42%), followed by P. thunbergii (29.94%), etc. In the P. densiflora pure forest, a total of 13 tree species in nine genera and six families were detected. The highest relative abundance was of P. densiflora (71.04%), followed by Q. acutissima (14.52%), etc. (Table 2).
The shrub layers of the three Japanese red pine stands consisted of 29–35 plant species (Table 3). In the P. densiflora–hardwood mixed forest, one shrub variety and 34 shrub species in 31 genera and 20 families were found. The highest relative abundance was of Rhus chinensis (29.89%), followed by Indigofera kirilowii (29.38%), etc. In the P. densiflora–conifer mixed forest, one shrub variety and 34 shrub species in 31 genera and 20 families were identified. The highest relative abundance was of I. kirilowii (33.87%), followed by R. chinensis (26.71%), Lespedeza bicolor (12.09%), etc. In the P. densiflora pure forest, one shrub variety and 28 shrub species in 25 genera and 17 families were detected. The highest relative abundance was of I. kirilowii (39.41%), followed by R. chinensis (30.02%), L. bicolor (11.12%), etc. (Table 3).
The herb layers of the three Japanese red pine stands comprised of 49–53 plant species (Table 4). In the P. densiflora–hardwood mixed forest, one herb subspecies, two herb varieties, and 49 herb species in 45 genera and 24 families were found. The highest relative abundance was of Carex lanceolata (23.90%), followed by Sanguisorba applanata (12.81%), Pteridium aquilinum var. latiusculum (10.76%), Commelina communis (10.39%), etc. In the P. densiflora–conifer mixed forest, two herb subspecies, two herb varieties, and 49 herb species in 47 genera and 21 families were identified. The highest relative abundance was of Imperata cylindrica (18.25%), followed by C. lanceolata (16.28%), S. applanata (12.04%), etc. In the P. densiflora pure forest, one herb subspecies, two herb varieties, and 46 herb species in 44 genera and 23 families were detected. The highest relative abundance was of C. lanceolata (20.37%), followed by S. applanata (18.49%), I. cylindrica (14.50%), Miscanthus sinensis (10.77%), etc. (Table 4).

3.2.2. Comparison of Plant Diversity Indices

Plant Diversity Indices among Various Stand Types and the Same Vertical Structure Layer

Comparison of the diversity indices among various stand types (Table 5) showed that the cumulative values for the species richness, the Shannon–Wiener, and Simpson indices in the tree–shrub–herb layers were, in descending order, P. densiflora–conifer mixed forest > P. densiflora–hardwood mixed forest > P. densiflora pure forest. The differences among groups in terms of the species richness (F (2, 117) = 90.606; p < 0.01) and the Shannon–Wiener (F (2, 117) = 59.715; p < 0.01) and Simpson (F (2, 117) = 62.622; p < 0.01) indices were all significant. The cumulative values of the Pielou index in the tree–shrub–herb layers were highest for the P. densiflora–hardwood mixed forest, moderate for the P. densiflora–conifer mixed forest, and lowest for the P. densiflora pure forest. There were no significant differences among groups in terms of this index (F (2, 117) = 2.651; p > 0.05).
In the tree layers of the three stands, the differences in the species richness (F (2, 117) = 17.361; p < 0.01) and the Shannon–Wiener (F (2, 117) = 70.503; p < 0.01), Simpson (F (2, 117) = 127.614; p < 0.01), and Pielou (F (2, 117) = 36.521; p < 0.01) indices among groups were all significant. Multiple comparisons showed that the species richness and the Simpson and Pielou indices of the tree layers in the P. densiflora–hardwood mixed forest and the P. densiflora–conifer mixed forest were significantly different from those of the tree layers in the P. densiflora pure forest (p < 0.01) (Table 6).
In the shrub layer of the three stands, the differences in the species richness (F (2, 117) = 26.891; p < 0.01;) and the Pielou index (F (2, 117) = 3.904; p < 0.05) among groups were significant. Multiple comparisons revealed that the species richness of the P. densiflora pure mixed forest significantly differed from those of the other two stands (p < 0.01). The Pielou indices significantly differed between the P. densiflora pure forest and the P. densiflora–conifer mixed forest (p < 0.05). The differences among stands in terms of the Shannon–Wiener (F (2, 117) = 1.964; p > 0.05) and Simpson (F (2, 117) = 2.408; p > 0.05) indices were not significant (Table 6).
In the herb layers of the three stands, the differences in the species richness (F (2, 117) = 127.444; p < 0.01) and the Shannon–Wiener (F (2, 117) = 93.937; p < 0.01) and Simpson (F (2, 117) = 53.329; p < 0.01) indices between groups were significant. Multiple comparisons showed that these indices significantly differed between the P. densiflora–conifer mixed forest and the other two stands (p < 0.01). The differences among the herb layers of the three stands in terms of the Pielou indices (F (2, 117) = 2.910; p > 0.05) were not significant (Table 6).

Plant Diversity Indices among Various Vertical Structure Layers and the Same Stand Type

Overall, the species richness and the Shannon–Wiener, Simpson, and Pielou indices were higher for the herb layers than the shrub and tree layers of natural secondary Japanese red pine forests. In the P. densiflora–hardwood mixed forest, the differences in the species richness (F (2, 117) = 26.001; p < 0.01) and the Shannon–Wiener (F (2, 117) = 18.011; p < 0.01), Simpson (F (2, 117) = 15.598; p < 0.01), and Pielou (F (2, 117) = 11.601; p < 0.01) indices among groups were all significant. Multiple comparisons revealed that the latter three indices of the herb layer significantly differed from those of the shrub and tree layers (p < 0.01). The species richness significantly differed between the tree layer and the other two layers (p < 0.01). In the P. densiflora–conifer mixed forest, the differences in the species richness (F (2, 117) = 107.719; p < 0.01) and Shannon–Wiener (F (2, 117) = 177.587; p < 0.01), Simpson (F (2, 117) = 139.297; p < 0.01), and Pielou (F (2, 117) = 20.258; p < 0.01) indices among groups were all significant. Multiple comparisons revealed that the latter three indices of herb layer were significantly differed from those of the shrub and tree layers (p < 0.01). In the P. densiflora pure mixed forest, the differences in the species richness (F (2, 117) = 87.678; p < 0.01) and the Shannon–Wiener (F (2, 117) = 153.491; p < 0.01), Simpson (F (2, 117) = 166.290; p < 0.01), and Pielou (F (2, 117) = 59.575; p < 0.01) indices among groups were all significant (Table 6).

3.3. Correlation between Plant Diversity Indices and Disease Index of Diplodia Tip Blight in P. densiflora

3.3.1. Tree Layer

In the tree layer of the P. densiflora–hardwood mixed forest, the disease index of Diplodia tip blight in P. densiflora was significantly negatively correlated with the species richness and the Shannon–Wiener, Simpson, and Pielou indices (p < 0.05). In the tree layer of the P. densiflora–conifer mixed forest, the disease index of Diplodia tip blight in P. densiflora was significantly positively correlated with the Shannon–Wiener, Simpson, and Pielou indices (p < 0.05). However, the disease index of Diplodia tip blight in P. densiflora was not significantly correlated with the species richness. In the tree layer of the P. densiflora pure mixed forest, the disease index of Diplodia tip blight in P. densiflora was significantly negatively correlated with the Shannon–Wiener and Simpson indices (p < 0.05). However, there was no significant correlation between the disease index of Diplodia tip blight in P. densiflora and the species richness or the Pielou index (Table 7).

3.3.2. Shrub Layer

In the shrub layers of all three stands, the disease index of Diplodia tip blight in P. densiflora was significantly positively correlated with the Shannon–Wiener and Simpson indices (p < 0.01). However, the disease index of Diplodia tip blight in P. densiflora was not significantly correlated with the species richness or the Pielou index (Table 7).

3.3.3. Herb Layer

In the herb layer, the disease index of Diplodia tip blight in P. densiflora was significantly positively correlated with the Shannon–Wiener and Simpson indices (p < 0.05) of the P. densiflora–hardwood mixed forest and the Shannon–Wiener, Simpson, and Pielou indices of the P. densiflora–conifer mixed forest. However, the disease index of Diplodia tip blight in P. densiflora was not significantly correlated with the species richness and the Pielou index of the P. densiflora–hardwood mixed forest, the species richness of the P. densiflora–conifer mixed forest, or the species richness, and the Shannon–Wiener, Simpson, and Pielou indices of the P. densiflora pure forest (Table 7).

3.4. Generalized Linear Model Analysis between Plant Diversity Indices and Disease Index of Diplodia Tip Blight in P. densiflora in Three Japanese Red Pine Stand Types

In the P. densiflora–hardwood mixed forest, the Simpson index of the tree layer was the most significant influence on the disease index of Diplodia tip blight in P. densiflora (p < 0.05), followed by the Simpson index of the shrub layer (p < 0.01) and the Shannon–Wiener index of the tree layer (p < 0.01). The values of AIC and BIC were 94.214 and 102.659, respectively. The optimal disease index prediction model in this stand was:
y   = 43.538 11.165 x 2 11.616 x 3 + 11.195 x 7   ( p <   0.01 )  
In the P. densiflora–conifer mixed forest, the Simpson index of the herb layer was the most significant influence on the disease index of Diplodia tip blight in P. densiflora (p < 0.01), followed by the Simpson indices of the tree and shrub layers (p < 0.01). The values of AIC and BIC were 138.477 and 146.921, respectively. The optimal disease index prediction model in this stand was:
y   = 7.467 + 14.639 x 3 + 10.985 x 7 + 27.454 x 11   ( p <   0.01 )  
In the P. densiflora pure forest, the Shannon–Wiener index of the tree layer was the most significant influence on the disease index of Diplodia tip blight in P. densiflora (p < 0.01), followed by the Shannon–Wiener index of the shrub layer (p < 0.01). The value of AIC and BIC were 172.441 and 179.197, respectively. The optimal disease index prediction model in this stand was:
y   = 36.495 8.693 x 2 + 5.874 x 6   ( p <   0.01 )  

4. Discussion

In the present study, the disease index of Diplodia tip blight in the P. densiflora–conifer mixed forest was larger than the disease indices of Diplodia tip blight in the P. densiflora–hardwood mixed forest and the P. densiflora–pure mixed forest. Moreover, the disease index was positively correlated with the tree diversity indices. Similarly, Gerlach et al. [43] reported that the extent of damage caused by root rot (Armillaria sp.) rises with the increase of the proportion of coniferous species in a mixed forest. Our result was in good agreement with the associational susceptibility hypothesis that the disease severity intensifies when multiple host plants are combined [44,45,46,47]. In the P. densiflora–conifer mixed forest, there are high relative abundances of both native P. densiflora and introduced P. thunbergii. These species have a close genetic relationship and are hosts of the Diplodia tip blight pathogen. They have similar morphological, physiological, and biochemical characteristics, such as similar nutrients, which could provide enough resources to support pathogen proliferation and increase the risks of host parasitization and Diplodia tip blight epidemics in P. densiflora [48].
The present study also showed that the disease index of Diplodia tip blight in P. densiflora was lowest in the P. densiflora–hardwood mixed forest and negatively correlated with the tree diversity indices. It is in line with Karlman et al.’s [49] conclusion that certain fungal diseases in conifer are negatively correlated with the hardwood richness. This phenomenon upholds the associational resistance hypothesis that the disease severity gradually decreases with increasing tree diversity in mixed forest consisting of both host trees and non-host trees [44,46]. In the P. densiflora–hardwood mixed forest, the host tree species of S. sapinea, P. densiflora, and its non-host tree species, Q. acutissima and Q. variabilis, all have high relative abundances. Non-host trees may create form physical or chemical barriers that impede the extensive localization, spread, and colonization of the pathogen [50]. In this way, non-host trees could lower the incidence of Diplodia tip blight in P. densiflora. In addition, the increase of the relative abundance in hardwood in the P. densiflora–hardwood mixed forest diminishes the amount of resources available to the pathogen, thereby hindering its growth and population establishment [47,50,51]. For example, as there are fewer P. abies in the P. abies-Pinus sylvestris L. mixed forest than there are in the P. abies pure forest, the range and quantity of H. annosum infections on adjacent trees are reduced in the former case [20].
The disease index of Diplodia tip blight in the P. densiflora pure forest is higher than that in the P. densiflora–hardwood mixed forest and lower than that in the P. densiflora–conifer mixed forest. Furthermore, the differences among stand types were significant. Meanwhile, the disease index was negatively correlated with the tree diversity indices. As the P. densiflora pure forest has a large proportion of host-P. densiflora, the disease index there is significantly larger than that in the P. densiflora–hardwood mixed forest. However, the other tree species with ratios of cross-sectional area at breast height <30% are mainly non-host hardwoods. Therefore, the disease index of Diplodia tip blight is lower in the P. densiflora pure forest than it is in the P. densiflora–conifer mixed forest.
Based on the foregoing findings, it is speculated that there are some promotion or inhibition effects between different tree species and the disease of Diplodia tip blight in P. densiflora that need to be confirmed. Pan [16] found that Cephalcia Kunyushanica Xiao have significant positive effects with host P. densiflora and P. thunbergii, and have significant negative effects with Populus ussuriensis Kom. and Hovenia acerba Lindl. The purpose of alleviating the harm of C. Kunyushanica could be achieved by properly matching P. ussuriensis and H. acerba among hosts. Therefore, taking some forest management measures to appropriately increase non-host broad-leaved tree species could mitigate the Diplodia tip blight disease.
There were significant positive correlations between the disease index of Diplodia tip blight in P. densiflora and the plant diversity indices in the shrub–herb layers of all three stands except the understory herb layer of P. densiflora pure forest. Clearly, there may be possible explanations that because of forest resource limitations, competition between trees and understory plants might dramatically increase with shrub–herb diversity. These factors influence the host growth regulation and reduce the host resistance to the pathogen of Diplodia tip blight [30]. Another reason may be that as plant diversity increases in the shrub–herb layers, high-humidity microclimates rapidly develop in the understory environments, which favor the proliferation and dispersal of pathogen mycelia and conidia in diseased needles, shoots, and stems. [1,52]. In this manner, the infection risk of Diplodia tip blight in P. densiflora increases with decreasing host tree vigor. To control the occurrence and dispersal of Diplodia tip blight in P. densiflora, the diversity structure of the understory vegetation must be modified in natural secondary Japanese red pine forests.
Researchers in China reported that excess precipitation causes root waterlogging and poor ventilation in host trees of S. sapinea, which results in weakening of the host trees and further aggravates the occurrence of Diplodia tip blight [1,17,53]. By contrast, the occurrence of Diplodia tip blight caused by S. sapinea is different in countries such as Germany, Italy, the United States of America, and South Africa, where asymptomatic endophytic fungi become pathogen since host resistance is weakened by abiotic stresses such as precipitation deficits, elevated temperatures, drought, and hailstorms [8] (pp. 224–227), [6,54]. The above results inferred that extreme abiotic stresses increase disease susceptibility of host trees, and then lead to the prevalence of the disease. Therefore, to avoid the influence of the related abiotic factors, the effect of plant diversity on the occurrence of Diplodia tip blight in P. densiflora was analyzed in the case of relatively consistent environmental factors in the research plots.
Generalized linear model analysis revealed that the three prediction models respectively established with the Simpson indices of the tree and shrub layers and the Shannon–Wiener index of the tree layer as independent variables in the P. densiflora–hardwood mixed forest, the Simpson indices of the herb, tree, and shrub layers as independent variables in the P. densiflora–conifer mixed forest, and the Shannon–Wiener indices of the tree and shrub layers as independent variables in the P. densiflora pure mixed forest could better explain the variation of Diplodia tip blight in P. densiflora disease index in three stands. Both the Shannon–Wiener index and Simpson index contain the information of plant species richness and evenness and can reflect characteristics of plant diversity. In the practical application, the models obtained in the three stands were used to predict the disease index of Diplodia tip blight in P. densiflora, which could provide a reference for prevention and control of this disease.

5. Conclusions

Differences in the plant diversity among various stand types and vertical structure layers have different effects on the occurrence of Diplodia tip blight in P. densiflora in the Kunyu Mountains of China. In the tree layers, the occurrence of Diplodia tip blight in the P. densiflora–hardwood mixed forest and the P. densiflora pure forest upheld the associational resistance hypothesis, and that in the P. densiflora–conifer mixed forest supported the associational susceptibility hypothesis. The higher the plant diversity under the forest, the more intense competition between the pathogen host P. densiflora and shrub–herb plants, resulting in poor host disease resistance. Moreover, humid microclimates can develop and establish under the forest and facilitate the spread of the pathogen borne by diseased tissues. Plant diversity largely reflects the occurrence of Diplodia tip blight disease. However, if the effect of plant diversity on the disease is fully reflected, the plant species characteristics, especially tree genetic relationships, should be considered. Then, the plant species diversity structure may be modified through the forest management measures to lower the incidence of this disease.

Author Contributions

Conceptualization, J.L. and X.Z.; methodology, J.L. and Y.C.; validation, J.L. and Y.C.; investigation, Y.C. and X.X.; resources, J.L.; writing—original draft preparation, Y.C.; writing—review and editing, J.L. and Y.C.; project administration, J.L. All authors have read and agreed to the published version of the manuscript.

Funding

This work was supported by the National Key Research and Development Project of China (2018YFC1200400) and the National Natural Science Foundation of China (31270682).

Data Availability Statement

Not applicable.

Acknowledgments

We thank Jiming Che, Yingjun Zhang, Xiaowen Yuan, Xiaoyan Yang, Lei Feng, Xiaoming Wu, Shunuo Zhou, Lin Feng, Bin Jiang, Chunqing Li, and Chunrong Li for their help in collecting and handling the vast amount of data in the field.

Conflicts of Interest

The authors declare that they have no known competing financial interests or personal relationships that could have appeared to influence the work reported in this paper.

References

  1. Song, X.D. Sphaeropsis shoot blight of pines. In Major Forest Diseases and Insect Pests in China; Zhang, X.Y., Luo, Y.Q., Eds.; Chinese Forestry Publishing House: Beijing, China, 2003; p. 186. [Google Scholar]
  2. Jankovský, L.; Palovčíková, D. Dieback of Austrian pine—The epidemic occurrence of Sphaeropsis sapinea in southern Moravia. J. For. Sci. 2003, 49, 389–394. [Google Scholar] [CrossRef] [Green Version]
  3. Iturritxa, E.; Ganley, R.J.; Raposo, R.; García-Serna, I.; Mesanza, N.; Kirkpatrick, S.C.; Gordon, T.R. Resistance levels of Spanish conifers against Fusarium circinatum and Diplodia pinea. For. Pathol. 2013, 43, 488–495. [Google Scholar] [CrossRef]
  4. Zlatkovic, M.; Keča, N.; Wingfield, M.J.; Jami, F.; Slippers, B. New and unexpected host associations for Diplodia sapinea in the Western Balkans. For. Path. 2017, 47, 1–11. [Google Scholar] [CrossRef] [Green Version]
  5. Manzanos, T.; Aragonés, A.; Iturritxa, E. Genotypic diversity and distribution of Sphaeropsis sapinea within Pinus radiata trees from northern Spain. For. Path. 2019, 49, 1–9. [Google Scholar] [CrossRef]
  6. Bußkamp, J.; Langer, G.J.; Langer, E.J. Sphaeropsis sapinea and fungal endophyte diversity in twigs of scots pine (Pinus sylvestris) in Germany. Mycol. Prog. 2020, 19, 985–999. [Google Scholar] [CrossRef]
  7. Terhonen, E.; Babalola, J.; Kasanen, R.; Jalkanen, R.; Blumenstein, K. Sphaeropsis sapinea found as symptomless endophyte in Finland. Silva Fenn. 2021, 55, 1–14. [Google Scholar] [CrossRef]
  8. Ye, J.R.; He, W. Forest Pathology; Chinese Forestry Publishing House: Beijing, China, 2011; pp. 224–227. [Google Scholar]
  9. Bihon, W.; Slippers, B.; Burgess, T.; Wingfield, M.J.; Wingfield, B.D. Sources of Diplodia pinea endophytic infections in Pinus patula and P. radiata seedlings in South Africa. For. Pathol. 2011, 41, 370–375. [Google Scholar] [CrossRef] [Green Version]
  10. De Wet, J.; Wingfield, M.J.; Coutinho, T.; Wingfield, B.D. Characterisation of the “C” morphotype of the pine pathogen Sphaeropsis sapinea. For. Ecol. Manag. 2002, 161, 181–188. [Google Scholar] [CrossRef]
  11. Palmer, M.A. Isolate Types of Sphaeropsis sapinea associated with main stem cankers and top-kill of Pinus resinosa in Minnesota and Wisconsin. Plant Dis. 1991, 75, 507–510. [Google Scholar] [CrossRef]
  12. Dijk, H.F.G.V.; Gaag, M.V.D.; Perik, P.J.M.; Roelofs, J.G.M. Nutrient availability in Corsican pine stands in the Netherlands and the occurrence of Sphaeropsis sapinea: A field study. Can. J. Bot. 1992, 70, 870–875. [Google Scholar] [CrossRef]
  13. Wu, X.Q. Occurence and control countermeasure of Sphaeropsis sapinea shoot blight on conifer in the world. World For. Res. 1999, 12, 16–21. [Google Scholar]
  14. Stanosz, G.R.; Smith, D.R.; Albers, J.S. Surveys for asymptomatic persistence of Sphaeropsis sapinea on or in stems of red pine seedlings from seven Great Lakes region nurseries. For. Pathol. 2005, 35, 233–244. [Google Scholar] [CrossRef]
  15. Wang, R.Q.; Zhou, G.Y. Natural regeneration and developing prospects Japanese red pine forest in Shandong peninsula. J. Ecol. 1989, 8, 18–22. [Google Scholar]
  16. Pan, Q. Study on Interspecific Affinity of Cephalcia Kunyushania and Plant Species of Natural Forests in Kunyushan. Ph.D. Thesis, Chinese Academy of Forestry, Beijing, China, 2015. [Google Scholar]
  17. Zhao, S.P.; Xu, H.X.; Yang, M.M.; Gu, S.Y. Environmental triggers and control countermeasures for the occurrence of shoot blight of exotic pines. For. Pest. Dis. 1993, 3, 45–47. [Google Scholar]
  18. Paoletti, E.; Danti, R.; Strati, S. Pre- and post-inoculation water stress affects Sphaeropsis sapinea canker length in Pinus halepensis seedlings. For. Path. 2001, 31, 209–218. [Google Scholar] [CrossRef]
  19. Sherwood, P.; Villari, C.; Capretti, P.; Bonello, P. Mechanisms of induced susceptibility to Diplodia tip blight in drought-stressed Austrian pine. Tree Physiol. 2015, 35, 549–562. [Google Scholar] [CrossRef] [PubMed] [Green Version]
  20. Lindén, M.; Vollbrecht, G. Sensitivity of Picea abies to butt rot in pure stands and in mixed stands with Pinus sylvestris in southern Sweden. Silva. Fenn. 2002, 36, 767–778. [Google Scholar] [CrossRef] [Green Version]
  21. Hantsch, L.; Braun, U.; Scherer-Lorenzen, M.; Bruelheide, H. Species richness and species identity effects on occurrence of foliar fungal pathogens in a tree diversity experiment. Ecosphere 2013, 4, 1–12. [Google Scholar] [CrossRef] [Green Version]
  22. Menges, E.S.; Loucks, O.L. Modeling a disease caused patch disturbance, Oak wilt in the midwestern United States. Ecology 1984, 65, 487–498. [Google Scholar] [CrossRef]
  23. LoGiudice, K.; Duerr, S.T.K.; Newhouse, M.J.; Schmidt, K.A.; Killilea, M.E.; Ostfeld, R.S. Impact of host community composition on Lyme disease risk. Ecology 2008, 89, 2841–2849. [Google Scholar] [CrossRef]
  24. Anandaraj, M.; Mathew, S.K.; Eapen, S.J.; Cissin, J.; Bhai, R.S. Morphological and molecular intervention in identifying Phytophthora spp. causing leaf and nut fall in nutmeg (Myristica fragrans houtt.). Eur. J. Plant. Pathol. 2019, 156, 373–386. [Google Scholar] [CrossRef]
  25. Garbelotto, M.; Schmidt, D.; Popenuck, T. Pathogenicity and infectivity of Phytophthora ramorum vary depending on host species, infected plant part, inoculum potential, pathogen genotype, and temperature. Plant. Pathol. 2020, 70, 287–304. [Google Scholar] [CrossRef]
  26. Haas, S.E.; Hooten, M.B.; Rizzo, D.M.; Meentemeyer, R.K. Forest species diversity reduces disease risk in a generalist plant pathogen invasion. Ecol. Lett. 2011, 14, 1108–1116. [Google Scholar] [CrossRef] [PubMed]
  27. Xie, F.; Liang, J. The relationship between species diversity of mixed bamboo stands and the disease index of Ceratosphaeria phyllostachydis Zhang. J. Hunan Agric. Univ. 2018, 44, 520–523. [Google Scholar] [CrossRef]
  28. Liu, J.; He, W.M.; Fang, Z.L. Spatial characteristics of soil moisture and organic matter and light in Pinus tabulaeformis forest and Quercus liaotungensis forest on Dongling Mountain, Beijing, China. Acta Ecol. Sin. 2005, 25, 2954–2960. [Google Scholar]
  29. Luo, N. The Impact of the Different Stand Structure and Understory Vegetation Species Diversity on the Disease and Insect Pest of the Aquilaria Sinensis Plantations. Master’s Thesis, Central South University of Forestry and Technology, Changsha, China, 2016. [Google Scholar]
  30. Wang, X.X. The Effect of Plantations Landscape Vertical Stratification Structure on Phyllachora dalbergiicola in Dalbergia odorifera. Master’s Thesis, Central South University of Forestry and Technology, Changsha, China, 2016. [Google Scholar]
  31. Hu, R.R.; Liang, J.; Xie, X.; Zhang, Y.J.; Zhang, X.Y. Stand characteristics and soil properties in Japanese red pine (Pinus densiflora) pure forests with different disease severity index in Kunyushan Mountains region. China Int. J. Agric. Biol. 2019, 21, 726–732. [Google Scholar] [CrossRef]
  32. Xie, X.; Liang, J.; Zhang, M.; Hu, R.R.; Cheng, Y.; Zhang, X.Y. Endophytic fungal community of Pinus densiflora infected by different incidences of Sphaeropsis sapinea in a mixed coniferous forest. Int. J. Agric. Biol. 2020, 23, 1044–1050. [Google Scholar] [CrossRef]
  33. Magurran, A.E. Diversity Indices and Species Abundance Model. Ecological Diversity and Its Measurement; Magurran, A.E., Ed.; Princeton University Press: Princeton, NJ, USA, 1988; pp. 7–10. [Google Scholar]
  34. Wu, H. Comparative study of species diversity indices of different type communities. J. Cent. South. Cent. Univ. For. Technol. 2015, 35, 84–89. [Google Scholar] [CrossRef]
  35. Wang, D.B.; Ji, S.Y.; Chen, F.P. A review on the species diversity of plant community. Chin. J. Ecol. 2001, 20, 55–60. [Google Scholar]
  36. Ma, K.P.; Liu, Y.M. Methods to measure the diversity of biological community-I α diversity measurement methods (II). Chin. Biodivesity 1994, 2, 231–239. [Google Scholar]
  37. Gustavsson, E.; Lennartsson, T.; Emanuelsson, M. Land use more than 200 years ago explains current grassland plant diversity in a Swedish agricultural landscape. Biol. Conserv. 2007, 138, 47–59. [Google Scholar] [CrossRef]
  38. Shen, B.K.; Chu, X.R.; Zhang, M.H.; Xue, M.L.; Yao, C.L. The development of dieback of pines by Sphaeropsis sapinea. For. Res. 1993, 6, 157–191. [Google Scholar]
  39. Hu, R.R. Establishment and Verification of Forest Pest Based Index Model. Ph.D. Thesis, Chinese Academy of Forestry, Beijing, China, 2019. [Google Scholar]
  40. Li, Z.H.; Luo, P. SPSS Common Statistical Analysis Course, 4th ed.; Publishing House of Electronics Industry: Beijing, China, 2015; pp. 114–115. [Google Scholar]
  41. Fieller, E.C.; Pearson, E.S. Tests for rank correlation coefficients I. Biometrika 1961, 48, 29–40. [Google Scholar] [CrossRef]
  42. Hauke, J.; Kossowski, T. Comparison of values of Pearson’s and Spearman’s correlation coefficients on the same sets of data. Quaest. Geogr. 2011, 30, 87–93. [Google Scholar] [CrossRef] [Green Version]
  43. Gerlach, J.P.; Reich, P.B.; Puettman, K.; Baker, T. Species, diversity, and density affect tree seedling mortality from Armillaria root rot. Can. J. For. Res. 1997, 27, 1509–1512. [Google Scholar] [CrossRef]
  44. Tahvanainen, J.O.; Root, R.B. The influence of vegetational diversity on the population ecology of a specialized herbivore, Phyllotreta cruciferae (Coleoptera, Chrysomelidae). Oecologia 1972, 10, 321–346. [Google Scholar] [CrossRef] [PubMed]
  45. White, J.A.; Whitham, T.G. Associational susceptibility of cottonwood to a box elder herbivore. Ecology 2000, 81, 1795–1803. [Google Scholar] [CrossRef]
  46. Barbosa, P.; Hines, J.; Kaplan, I.; Martinson, H.; Szczepaniec, A.; Szendrei, Z. Associational resistance and associational susceptibility, Having right or wrong neighbors. Annu. Rev. Ecol. Evol. Syst. 2009, 40, 1–20. [Google Scholar] [CrossRef] [Green Version]
  47. Liang, J.; Zhu, Y.P.; Sun, X.Q.; Zhang, X.Y. Relationship of forest ecosystem composition and structure with management of pests. For. Pest. Dis. 2012, 31, 7–12. [Google Scholar]
  48. Zhu, Y.P. The Occurrence Mechanism of Cephalcia Kunyushanica Population. Ph.D. Thesis, Chinese Academy of Forestry, Beijing, China, 2013. [Google Scholar]
  49. Karlman, M.; Hansson, P.; Witzell, J. Scleroderris canker on lodgepole pine introduced in northern Sweden. Can. J. For. Res. 1994, 24, 1948–1959. [Google Scholar] [CrossRef]
  50. Keesing, F.; Holt, R.D.; Ostfeld, R.S. Effects of species diversity on disease risk. Ecol. Lett. 2006, 9, 485–498. [Google Scholar] [CrossRef] [PubMed]
  51. Zeng, F.Y.; Sun, Z.Q. Mechanism, hypothesis and evidence of herbivorous insect-host interactions in forest ecosystem. Acta Ecol. Sin. 2014, 34, 1061–1071. [Google Scholar] [CrossRef]
  52. Lu, X.; Nan, Z.B. Perspectives in effects of grazing on diversity of grassland plant community and forage diseases. Pratacult. Sci. 2015, 32, 1423–1431. [Google Scholar]
  53. Wu, L.; Xue, L. Studies on cedar blight. For. Pest. Dis. 1995, 1, 1–6. [Google Scholar]
  54. Luchi, N.; Oliveira Longa, C.M.; Danti, R.; Capretti, P.; Maresi, G. Diplodia sapinea: The main fungal species involved in the colonization of pine shoots in Italy. For. Pathol. 2014, 44, 372–381. [Google Scholar] [CrossRef]
Figure 1. Symptoms of local (A) and overall (B) tip blight in Pinus densiflora caused by Sphaeropsis sapinea.
Forests 12 01083 g001
Table 1. Plant disease classification standard of Diplodia tip blight in Pinus dentiflora.
Disease GradeRepresentative ValuePlant Disease Classification Standard
I0No disease symptoms
II1The lesion area is less than 25%
III2The lesion area is 25–50%
IV3The lesion area is 50–75%
V4The lesion area is more than 75%
Table 2. Relative abundance of tree species in the three stands.
Tree SpeciesRelative Abundance (%)
PHFPCFPPF
Rhus chinensis Mill.1.410.400.33
Catalpa bungei C. A. Mey0.310.07
Cryptomeria japonica var. sinensis Miquel0.26
Cunninghamia lanceolata (Lamb.) Hook.0.380.700.41
Metasequoia glyptostroboides Hu & W. C. Cheng0.04
Albizia julibrissin Durazz.0.07
Albizia kalkora (Roxb.) Prain2.130.400.96
Robinia pseudoacacia L.1.131.461.15
Castanea mollissima Bl.0.18
Quercus acutissima carr.15.965.5614.52
Quercus serrata Murray0.340.51
Quercus variabilis Bl.22.301.875.32
Larix kaempferi (Lamb.) Carr.0.090.330.07
Pinus armandii Franch.0.664.390.55
Pinus densiflora Sieb. et Zucc.47.8552.4271.04
Pinus taeda L.1.32
Pinus thunbergii Parl.6.7729.945.5
Rhamnella franguloides (Maxim.) Weberb.0.09
Cerasus serrulata (Lindl.) G. Don ex London0.06
Pyrus calleryana Dcne.0.03
Sorbus alnifolia (Sieb. et Zucc.) K. Koch0.190.04
Ailanthus altissima (Mill.) Swingle0.220.150.04
Symplocos paniculata (Thunb.) Miq.0.03
Ulmus pumila L.0.03
Note: Pinus densiflora–hardwood mixed forest, P. densiflora–conifer mixed forest, and P. densiflora pure forest are denoted as PHF, PCF, and PPF, respectively.
Table 3. Relative abundance of shrub species in the three stands.
Shrub SpeciesRelative Abundance (%)
PHFPCFPPF
Rhus chinensis Mill.29.8926.7130.02
Eleutherococcus senticosus (Rupr. Maxim.) Maxim.0.03
Blumea balsamifera (L.) DC.0.03
Lonicera japonica Thunb.0.140.30
Viburnum erosum Thunb.0.200.281.45
Celastrus orbiculatus Thunb.0.612.810.27
Euonymus oxyphyllus Miq.0.060.030.04
Rhododendron simsii Planch.0.06
Albizia kalkora (Roxb.) Prain6.943.262.97
Amorpha fruticosa L.0.251.872.07
Campylotropis macrocarpa (Bge.) Rehd.0.510.20
Cercis chinensis Bunge0.04
Indigofera kirilowii Maxim. ex Palibin29.3833.8739.41
Lespedeza bicolor Turcz.5.9412.0911.12
Pueraria montana (Lour.) Merr.0.030.05
Deutzia grandiflora Bunge5.692.733.56
Callicarpa bodinieri Levl.0.13
Lindera glauca (Sieb. et Zucc.) Bl.0.080.150.39
Lindera obtusiloba Bl.0.980.610.39
Yulania denudata (Desr.) D. L. Fu0.130.08
Grewia biloba var. parviflora (Bunge) Hand.-Mazz.3.293.313.48
Broussonetia papyrifera (Linn.) L’Her.r ex Vent.0.08
Morus alba L.0.04
Morus mongolica (Bur.) Schneid.0.050.04
Jasminum nudiflorum Lindl.0.03
Ligustrum lucidum Ait.0.110.86
Flueggea suffruticosa (Pall.) Baill.0.110.12
Rhamnella franguloides (Maxim.) Weberb.0.53
Rhamnus davurica Pall.0.060.180.16
Armeniaca sibirica (L.) Lam.0.060.03
Cerasus japonica (Thunb.) Lois.5.522.611.84
Cerasus tomentosa (Thunb.) Wall.0.110.030.12
Rosa multiflora Thunb.0.560.180.08
Rubus parvifolius L.0.700.810.12
Rubus phoenicolasius Maxim.0.450.91
Zanthoxylum schinifolium Sieb. et Zucc.2.651.670.74
Koelreuteria paniculata Laxm.0.03
Smilax china L.0.980.760.23
Smilax sieboldii Miq.1.142.020.35
Symplocos paniculata (Thunb.) Miq.2.450.300.31
Ulmus macrocarpa Hance0.030.03
Boehmeria japonica (Linnaeus f.) Miq.0.110.53
Ampelopsis humulifolia Bge.0.700.150.27
Vitis amurensis Rupr.0.17
Note: The meanings of PHF, PCF, and PPF are the same as those in Table 2.
Table 4. Relative abundance of herb species in the three stands.
Herb SpeciesRelative Abundance (%)
PHFPCFPPF
Amaranthus tricolor L.0.04
Bupleurum chinense DC.0.10
Saposhnikovia divaricata (Turcz.) Schischk.0.03
Cynanchum chinense R. Br.0.20 0.04
Cynanchum paniculatum (Bunge) Kitag.0.79 0.31 0.13
Metaplexis japonica (Thunb.) Makino0.10 0.10
Anaphalis sinica Hance0.13
Artemisia argyi Lévl. et Van.0.03 0.16 0.03
Artemisia japonica Thunb.0.24 0.10
Artemisia stechmanniana Bess.0.13 0.53
Aster hispidus Thunb.0.06
Aster indicus L.0.07
Atractylodes Lancea (Thunb.) DC.0.10 0.10
Bidens pilosa L.1.39 0.01 0.06
Carpesium cernuum L.0.03
Chrysanthemum chanetii H. Lév.0.27 0.19
Chrysanthemum indicum L.0.50 3.24 0.77
Cirsium arvense var. integrifolium C. Wimm. et Grabowski0.07
Crepidiastrum denticulatum (Hout.) Pak & Kawano0.13 0.01 0.22
Echinops grijsii Hance0.01
Elephantopus scaber L.0.03 0.10
Erigeron bonariensis L.0.03
Erigeron canadensis L.0.09 0.86
Leibnitzia anandria (L.) Turcz.0.07
Senecio scandens Buch.-Ham. ex D. Don0.03
Sonchus wightianus DC.0.24 0.48
Taraxacum mongolicum Hand.-Mazz.0.03
Brassica juncea (L.) Czern.0.03
Adenophora petiolata subsp. Hunanensis (Nannfeldt) D. Y. Hong & S. Ge2.52 1.18 2.04
Adenophora stricta Miq.0.26 0.10 0.10
Codonopsis lanceolata (Sieb. et Zucc.) Trautv.0.19
Platycodon grandiflorus (Jacq.) A. DC.0.60 0.74 0.54
Dianthus chinensis L.0.07 0.26 0.03
Gypsophila oldhamiana Miq.0.13 0.41
Pseudostellaria heterophylla (Miq.) Pax0.26
Silene conoidea L.0.03
Commelina communis L.10.39 6.16 0.26
Hylotelephium erythrostictum (Miq.) H. Ohba0.03 0.10
Orostachys fimbriata (Turcz.) A. Berger0.23 0.67
Phedimus aizoon (L.) ‘t Hart0.66 0.01 0.03
Trichosanthes kirilowii Maxim.0.03
Carex lanceolata Boott23.90 16.28 20.37
Discorea nipponica Makino0.10
Swertia bimaculata (Sieb. et Zucc.) Hook. f. et Thoms. ex C. B. Clark0.03
Belamcanda chinensis (L.) Redouté0.33 0.19
Juncus effusus L.9.63 5.71
Agastache rugosa (Fisch. et Mey.) O. Ktze.0.10
Isodon amethystoides (Benth.) H. Hara0.50
Asparagus cochinchinensis (Lour.) Merr.0.07 0.01
Convallaria majalis L.0.29
Lilium concolor var. pulchellum (Fisch.) Regel0.03 0.10
Ophiopogon japonicus (L. f.) Ker-Gawl.0.60 0.23 0.29
Polygonatum odoratum (Mill.) Druce0.01 0.06
Cocculus orbiculatus (L.) DC.0.53 2.33 1.47
Phryma leptostachya subsp. Asiatica (Hara) Kitamura0.09
Phytolacca acinosa Roxb.0.10
Arthraxon prionodes (Steud.) Dandy0.03
Arundinella hirta (Thunb.) Tanaka1.36 0.41
Deyeuxia pyramidalis (Host) Veldkamp0.33 5.15 1.88
Imperata cylindrica (L.) Beauv.7.08 18.25 14.50
Miscanthus sacchariflorus (Maxim.) Hackel0.19
Miscanthus sinensis Anderss.7.85 6.65 10.77
Oplismenus undulatifolius (Ard.) Beauv.0.86 3.92 1.79
Themeda triandra Forsk.0.51 0.92
Fallopia multiflora (Thunb.) Harald.0.10
Polygonum divaricatum L.3.21 0.67 1.34
Androsace umbellata (Lour.) Merr.0.03
Lysimachia barystachys Bunge0.13 0.10
Lysimachia fortunei Maxim.0.03
Lysimachia pentapetala Bunge0.10 2.85 1.31
Pteridium aquilinum var. latiusculum (Desv.) Underw. ex Heller10.76 9.19 9.56
Clematis florida Thunb.0.03 0.17 0.03
Fragaria vesca L.0.03
Sanguisorba applanata Yü et Li12.81 12.04 18.49
Galium odoratum (L.) Scop.0.07
Rubia cordifolia L.0.37 0.03
Rubia yunnanensis Diels0.17
Ostericum sieboldii (Miq.) Nakai0.07
Patrinia scabiosifolia Link0.03 5.57 1.66
Viola arcuata Bl.0.96 0.19 0.51
Viola philippica Cav.0.47 0.22
Alpinia japonica (Thunb.) Miq.0.45
Note: The meanings of PHF, PCF, and PPF are the same as those in Table 2.
Table 5. The total of each plant’s diversity indices for the three stands.
Stand TypeSH’DJ
PHF18.917 ± 1.682 b3.792 ± 0.205 b1.924 ± 0.070 a2.221 ± 0.137
PCF22.797 ± 3.205 a4.083 ± 0.404 a1.975 ± 0.119 a2.171 ± 0.109
PPF16.066 ± 1.419 c3.379 ± 0.216 c1.743 ± 0.097 b2.152 ± 0.164
Note: The species richness and the Shannon–Wiener, Simpson, and Pielou indices are denoted as S, H’, D, and J, respectively. The meanings of PHF, PCF, and PPF are the same as those in Table 2. The lowercase letters (a, b, c) show the significant difference between various stand types and the same vertical structure layer (p < 0.05). For non-significant differences among groups, no letters are appended to the values. All values are means ± standard deviation.
Table 6. Plant diversity indices among various stand types and vertical structure layers.
Stand TypeLayerSH’DJ
PHFTree5.388 ± 0.881 a,B1.202 ± 0.099 a,B0.624 ± 0.037 a,B0.719 ± 0.055 a,B
Shrub6.964 ± 1.182 a,A1.229 ± 0.131 B0.626 ± 0.048 B0.719 ± 0.070 a,b,B
Herb6.566 ± 0.964 b,A1.360 ± 0.144 b,A0.675 ± 0.051 b,A0.783 ± 0.079 A
PCFTree5.153 ± 1.424 a,C1.105 ± 0.218 b,B0.598 ± 0.071 a,B0.701 ± 0.071 a,B
Shrub7.366 ± 1.680 a,B1.185 ± 0.141 B0.596 ± 0.059 B0.693 ± 0.075 b,B
Herb10.278 ± 1.584 a,A1.794 ± 0.169 a,A0.781 ± 0.035 a,A0.777 ± 0.047 A
PPFTree4.075 ± 0.764 b,C0.820 ± 0.099 c,C0.436 ± 0.057 b,C0.592 ± 0.086 b,C
Shrub5.347 ± 0.936 b,B1.163 ± 0.176 B0.614 ± 0.076 B0.745 ± 0.100 a,B
Herb6.644 ± 0.893 b,A1.395 ± 0.158 b,A0.693 ± 0.059 b,A0.815 ± 0.094 A
Note: The meanings of S, H’, D, and J are the same as those in Table 5. The meanings of PHF, PCF, and PPF are the same as those in Table 2. The lowercase letters (a, b, c) show the significant difference between various stand types and the same vertical structure layer (p < 0.05). The uppercase letters (A, B, C) show the significant difference between various vertical structure layers and the same stand type (p < 0.05). For non-significant differences among groups, no letters are appended to the values. All values are means ± standard deviation (SD).
Table 7. The correlation coefficients between plant diversity indices and disease index of Diplodia tip blight in Pinus densiflora.
LayerStand TypeS-DIH’-DID-DIJ-DI
PHF−0.430 **−0.883 **−0.796 **−0.367 *
TreePCF0.2180.667 **0.672 **0.385 *
PPF−0.221−0.471 **−0.392 *−0.139
PHF−0.0240.640 **0.655 **0.259
ShrubPCF0.1140.471 **0.463 **0.196
PPF−0.1220.522 **0.444 **0.228
PHF0.1180.431 **0.397 *−0.062
HerbPCF0.2040.637 **0.660 **0.433 **
PPF−0.059−0.0060.0230.086
Note: * means p < 0.05, and ** means p < 0.01. ‘-’ before the correlation coefficient means negative correlation, and no ‘-’ means positive correlation. S-DI, H’-DI, D-DI and J-DI represent the correlation coefficients between the species richness, the Shannon–Wiener index, the Simpson index, and the Pielou index and Diplodia tip blight in Pinus densiflora, respectively.
Publisher’s Note: MDPI stays neutral with regard to jurisdictional claims in published maps and institutional affiliations.

