Abstract
Understanding the effects of soil stoichiometry and nutrient resorption on soil CO2 emissions is critical for predicting forest ecosystem nutritional demands and limitations tooptimal forest growth. In this study, we examined the effects of above- and belowground stoichiometry on soil CO2 emissions and their mediating effect on soil respiration in subtropical moso bamboo (Phyllostachys edulis) plantations. Our results showed that the soil respiration rate did not differ significantly among four bamboo stands. Nitrogen (N) and phosphorous (P) concentrations were higher in bamboo leaves than litter, whereas the C:N and C:P ratios showed the opposite trend. Significant positive correlations of soil cumulative CO2 emission with litter C:P (p = 0.012) and N:P (p = 0.041) ratios indicated that litter stoichiometry was a better predictor of soil respiration than aboveground stoichiometry. Cumulative soil CO2 emissions were significantly negatively correlated with soil microbe C:N (p = 0.021) and C:N (p = 0.036) ratios, and with soil respiratory quotients (p < 0.001). These results suggest that litter and soil stoichiometry are reliable indicators of the soil respiration rate. This study provides important information about the effects of ecosystem stoichiometry and soil microbial biomass on soil CO2 emissions and highlights them editing role of soil nutritional demands and limitations in the association between soil respiration rates and aboveground plant tissues.
1. Introduction
Ecological stoichiometry has been used to investigate plant growth, nutrient conditions, and physiological characteristics [1]. Leaf nitrogen (N) and phosphorus (P) concentrations, as well as the N:P ratio, play important roles in controlling plant photosynthesis, metabolism, and growth [2]. The foliar N:P ratio is used to evaluate plant nutrient limitations [3], where N:P ratios of 14 and 16 typically indicate N and P limitations, respectively [4]. Changes in N or P levels in various plant parts indicate functional changes in nutrient uptake and allocation [5].
Plant foliage stoichiometry, which varies widely among plant organs, litter, soil microbes, and soil, plays an important role in soil nutrient status and aboveground–belowground soil nutrient linkage [6]. The relationships between soil and foliar carbon (C):N:P stoichiometry in ecosystems can be used to investigate the roles of available nutrients in plant growth under soil nutrient limitations [7]. Plant tissue stoichiometry is constrained by belowground stoichiometry [8]. Fan et al. [9] showed that plant N:P ratios were significantly related to soil N:P ratios in Eucalyptus urophylla × grandis, Pseudosasa amabilis, and Rubus swinhoei, indicating that soil nutrients are tightly coupled to plant nutrients. Bell et al. [8] showed that plant tissue stoichiometry was related to soil and microbial stoichiometry, and that the leaf C:N ratio was positively correlated with the soil C:N ratio and negatively correlated with the soil N:P ratio. Soil microbial communities are related to the N:P stoichiometry of the plant and soil system [10]. Further studies are needed to evaluate the stoichiometry of above- and belowground compartments, and their interactions [11].
Nutrient resorption between green leaves and litter affects litter decomposition, soil respiration, nutrient mineralization, and N fixation by regulating litter quality [12]. Zhao et al. [13] showed that soil respiration is strongly influenced by changes in plant and soil stoichiometry, as well as soil enzyme activity. Soil microbial respiration is related to soil and litter C [14], and microbial respiration is positively correlated with the soil C:P ratio and C concentration; thus, microbial nutritional demands depend on soil stoichiometry [15]. However, the effects on ecosystem functions and processes, such as soil C emission, of these plant and soil stoichiometric relationships remain poorly understood [9]. Shifts in microbial biomass C, N, and P concentrations, and their stoichiometry may impact soil respiration by increasing labile soil C and altering microbial communities [13]. Ferlian et al. [11] showed that soil stoichiometry plays a more important role in soil microbial biomass and respiration than plant stoichiometry. However, little is known about the potential effects of plant and soil stoichiometry on soil microbial activity and respiration, or soil CO2 emissions [16].
Moso bamboo (Phyllostachys edulis (Carriere) J. Houzeau) is an important forest resource in southern China, occupying 3.87 × 10⁶ ha and accounting for 71.9% of the total bamboo area. Plant stoichiometry has been shown to be correlated with soil ecosystem functional characteristics, and to influence soil biogeochemical cycling processes [8]. In this study, we determined C, N, and P concentrations, and their stoichiometry, in various plant tissues and soil in a moso bamboo plantation. The main objectives of this study were to investigate the effects of C, N, and P stoichiometry of fresh leaves, litter, and soil on soil CO2 emissions, assess the relationships between soil microbes and above-and below ground stoichiometry, and determine whether above-or belowground stoichiometry is better as an indicator of soil CO2 emissions. Finally, we discussed the effects of above-and belowground stoichiometric changes on soil respiration and evaluated the influence of ecosystem stoichiometry on soil CO2 emissions by the nutrient resorption function of moso bamboo.
2. Materials and Methods
2.1. Site Description
The study site is located within Maoshanwu Nature Reserve (119°56′–120°02′ E, 30°03′–30°06′ N), Zhejiang Province, China, which has an area of 536.7 ha, a core area of 348.8 ha, and an altitude of 10–536 m. The soil type belongs to Haplic Luvisol [17] and is mainly derived from granite. The study area has atypical subtropical monsoon climate with four distinct seasons, the mean annual precipitation is approximately 1.513 mm,the annual mean sunshine duration is 1.995 h, and the frost-free period is 237 days per year. The mean annual temperature is 16.9 °C, and maximum and minimum monthly temperatures are 25.4 and 4.5 °C, respectively.
The study area has historically consisted of forest; the native forest was destroyed for agricultural development, and to meet wood and charcoal demands. The vegetation includes moso bamboo, Cunninghamia lanceolata, Pinus massoniana, natural secondary forest, and shrub forest.
2.2. Experimental Design
Four stands with similar site conditions (elevation and slope etc.,) were randomly selected within the study area in March 2014 (Table 1). Three 20 × 20 m standard plots were established in each stand. The diameter at breast height (DBH) of all trees was measured in each plot, and five sample bamboo plants were selected according to the average DBH. In March 2014 and April 2016, fresh leaves and litter were collected as the initial and final value. In July 2015 and December 2015, fresh leaves and litter were also collected as growing season and nongrowing season value. Fresh leaves of each selected sample tree were collected from four directions and then mixed into a sample with five repeated in each plot. Fresh litter samples were randomly collected by hand in each plot, divided into five parts with five repeated in each plot. Then C, N, and P concentrations were measured in the bamboo leaves and litter. Fresh leaf samples were dried for 30 min at 105 °C and litter samples were dried for 48 h at 70 °C until constant weights were attained.

Table 1.
General information of the study moso bamboo stands (mean ± SD, n = 3).
In March, 2014, July 2015, December 2015 and April 2016, six soil samples in each plot were collected at depths of at 0–10 and 10–20 cm, respectively, by “S” type using an auger (diameter, 3 cm), and then, randomly, two soil samples were mixed together to create three samples from each soil layer. All fresh soil samples were sieved through a 2 mm mesh to remove roots and visible debris, and each mixed sample was air-dried and sieved through a 0.25 mm mesh before soil nutrient analysis.
Soil respiration rates were measured using a Li-8100 soil CO2 flux system (LI-COR Inc., Lincoln, NE, USA). We randomly installed five polyvinyl chloride (PVC) collars (height, 10 cm; diameter, 20 cm) 2–3 cm above the soil surface in each subplot with as little interference as possible. The first measurements were performed 1 week after the collars had been installed to allow recovery from disturbance. All installed PVC collar remained intact throughout the experimental period, i.e., from May 2014 to April 2016. All measurements were performed on sunny days without strong wind, at 9:00–16:00 local time in all months. Each collar measurement typically lasted 6–7 min with 2 repeated, and then averaged the results. Generally, each collar was measured twice a month in the growing season and once a time in the nongrowing season.
2.3. Plant and Soil Chemical Analyses
Leaf and litter C concentrations were measured using an H2SO4-HClO4 digestion method. N concentrations were estimated using the Kjeldahl method with a UDK 152 distillation and titration unit, and a DK20 digestion unit (VELP Scientifica, Usmate, Italy). P concentrations were determined using a standard ammonium molybdate method [18]. Soil organic C (SOC) and soil total N (STN) were measured using an elemental analyzer (Elementar, Langenselbold, Germany), and soil total P (STP) was measured by wet digestion with HClO4-H2SO4, and then colorimetric ally [19]. Soil microbial biomass Cand N (SMC and SMN, respectively) were measured using achloroform fumigation-extraction method [20], which is described in detail elsewhere [21].
2.4. Data Analysis
Nutrient resorption efficiency (NRE) was estimated as follows [22]:
where NRE is N or P resorption efficiency and Xleaf and Xlitter are leaf and litter N and P concentrations, respectively.
The respiration quotient (RQ) was estimated as follows [21]:
Cumulative soil CO2 emissions (Rc, kg CO2 m–2) were estimated using the following exponential equation [23]:
where Rsi is the mean monthly soil respiration rate, ti is the time within each month (s), and 44 is the CO2 molecular mass (gmol−1).
All statistical analyses were performed using Sigma Plot (ver.12.5; SYSTAT Software Inc., San Jose, CA, USA) and SPSS software (ver.22.0; SPSS Inc., Chicago, IL, USA). One-way analysis of variance (ANOVA) was conducted to compare plant and soil nutrient and stoichiometry values among four stands. A regression analysis was used to describe the relationships between annual soil cumulative respiration, fresh leaves, and litter as well as soil stoichiometry. The significance level for all statistical tests was p ≤ 0.05. A structural equation model (SEM) was devised using the SPSSAMOS program (ver. 26.0) to estimate changes in NRE that sequentially affect soil nutrient stoichiometry, microbial activity, and soil cumulative CO2 emission.
3. Results
3.1. Plant Nutrient Contentand Stoichiometry in Leaves and Litter
We detected no significant difference in C concentrations between leaves and litter (Figure 1a). N and P concentrations were higher in leaves than litter (Figure 1b,c). The opposite trend was observed in the C:N and C:P ratios, which were lower in leaves than in litter (Figure 1d,e). The litter C:N ratio was significantly higher in Stand 2 than in Stand 3 (Figure 1d). The leaf C:P ratio was significantly higher in Stand 3 than in Stands 1 and 2, and the litter C:P ratio was higher in Stands 2 and 4 than in Stand 1. Leaf and litter N:P ratios were higher in Stands 3 and 4 than that in Stand 1 (Figure 1f). P and N resorption efficiency were significantly higher in Stand 2 than in Stands 1 and 3 (Figure 2).
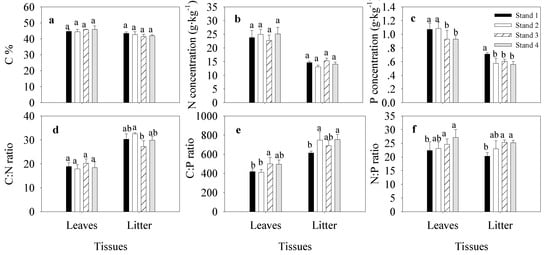
Figure 1.
Carbon (C), nitrogen (N), and phosphorous (P) concentrations, and stoichiometry, in litter and leaves of moso bamboo (Phyllostachys edulis). The error bar was the mean value of four samplings (mean ± SD, n = 4), and different lowercase letters indicate significant differences between groups (p ≤ 0.05). (a–c), is the concentration of C, N, P of leaves and litter; (d–f), is the stoichiometry of C:N ratio, C:P ratio and N:P ratio in leaves and litter.
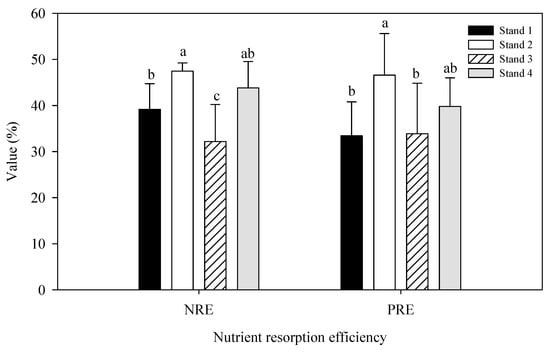
Figure 2.
N and P resorption efficiency in four moso bamboo stands. The error bar is the mean value of four samplings (mean ± SD, n = 4), and different lowercase letters indicate significant differences between groups (p ≤ 0.05).
3.2. Soil Stoichiometry Differences among Bamboo Plantations
At soil depths of 0–10 and 10–20 cm, the mean SOC values were 48.85 ± 2.78 and 44.22 ± 2.34 g kg−1, respectively. The STN values were 2.31 ± 0.11 and 2.05 ± 0.10 g kg−1, the STP values were 0.43 ± 0.09 and 0.42 ± 0.08 g kg–1, the soil C:N ratios were 12.28 ± 0.21 and 12.57 ± 0.38, the soil C:P ratios were 118.31 ± 30.20 and 110.01 ± 27.82, and the soil N:P ratios were 5.57 ± 1.33 and 5.09 ± 1.25, respectively (Figure 3).
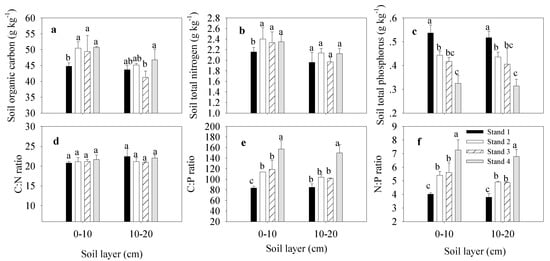
Figure 3.
Soil organic C, soil total N and soil total P concentration, as well as their stoichiometry, in moso bamboo stands. The error bar was the mean value of four samplings (mean ± SD, n = 4), and different lowercase letters indicate significant differences between groups (p ≤ 0.05). (a–c), is the concentration of soil organic carbon, soil total nitrogen, soil total phosphorus; (d–f), is the stoichiometry of C:N ratio, C:P ratio and N:P ratio in soil.
At a soil depth of 0–10 cm, the SOC concentration was significantly lower in Stand 1 than in Stands 2–4. STN was lower in Stand 1 than in all other stands. STP was similar at soil depths of 0–10 and 10–20 cm, with the highest value occurring in Stand 1 and the lowest in Stand 4. C:P and N:P ratios were similar between soil depths of 0–10 and 10–20 cm, with the highest value being in Stand 4 and the lowest in Stand 1.
3.3. Differences in Soil Microbial Biomass C and N among Bamboo Stands
At soil depths of 0–10 and 10–20 cm, soil microbial biomass carbon (MBC) values were 933.89 ± 108.22 and 564.48 ± 40.75 mg kg−1, respectively, soil microbial biomass nitrogen (MBN) values were 26.23 ± 4.14 and 17.47 ± 2.00 mg kg−1, soil MBC:MBN ratios were 36.18 ± 4.50 and 32.58 ± 3.62, and soil respiratory quotients were 3.15 ± 0.47 and 2.30 ± 0.16 (Figure 4).
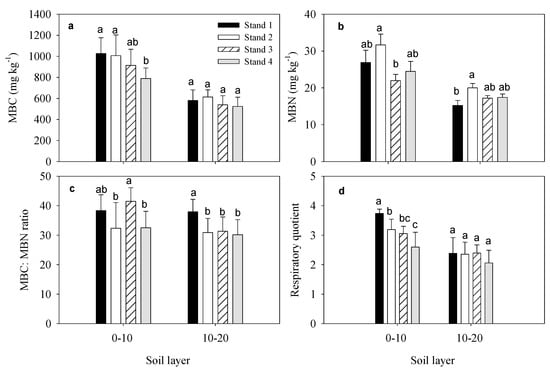
Figure 4.
Soil microbial biomass C and N, and the respiratory quotient in four moso bamboo stands. The error bar was the mean value of four samplings (mean ± SD, n = 4), different lowercase letters indicate significant differences between groups (p ≤ 0.05). (a–d), is the concentration of soil microbial biomass carbon (MBC), soil microbial biomass nitrogen (MBN), the ratio of soil microbial biomass carbon to soil microbial biomass nitrogen, respiratory quotient in soil 0–10 cm and 10–20 cm.
3.4. Soil Respiration Rates in Different Moso Bamboo Stands
We detected no significant differences in mean annual soil respiration rates among four bamboo stands (3.21, 3.51, 3.17, and 3.40 µmol m−2 s−1 in Stands 1–4, respectively; Figure 5). There was a clearly seasonal dynamic, with maximum values occurring in June or July, and minimum values occurring in January or February. The cumulative soil CO2 emission rates were 4.47 ± 0.48, 4.89 ± 0.31, 4.42 ± 0.54, and 4.75 ± 0.68 kg CO2 m−2 for Stands 1–4, respectively (Figure 6).
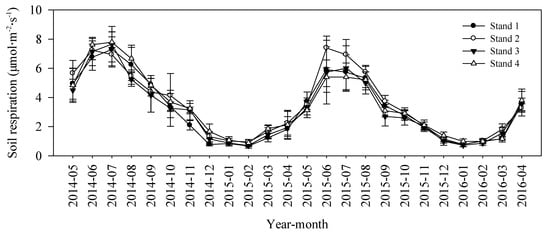
Figure 5.
Soil respiration rates monthly dynamic between May 2014 and April 2016 in four moso bamboo stands. The error bar was the mean value of three plots in each stand (mean ± SD, n = 3).
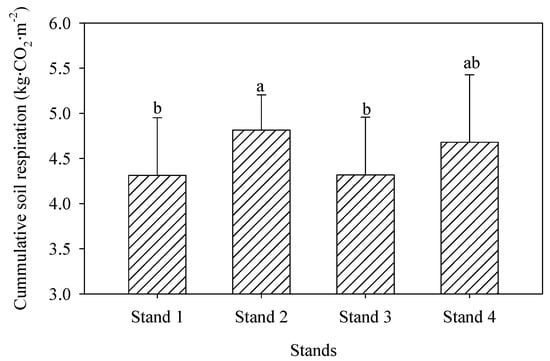
Figure 6.
Soil annual cumulative CO2 emissions in four moso bamboo stands. Different lowercase letters indicate significant differences between groups (p ≤ 0.05), and the error bars mean the average of 2 years data (mean ± SD, n = 6).
3.5. Relationships between Soil CO2 Emission and Plant as Well as Soil Stoichiometry
Significant relationships were found between soil cumulative CO2 emissions and leaf, litter, and soil stoichiometry (Figure 7 and Figure 8). Cumulative soil CO2 emissions were significantly negatively correlated with the C:N ratio (R2 = 0.39, p = 0.01) in leaves, and positively correlated with the C:P (R2 = 0.38, p = 0.012) and N:P ratios (R2 = 0.27, p = 0.041) in litter (Figure 7). Cumulative soil CO2 emissions had significant quadratic function relationships with the C:N ratio (R2 = 0.42, p = 0.028), C:P ratio (R2 = 0.49, p = 0.012) and N:P ratio (R2 = 0.38, p = 0.045) in the 0–10 cm soil layer, and negatively correlated only with the C:N ratio (R2 = 0.36, p = 0.015) in the 10–20 cm soil layer (Figure 8).
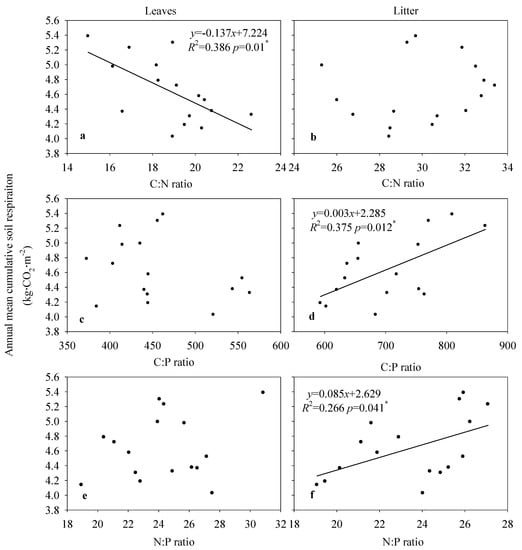
Figure 7.
Relationships between the annual mean cumulative soil respiration rate and stoichiometry in leaves and litter on moso bamboo. The data means three plots in each stand and the total mean value of each stand (n = 16). (a,c,e), is the relationships between annual mean cumulative respiration and leaves C:N ratio, C:P ratio and N:P ratio; (b,d,f), is the relationships between annual mean cumulative respiration and litter C:N ratio, C:P ratio and N:P.
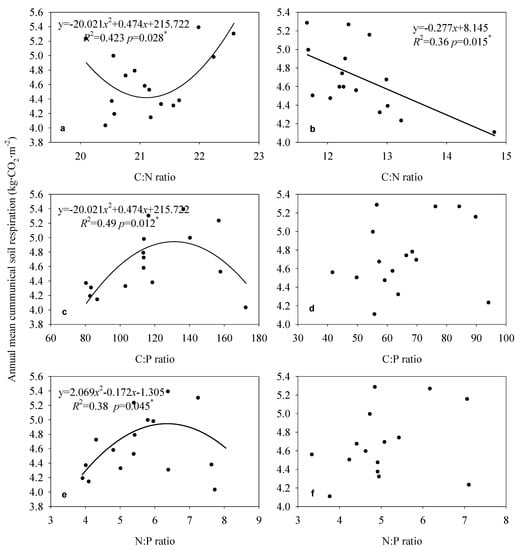
Figure 8.
Relationships between the annual mean cumulative soil respiration rate and stoichiometry in soil (0–20 cm) on moso bamboo. The data means three plots in each stand and the total mean value of each stand (n = 16). (a,c,e), is the relationships between annual mean cumulative respiration and soil C:N ratio, C:P ratio and N:P ratio in 0–10 cm; (b,d,f), is the relationships between annual mean cumulative respiration and soil C:N ratio, C:P ratio and N:P in 10–20 cm.
The structural equation model showed the interaction effect relationship of above- and belowground stoichiometry on soil cumulative CO2 emission. Cumulative soil CO2 emissions were positively correlated with N and P resorption efficiency and significantly negatively correlated SMC:SMN ratios (p = 0.036) and soil respiratory quotients (p < 0.001) (Figure 9).
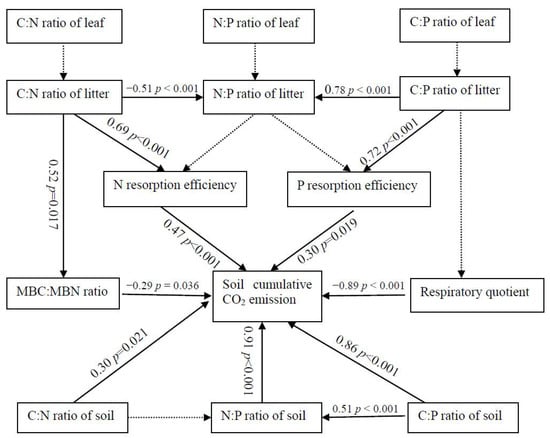
Figure 9.
Structural equation model of the effects of above- and belowground stoichiometry on soil annual cumulative CO2 emissions.
4. Discussion
4.1. Effects of Leaf and Litter Stoichiometry, and NRE, on Soil CO2 Emissions
Plant and soil stoichiometry have interactive effects on nutrient cycling [24]. Nutrient return from leaves plays a major role in decomposition by soil organisms and the processes driving soil nutrient cycling [11]. In this study, soil cumulative CO2 emissions were negatively correlated with leaf C:N ratios (p < 0.05, Figure 7a), which may therefore indirectly influence soil respiration by litter decomposition rate. These results are inconsistent with the report by Ferlian et al. [11], where soil C:N ratios were not significantly correlated with C and N concentrations in aboveground tissues or their stoichiometry, and leaf C:N ratios were therefore poor predicators of soil respiration rates. In this study, soil cumulative CO2 emissions were not significantly correlated with leaf C:P ratios, indicating that leaves were poor indicators of soil respiration rates due to large differences in nutrient content between leaves and litter (Figure 1e). Thus, leaf C:P ratios may also be poor indicators of soil respiration rates.
Litter carries nutrients between leaves and soil; this dynamic nutrient exchange maintains the balance of soil nutrients and elements needed for plant growth [25]. In this study, soil cumulative CO2 emissions were significantly related to litter N:P and C:P ratios, indicating that soil respiration rates are better reflected by litter than living foliage. More importantly, P concentrations have a greater influence than N concentrations on C:P ratios [4]. In contrast, Fanin et al. [26] showed that soil respiration rate was not related to litter stoichiometry and does not accurately reflect changes in substrate respiration. Fan et al. [9] demonstrated that soil N:P ratios were significantly correlated with plant N:P ratios in Eucalyptus urophylla × grandis, Pseudosasa ambilis, and Rubus swinhoei plantations, indicating tight coupling between soil and plant nutrients. In this study, soil cumulative CO2 emissions were not significantly related to litter C:N ratios, suggesting that soil C:N ratios are not significantly correlated with leaf litter C:N ratios due to their limited contribution to soil heterogeneity [27,28].
NRE may depend on the ratio of leaf soluble to structural nutrients [29]. Stoichiometric differences among plant tissues are attributable to N and P allocation and use efficiencies during the growing season [5]. In this study, N and P resorption efficiency were significantly related to C:N (p < 0.001) and C:P (p < 0.001) ratios in litter, but not to N:P in litter (Figure 9), suggesting that NRE values are influenced by overestimated litter N content prior to leaf senescence [29], or that P resorption efficiency is similar to that of N. Lu et al. [30] showed that N and P resorption efficiency are negatively related to N:P ratios in leaves, but positively related to N:P ratios in litter. This inconsistency may be caused by differences in NRE or soil nutrient conditions [31]. In this study, soil cumulative CO2 emissions were positively correlated with N (p < 0.001) and P resorption efficiency (p = 0.019), indicating that N and P recycling is important for soil respiration rates; plants gradually reach stoichiometric equilibrium within the leaf–litter–soil system by adjusting nutrient reabsorption capacity and soil respiration rates [25]. Future studies should explore how nutrient availability regulates litter N content through the allocation of soluble and structural leaf nutrients. Xu et al. [32] showed that resorption efficiency was significantly correlated with soil available P, indicating that plant and soil N and P content regulate nutrient resorption.
4.2. Effect of Belowground Stoichiometry on Soil CO2 Emission
A previous study showed that soil microorganisms generally have better C:N ratio homeostasis than plants [33], because the former are generally more competitive for N [34]. In this study, soil cumulative CO2 emissions showed a quadratic function with soil C:N ratios in 0–10 cm (Figure 8a, p = 0.028) and a negative correlation with soil C:N ratios in 10–20 cm (Figure 8b, p = 0.015). This result indicated that there may be a more complicated interaction effect between them for the rhizome root system of bamboo just as structural equation analysis (Figure 9). Wu et al. [35] and He et al. [36] both showed that soil respiration rates were positively correlated with soil C:N ratios (p < 0.01). Shi et al. [37] also showed that annual total CO2 emissions were positively correlated with soil C:N ratios (p < 0.05), and that the C:N ratio explained 86.5% of the variance in soil respiration. In contrast, Nguyen et al. [38] showed that soil CO2 emissions (mineralization rates) were negatively correlated with soil C:N ratios due to the higher concentration of available mineralized C. These inconsistent results show that soil cumulative CO2 emissions are directly and indirectly controlled by the amount of soil C stored, and the factors that influence this amount, such as soil moisture and temperature [37]. The relationship between soil respiration and the soil C:N ratio has also been found to depend on the C:N ratio, with a positive correlation observed at C:N ratios of 12.2–19.7 in one study [39].
Generally, soil cumulative CO2 emissions are controlled by factors that influence soil nutrients and their stoichiometry [37]. In this study, soil cumulative CO2 emissions hadquadratic function relationships with soil C:P ratio (p = 0.012) and N:P ratios (p = 0.045) in 0–10 cm (Figure 8a,b), consistent with the finding that P resorption efficiency indirectly affects soil respiration rates under limited soil P conditions at soil C:N ratios < 25 [15]. Spohn and Chodak [15] showed that soil respiration rates increase with soil C:P ratios in Fagus sylvatica L., Piceaabies L. Karst., and mixed forests dominated by both species, and with C:N ratios only in forest dominated by P. abies. He et al. [36] showed that soil respiration rates were negatively correlated with soil C:P and N:P ratios (p < 0.01). Spohn and Chodak [15] showed that soil microbial respiration was positively correlated with soil C:P ratios in Fagus sylvatica L. (R2 = 0.93) and P. abies L. Karst. (R2 = 0.80) forest soils. Nguyen and Marschner [40] showed that soil cumulative respiration rates were not influenced by changes in C:P ratios. Wei et al. [41] showed that soil cumulative CO2 emissions were negatively correlated to NH4+–N: available P ratios. Collectively, these inconsistent relationships between soil respiration and C:P ratios appear to depend on the balance between the contributions of C fluxes and soil available P, which ultimately enhances plant nutrient uptake from soil, leading to microbial decomposition of SOC [40].
4.3. Drivers of Soil Microbial Biomass and Soil CO2 Emission
Soil microorganisms play an important role in soil respiration (CO2 emission) by improving available nutrients, such that soil microbial biomass is a significant driver of soil CO2 emission [42]. He et al. [34] showed that the MBC concentration was positively related to the SOC concentration, and directly and negatively influenced fine root N concentration. Fujita et al. [43] showed that soil respiration (i.e., C flux) depends on microbial C:N stoichiometry and a high microbial C:N ratio. In this study, soil cumulative CO2 emissions were negatively correlated with the MBC:MBN ratio (Figure 9), which supports the use of this ratio as an indicator of soil respiration [13]. This result indicates tight stoichiometric coupling between soil microbial biomass and SOC, such that soil microorganisms attain low microbial C:N stoichiometry by acquiring more N [44]. Moreover, soil properties, especially MBC and MBN, regulate variation in the C:N:P stoichiometry of leaves and litter [45]. Sushko et al. [42] reported that soil respiration rates were strongly positively correlated with MBC. Yuan et al. [46] showed that soil CO2 emissions were significantly correlated with microbial biomass under N addition, indicating that soil microbial biomass is influenced by the response of microbial respiration to N addition. Microbial nutrient demand is affected by microbial biomass and nutrient stoichiometry [16].
The respiratory quotient is an important indicator of substrate quality and its influence on respiration [47,48], and reflects the relationship between the biotic and abiotic fractions of SOC [49]. In this study, soil cumulative CO2 emissions were negatively related to the respiratory quotient at a soil depth of 0–10 cm (p < 0.001, Figure 9), due to the energy required by microorganisms for the metabolic activity driving biomass synthesis [50]. Similarly, Rui et al. [51] showed that the respiratory quotient was positively correlated with soil cumulative CO2 production under light-fraction organic matter addition. In contrast, Spohn [52] showed that soil respiration was indirectly positively correlated with the respiratory quotient via the litter C:N ratio. These inconsistent results may be attributed to variation in the respiratory quotient and composition of SOC [49], reflecting changes in the labile utilization of microbial communities [53]. In this study, differences in the respiratory quotient among stands suggested differences in nutrient mineralization and the storage of potentially available nutrients, as well as microbial C use efficiency and the stability of SOC [21].
In this study, the structural equation analysis showed the effect of aboveground stoichiometry on soil CO2 emission by nutrient resorption as well as the soil microbial properties (Figure 9). Ferlian et al. [11] showed that soil C:N ratios were significantly related to soil microbial properties, but were not significantly correlated with C and N concentrations in aboveground tissues or their stoichiometry. Rivas-Ubach et al. [54] suggested that leaf-level changes in stoichiometry (e.g., the C:nutrient ratio) decreased with growth stimulated by environmental changes, whereas Ferlian et al. [11] showed that plant above- and belowground C:N ratios were weakly correlated. Therefore, these complex relationships may help to understand bamboo plantation function (e.g., rapid expansion) by above-and belowground nutrients integration and CO2 emission linkage under nutrients limitation [55,56].
5. Conclusions
In this study, soil CO2 emissions were significantly correlated with litter and soil stoichiometry rather than leaf stoichiometry, except for the C:N ratio, indicating that soil CO2 emission does not depend on aboveground plant tissue stoichiometry. Positive significant relationships between soil cumulative CO2 emissions and N (p < 0.001) and P resorption efficiency (p = 0.019) indicated a strong indirect link between aboveground (leaf) stoichiometry and soil nutrient demand. Thus, differences in soil cumulative CO2 emissionsand NRE are likely to be accompanied by changes in litter and soil stoichiometry, although this requires further investigation. Together, our results indicate that aboveground stoichiometry indirectly affects soil CO2 emission through nutrient resorption efficiency, which also helps us to understand the nutrient utilization function of moso bamboo plantations in expansion and rapid integration mechanism.
Author Contributions
Conceptualization, X.G.; methodology, X.T. and X.G.; software, M.L.; formal analysis, X.T. and X.G.; investigation, X.T.; resources, B.Z.; writing-original draft preparation, X.T., X.G. and B.Z.; project administration, M.L. and B.Z.; funding acquisition, X.G. and B.Z. All authors have read and agreed to the published version of the manuscript.
Funding
This study was supported by the Fundamental Research Funds for the Central Non-profit Research Institution (CAFYBB2020ZE001, CAFYBB2018SY015, CAFYBB2018GB001), National Natural Science Foundation of China (32071756 and 31600492), and Qianjiangyuan National Forest Ecological Research Station.
Data Availability Statement
The data are presented in this study are available on request from the corresponding author.
Acknowledgments
We thank anonymous reviewers for helpful comments that improved the original manuscript.
Conflicts of Interest
The authors declare no conflict of interest.
References
- Zechmeister-Boltenstern, S.; Keiblinger, K.M.; Mooshammer, M.; Peñuelas, J.; Richter, A.; Sardans, J.; Wanek, W. The application of ecological stoichiometry to plant-microbial-soil organic matter transformations. Ecol. Monogr. 2015, 85, 133–155. [Google Scholar] [CrossRef] [Green Version]
- Tian, D.; Yan, Z.B.; Niklas, K.J.; Han, J.K.W.X.; Reich, P.B.; Luo, Y.K.; Chen, Y.H.; Tang, Z.Y.; Hu, H.F.; Wright, L.J.; et al. Global leaf nitrogen and phosphorus stoichiometry and their scaling exponent. Natl. Sci. Rev. 2018, 5, 728–739. [Google Scholar] [CrossRef] [Green Version]
- Castellanos, A.E.; Lilano-Sotelo, J.M.; Machado-Encinas, L.I.; López-Piña, J.E.; Romo-Leon, J.R.; Sardans, J.; Peñuelas, J. Folia C, N, and P stoichiometry characterize successful plant ecological strategies in the Sonoran Desert. Plant Ecol. 2018, 219, 775–788. [Google Scholar] [CrossRef] [Green Version]
- Güsewell, S. N:P ratios in terrestrial plants: Variation and functional significance. New Phytol. 2004, 164, 243–266. [Google Scholar] [CrossRef]
- Li, H.L.; Crabbe, J.C.; Xu, F.L.; Wang, W.L.; Ma, L.H.; Niu, R.L.; Gao, X.; Li, X.X.; Zhang, P.; Ma, X.; et al. Seasonal variations in carbon, nitrogen and phosphorus concentrations and C:N:P stoichiometry in different organs of a Larixprincipis-rupprechtii Mayr. plantation in the Qinling Mountains, China. PLoS ONE 2017, 12, e185163. [Google Scholar]
- Ren, C.J.; Zhao, F.Z.; Kang, D.; Yang, G.H.; Han, X.H.; Tong, X.G.; Feng, Y.Z.; Ren, G.X. Linkages of C:N:P stoichiometry and bacterial community in soil following afforestation of former farmland. For. Ecol. Manag. 2016, 376, 59–66. [Google Scholar] [CrossRef]
- Müller, M.; Oelmann, Y.; Schickhoff, U.; Böhner, J.; Scholten, T. Himalayan Treeline soil and foliar C:N:P stoichiometry indicate nutrient shortage with elevation. Geoderma 2017, 291, 21–32. [Google Scholar] [CrossRef] [Green Version]
- Bell, C.; Carrillo, Y.; Boot, C.M.; Rocca, J.D.; Pendall, E.; Wallenstein, M.D. Rhizosphere stoichiometry: Are C:N:P ratios of plants, soils, and enzymes conserved at the plant species-level? New Phytol. 2014, 201, 505–517. [Google Scholar] [CrossRef] [PubMed]
- Fan, H.B.; Wu, J.P.; Liu, W.F.; Yuan, Y.H.; Hu, L.; Cai, Q.K. Linkages of plant and soil C:N:P stoichiometry and their relationships to forest growth in subtropical plantations. Plant Soil 2015, 392, 127–138. [Google Scholar] [CrossRef]
- Ren, C.J.; Chen, J.; Deng, J.; Zhao, F.Z.; Han, X.H.; Yang, G.H.; Tong, X.G.; Feng, Y.Z.; Shelton, S.; Ren, G.X. Response of microbial diversity to C:N:P stoichiometry in fine root and microbial biomass following afforestation. Biol. Fertil. Soils 2017, 53, 457–468. [Google Scholar] [CrossRef]
- Ferlian, O.; Wirth, C.; Eisenhauer, N. Leaf and root C-to-N ratios are poor predictors of soil microbial biomass C and respiration across 32 tree species. Pedobiologia 2017, 65, 16–23. [Google Scholar] [CrossRef] [Green Version]
- Sistla, S.A.; Schimel, J.P. Stoichiometric flexibility as a regulator of carbon and nutrient cycling in terrestrial ecosystems under change. New Phytol. 2012, 196, 68–78. [Google Scholar] [CrossRef]
- Zhao, F.Z.; Wang, J.Y.; Zhang, L.; Ren, C.J.; Han, X.H.; Yang, G.H.; Doughty, R.; Jian Deng, J. Understory plants regulate soil respiration through changes in soil enzyme activity and microbial C, N, and P stoichiometry following afforestation. Forests 2018, 9, 436. [Google Scholar] [CrossRef] [Green Version]
- Heuck, C.; Weig, A.; Spohn, M. Soil microbial biomass C:N:P stoichiometry and microbial use of organic phosphorus. Soil Biol. Biochem. 2015, 85, 119–129. [Google Scholar] [CrossRef]
- Spohn, M.; Chodak, M. Microbial respiration per unit biomass increases with carbon-to-nutrient ratios in forest soils. Soil Biol. Biochem. 2015, 81, 128–133. [Google Scholar] [CrossRef]
- Sinsabaugh, R.; Hill, B.H.; Shah, J.J.F. Ecoenzymatic stoichiometry of microbial organic nutrient acquisition in soil and sediment. Nature 2009, 462, 795–798. [Google Scholar] [CrossRef]
- FAO. Global Forest Resources Assessment 2015: How are the World’s Forests Changing? Food and Agricultural organization of the United Nations: Rome, Italy, 2016. [Google Scholar]
- Kuo, S. Phosphorus. In Methods of Soil Analysis. Part 3. Chemical Methods; Sparks, D.L., Ed.; Soil Science Society of America and American Society of Agronomy: Madison, WI, USA, 1996; pp. 869–920. [Google Scholar]
- Bao, S.D. Soil and Agricultural Chemistry Analysis; China Agriculture Press: Beijing, China, 2000. (In Chinese) [Google Scholar]
- Vance, E.D.; Brookes, P.C.; Jenkinson, D.S. An extraction method for measuring soil microbial biomass C. Soil Biol. Biochem. 1987, 19, 703–707. [Google Scholar] [CrossRef]
- Chen, J.H.; Sun, X.; Zheng, J.F.; Zhang, X.H.; Liu, X.Y.; Bian, R.J.; Li, L.Q.; Cheng, K.; Zheng, J.W.; Pan, G.X. Biochar amendment changes temperature sensitivity of soil respiration and composition of microbial communities 3 years after incorporation in an organic carbon-poor dry cropland soil. Biol. Fertil. Soils 2018, 54, 175–188. [Google Scholar] [CrossRef]
- Aerts, R. Nutrient resorption from senescing leaves of perennials: Are there general patterns? J. Ecol. 1996, 84, 597–608. [Google Scholar] [CrossRef]
- Ge, X.G.; Cao, Y.H.; Zhou, B.Z.; Wang, X.M.; Yang, Z.Y.; Li, M.H. Biochar addition increases subsurface soil microbial biomass but has limited effects on soil CO2 emissions in subtropical moso bamboo plantations. Appl. Soil Ecol. 2019, 142, 155–165. [Google Scholar] [CrossRef]
- Elser, J.J.; Fagan, W.F.; Kerkhoff, A.J.; Swenson, N.G.; Enquist, B.J. Biological stoichiometry of plant production: Metabolosm, scaling and ecological response to global change. New Phtol. 2010, 186, 593–608. [Google Scholar] [CrossRef] [PubMed] [Green Version]
- Hessen, D.O.; Ǻgren, G.I.; Anderson, T.R.; Elser, J.J.; De Ruiter, P.C. Carbon sequestration in ecosystems: The role of stoichiometry. Ecology 2004, 85, 1179–1192. [Google Scholar] [CrossRef]
- Fanin, N.; Hättenschwiler, S.; Barantal, S.; Schimann, H.; Fromin, N. Does variability in litter quality determine soil microbial respiration in an Amazonian rainforest? Soil Biol. Biochem. 2011, 43, 1014–1022. [Google Scholar] [CrossRef]
- Suo, Y.Y.; Yuan, Z.Q.; Lin, F.; Wang, X.G.; Ye, J.; Bai, E.; Hao, Z.Q. Local-scale determinants of elemental stoichiometry of soil in an old-growth temperate forest. Plant Soil 2016, 408, 401–414. [Google Scholar] [CrossRef]
- Uriarte, M.; Turner, B.L.; Thompson, J.; Zimmerman, J.K. linking spatial patterns of leaf litter fall and soil nutrients in a tropical forest: A neighborhood approach. Ecol. Appl. 2015, 25, 2022–2034. [Google Scholar] [CrossRef] [Green Version]
- Billings, S.A.; Zitzer, S.F.; Weatherly, H.; Schaeffer, S.M.; Charlet, T.; Arnone III, J.A.; Evans, R.D. Effects of elevated carbon dioxide on green leaf tissue and leaf litter quality in an intact Mojave Desert ecosystem. Glob. Chang. Biol. 2003, 9, 729–735. [Google Scholar] [CrossRef] [Green Version]
- Lu, J.Y.; Liu, M.G.; Yang, M.; Xie, J.H.; Yang, H.M.; Li, L.L. Leaf resorption and stoichiometry of N and P of 1, 2 and 3 year-old lucerne under one-time P fertilization. Soil Till. Res. 2020, 197, 104481. [Google Scholar] [CrossRef]
- Tong, R.; Zhou, B.Z.; Jiang, L.N.; Ge, X.G.; Cao, Y.H. The growth of Chinese fir is limited by nitrogen: Evidences from N:P ratio, N or P variability and NuRE based on a regional investigation. For. Ecol. Manag. 2020, 460, 117950. [Google Scholar] [CrossRef]
- Xu, M.P.; Zhong, Z.K.; Sun, Z.Y.; Han, X.H.; Ren, C.J.; Yang, G. Soil available phosphorus and moisture drive nutrient resorption patterns in plantations on the Loess Plateau. For. Ecol. Manag. 2020, 461, 117910. [Google Scholar] [CrossRef]
- Yu, Q.; Elser, J.J.; He, N.P.; Wu, H.H.; Chen, Q.S.; Zhang, G.M.; Han, X.G. Stoichiometric homeostasis of vascular plants in the Inner Mongolia grassland. Oecologia 2011, 166, 1–10. [Google Scholar] [CrossRef] [PubMed]
- He, X.J.; Hou, E.Q.; Liu, Y.; Wen, D.Z. Altitudinal patterns and controls of plant and soil nutrient concentrations and stoichiometry in subtropical China. Sci. Rep. 2016, 6, 24261. [Google Scholar] [CrossRef] [Green Version]
- Wu, X.; Xu, H.; Tuo, D.F.; Wang, C.; Fu, B.J.; Lv, Y.H.; Liu, G.H. Land use change and stand age regulate soil respiration by influencing soil substrate supply and microbial community. Geodema 2020, 359, 113991. [Google Scholar] [CrossRef]
- He, H.; Xia, G.T.; Yang, W.J.; Zhu, Y.P.; Wang, G.D.; Shen, W.B. Response of soil C:N:P stoichiometry, organic carbon stock, and release to wetland grasslandification in Mu Us Desert. J. Soil Sediment 2019, 19, 3954–3968. [Google Scholar] [CrossRef]
- Shi, W.Y.; Yan, M.J.; Zhang, J.G.; Guan, J.H.; Du, S. Soil CO2 emissions from five different types of land use on the semiarid Loess Plateau of China, with emphasis on the contribution of winter soil respiration. Atmos. Environ. 2014, 88, 74–82. [Google Scholar] [CrossRef]
- Nguyen, T.T.; Cavagnaro, T.R.; Ngo, H.T.N.; Petra Marschner, P. Soil respiration, microbial biomass and nutrient availability in soil amended with high and low C/N residue-influence of interval between residue additions. Soil Biol. Biochem. 2016, 95, 189–197. [Google Scholar] [CrossRef]
- Martin, J.G.; Bolstad, P.V.; Ryu, S.R.; Chen, J.Q. Modeling soil respiration based on carbon, nitrogen, and root mass across diverse Great Lake forests. Agric. For. Meteorol. 2009, 149, 1722–1729. [Google Scholar] [CrossRef]
- Nguyen, T.T.; Marschner, P. Soil respiration, microbial biomass and nutrient availability in soil after addition of residues with adjusted N and P concentrations. Pedosphere 2017, 27, 76–85. [Google Scholar] [CrossRef]
- Wei, X.M.; Zhu, Z.K.; Liu, Y.; Luo, Y.; Deng, Y.W.; Xu, X.L.; Liu, S.L.; Richter, A.; Shibistova, O.; Guggenberger, G.; et al. C:N:P stoichiometry regulates soil organic carbon mineralization and concomitant shifts in microbial community composition in paddy soil. Biol. Fertil. Soils 2020, 56, 1093–1107. [Google Scholar] [CrossRef]
- Sushko, S.; Ananyeva, N.; Ivashchenko, K.; Vasenev, V.; Kudeyarov, V. Soil CO2 emission, microbial biomass, and microbial respiration of woody and grassy areas in Moscow (Russia). J. Soil Sediment 2019, 19, 3217–3225. [Google Scholar] [CrossRef]
- Fujita, Y.K.; Witte, J.P.M.; Van Bodegom, P.M. Incorporating microbial ecology concepts into global soil mineralization models to improve predictions of carbon and nitrogen fluxes. Glob. Biogeochem. Cycles 2014, 28, 223–238. [Google Scholar] [CrossRef]
- Fierer, N.; Strickland, M.S.; Liptzin, D.; Bradford, M.A.; Cleveland, C.C. Global patterns in belowground communities. Ecol. Lett. 2009, 12, 1238–1249. [Google Scholar] [CrossRef]
- Yang, Y.; Liu, B.R.; An, S.S. Ecological stoichiometry in leaves, roots, litters and soil among different plant communities in a desertified region of northern China. Catena 2018, 166, 328–338. [Google Scholar] [CrossRef]
- Yuan, X.B.; Niu, D.C.; Gherardi, L.A.; Liu, Y.B.; Wang, Y.; Elser, J.J.; Fu, H. Linages of stoichiometric imbalance to soil microbial respiration with increasing nitrogen addition: Evidence from a long-term grassland experiment. Soil Biol. Biochem. 2019, 138, 107580. [Google Scholar] [CrossRef]
- Patterson, A.E.; Arkebauer, R.; Quallo, C.; Heskel, M.A.; Li, X.M.; Boelman, N.; Griffin, K.L. Temperature response of respiration and respiratory quotients of 16 co-occurring temperate tree species. Tree Physiol. 2017, 38, 1319–1332. [Google Scholar] [CrossRef]
- Araújo, A.S.F.; Santos, V.B.; Monteiro, R.T.R. Responses of soil microbial biomass and activity for practices of organic and conventional farming systems in Piauí state, Brazil. Eur. J. Soil Biol. 2008, 44, 225–230. [Google Scholar] [CrossRef]
- Wong, V.N.L.; Dalal, R.C.; Greene, R.S.B. Salinity and sodicity effects on respiration and microbial biomass of soil. Biol. Fertil. Soils 2008, 44, 943–953. [Google Scholar] [CrossRef]
- Roohi, M.; Riaz, M.; Arif, M.S.; Shahzad, S.M.; Yasmeen, T.; Riaz, M.A.; Tahir, S.; Mahmood, K. Varied effects of untreated textile wastewater onto soil carbon mineralization and associated biochemical properties of a dryland agricultural soil. J. Environ. Manag. 2016, 183, 530–540. [Google Scholar] [CrossRef]
- Rui, Y.C.; Murphy, D.V.; Wang, X.L.; Hoyle, F.C. Microbial respiration, but not biomass, responded linearly to increasing light fraction organic matter input: Consequences for carbon sequestration. Sci. Rep. 2016, 6, 35496. [Google Scholar] [CrossRef] [Green Version]
- Spohn, M. Microbial respiration per unit microbial biomass depends on litter layer carbon-to-nitrogen ratio. Biogeosciences 2015, 12, 817–823. [Google Scholar] [CrossRef] [Green Version]
- Li, W.H.; Zhang, C.B.; Gao, G.J.; Zan, Q.J.; Yang, Z.Y. Relationship between Mikania micrantha invasion and soil microbial biomass, respiration and functional diversity. Plant Soil 2007, 296, 197–207. [Google Scholar] [CrossRef]
- Rivas-Ubach, A.; Sardans, J.; Pérez-Trujillo, M.; Estiarte, M.; JosepPeñuelas, J. Strong relationship between elemental stoichiometry and metabolome in plants. Proc. Natl. Acad. Sci. USA 2012, 109, 4181–4186. [Google Scholar] [CrossRef] [PubMed] [Green Version]
- Chen, Z.H.; Li, Y.C.; Chang, S.X.; Xu, Q.F.; Li, Y.F.; Ma, Z.L.; Qin, H.; Cai, Y. Linking enhanced soil nitrogen mineralization to increased fungal decomposition capacity with Moso bamboo invasion of broadleaf forests. Sci. Total Environ. 2021, 771, 144779. [Google Scholar] [CrossRef] [PubMed]
- Tian, X.K.; Wang, M.Y.; Meng, P.; Zhang, J.S.; Zhou, B.Z.; Ge, X.G.; Yu, F.H.; Li, M.H. Native bamboo invasions into subtropical forests alter microbial communities in litter and soil. Forests 2020, 11, 314. [Google Scholar] [CrossRef] [Green Version]
Publisher’s Note: MDPI stays neutral with regard to jurisdictional claims in published maps and institutional affiliations. |
© 2021 by the authors. Licensee MDPI, Basel, Switzerland. This article is an open access article distributed under the terms and conditions of the Creative Commons Attribution (CC BY) license (https://creativecommons.org/licenses/by/4.0/).