Abstract
The process of sorting softwood raw materials is aimed at full automation. Techniques such as laser and optical scanning, used in measuring and sorting wood raw material with the layer of bark, are based on an analysis of the external shape of the log. The consequence of this is the use of constant ranges of bark deductions, which are often affected by errors resulting from averaging the values. The thickness of the bark is influenced by many factors, such as the tree species and the quality of habitat in which the trees have grown. In the case of pine wood, the range of adopted diametral intervals for the processed raw material plays a significant role. The analysis of the automatic sorting results showed numerous cases of a log-size mismatch. In methods that assume the measurement of wood with the bark, deductions for bark should be made based on experiments that take into account the raw resources base. Despite the high correlation between the size of the deduction and the average thickness of the bark (r = 0.85), the mean value of an error of the adjustment to the maximum thickness of the bark in the automatic sorting was 45%. The maximum bark thickness for the analyzed sorting intervals was correlated. The level of the correlation coefficient value was r = 0.72. In order to increase the accuracy of the sorting process, the value of the deduction for bark should be adjusted to the maximum values in each sorting group.
1. Introduction
The automation of sorting timber representing various tree species and habitats in sawmills is often based on the use of 3D, triangulation, or X-ray laser scanners. These devices are applied for the quantitative and dimensional classification of logs, optimizing their diametral and length divisions [1,2,3,4]. In the most commonly used optical measurements systems, the spatial coordinates of a log front surface are read out at high resolution. The measured values make it possible to determine the variable geometry of the log surface. Moreover, the optical scanners allow for the automatic sorting of logs taking into account the characteristics of a specific tree species and the effect of a given habitat. The logs are classified and sorted considering variable parameters defining the log geometry, such as diameter, taper, surface irregularities or flattening [5,6,7,8,9,10]. The application of primary data to control the programs of shading scanners and 3D laser point scanners allows the sorting of roundwood obtained from selected forest stands [11,12]. The use of logistic regression to adjust the thickness of wood raw material as a classification method is based on the accuracy of the model characterizing the quality features and the shape of the log. Its assessment is based on the measurement of the ROC curve (receiver operating characteristic curve) [13,14,15,16,17]. For modeling the criteria of wood logs sorting, the evaluation of the share of features attributed to individual tree species, the origin of the raw material and the occurring deformations in the shape of the log in the process of automatic imaging are used. The results are corrected by applying variable correction parameters generated from the data interpolated for the scanner settings.
A proper preparation of the logs for processing is crucial for the pretreatment step in the sawmill industry. It is particularly important to correctly measure the logs and to ensure the accuracy of sorting at the level that matches the selected sawing technology. Among the factors affecting the measurement indicators of logs at the sorting stage, there is, e.g., a form of prepared raw material [18,19,20,21,22,23]. The most common form of raw material is logs with the bark still left on the side, which are then transported to the automatic sorting. The earlier debarking of the raw material is justified only in the case of its direct transfer to sawing right after sorting. With the passage of time, the debarked raw material becomes more exposed and susceptible to, for example, drying out, discoloration or other biotic factors. Modern automatic sorting lines determine the proper selection of logs and the way of their manipulation. These lines guarantee a high accuracy of sorting (at the level of 92–95%) on the basis of the outer diameter measurements. Such accuracy is achievable due to the use of measurement systems characterized by a high degree of conversion of the actual measurements to the indicators of shape correction. Moreover, the additional advantage of the automatic lines is their high quantitative efficiency, exceeding even several hundreds of pieces per shift [24,25,26].
Sorting the wood raw material which was not debarked before leads to the necessity of applying the deductions resulting from the share or the thickness of the bark in individual size and type ranges of the roundwood [27,28,29,30,31,32]. The bark is a natural layer covering the trunk with a thickness depending, among others, on the tree species [33,34,35,36,37]. Furthermore, the bark thickness among the same tree species may vary depending on habitat. In the case of mature trees, the ratio of bark mass to wood mass is considered to be a constant parameter; for example, for Scots pine, it amounts to approximately 12% [38,39,40,41].
A geometric description of the change in bark thickness around the log is a parameter that influences the volume of roundwood. Its estimates vary by species, habitat and geographic region. In the automatic sorting process, it is recommended that the individual sawmills should verify and develop their own classification models for the thickness of the bark adjusted to their deliveries and the sorting criteria. The possibility of using an automatic sorting process in order to increase the financial efficiency has been previously demonstrated in the case of softwood, where high limitations for the curvature and the cross-sectional deformations were required [6,9,42].
The aim of the study was to analyze the effect of the variable diametral structure of the sorted pine roundwood on the sorting accuracy with the inclusion of the share of bark deduction for the selected types of raw material. The study verified the results of automatic sorting with the actual measurements of roundwood diameter (with and without the layer of bark) assuming the sorting intervals given in inches. The accuracy of sorting logs in the automatic system was determined, taking into account the applied deductions for bark assumed according to the standard used in Poland.
2. Materials and Methods
The research was conducted at a sawmill processing pine timber Koszalińskie Przedsiębiorstwo Przemysłu Drzewnego (KPPD) Szczecinek S.A. Scots pine wood (Pinus sylvestris L.) in the age class IV (60–70 years old) was harvested and transported to sawmill from the coniferous habitat (podzolic soils–various-grained sands, deep and fresh with the thin layer of acidic humus) in Kalisz Pomorski (53°17′5.416″ N, 15°53′9.228″ E) forest district. The selected habitat represented a typical stand for Scots pine, which was the object of the study. The conducted research is a reference element for further cycles of tests concerning the influence of the habitat on the variability of bark thickness. The selected pieces of roundwood were divided into three-meter-long logs with the use of a circular saw (ø 2200 mm) and directed to the sorting station. In total, 11,680 pieces of logs were sorted automatically using a SPRINGER sorting line. The speed of the log conveyors on the main sorting line was 150 m/min. Measurements were conducted with the use of an optical-laser system and processed with Microtec software. The diameters of logs were determined based on the distance between the measuring laser beam from the optical system and the surface of the log with the precision of 1 mm. The acquired data were additionally processed into an image in three dimensions. On the basis of the top log diameter, the test material was divided into 11 groups. The lowest of the groups (stated in inches) was 7″ and ranged up to 8″. The intervals of the next groups increased by 1″ up to the last group containing logs with diameters of 17″ and larger. The selection of thickness classes resulted from the sorting ranges used in the sawmill where the experiments were performed. At the same time, it allows for the isolation of a minimum, representative number of logs for testing. The diameters of logs were measured with the bark not removed, and for its reduction, the modified deductions corresponding to the requirements of the PN-D-95000 [43] standard were applied. In the last stage, the logs were sorted into proper boxes in order to perform manual measurements (Table 1). Although the normative reduction for bark thickness concerns the half-length diameter, in this case, this relationship was related to the bark thickness measured at the top of the log. The cross-cut end of the top of the log obtained during the manipulation and preparation allowed the exposure of the bark layer and the determination of its thickness without removal.

Table 1.
Diametral groups and the applied bark deduction.
Every piece of log was measured in terms of determining the following parameters: top log diameter with bark, top log diameter without bark and thickness of the bark layer. The measurements were performed perpendicularly to the length of the trunk at the top end according to PN-D-95000 [43] using a caliper with a precision of 1 mm. This method consists of making the measurement at the point with the smallest thickness, then another measurement at the point with the greatest thickness and ultimately taking the average value into account. The results were assigned to individual sorting groups considering the impact of the number of logs on the level of sorting accuracy. The variability of bark thickness depending on the log diameter was determined. Moreover, the percentage accuracy of sorting was calculated for each of the established group. The results were statistically verified using Spearman’s method for a significance level of α = 0.05.
3. Results
3.1. Results of the Log Diameter Measurements
The results of the determinations concerning the accuracy of measurements performed during the automatic sorting of logs within the established diametral groups are presented in Table 2.
Table 2.
The compliance between the automatic sorting results and the manual measurements.
The analysis of the compliance of automatic sorting results was based on their comparison with the manual measurements results and on the methodically assumed bark deductions. The level of matching of the sorting accuracy to the number of measured logs according to Spearman’s correlation coefficient was r = −0.419 which confirms that the correlation is significant.
The study determined the level of overestimation and underestimation of actual bark diameter measurement results in relation to the bark thickness intervals in pine logs.
In the first diametral group (7″), all of the logs were matched within the range of automatic sorting results. In the sorting groups 8″, 9″, 10″, 12″ and 15″, the compliance regarding the diameter was in the range between 51% and 70%. The remaining logs did not reach the assumed diameter, and they should be assigned to the lower dimensional groups. The share of correctly sorted logs in the groups 11″ and 14″ was 48% and 40%, respectively, which means that 47–51% of logs were over-measured. In the group labeled as 16″, only 42% of logs were matched; 39% of them should be assigned to the 17″ group and the remaining 19% were over measured.
The assumed accuracy of the automatic sorting was achieved only in the groups 7″ and 17″, where all the logs matched the established ranges. The reason was that these were characterized by wider ranges when compared to other groups. The lowest accuracy of automatic sorting was noted in group 13″, where only 33% of logs matched the adopted range, 62% of them did not reach the required diameter and 5% exceeded the maximum value. Overall, among the remaining groups, the sorting accuracy was between 40% and 65%.
3.2. Analysis of the Bark Thickness
The results of Spearman’s correlation for the 11 observed groups, taking into account the deduction for the bark and the mean values of the diameter determined during sorting, was as follows r = 0.0905. The accuracy of the diametral sorting was based on the measurement of the actual bark thickness for each group. The control measurements presented in Table 3 indicate greater differentiation in the thickness of the bark than it was assumed in the applied scale. In group 15″, the minimal bark thickness was 0.2 cm, maximal value was 3.0 cm with the standard deviation of 0.6 cm. The smallest dispersion of values occurred in group 7″, where the actual value of the thickness of the bark ranged between 0.2 and 1 cm (average value of 0.4 cm) with a variation of 50%.
Table 3.
The results of manual measurements of logs.
The variability in the values of the average bark thickness is a function of the log thickness within the established sorting groups ranging from 7″ to 17″. The limits of the distribution of the average bark thickness can be described by the function y(min) and y(max) presented in Figure 1.
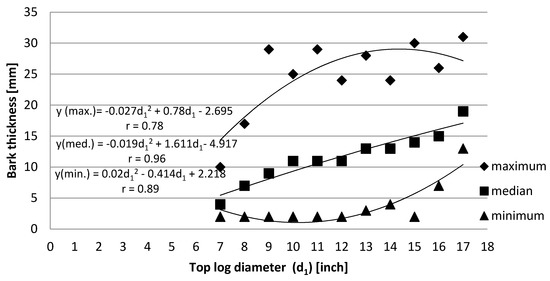
Figure 1.
The distribution of an average bark thickness in the 7″ to 17″ sorting ranges.
For the considered range of diameters, the average values of the deduction for the bark can be described by a function y(med.) = −0.019d12 + 1.611d1 − 4.917. The coefficient of correlation was characterized by a high value of r = 0.96. Such adjustment of the parameter describing the deduction for the bark assumed for the individual diametral groups was affected by the average value of the standard deviation for the bark measurement of 0.2–0.6 cm. The limits of the bark deduction lie within the wide range limited by the following equations: y(min) = 0.02d12 − 0.414d1 + 2.218 for the correlation coefficient of r = 0.89 and y(max) = −0.027d12 + 0.78d1 − 2.695 for r = 0.78.
The studies confirmed that the distribution of the bark thickness results varied depending on the considered diametral range. For the range of 12″ to 13″, the dispersion value was within the limit of 2.57 cm.
The way to improve the sorting accuracy in the investigated diametral ranges is to modify the value of the deductions for the bark in order to make them correspond with the maximum dimensions of the bark in the individual sorting groups. The compliance between the values of the deduction for the bark applied in the study and the actual maximum thickness was, according to Spearman’s correlation, at the level of r = 0.53. The use of the maximum value may reduce the chance of an error consisting in a wrong assignment to the sorting group. Table 4 presents a summary of the corrected deductions for the bark (labeled as A), which showed the adjustment to the changing bark thickness at the level of r = 0.68. In the case of a correction for the bark deduction, a measurement error at the level of r = 0.68 was observed.
Table 4.
The adjustment of the bark thickness in automatic measurements with the bark deduction according to modified PN-D-9500 [43] applied.
Parameter B is an example of the adjustment of the automatic sorting with the upper limits of the bark deduction. In this case, the correlation with the mean values of the cortical thickness was r = 0.64. Underestimating the limit values of the deduction during the sorting process has a negative effect on the compliance of the logs to the applied sawing programs.
While analyzing the results of an error associated with the automatic adjustment of the average deduction value and the accuracy of the automatic sorting, the correlation coefficient between these parameters at the level of r = 0.48 was observed (Guilford’s classification). It resulted from the error in matching the assumed diametral range, as well as both the accumulation of defects in the structure of wood and the measuring accuracy of the scanning devices, which was not verified in the conducted experiments.
The application of modified limits for bark deductions labeled as A led to the increase in sorting accuracy. Moreover, the error level of matching the logs to the maximum diameter has not exceeded the level of 20%. The introduced changes caused, for example, the deduction value in the 9”to 12” sorting groups to be heightened to 3 cm.
4. Discussion
The conducted observations and measurements of automatic sorting corrected by the actual measurements are part of the important issue of shaping the quality of automation in the process of preparing wood raw material for sawing. In the pretreatment of roundwood, the correct use of measurement systems and deductions is responsible for the correct application of the optimal sawing program and, consequently, the rational use of valuable wood raw material [44].
The use of laser scanners in the wood industry is associated with the successful implementation of sawmill automation processes. Data cloud processing reduces the burden of manipulation works. They require a major amount of work and are characterized by low efficiency, which can be a limiting factor for their use in the industry. A large part of operations carried out on roundwood involving the preparation of material is aimed at determining the specific functional features of wood, and currently, it is performed automatically [45,46]. The automation allows for a significant acceleration of work and at the same time allows the implementation of aggregate technologies for more advanced works related to the mechanical processing of raw materials. Sawmills equipped with automatic sorting systems are characterized by the more optimal use of wood material and have the ability of “virtual” processing already at the stage of sorting the logs.
The system of scanners applied to determine the three-dimensional shape of logs focuses on the accuracy of mapping the shape geometry and in the conducted research its accuracy was compared with the results of manual measurements. The occurrence of irregularities, including those in bark thickness, causes the measurement errors and the decrease in sorting accuracy. The assumption of the constant bark deduction ranges increases the risk of over-measuring the diameters of logs [47,48,49]. The 3D phase shift laser scanner method allows the scanning of cross-sectional images of a pine log while simultaneously determining shape errors. The designated clouds of points on the surface of each cross-section are compared with the surfaces of the corresponding log cross-sections after conversion.
The average value of over-measuring the diameter of the logs in the diametral range of 7″ to 17″ (without bark) was 4.6% with a standard deviation of 1.03 cm. The average weighted sorting error for the deduction for bark in the tested raw material was 45%, out of which over-measured logs accounted for 36% with a standard deviation of 3.1 cm. The low average weighted sorting accuracy at the level of 55% is the result of low flexibility of adjusting the deduction for bark, the differences in comparison with the actual bark thickness and unevenness of the bark surface within the individual sorting groups. The results presented by other authors indicate that measurements performed with the use of automatic methods are characterized by significant discrepancies [50,51,52,53,54,55,56]. Moreover, they indicate the necessity of applying corrections to the bark deductions, which should be prepared taking into account the tree species and habitat groups of the raw material. The research confirms that the application of 3D phase shift laser scanning requires a parametric adjustment of the bark deduction considering a number of factors, e.g., age of the tree or habitat, based on the created database of log characteristics [57].
5. Conclusions
- ▪
- The highest accuracy of automatic sorting is achieved in the boundary diametral ranges as a result of having wider ranges of diameters assigned and the lower dispersion of values in the results of the bark thickness;
- ▪
- The sorting accuracy in individual ranges is affected by significant differences between the actual thickness of the bark and the applied constant values of the deduction. The adoption of uncorrected normative values reduces the quality of sorting wood raw material by affecting the sorting accuracy;
- ▪
- Studies have shown that as the diameter of pine logs increases, the variation in bark thickness values also increases;
- ▪
- Defects occurring in the structure of wood, such as curvature, knots, and knobs, are the factors affecting the diameter measurement’s accuracy;
- ▪
- Applying the corrected values for the bark deduction when measuring the diameter of logs has a direct impact on the quality of automatic sorting and the final design of sawmill sawing programs.
Author Contributions
Conceptualization, M.W. and A.T.; methodology, M.W.; software, R.M.; validation, J.K. and A.T.; formal analysis, R.M.; investigation, M.W.; resources, M.W.; data curation, A.T.; writing—original draft preparation, M.W.; writing—review and editing, J.K.; visualization, A.T.; supervision, R.M.; project administration, R.M.; funding acquisition, R.M. All authors have read and agreed to the published version of the manuscript.
Funding
This research was funded by the National Centre for Research and Development, BIOSTRATEG3/344303/14/NCBR/2018.
Data Availability Statement
Data is contained within the article.
Conflicts of Interest
The authors declare no conflict of interest.
References
- Berglund, A.; Broman, O.; Grönlund, A.; Fredriksson, M. Improved Log Rotation Using Information from a Computed Tomography Scanner. Comput. Electron. Agric. 2013, 90, 152–158. [Google Scholar] [CrossRef]
- Gazo, R.; Benes, B. Computed Tomography Log Scanning: An Industrial Application. In Proceedings of the 4th International Scientific Conference on Hardwood Processing, Florence, Italy, 7–9 October 2013; pp. 140–147. [Google Scholar]
- Oja, J.; Grundberg, S.; Fredriksson, J.; Berg, P. Automatic Grading of Sawlogs: A Comparison between X-Ray Scanning, Optical Three-Dimensional Scanning and Combinations of Both Methods. Scand. J. For. Res. 2004, 19, 89–95. [Google Scholar] [CrossRef]
- Van der Jeught, S.; Dirckx, J.J. Real-Time Structured Light Profilometry: A Review. Opt. Lasers Eng. 2016, 87, 18–31. [Google Scholar] [CrossRef]
- Edlund, J.; Warensjö, M. Repeatability in Automatic Sorting of Curved Norway Spruce Saw Logs. Silva Fenn. 2005, 39, 265–275. [Google Scholar] [CrossRef][Green Version]
- Repola, J. Models for Vertical Wood Density of Scots Pine, Norway Spruce and Birch Stems, and Their Application to Determine Average Wood Density. Silva Fenn. 2006, 40, 673–685. [Google Scholar] [CrossRef]
- Zhang, S. Flexible 3D Shape Measurement Using Projector Defocusing: Extended Measurement Range. Opt. Lett. 2010, 35, 934–936. [Google Scholar] [CrossRef] [PubMed]
- Wördehoff, R.; Spellmann, H.; Evers, J.; Aydın, C.T.; Nagel, J. Kohlenstoffstudie Forst Und Holz Schleswig-Holstein; Nordwestdeutsche Forstliche Versuchsanstalt: Göttingen, Germany, 2012; pp. 5–36. [Google Scholar]
- Pająk, M.; Michalec, K.; Wąsik, R.; Kościelny, M. Quality of Scots Pine Wood on the Lands Reclaimed for Forestry-Spoil Heap after the Exploitation of Sulphur in Piaseczno Case Study. Sylwan 2016, 160, 284–291. [Google Scholar]
- Mirski, R.; Wieruszewski, M.; Malinowski, Z. Variability of the Defects Distribution Round Wood in Mature Pine Stands. Sylwan 2019, 163, 913–923. [Google Scholar]
- Thomas, L.; Mili, L.; Thomas, E.; Shaffer, C.A. Defect Detection on Hardwood Logs Using Laser Scanning. Wood Fiber Sci. 2006, 38, 682–695. [Google Scholar]
- Lin, W.; Wang, J. An Integrated 3D Log Processing Optimization System for Hardwood Sawmills in Central Appalachia, USA. Comput. Electron. Agric. 2012, 82, 61–74. [Google Scholar] [CrossRef]
- Rinnhofer, A.; Petutschnigg, A.; Andreu, J.-P. Internal Log Scanning for Optimizing Breakdown. Comput. Electron. Agric. 2003, 41, 7–21. [Google Scholar] [CrossRef]
- Sarigul, E.; Abbott, A.L.; Schmoldt, D.L. Rule-Driven Defect Detection in CT Images of Hardwood Logs. Comput. Electron. Agric. 2003, 41, 101–119. [Google Scholar] [CrossRef]
- Andrade, J.; Ares, J.; García, R.; Pazos, J.; Rodríguez, S.; Silva, A. Definition of a Problem-Sensitive Conceptual Modelling Language: Foundations and Application to Software Engineering. Inf. Softw. Technol. 2006, 48, 517–531. [Google Scholar] [CrossRef]
- Song, T.; Usenius, A.; Seminar, I. InnoSim-a Simulation Model of Wood Conversion Chain. In Proceedings of the COST Action E44 Conference on Wood Processing Strategy, Helsinki, Finland, 17–19 September 2007; pp. 95–108. [Google Scholar]
- Zhang, S.; Yau, S.-T. High-Speed Three-Dimensional Shape Measurement System Using a Modified Two-plus-One Phase-Shifting Algorithm. Opt. Eng. 2007, 46, 113603. [Google Scholar] [CrossRef]
- Wei, Q.; Chui, Y.H.; Leblon, B.; Zhang, S.Y. Identification of Selected Internal Wood Characteristics in Computed Tomography Images of Black Spruce: A Comparison Study. J. Wood Sci. 2009, 55, 175–180. [Google Scholar] [CrossRef]
- Chiorescu, S.; Grönlund, A. The Fingerprint Approach: Using Data Generated by a 3D Log Scanner on Debarked Logs to Accomplish Traceability in the Sawmill’s Log Yard. For. Prod. J. 2004, 54, 269–276. [Google Scholar]
- Westoby, M.J.; Brasington, J.; Glasser, N.F.; Hambrey, M.J.; Reynolds, J.M. ‘Structure-from-Motion’Photogrammetry: A Low-Cost, Effective Tool for Geoscience Applications. Geomorphology 2012, 179, 300–314. [Google Scholar] [CrossRef]
- Wieruszewski, M.; Mikołajczak, E. The Influence of Selected Factors on the Share of By-Products in Sawmill Processing. In Annals of Warsaw University of Life Sciences–SGGW Forestry and Wood Technology; Warsaw University of Life Sciences Press: Warsaw, Poland, 2018; Volume 104, pp. 540–548. [Google Scholar]
- Thawornwong, S.; Occena, L.G.; Schmoldt, D.L. Lumber Value Differences from Reduced CT Spatial Resolution and Simulated Log Sawing. Comput. Electron. Agric. 2003, 41, 23–43. [Google Scholar] [CrossRef]
- Wessels, C. Cant Sawing Log Positioning Optimization: A Simulation Study. For. Prod. J. 2009, 59, 17–22. [Google Scholar]
- Gotych, V.; Hruzik, G.J.; Wieruszewski, M. The Analysis of Sawmill Logs Sorting Acuteness at Automatic Sorting Lines. Intercathedra 2013, 29, 15–19. [Google Scholar]
- Kozakiewicz, P.; Krzosek, S. Resilient sorting of sawn timber. In Engineering of Wooden Materials, 1st ed.; Wydawnictwo SGGW: Warszawa, Poland, 2013; pp. 65–125. [Google Scholar]
- Marshall, H.; Murphy, G.; Lachenbruch, B. Effects of Bark Thickness Estimates on Optimal Log Merchandising. For. Prod. J. 2006, 56, 87–92. [Google Scholar]
- Johnson, T.S.; Wood, G.B. Simple Linear Model Reliably Predicts Bark Thickness of Radiata Pine in the Australian Capital Territory. For. Ecol. Manag. 1987, 22, 173–183. [Google Scholar] [CrossRef]
- Persson, B.; Downie, B. Variation in Bark Thickness of Young Pinus Contorta Var. Latifolia Engelm. in Sweden. Scand. J. For. Res. 1992, 7, 99–106. [Google Scholar] [CrossRef]
- Li, R.; Weiskittel, A. Estimating and Predicting Bark Thickness for Seven Conifer Species in the Acadian Region of North America Using a Mixed-Effects Modeling Approach: Comparison of Model Forms and Subsampling Strategies. Eur. J. For. Res. 2011, 130, 219–233. [Google Scholar] [CrossRef]
- Malone, T.; Liang, J. A Bark Thickness Model for White Spruce in Alaska Northern Forests. Int. J. For. Res. 2009, 876965. [Google Scholar] [CrossRef]
- Nilsson, D.; Edlund, U. Pine and Spruce Roundwood Species Classification Using Multivariate Image Analysis on Bark. Holzforschung 2005, 59, 689–695. [Google Scholar] [CrossRef]
- Muhairwe, C.K. Bark Thickness Equations for Five Commercial Tree Species in Regrowth Forests of Northern New South Wales. Aust. For. 2000, 63, 34–43. [Google Scholar] [CrossRef]
- Dietz, P. Dichte und Rindengehalt von Industrieholz. Holz Als Roh Und Werkst. 1975, 33, 135–141. [Google Scholar] [CrossRef]
- Stankić, I.; Kovač, S.; Poršinsky, T. Značajke kore podravske crne johe. Nova mehanizacija šumarstva: Časopis za teoriju i praksu šumarskoga inženjerstva. J. Theory Pract. For. Eng. 2010, 31, 27–36. [Google Scholar]
- Prka, M. Debljina kore obične bukve (Fagus sylvatica L.) u sječinama bjelovarske bilogore. Šumarski List 2004, 128, 391–403. [Google Scholar]
- Liepins, J.; Liepins, K. Evaluation of Bark Volume of Four Tree Species in Latvia. In Proceedings of the Research for Rural Development Annual 21th International Scientific Conference, Jelgava, Latvia, 13–15 May 2015; pp. 22–28. [Google Scholar]
- Jansone, Z.; Muizniece, I.; Blumberga, D. Analysis of Wood Bark Use Opportunities. Energy Procedia 2017, 128, 268–274. [Google Scholar] [CrossRef]
- Kokociński, W. Anatomia Drewna; Prodruk: Poznań, Poland, 2005. [Google Scholar]
- Mirski, R.; Kawalerczyk, J.; Dziurka, D.; Wieruszewski, M.; Trociński, A. Effects of Using Bark Particles with Various Dimensions as a Filler for Urea-Formaldehyde Resin in Plywood. BioResources 2020, 15, 1692–1701. [Google Scholar]
- Božić, M.; Čavlović, J.; Vedriš, M.; Jazbec, M. Modeling Bark Thickness of Silver Fir Trees (Abies alba Mill.). Šumarski List 2007, 131, 3–12. [Google Scholar]
- Smith, J.H.G.; Kozak, A. Thickness and Percentage of Bark of the Commercial Trees of British Columbia. Univ. Br. Columbia Fac. For. 1967, 30–33. [Google Scholar]
- Doruska, P.F.; Patterson, D.; Hartley, J.; Hurd, M.; Hart, T. Newer Technologies and Bioenergy Bring Focus Back to Bark Factor Equations. J. For. 2009, 107, 38–43. [Google Scholar]
- PN-D-95000. Surowiec Drzewny-Pomiar, Obliczanie Miąższości i Cechowanie; Polish Comitte for Standardization: Warsaw, Poland, 2002. [Google Scholar]
- Krzosek, S.; Bacher, M. Aktueller Stand der maschinellen Festigkeitssortierung von Schnittholz in Polen und in Europa. Ann. Wars. Univ. Life Sci. SGGW For. Wood Technol. 2011, 74, 254–259. [Google Scholar]
- Dassot, M.; Constant, T.; Fournier, M. The Use of Terrestrial LiDAR Technology in Forest Science: Application Fields, Benefits and Challenges. Ann. For. Sci. 2011, 68, 959–974. [Google Scholar] [CrossRef]
- Chiorescu, S.; Berg, P.; Grönlund, A. The Fingerprint Approach: Using data generated by a 2-Axis log Scanner to accomplish traceability in the sawmill’s Log Yard. For. Prod. J. 2003, 53, 78–86. [Google Scholar]
- Lindström, A.; Rune, G. Root Deformation in Plantations of Container-Grown Scots Pine Trees: Effects on Root Growth, Tree Stability and Stem Straightness. Plant Soil 1999, 217, 29–37. [Google Scholar] [CrossRef]
- Sonmez, T.; Keles, S.; Tilki, F. Effect of Aspect, Tree Age and Tree Diameter on Bark Thickness of Picea Orientalis. Scand. J. For. Res. 2007, 22, 193–197. [Google Scholar] [CrossRef]
- Wilhelmsson, L.; Arlinger, J.; Spångberg, K.; Lundqvist, S.-O.; Grahn, T.; Hedenberg, Ö.; Olsson, L. Models for Predicting Wood Properties in Stems of Picea Abies and Pinus Sylvestris in Sweden. Scand. J. For. Res. 2002, 17, 330–350. [Google Scholar] [CrossRef]
- Dashner, B. 3D Log Scanning—The next Generation. In Proceedings of the Fifth International Conference on Scanning Technology and Process Optimization for the Wood Industry (Scan Pro), Atlanta, GA, USA, 25–27 October 1993. [Google Scholar]
- Cellini, J.; Galarza, M.; Burns, S.; Lencinas, M. Equations of Bark Thickness and Volume Profiles at Different Heights with Easy-Measurement Variables. For. Syst. 2012, 21, 23–30. [Google Scholar] [CrossRef]
- Oja, J.; Källsner, B.; Grundberg, S. Predicting the Strength of Sawn Wood Products: A Comparison between x-Ray Scanning of Logs and Machine Strength Grading of Lumber. For. Prod. J. 2005, 55, 55–60. [Google Scholar]
- Lycken, A.; Oja, J. A Multivariate Approach to Automatic Grading of Pinus Sylvestris Sawn Timber. Scand. J. For. Res. 2006, 21, 167–174. [Google Scholar] [CrossRef]
- Olofsson, L.; Broman, O.; Fredriksson, M.; Skog, J.; Sandberg, D. Customer Adapted Grading of Scots Pine Sawn Timber: A Multivariate Method Approach. In Proceedings of the 23rd International Wood Machining Seminar, Warsaw, Poland, 28–31 May 2017; Warsaw University of Life Sciences: Warsaw, Poland, 2017; pp. 360–361. [Google Scholar]
- Berglund, A.; Broman, O.; Oja, J.; Grönlund, A. Customer Adapted Grading of Scots Pine Sawn Timber Using a Multivariate Method. Scand. J. For. Res. 2014, 30, 87–97. [Google Scholar] [CrossRef]
- Kline, D.E.; Surak, C.; Araman, P. Automated Hardwood Lumber Grading Utilizing a Multiple Sensor Machine Vision Technology. Comput. Electron. Agric. 2003, 41, 139–155. [Google Scholar] [CrossRef]
- Chiorescu, S.; Grundberg, S. The Influence of Missing Bark on Measurements Performed with a 3D Log Scanner. For. Prod. J. 2001, 51, 78–86. [Google Scholar]

Publisher’s Note: MDPI stays neutral with regard to jurisdictional claims in published maps and institutional affiliations. |
© 2021 by the authors. Licensee MDPI, Basel, Switzerland. This article is an open access article distributed under the terms and conditions of the Creative Commons Attribution (CC BY) license (https://creativecommons.org/licenses/by/4.0/).