Article

Analysis of Surface Deformation and Physical and Mechanical Parameters of Soils on Selected Skid Trails in the Gorce National Park

Department of Forest Utilization, Engineering and Forest Techniques, Faculty of Forestry, University of Agriculture in Kraków, 29 listopada 46, 31-425 Kraków, Poland
*
Author to whom correspondence should be addressed.
Forests 2021, 12(6), 797; https://doi.org/10.3390/f12060797
Submission received: 12 May 2021 / Revised: 5 June 2021 / Accepted: 14 June 2021 / Published: 17 June 2021
(This article belongs to the Section Forest Ecology and Management)

Abstract

:
Skidding is considered to be one of the most stressful works for the forest environment. This paper presented the results obtained from the analysis of soil deformation and selected physical and mechanical parameters of soils on skid trails in the Gorce National Park. The study analyzed two horse and tractor skid trails that are in continuous use in the park. Measurements of parameters were recorded before (summer) and after (autumn) a total of 81 skidding cycles, using a profilometer and a penetrometer, and soil samples were collected for analysis. The measurements obtained from the horse trails indicated that soil compactness was considerably higher in the lower sections of the trails and on the side more loaded by horse traffic and the transported load, which was related to the trail course in the field. The values of penetration resistance were high in the middle of those trails, reaching 6.8 MPa in the layer up to 10 cm. In the tractor trail the values of soil compactness reached 7.62 MPa in the layer up to 10 cm deep and were similar across the width of the trail and deep into the soil profile, with only slight changes observed in the monitored period. As a result of skidding, there were increases in the maximum depth of ruts reaching up to 4.6% on horse trails and up to 10.8% on tractor trails. Soil erosion per 10 m of trail caused by skidding and other natural factors during the study reached 1.314 and 0.390 m3 for the tractor and horse trail, respectively, wherein volume of skidded wood on the tractor trail was 180.1, and 18.1 m3 on horse trails. This confirms that the volume of eroded soil on the trails is determined by the type of skidder used and volume of skidded wood, so it is important to choose the right kind of skidder based on the conditions in which the skidding work will be carried out.

1. Introduction

Skid trails are an important element of forest management, which allow the harvested timber to be transported from the interior of stands to storage areas and further to recipients [1,2]. In lowland areas characterized by the logging mode of forest management, there is no need to designate trails, whereas in clear-cutting and clear-felling, as well as in mountainous areas, it is necessary to have temporary or permanent skid trails. Designating trails in the field limits potential damage to the stand remaining and erosion damage to the strips of land where trails will be located [2,3,4]. Trails must also exist in the stands where typical forest management is not performed, such as those under active protection inside national parks. In these stands, only limited economic activities related to sanitary cuts are carried out, for example, removal of trees colonized by bark beetles (Scolytinae), which affects the growth of their population [5,6]. In Poland, massive weakening of spruce (Picea) populations and associated damage of a gradational nature caused by bark beetles were first reported in the Sudetes, and have been currently observed in the Carpathians and other regions [7,8]. This is especially a major problem in the case of commercial forests, including the protected ones. This results in a large harvest of spruce “bark beetle” wood, accompanied by the occurrence of erosion damage on skid trails [9,10,11]. The phenomenon of erosion on skid trails, and its dynamics related to trail use, is also an important issue of soil conservation [12,13]. A skid trail is defined as a strip of land inside a stand, devoid of woody vegetation and undergrowth, on which a stage of timber transport is realized from the trunk to the depot, with given technical parameters (in advanced cases, the parameters include longitudinal slope, transverse slope, surface, and radii of horizontal and vertical bends). In the stand, trails exist in the form of a network with a certain density resulting from the distance between them, which in turn is influenced by the way the forest is managed and the felling cuts are used, as well as by the age of the stands thus made available [1,14,15]. Three main factors cause erosion damage on skid trails: the movement of skidding vehicles, the dragging of timber along the surface of the trail, and surface runoff [16]. Erosion damages resulting from skidder traffic primarily include shearing, mixing, and compaction of the substrate in the trail surface layer. These damages are caused by the movement of all types of skidding means, and their magnitude is determined by the type of means (horse or tractor) [17,18,19]. Heavy tractors consisting of narrow and high-pressure tires cause the most damage to skid trails [20], and thus the associated damage can be reduced by using lighter tractors with wide and low-pressure tires [21] or by using tracked vehicles [17]. The size of erosion damage resulting from dragged wood depends on the skidding method used (dragged, semi-forwarding), and the end of the log by which the wood is skidded (thinner or thicker) [22]. The highest damage is caused by dragged skidding by the thicker end, while less damage results from semi-forwarding skidding, and these can be reduced by using shields of the timber skid (sliding disks or caps). In addition to moving down the slope and to the sides, the soil stripped by skidding is locally compacted, which reduces the infiltration capacity of rainwater into the soil profile [23,24], thereby creating favorable conditions for surface runoff [25]. Abundant surface runoff on steeply sloping trails is characterized by a high uplift force and easily transports loose, detached material down the slope. This may lead to significant losses of soil in the trail cross section, although local, more or less temporary soil gains can be observed in the cross section and soil is either “deposited” due to the loss of uplift force by surface runoff or “pushed aside” to the sides of the main wood drag channel [26,27]. Studies have indicated that erosion damage is intensified if skidding operations are performed when the soil moisture is high [28,29]. This is due to the much lower shear strength of soil under such conditions [30]. Surface runoff-related erosion damage can be reduced by surface drainage of the trail (lateral falls, waterfalls), shortening sections without surface drainage, reducing longitudinal falls, frequent maintenance of the drainage system to ensure the system is in working order, and avoiding skidding works when the soil moisture in the trails is high [23]. However, most of the skid trails are found without any engineering or antierosion preparation. The period of functionality of such trails usually lasts from a few to several years, and depends directly on the intensity of use as well as the physiographic conditions of the slope. After their utility values are lost, these trails are abandoned. Antierosion development of depleted or abandoned skid trails, supporting the inundation of erosion slope cuts, is a rarity [31,32].
The areas within the active protection zone of the Gorce National Park are an important part of natural heritage; hence, it is necessary to understand how they are affected by the execution of logging works. This study aimed to determine the dynamics of soil deformation changes and some physical and mechanical parameters of soil on selected skid trails in the active protection zone of this park, in the context of logging works carried out for nature protection.

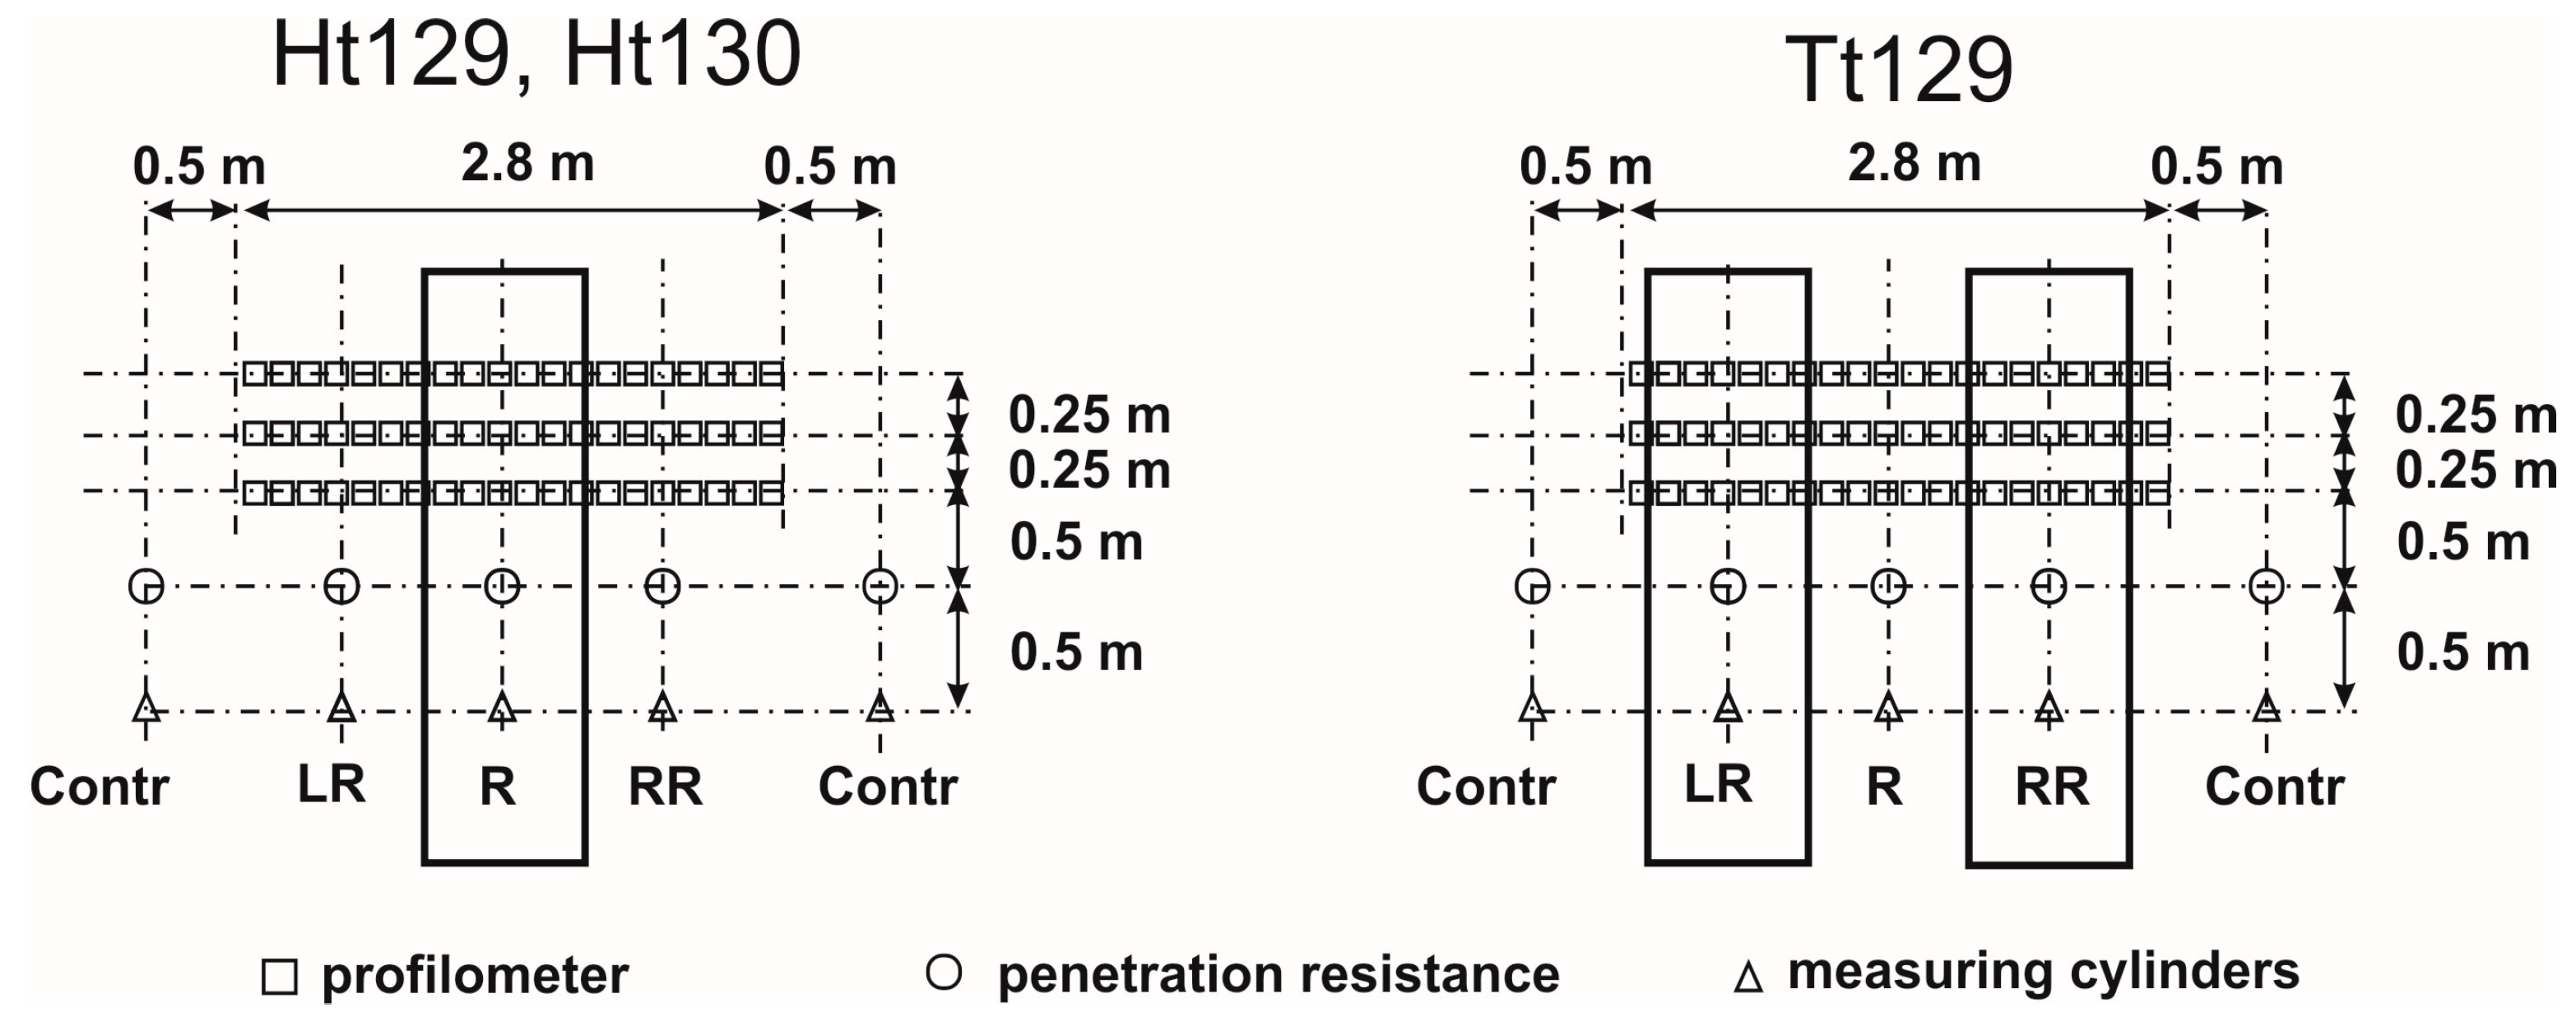
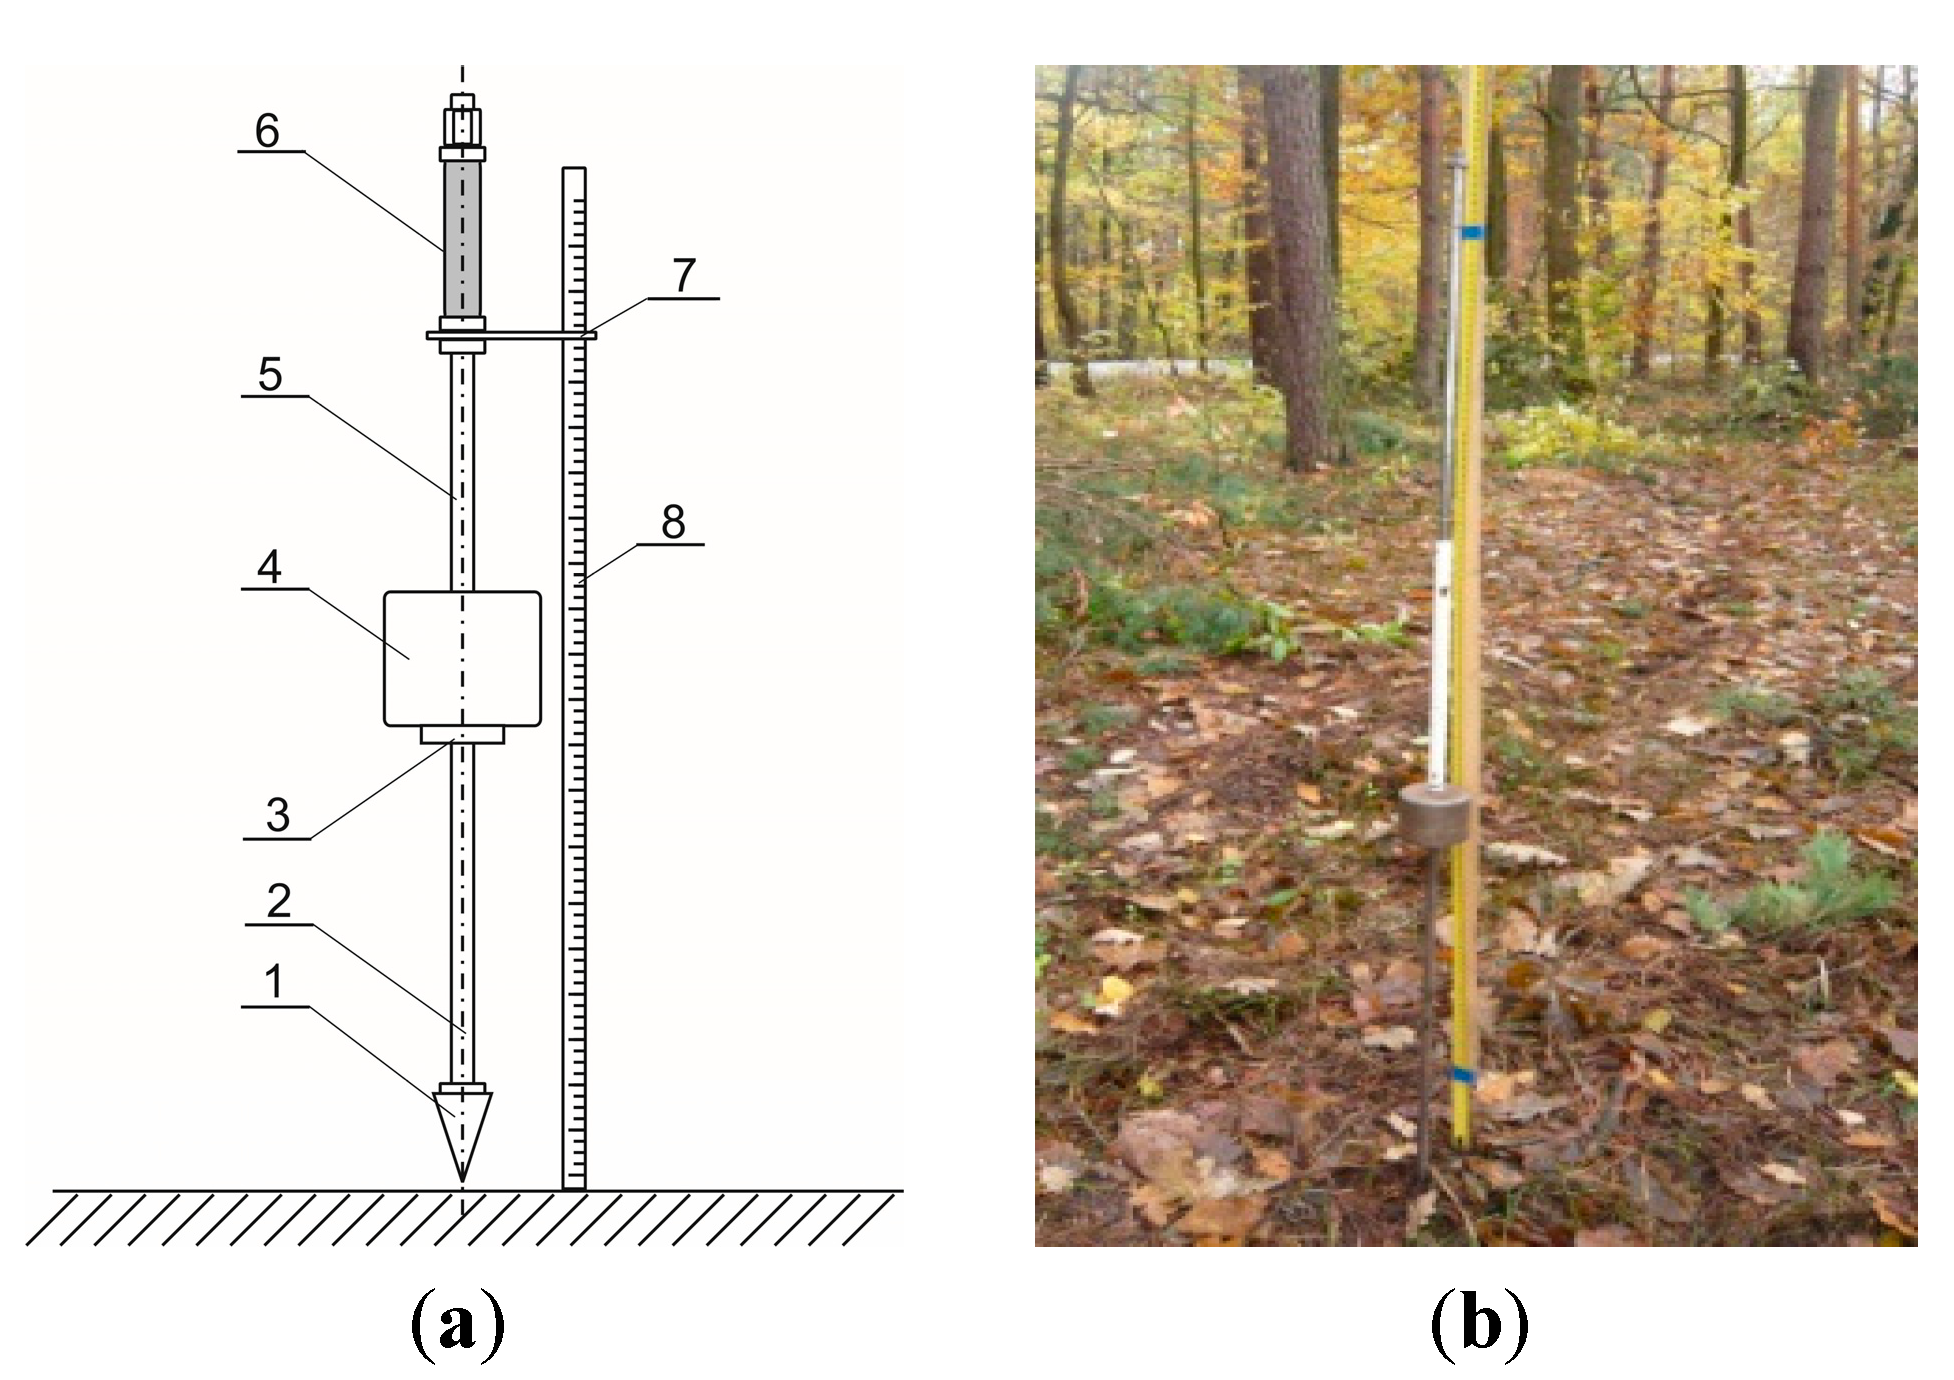
2. Materials and Methods

Measurements of parameters were taken in the part of the Gorce National Park outside the areas of strict protection, where it is possible to carry out forest management to some extent, including works to remove trees attacked by bark beetles and to limit the extent of further damage to the stands of the park [33]. The research was conducted in two sections—129 and 130—located at an altitude of about 880–920 m above sea level, in the eastern part of the Gorce National Park, in Turbacz Protective District, on the fragments of skid trails with a natural ground surface (Figure 1). Two permanently used horse trails in section 130 (Ht130) (4 years old, ca. 430 m long, volume of skidded wood before measurement ca. 40 m3), and section 129 (Ht129) (3 years, ca. 380 m, ca. 20 m3), as well as a tractor trail in section 129 (Tt129) (8 years, ca. 900 m, ca. 1200 m3), were selected for the study. The area of section 129 is 31.61 ha [49°33′41.706″ N 20°13′11.358″ E], and that of section 130 is 130–131.65 ha [49°33′33.014″ N 20°12′58.493″ E]. The bark beetle wood harvested on the trails was removed to a collection trail and further transported along a slope road to the Kamienica valley. On each of the selected trails (Ht129, Ht130, Tt129), the measurements were recorded on two sections: upper (U) and lower (L) (Table 1).
A John Deere 2140 Turbo 4 × 4 universal tractor (60.31 kW, 3790 kg) with a Fransgard V 6500 rope winch (pulling force 6.5 t, weight without rope 400 kg) was used on the tractor trail. Measurements on trails were made on two dates: 29 July 2015 (T1) and 22 October 2015 (T2). Between these dates, 198.2 m3 of wood was skidded on the trails (Table 2). On days 1, 2, and 3 before the measurements, the total rainfall at T1 was 1.2, 1.2, and 2.2 mm, while at T2 it was 5.5, 13.5, and 13.5 mm, respectively.
The following parameters were determined on selected sections of the trails: soil deformation (using a laser profilometer); penetration resistance PR (using a penetrometer) up to 30 cm depth; and dry bulk density BD and moisture content MC of the soil samples taken from the layer up to 10 cm depth (calculations based on the results of weighing before and after drying samples at 105 °C for 24 h with an accuracy of ±0.1 g; measuring cylinders, V = 250 cm3) [35]. Penetration resistance (compactness) PR (three repetitions) and soil samples (three repetitions) were also measured at control sites on the left and right side of the trails (Contr), at load dragging sites in rut (R), at tractor wheel passing (Tt129), left rut (LR) and right rut (RR) sides, or horse moving from the load dragging sites (Ht129 and Ht130) (Figure 1). The profilometer (Figure 1b,f) mapped the vertical profile of a trail up to 2.8 m wide, cleared of leaves and other loose parts of vegetation. The profile was measured every 5 cm, along the instrument beam, leveled and positioned perpendicular to the longitudinal axis of the trail, at three positions (PI, PII, PIII) which were 0.25 m apart (Figure 2). At each measurement location of the profile, the points where the profilometer supports were set at time one (T1) were marked for resetting at time two (T2). Each point marked on the profile had coordinates [x, y, z], where x is the position of the rangefinder along the instrument beam (0–2.8 m, in 0.05-m increments), y is the position of PI, PII, and PIII profile (0, 0.25, and 0.5 m, respectively), and z is the vertical distance of the ground to the instrument beam (up to 2 m ± 3 mm). For each of the two displacement points on the profilometer at T1 and their corresponding points at T2 with respect to coordinates x and y, the areas of the resulting grid were calculated and the change in the rut profile at T2 relative to T1 was determined from the grid. To calculate the volumes of ruts as well as the changes in volume at T2 relative to T1, for both adjacent profiles (PI and PII, PII and PIII) the calculated areas were averaged and multiplied by the distance between the cross sections. The component volumes calculated for the successive points of displacement of the rangefinder along the profilometer beam were summed and expressed in m3, and then recalculated for a trail length of 10 m.
Penetration resistance (compactness) PR was measured to a depth of 30 cm using an impact penetrometer (Figure 3) [36]. In this instrument, the penetration of the cone (1) attached to the introductory rod (2) was facilitated by a freely falling weight (4), along the guide (5), which hit the bumper (3). The measurement consisted of repeated manual lifting of the weight (4) and lowering it along the guide (5), holding the penetrometer by its handle (6). Each time the cone penetrated the soil, the distance between the ground level and the indicator (7) was measured with the linear gauge (8) (±1 mm).
The penetrometer had a cone with a base diameter of D = 2.03 cm, an opening angle of α = 30° [37], and a weight of m = 2 kg. Penetration resistance PR was determined from the measurements based on the method proposed by Harrick and Jones [36]. The calculated values of compactness were then averaged at three levels (p1: 0–10 cm, p2: 10.1–20 cm, p3: 20.1–30 cm), for each trail section (Table 1) and measurement location (LR, R, RR, Contr). Similarly, the values of moisture content and bulk density were averaged for depths up to 10 cm. Using an analysis of variance, for each depth, trail, and measurement date, the mean values of compactness, bulk density, and moisture content were compared for different measurement locations (LR, R, RR, Contr) (Table 1). This was followed by Fisher’s least significant difference (LSD) test to distinguish homogeneous groups.

3. Results

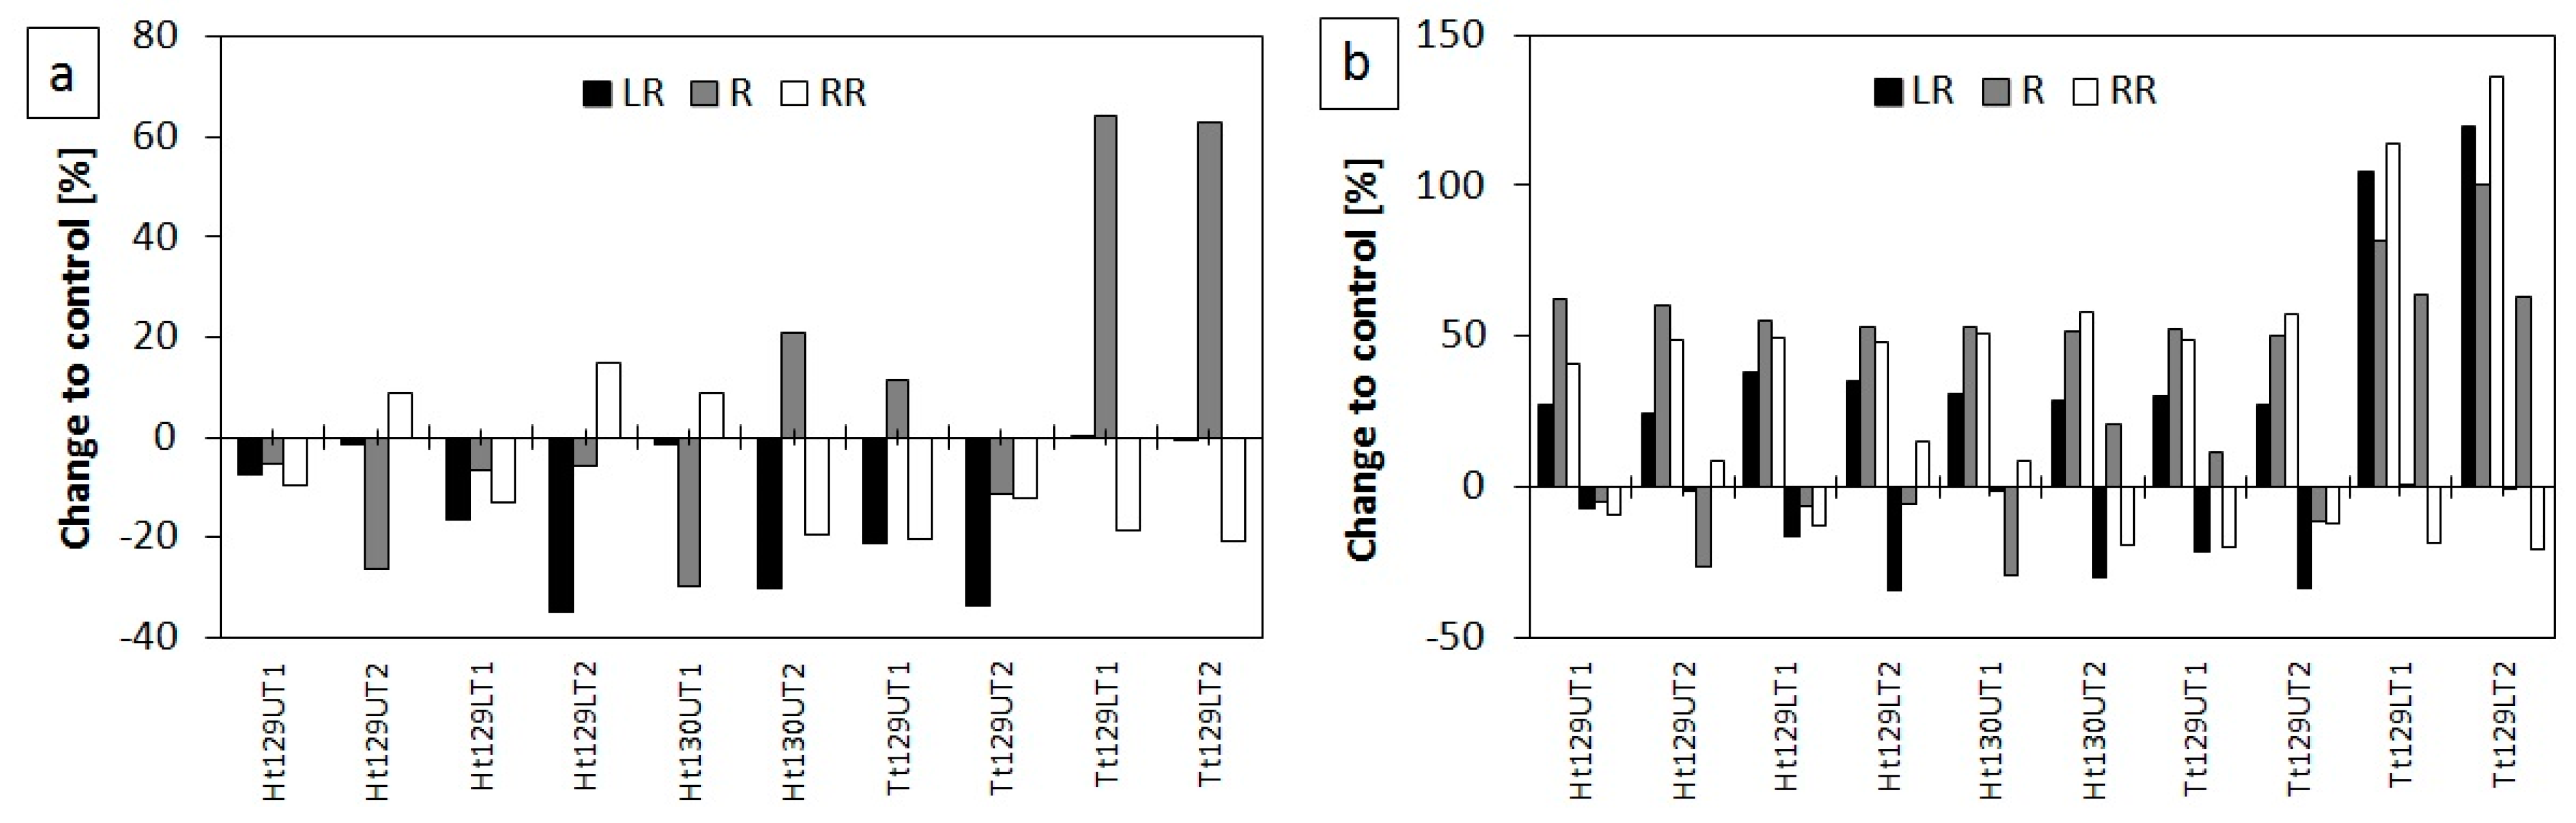
3.1. Moisture Content and Bulk Density of Soil

It was observed that at both sections of horse and tractor trails (LR, R, and RR) and at sites next to the trails (Contr), the average soil moisture (Table 3; Figure 4a) determined at T2 was generally higher than that determined at T1. However, this was not the case with Ht130L, Ht130U, and Ht129L, which may have been due to the distance between sections 129 and 130 where the trails were located (different altitudes), tree canopy, and uneven horizontal distribution of precipitation in the area [38]. Along the skid trail (LR, R, RR) on the horse trails (Ht129, Ht130), moisture content was lower compared to the average values recorded in the control (Contr), while at the load dragging site (R) (in depressed terrain) the content was generally higher compared to the sites next to it (LR and RR), except for Ht130U at T1. On the tractor trail in Tt129L, moisture content was higher in the control (Contr) than on the skid trail (LR, R, RR), while in the case of Tt129U the highest moisture content was recorded at the load dragging site (R).
On the horse trail Ht129, the dry bulk density of soil did not exceed 1.123 g·cm−3 (Table 3). However, after skidding, a clear increase was noted in bulk density over the entire trail width in the lower (L) section (LR, R, RR) (4.3% on average), while an increase was observed in density on the right side of the trail in the upper section (2.8%). This is due to the shape of the trail, which had a steep slope and was straight in its lower part, but curved in the upper section. In this case, the right side of the upper part of the trail (the outlier) was on the inside of the more heavily loaded side of the curve (horse movement and some dragging of the load). The bulk density of soil was significantly higher on the tractor trail Tt129 (mean 1.411 g·cm−3) compared to both horse skid trails (mean 0.968 g·cm−3). In the middle part of the tractor trail in its lower section, the mean bulk density of both terms reached 1.839 g·cm−3. Irrespective of the measurement location, a slight decrease in bulk density was found on the tractor trail after skidding (from 1.8% to 2.7%), which may be related to the movement of the tractor as well as the soil shearing and mixing by the machine wheels. Tractor movement at such a high bulk density at time T1 (mean for the trail 1.427 g·cm−3) did not cause significant changes at time T2 (mean for the trail 1.395 g·cm−3), whereas in relation to the control the increase recorded in bulk density on the horse trail was 57.6% (Ht130UT2) and on the tractor trail was 119% (Tt129LT2) (Figure 4b).

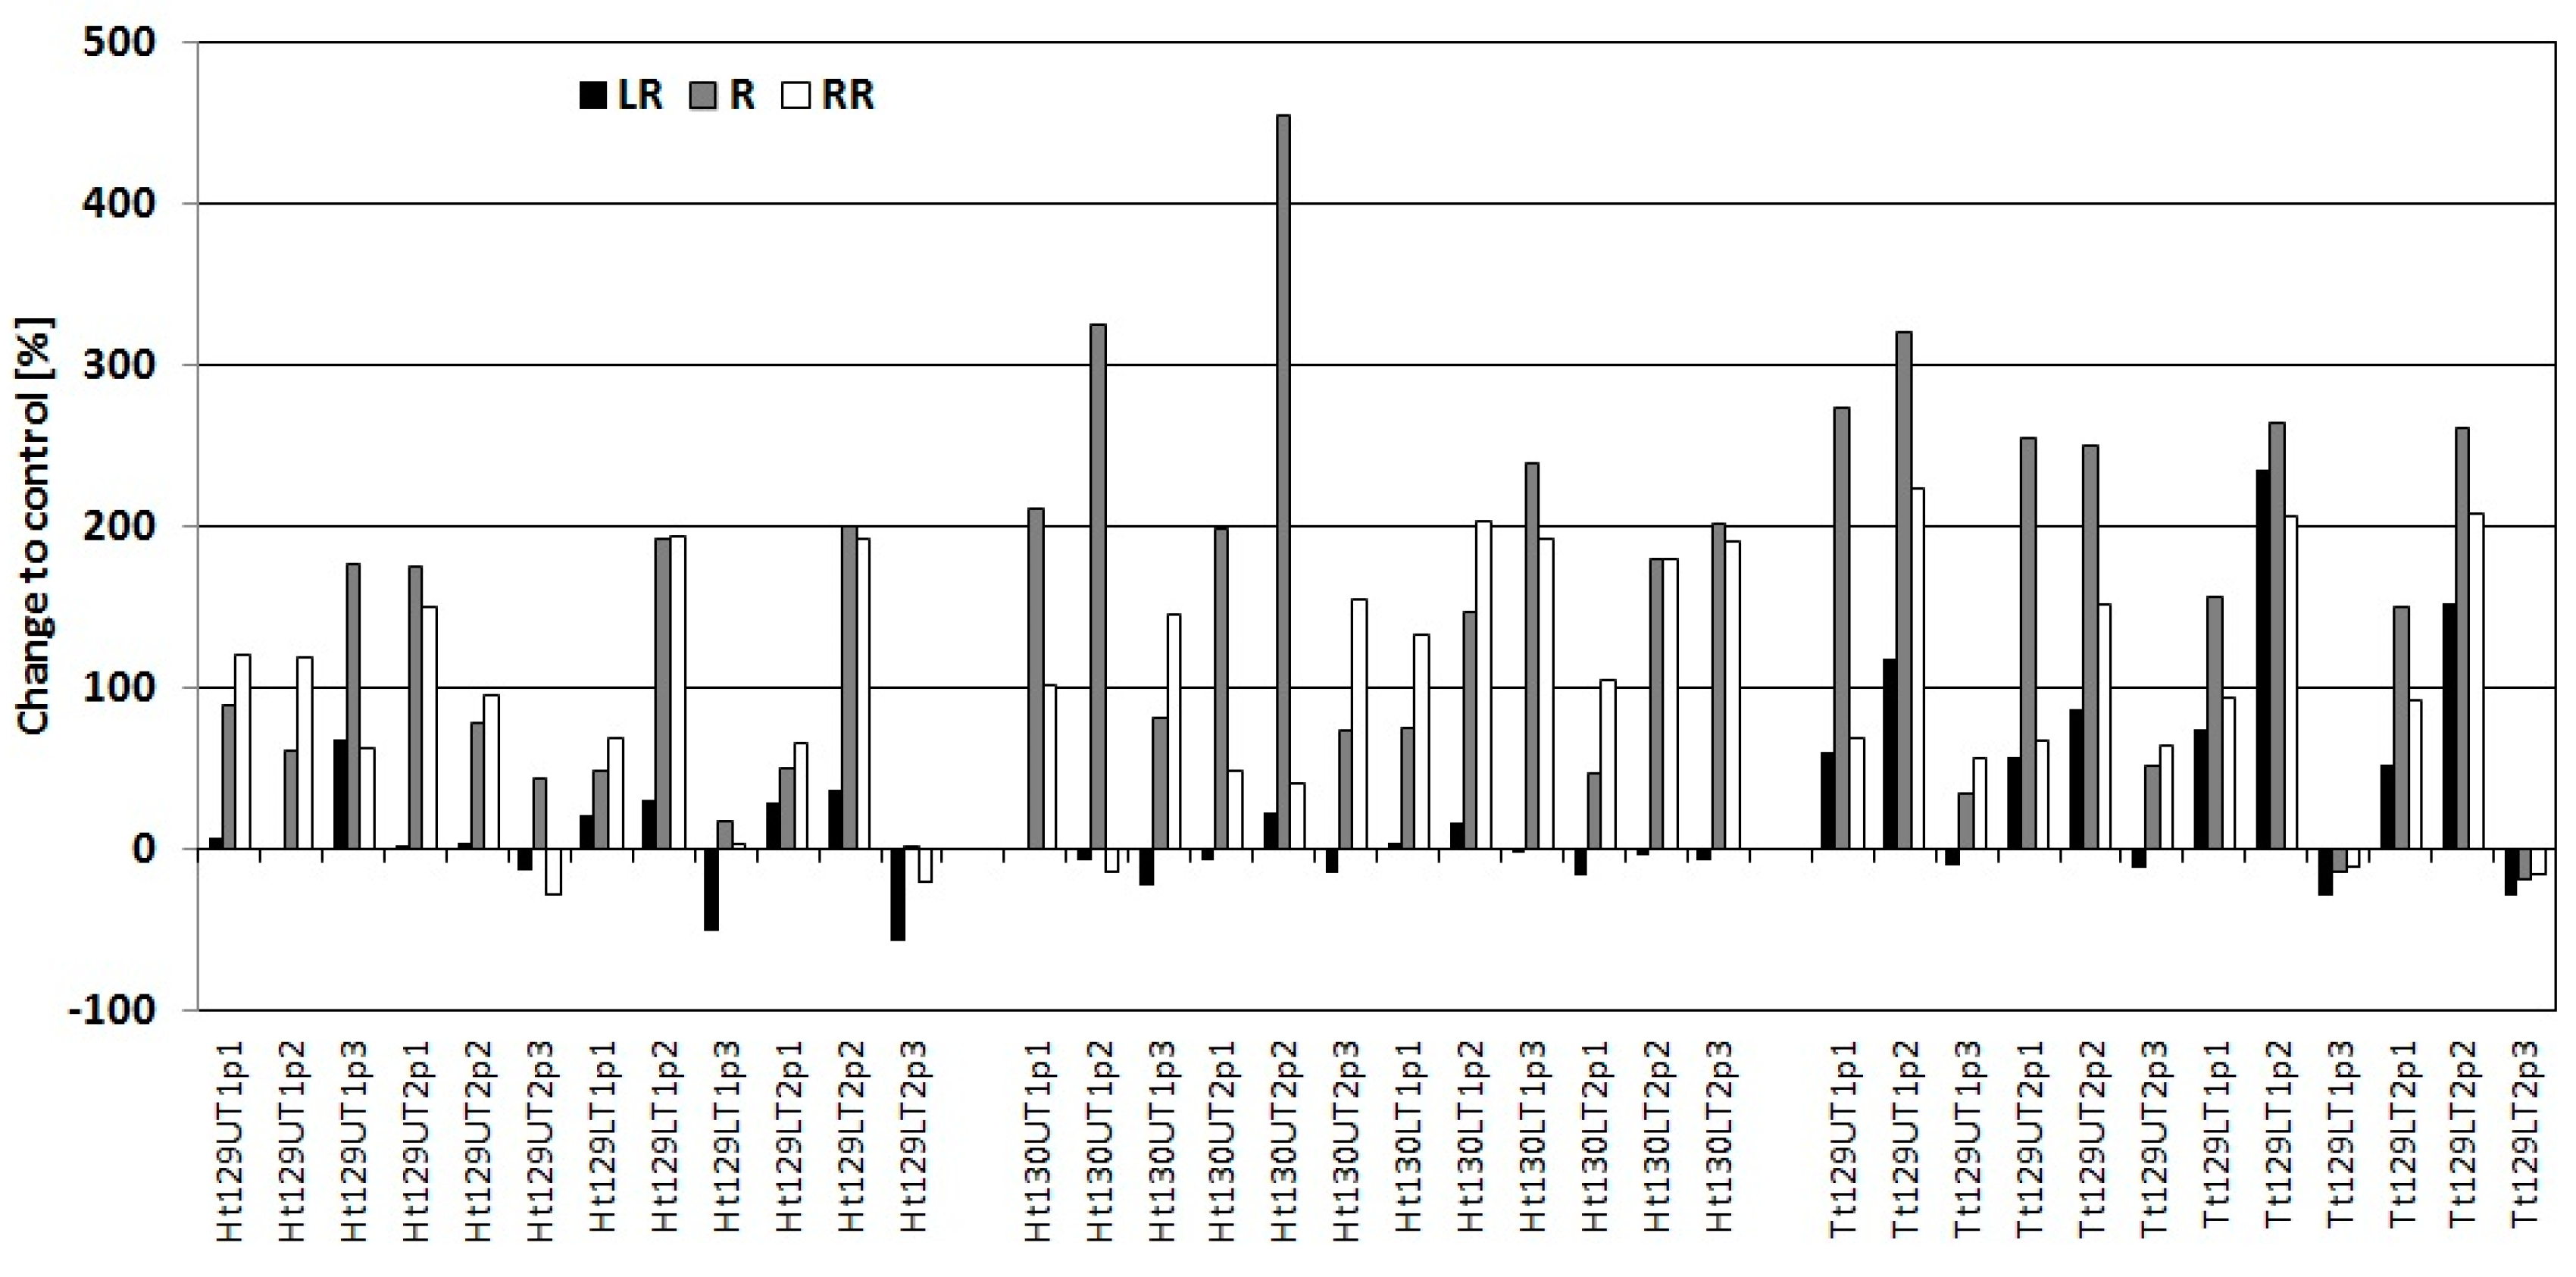
3.2. Soil Compactness

On both horse trails (Ht129, Ht130), soil compactness (Table 4) assumed the highest values in the middle of the trail (R) where the load moved, and reached 6.87 MPa in the layer up to 10 cm, 10.03 MPa up to 20 cm, and 7.56 MPa up to 30 cm. In the upper sections of these trails, significantly higher values of compactness were found on the right side (RR). As observed in the case of bulk density, this result is related to the route of the trail in the terrain and a stronger load on this part of the trail by a working horse and partly by the dragged load. The increase in compactness recorded for the horse trails in relation to the control (Figure 5) was 238% in the center of the trail (R) at depths ranging from 11 to 20 cm. Soil compactness on the tractor trail was more similar across the entire track width, due to the characteristics of the skidding vehicle (interaction with the greater width of the machine wheels and the trailed load). The value of soil compactness in the layer up to 10 cm was 7.92 MPa, up to 20 cm was 8.48 MPa, and up to 30 cm was 6.49 MPa. The compactness values determined on the tractor trail were generally more similar in the soil profile, which is due to constant high loads falling on the ground (tractor and load weight) related to the intensity of use (number of passes). This may indicate the accumulation of compaction along the entire width of the trail and at greater depths. The increase in compactness observed on the tractor trail in relation to the control (Figure 5) was 260% in the center of the trail (R) at depths ranging from 21 to 30 cm.

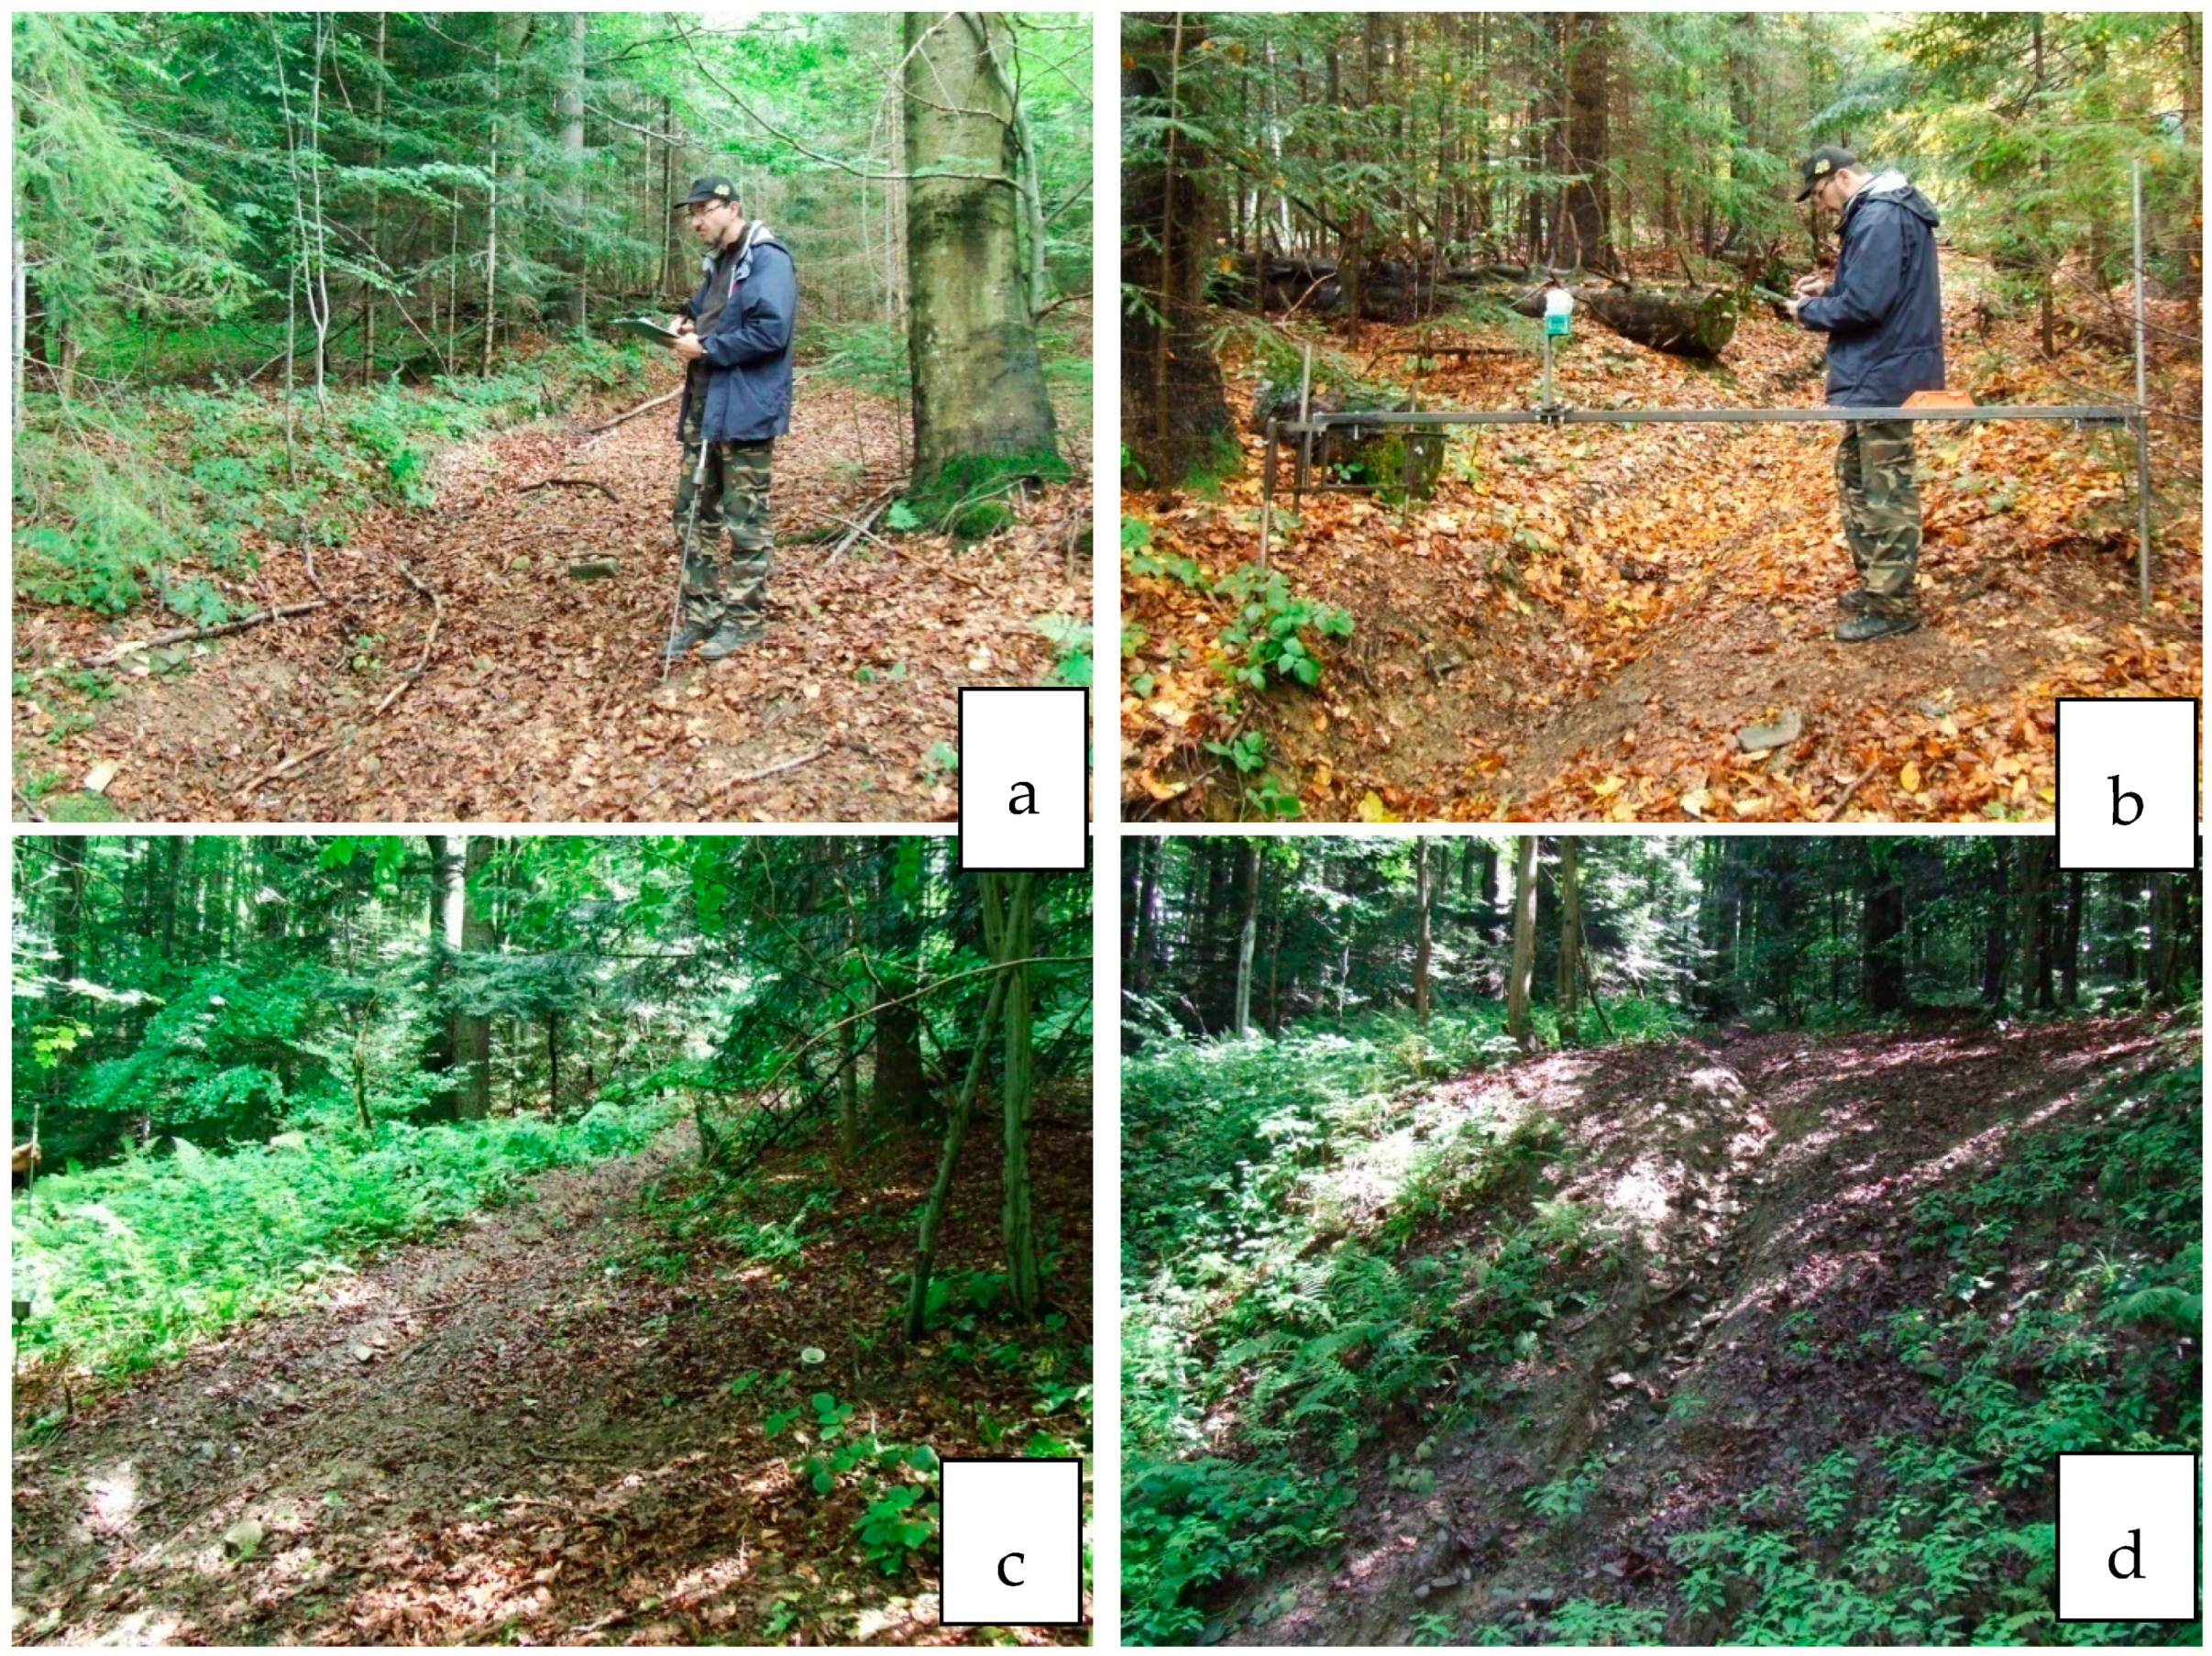
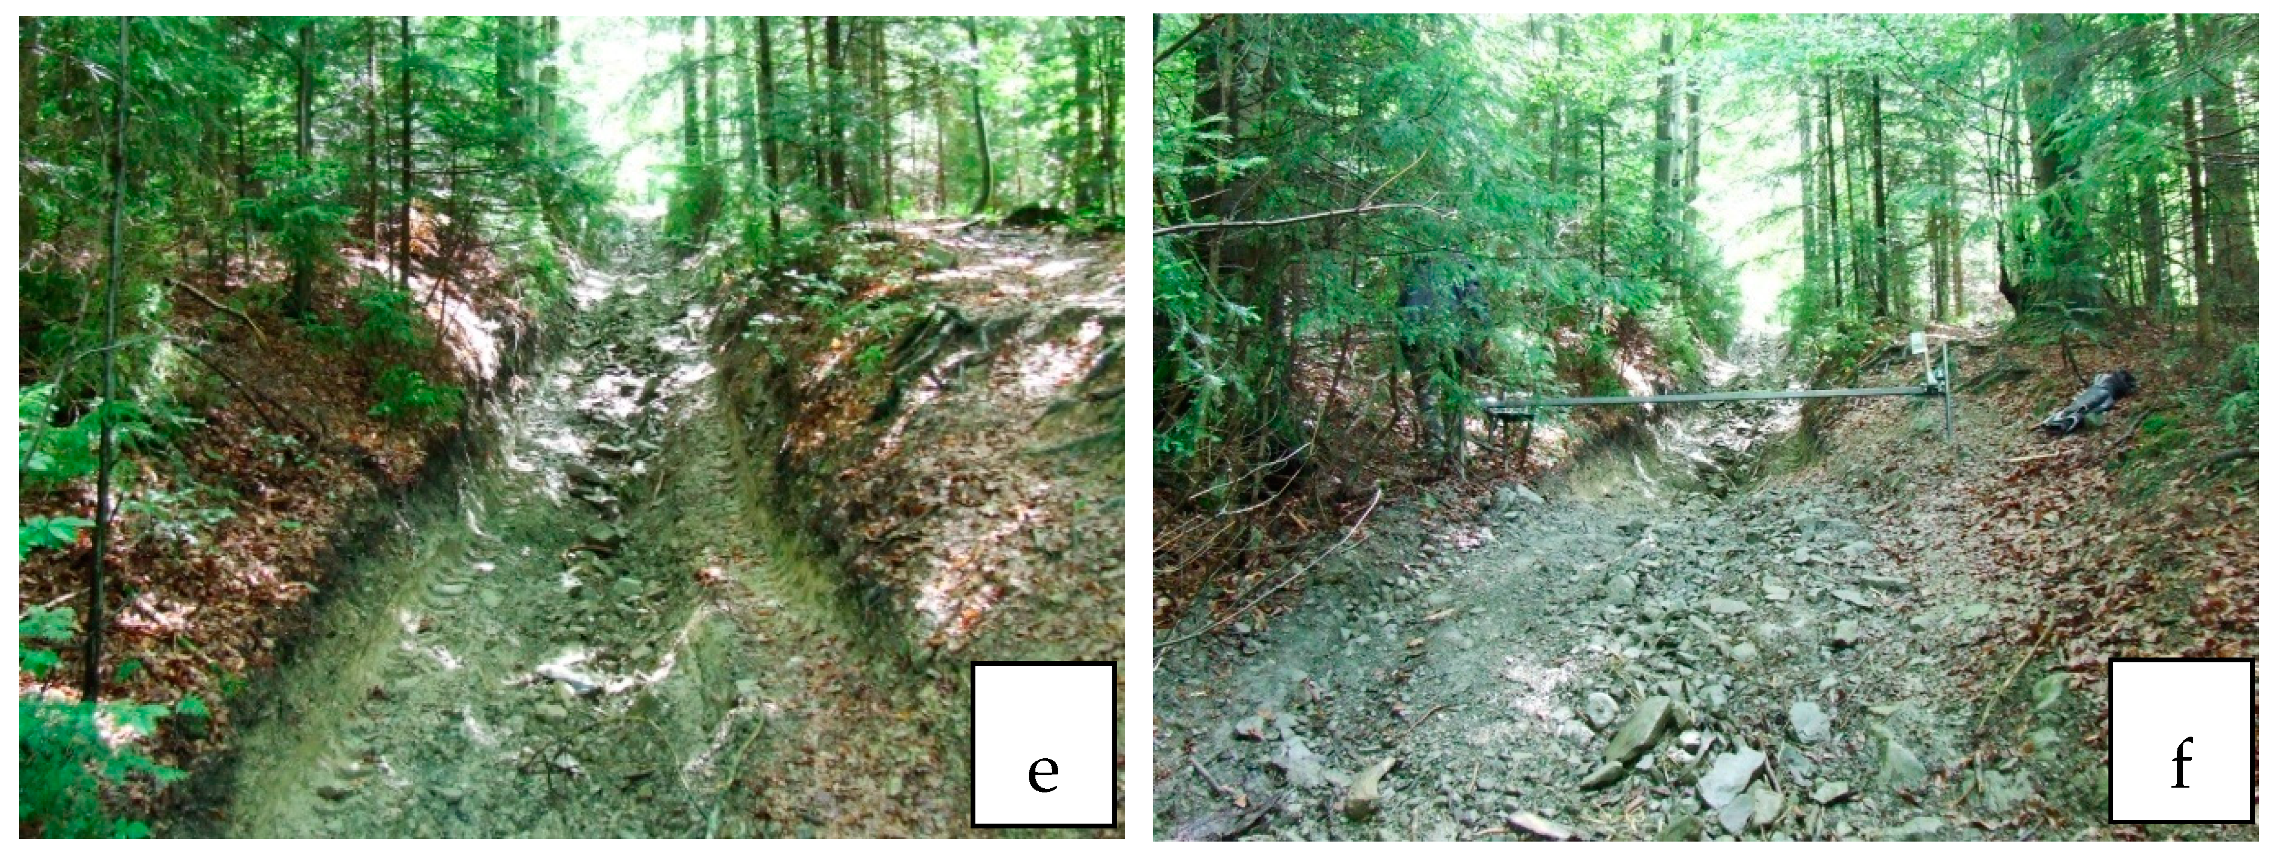
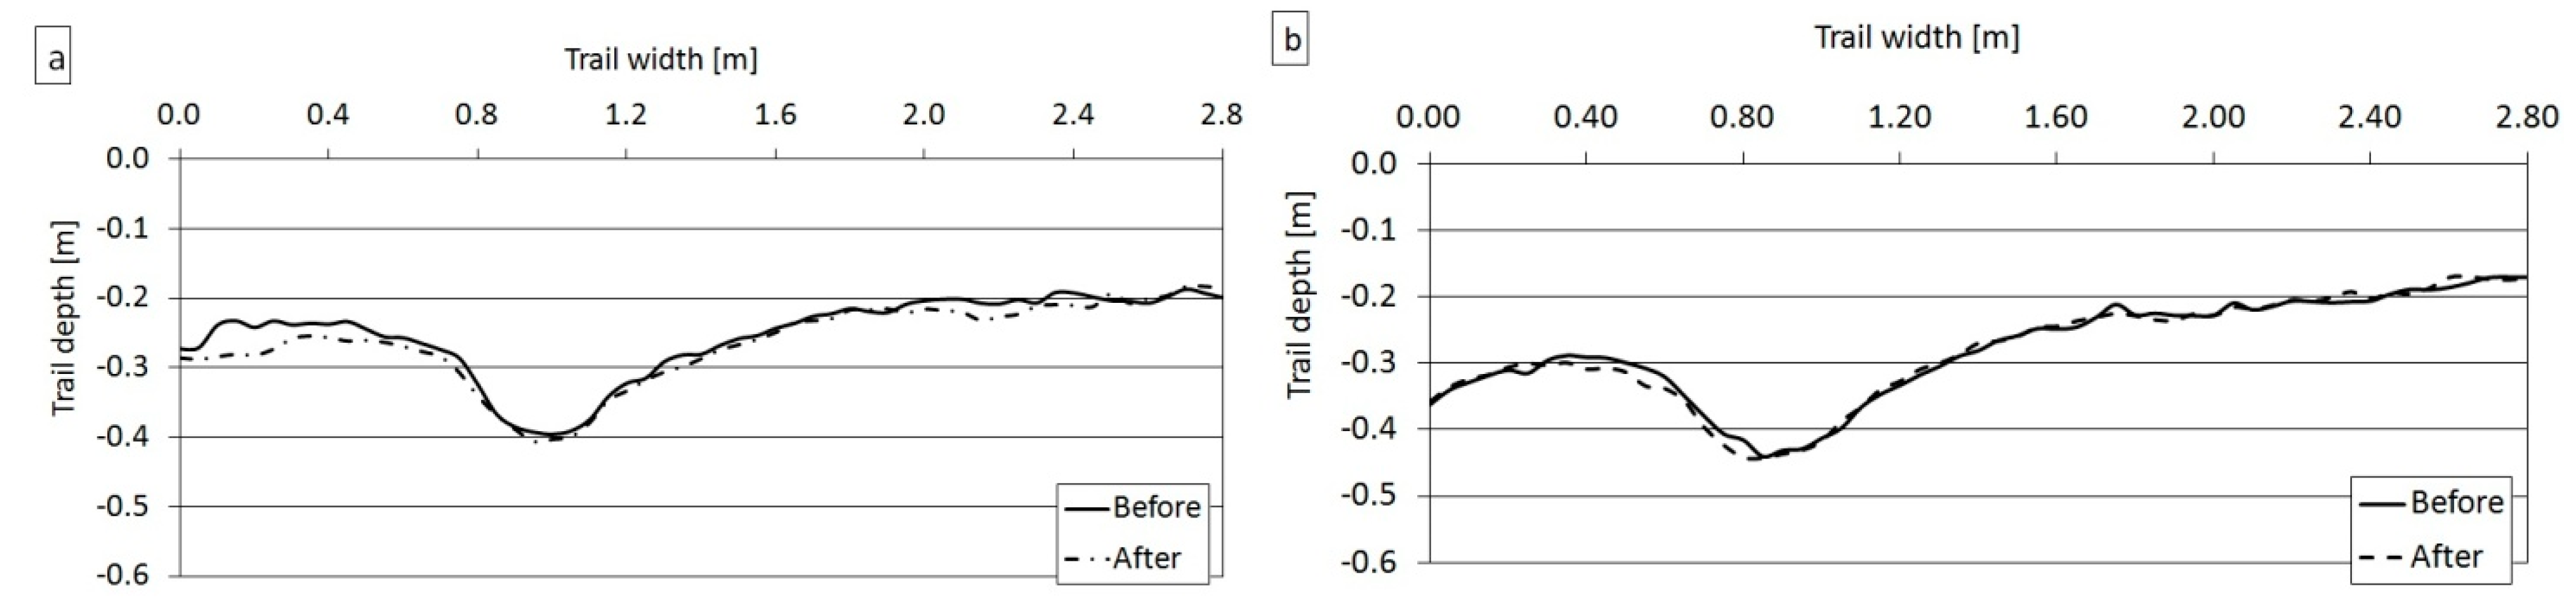
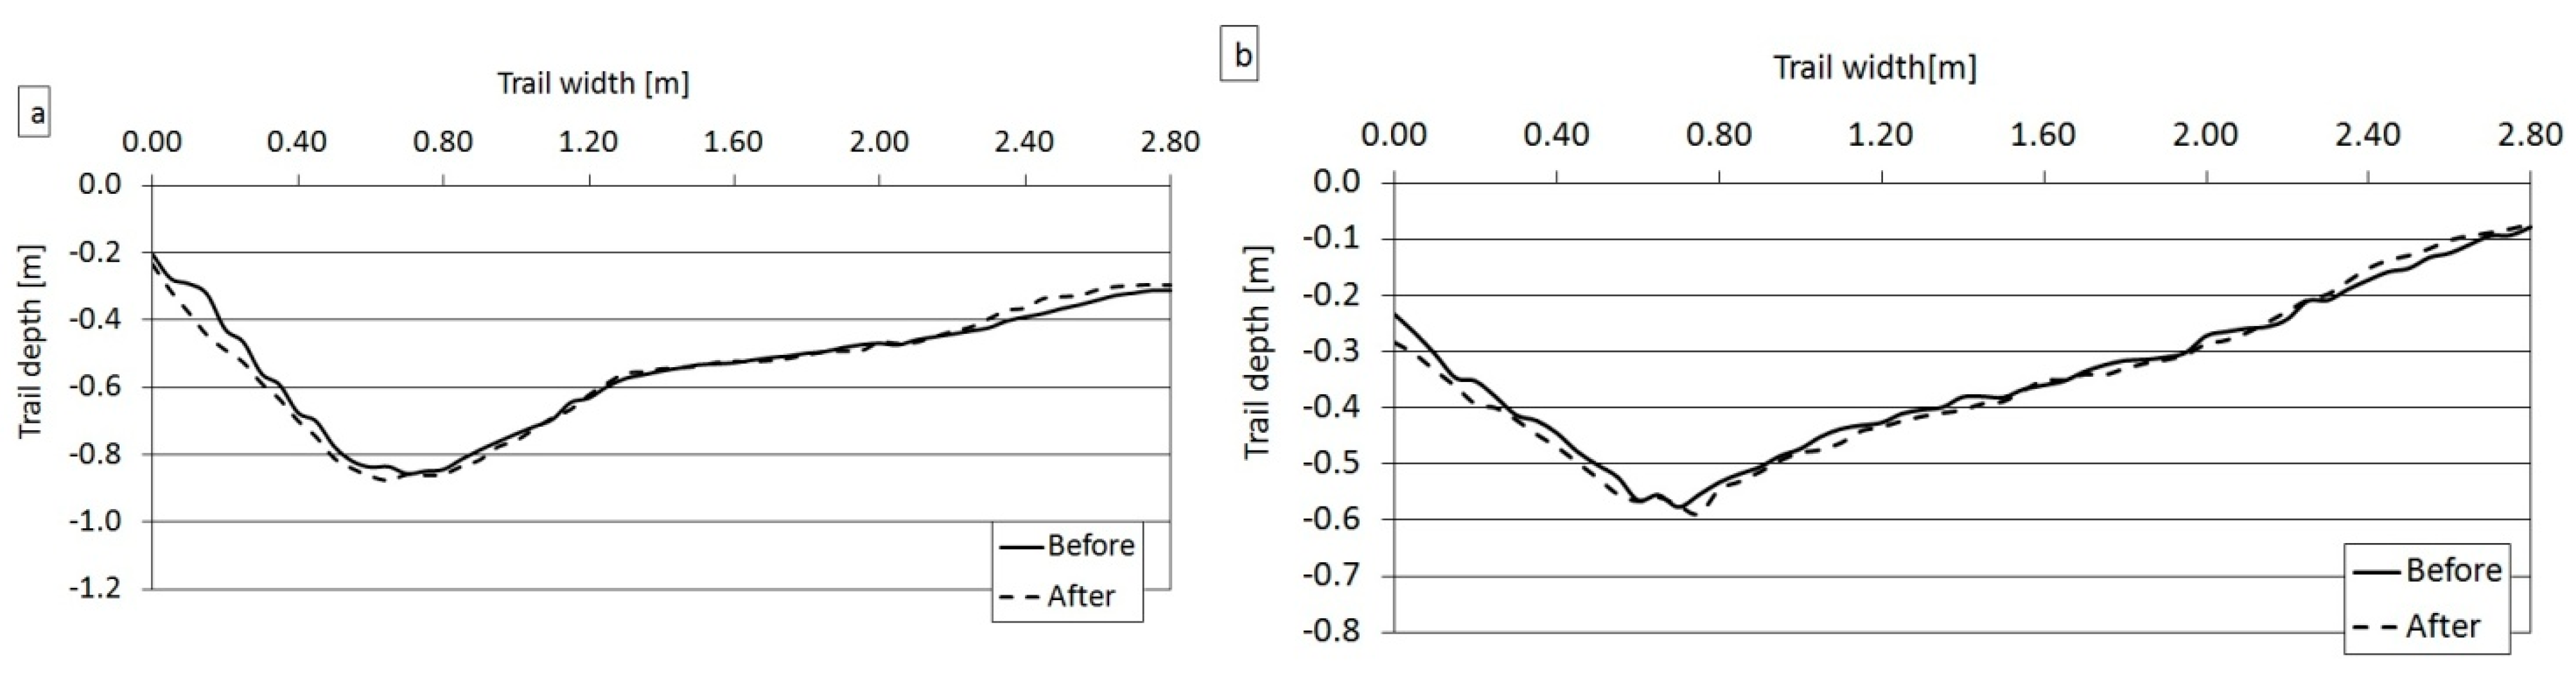
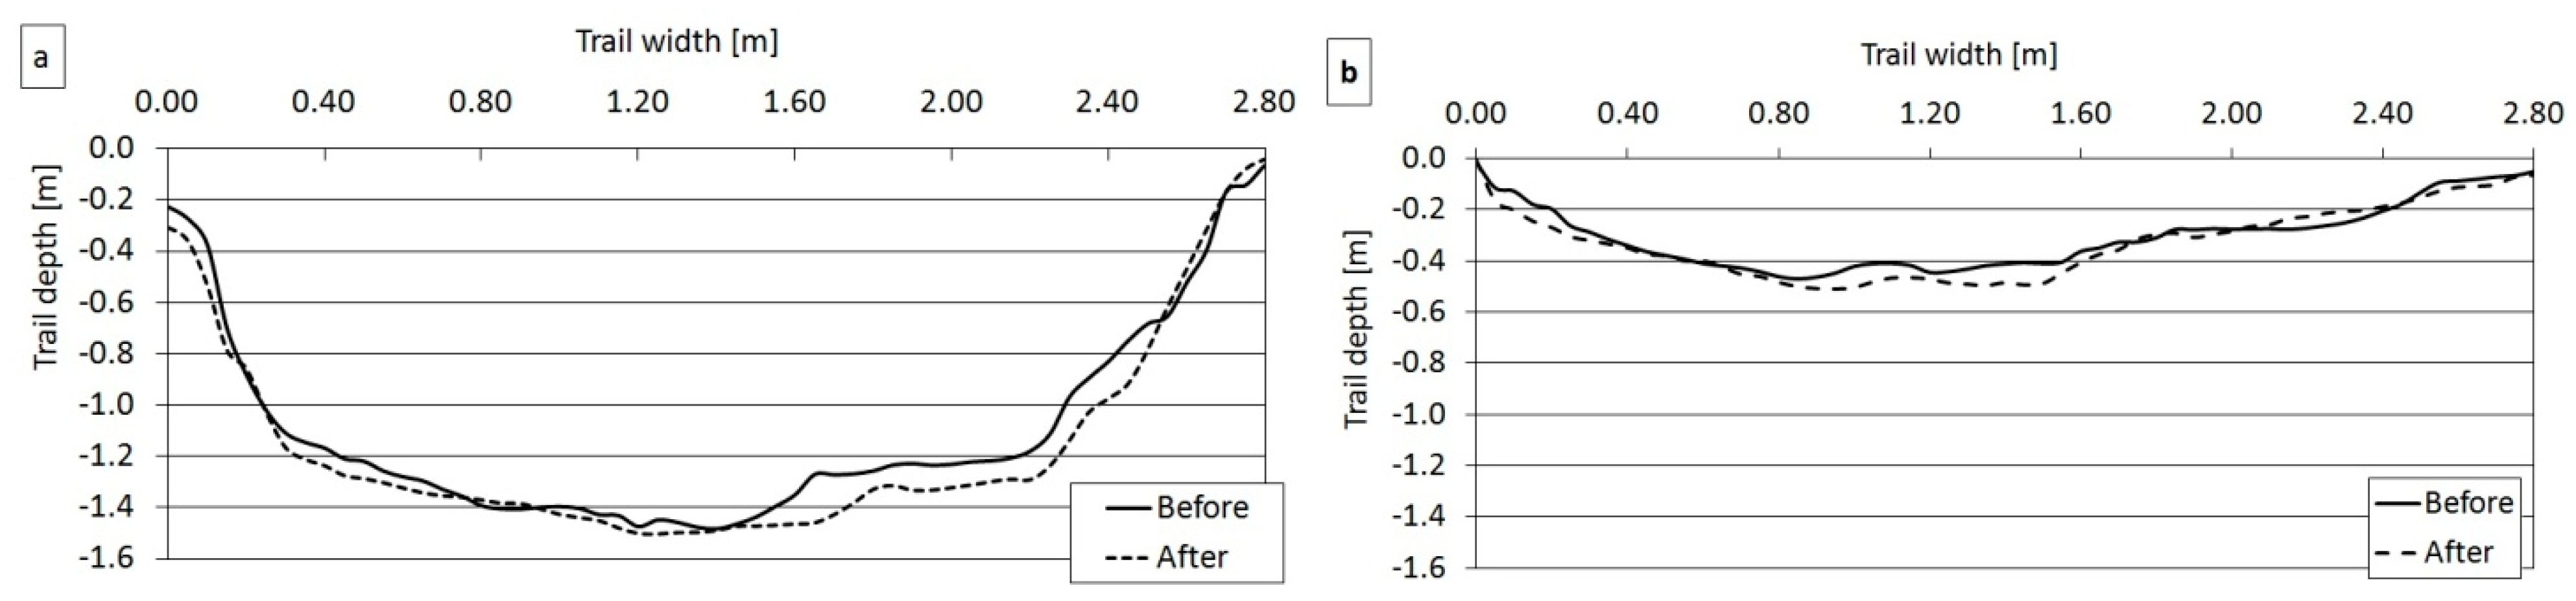
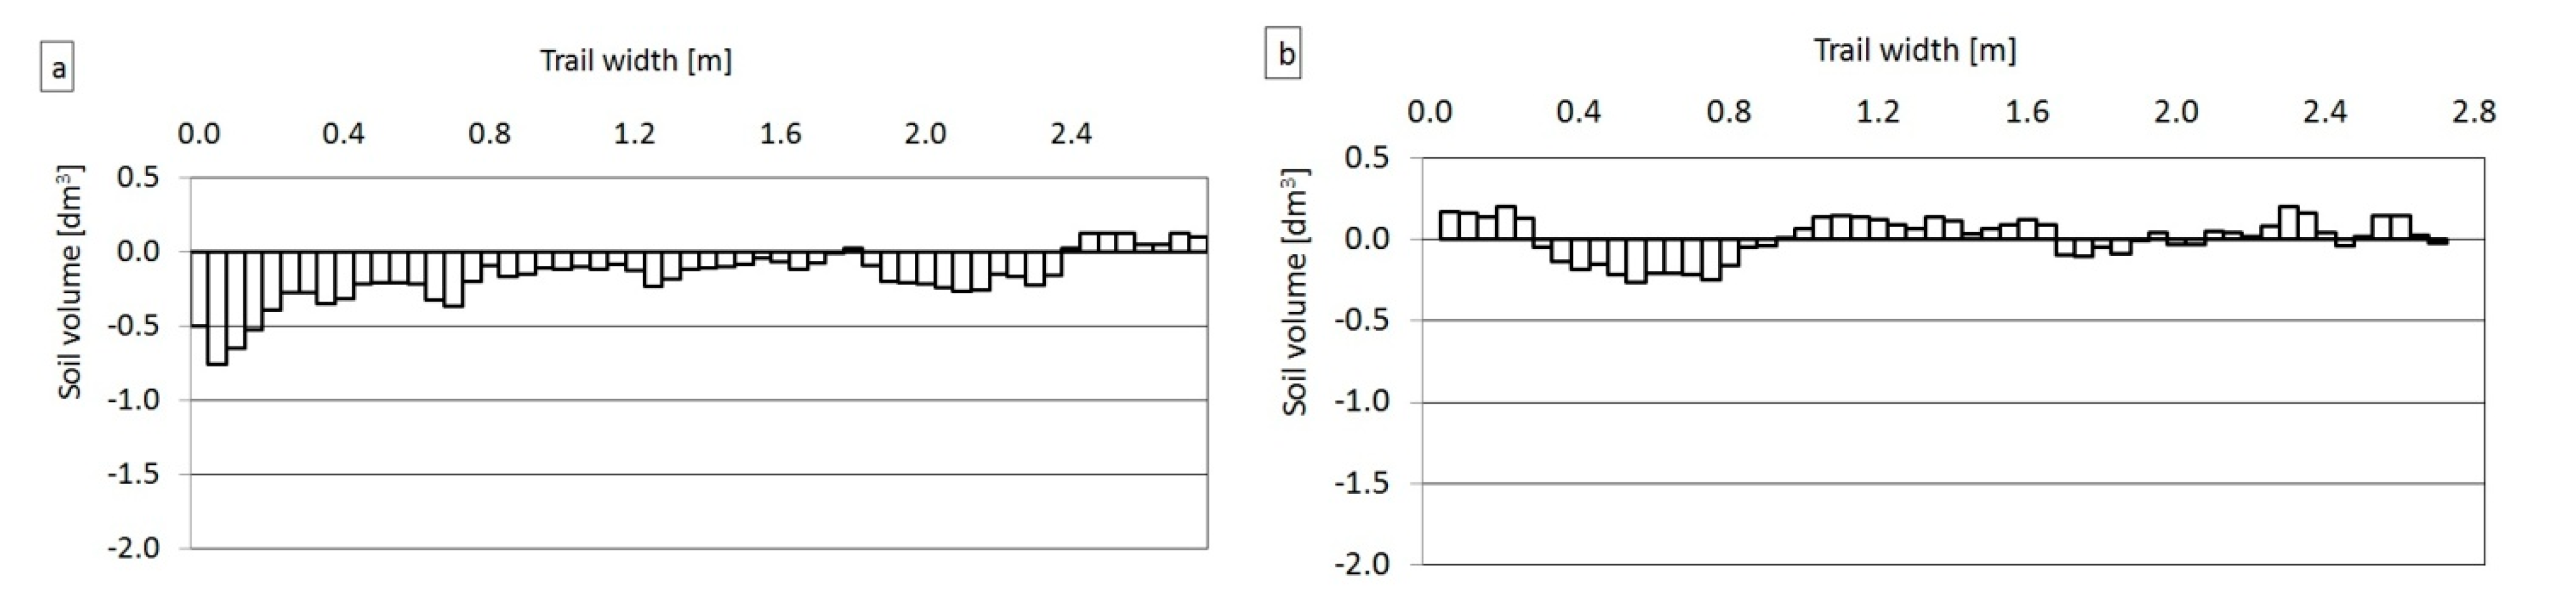
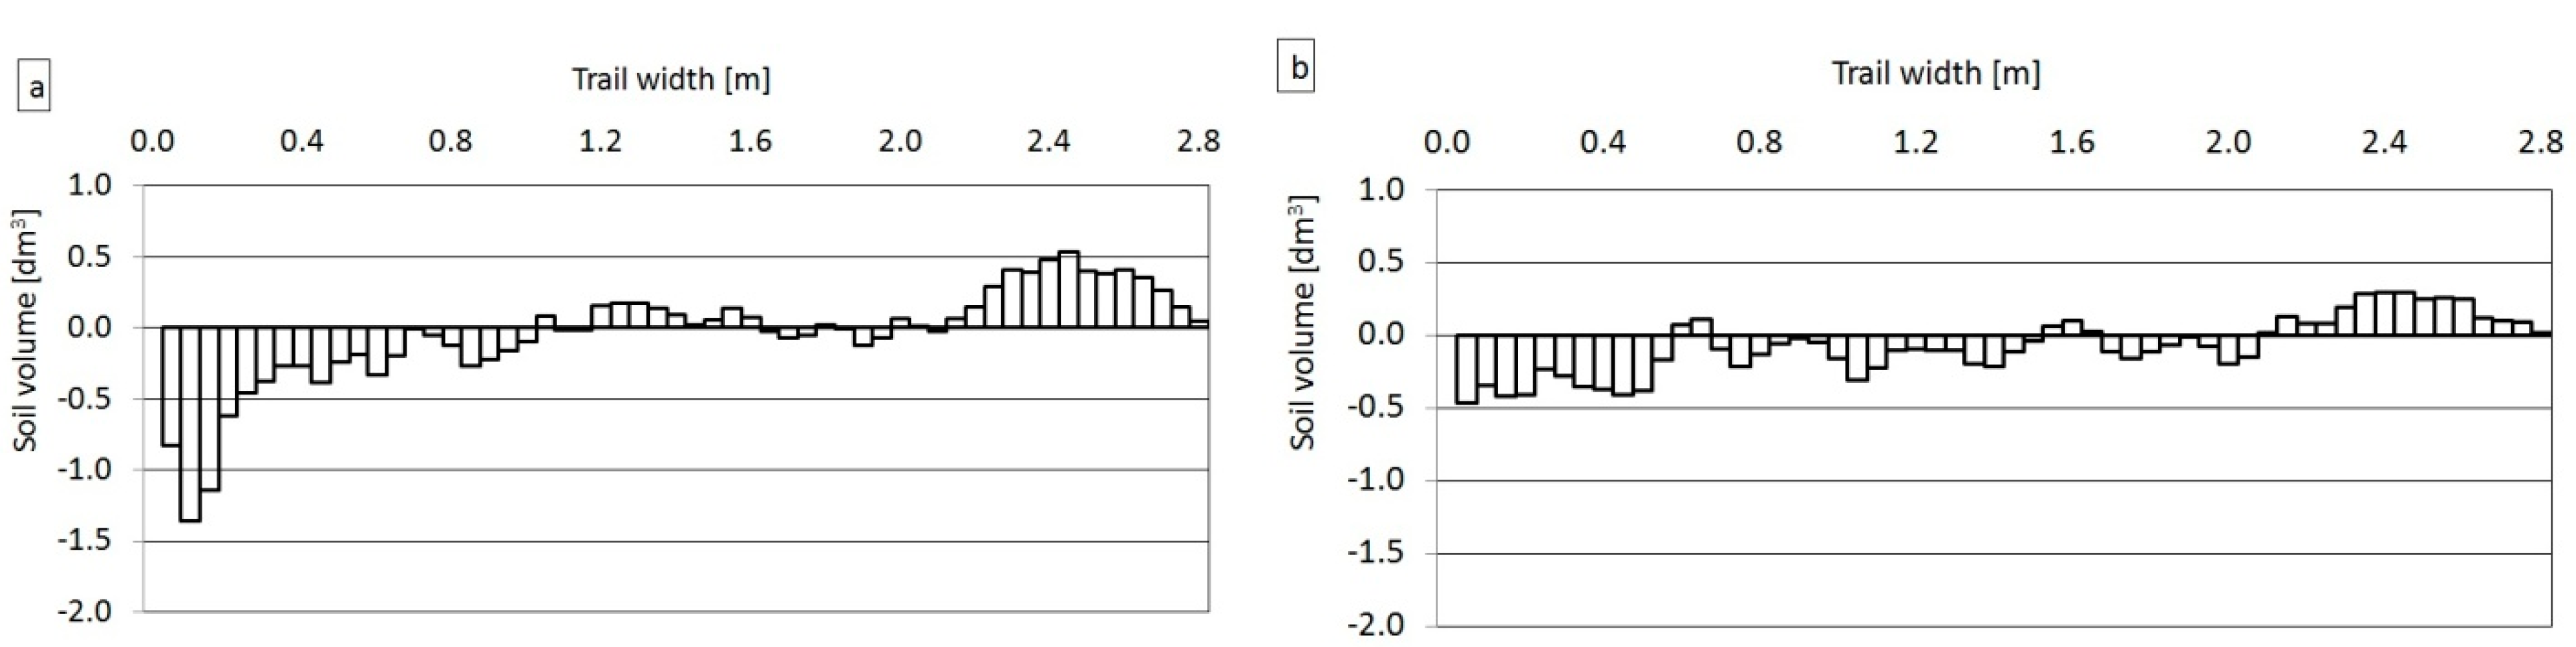
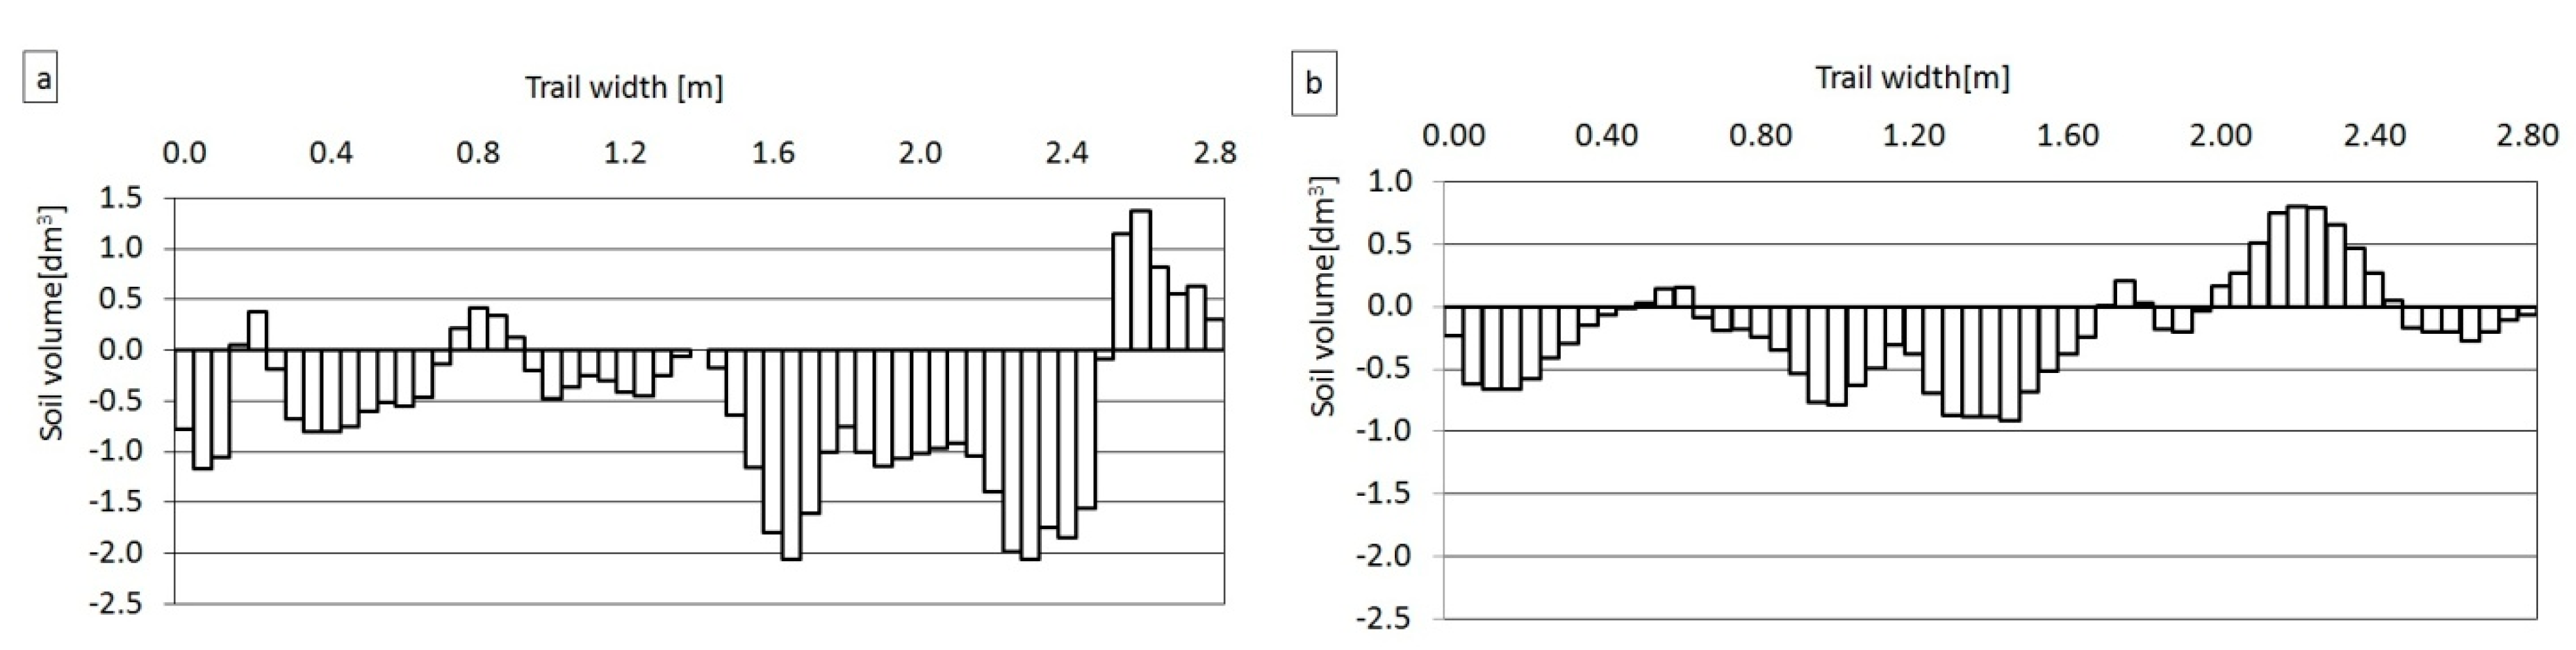
3.3. Surface Relief of Skid Trails

The terrain profiles of horse and tractor trails clearly showed differences (Figure 6, Figure 7 and Figure 8), due to the specific nature of the skidding means. These differences were associated with the following: width of the trails (tractor wheel and horse leg spacing); impact on the soil (point-like hooves in the case of horse and belt-like wheels in the case of tractor); size of the load (different unit weights of the load); and specificity of the load (single pieces skidded by horse and many pieces skidded by tractor). The asymmetry of the horse trails due to their course in the terrain (combination of the slope of the terrain and the course of the trail in relation to the contour lines) was clearly evident (Figure 6 and Figure 7).
The tractor trail (Figure 8), especially in the upper section, was symmetrical due to its straight course descending the hill. All trails showed a change in profile due to skidding (T1 vs T2), as well as in the average and maximum slope which was particularly visible for Tt129U (Table 5).
The maximum rut depths relative to the surface next to the trail (Table 6) varied widely. Before skidding, the maximum rut depth was 1.462 m on tractor trail Tt129, 0.281 m on horse trail Ht129, and 0.679 m on horse trail Ht130. Increases noted in depth after skidding were highest for the tractor trail Tt129L (10.8%) and lowest for the horse trail. For Tt129L, a decrease was observed in rut depth after skidding, which may have been due to the application of soil to the trail during load dragging.
Interesting changes were recorded in soil volumes on the cross section of the trails (Figure 9, Figure 10 and Figure 11). For the horse trails (Ht129 and Ht130), soil loss was evident in the lower parts (L) on the left side where the load was dragged along the trail bed, whereas on the right side the increase in volume was much smaller.
For tractor trail Tt129, a pronounced soil loss was noted in the upper (U) and lower (L) parts of the trail, especially in the longitudinal axis (R). Soil loss from trails in their deepest areas may also have been influenced by surface runoff. According to meteorological data, the period between the measurement dates (T1—29 July 2015 and T2—22 October 2015) was marked by quite heavy rainfall reaching up to 160 mm. The highest total loss of soil from a 10-m long trail (Table 7) was observed in the upper part of the tractor trail Tt129U, amounting to nearly 1.563 m3, while in the lower part of the trail the loss was 0.675 m3 (Tt129L). Significantly lower values of soil loss were recorded on horse trails, ranging from 0.129 to 0.418 m3. For horse trail Ht129U, nearly 15 times more soil was lost compared to the soil deposited due to skidding and other factors between the measurements. The total soil erosion, which was calculated as the difference between soil taken away and soil deposited per 10 m of the trail (Table 7), was found to be the highest on the tractor trail in the upper part (Tt129U), reaching 1.314 m3. A high value of 0.434 m3 was also recorded for the lower part of this trail (Tt129L). For the horse trail Ht129, the erosion was at a relatively high level (0.390 m3) even in the upper part (U).

4. Discussion

The results of the study indicated that necessary logging works carried out in the Gorce National Park do have an impact on the environment, which confirms the statements published by Wałdykowski [12]. Measurements made in two dates, with an interval of three months (T1—29 July 2015 and T2—22 October 2015), during which the existing multiyear trails were used quite intensively (198.2 m3 of timber were felled), indicate changes in soil parameters in the monitored period of time, as well as in the lie of the land on the skid trails. Significant differences were noted in the magnitude of these changes between horse and tractor trails, as indicated by the analyzed soil compactness, moisture content, bulk density, and terrain deformation. These differences were related to the nature of the skidding means used: In easily accessible terrain with a slight incline, skidding of large loads was carried out by a tractor, while in areas with a steep incline where machine operation is problematic, horse skidding was performed. The choice of the skidding means was determined not only by the possibility of using a skidder but also by the need to minimize the environmental load. It is well known that the terrain of the Gorce National Park is susceptible to erosion, which is evidenced by the deeply incised V-shaped valleys, steep slopes, numerous landslides, and a strong network of streams [39], which is associated with the geological structure (flysch formations based on sandstones, conglomerates, and shales of the Magura Nappe) [40,41]. The study area had mainly brown soil with a lot of skeletons [42], and the geological structure of the studied trials and their susceptibility to erosion were reflected by the measurements made. The highest value of average erosion, as expected, was recorded for trail Tt129, where skidding was performed by a tractor. Soil erosion was particularly high in the upper section of this trail, where for a 10-m trail length the eroded soil volume was determined at 1.314 m3. The use of a heavy tractor and repeated skidding of large loads, combined with the significant slope of the terrain, were the factors causing such high erosion. For the horse trails, the erosion values were lower, although in the upper section of trail Ht129, characterized by a significant slope, erosion occurred at a high level (0.390 m3 per 10 m). Elsewhere, erosion was relatively low, and even in the lower section of horse trail Ht129, only a small amount of soil carryover was recorded after skidding (0.029 m3 per 10 m). Obviously, soil gain without loss is detrimental to the ground surface, because it indicates the displacement of soil masses from another section of the trail. The measurements of soil compactness or bulk density indicated significant soil compaction in the case of the tractor trail, which was expected, as a similar effect was reported by other authors [26,43,44,45]. Such changes can be long-lasting and affect plant growth [23,46,47,48]. The physical parameters of soil on this constant perennial skidding trail were not changed significantly by skidding, as they were already found to be high prior to skidding performed during the monitored period. In the case of horse trails, an increase was noted in compactness as well as bulk density, especially on the parts of trails with a steep slope and on the side of the trails that was more heavily loaded during the skidding performed (horse passes and loads from the load). Such changes in the soil (compaction) outside the main route of the horse passage were also noted with horseback touring in a recent study [49]. Furthermore, differences were noted in soil moisture along the trails and in the control between the trails that were in different divisions. This may be related to the remoteness of the studied trails from each other, their different locations, and the differences in forest cover, soil, as well as the intensity of rainfall.

5. Conclusions

The results of the study confirmed the negative effect of tractor skidding on soil parameters and the resulting deformation of the land surface. In the case of horse skidding, deformations in a narrow strip of ground and changes in soil parameters were observed, which resulted from smaller loads of skidded timber and a different impact of horse hooves on the soil compared with tractor wheels. Soil compactness was high across the entire width of the tractor trail and equalized at individual levels, and the increase in values on the trail relative to the control was significantly higher compared to the horse trails. During the monitoring period, soil compactness changed only slightly as a result of skidding, because the skid trails, especially the tractor skid trail, were perennial with fixed levels of compactness. The most important factor increasing erosion on skid trails, next to the skidding method (dragging/semi-forwarding), seems to be the means of skidding used (horse/tractor), which causes tearing of the topsoil layer, soil displacement, and soil compaction in ruts, while longitudinal gradients of used skid trails undoubtedly increase erosion. This is particularly true in the case of skid trails that are actually created during work in the field, without any previous preparation, often running perpendicular to contours, where the soil layers disturbed by skidding are washed away by abundant surface runoff during heavy rainfall. It should be emphasized that the logging technologies applied in the study area corresponded both to the recommendations and logic of performing skidding works by different means depending on terrain conditions. The study confirmed that it is reasonable to use a horse for skidding small loads on a large slope, and a tractor for skidding from places where the load is considerable and on a skid trail designed for many years of skidding.

Author Contributions

Conceptualization, M.K.; methodology, M.K. and J.G.; software, M.K. and J.G.; validation, M.K. and J.G.; formal analysis, M.K. and J.G.; investigation, M.K. and J.G.; resources, M.K. and J.G.; data curation, M.K. and J.G.; writing—original draft preparation, M.K.; writing—review and editing, M.K. and J.G.; visualization, M.K. and J.G.; supervision, M.K.; project administration, M.K.; funding acquisition, M.K. All authors have read and agreed to the published version of the manuscript.

Funding

This work was financed by funds from the Ministry of Science and Higher Education allocated to the statutory activities of the University of Agriculture in Kraków.

Acknowledgments

The authors thank the employees of the Gorce National Park for their cooperation: Paweł Czarnota, professor of the University of Agriculture in Krakow, for the selection of skid trails, and Kazimierz Chwistek, for providing data on the characteristics of tree stands.

Conflicts of Interest

The authors declare no conflict of interest.

References

  1. Lotfalian, M.; Khosrozadeh, S.; Hosseini, S.A.; Kazemi, M.; Zare, N. Determination of forest skid trail density in Caspian forests, Iran. J. For. Sci. 2016, 62, 80–87. [Google Scholar] [CrossRef] [Green Version]
  2. Pentek, T.; Nevečerel, H.; Poršinsky, T.; Pičman, D.; Lepoglavec, K.; Potočnik, I. Methodology for development of secondary forest traffic infrastructure cadastre. Croat. J. For. Eng. 2008, 9, 75–83. [Google Scholar]
  3. Ozturk, T.; Sevgi, O.; E Akay, A. Impact assessment of log skidding on soil condition of skid roads during ground-based logging in a plantation forest in Istanbul, Turkey. Bosque (Valdivia) 2017, 38, 41–46. [Google Scholar] [CrossRef] [Green Version]
  4. Plewniak, J.; Gołąb, J. Gospodarczo-techniczne uwarunkowania procesu projektowania szlaków zrywkowych w lasach górskich. (Economic and technical determinants of the process of designing skidding trails in mountain forests). Infr. Ekol. Ter. Wiejskich 2017, 1, 85–99. [Google Scholar]
  5. Hroššo, B.; Mezei, P.; Potterf, M.; Majdák, A.; Blaženec, M.; Korolyova, N.; Jakuš, R. Drivers of Spruce Bark Beetle (Ips typographus) Infestations on Downed Trees after Severe Windthrow. Forests 2020, 11, 1290. [Google Scholar] [CrossRef]
  6. Wermelinger, B. Ecology and management of the spruce bark beetle Ips typographus—a review of recent research. For. Ecol. Manag. 2004, 202, 67–82. [Google Scholar] [CrossRef]
  7. Nowak, A. Kornik drukarz Ips typographus (L)—naturalny składnik ekosystemów leśnych Puszczy Białowieskiej, czy ich zagrożenie? (The spruce bark beetle Ips typographus (L)—A natural component of the forest ecosystems of the Białowieża Primeval Forest, or is it a threat?). Manag. Environ. Prot. For. 2021, 10, 41–63. [Google Scholar] [CrossRef]
  8. Grodzki, W.; Michalski, J.B. Historia gradacji kornika drukarza. (History of the spruce bark beetle outbreak). In Kornik Drukarz i Jego Rola w Ekosystemach Leśnych; OWRLP: Bedoń, Poland, 2013; pp. 109–122. [Google Scholar]
  9. Solgi, A.; Najafi, A.; Ezzati, S.; Ferencik, M. Assessment of ground-based skidding impacts on the horizontally rate and extent of soil disturbance along the margin of the skid trail. Ann. For. Sci. 2016, 73, 513–522. [Google Scholar] [CrossRef] [Green Version]
  10. Zenner, E.K.; Fauskee, J.T.; Berger, A.L.; Puettmann, K.J. Impacts of Skidding Traffic Intensity on Soil Disturbance, Soil Recovery, and Aspen Regeneration in North Central Minnesota. North. J. Appl. For. 2007, 24, 177–183. [Google Scholar] [CrossRef] [Green Version]
  11. Ilintsev, A.; Nakvasina, E.; Aleynikov, A.; Tretyakov, S.; Koptev, S.; Bogdanov, A. Middle-term changes in topsoils properties on skidding trails and cutting strips after long-gradual cutting: A case study in the boreal forest of the north-east of Russia. Croat. J. For. Eng. 2018, 39, 71–83. [Google Scholar]
  12. Wałdykowski, P. Wpływ dróg górskich na dynamikę procesów morfogenetycznych w rejonie Turbacza. (The influence of mountain roads on dynamic of morphogenetic processes in the Turbacz region). J. Prot. West. Beskids Publ. House Gorczański Natl. Park Poręba Wielka Polska 2006, 1, 67–79. [Google Scholar]
  13. Appendix 1. Plan ochrony dla gorczańskiego parku narodowego. (Protection Plan for the Gorce National Park); Annex to the ordinance of the Minister of the Environment of Poland of 15 January 2018; Minister of the Environment of Poland: Warsaw, Poland, 2018; pp. 1–141. [Google Scholar]
  14. Duka, A.; Grigolato, S.; Papa, I.; Pentek, T.; Poršinsky, T. Assessment of timber extraction distance and skid road network in steep karst terrain. iForest Biogeosci. For. 2017, 10, 886–894. [Google Scholar] [CrossRef] [Green Version]
  15. Rudov, S.E.; Voronova, A.M.; Chemshikova, J.M.; Teterevleva, E.V.; Kruchinin, I.N.; Dondokov, Y.Z.; Khaldeeva, M.N.; Burtseva, I.A.; Danilov, V.V.; Grigorev, I.V. Theoretical Approaches to Logging Trail Network Planning: Increasing Efficiency of Forest Machines and Reducing Their Negative Impact on Soil and Terrain. Asian J. Water Environ. Pollut. 2019, 16, 61–75. [Google Scholar] [CrossRef]
  16. Košir, B.; Marenče, J. Assessing maximum loads when skidding wood uphill with tractors. Zbor. Goz. Les. 2008, 86, 21–31. [Google Scholar]
  17. Kormanek, M.; Dvořák, J. Ground Pressure Changes Caused by MHT 8002HV Crawler Harvester Chassis. Croat. J. For. Eng. 2021, 42, 201–211. [Google Scholar] [CrossRef]
  18. Kulak, D.; Szewczyk, G.; Stańczykiewicz, A. Rozmiar i rozmieszczenie naruszeń wierzchnich warstw gleby przy zrywce konnej w trzebieżach wczesnych drzewostanów jodłowych. (Extension and distribution of injuries to upper soil layers during horse skidding in early fir stands’ thinning). Nauka Przyr. Technol. 2014, 8, 1–5. [Google Scholar]
  19. Najafi, A.; Solgi, A.; Sadeghi, S.H. Soil disturbance following four-wheel rubber skidding logging on the steep road in the north mountainous forest of Iran. Soil Till. Res. 2009, 103, 165–169. [Google Scholar] [CrossRef]
  20. Lotfalian, M.; Fallah, A.; Moafi, M.; Nobakht, A. Determining the maximum allowable cross slope of skid trails for rubber-tired skidder Timberjack 450C. Ann. Biol. Res. 2012, 3, 3805–3810. [Google Scholar]
  21. Sakai, H.; Nordfjell, T.; Saudicani, K.; Talbot, B.; Bollehuus, E. Soil compaction on forest soils from different kinds of tires and tracks and possibility of accurate estimate. Croat. J. For. Eng. 2008, 29, 15–27. [Google Scholar]
  22. Kremers, J.; Boosten, M. Soil compaction and deformation in forest exploitation. Am. J. Altern. Agric. 2018, 7, 25–31. [Google Scholar]
  23. Prameswari, D.; Supriyanto; Saharjo, B.H.; Wasis, B.; Pamoengkas, P. Effects of biopore infiltration holes and cross drain on soil properties on skidding roads and natural production forest. IOP Conf. Ser. Earth Environ. Sci. 2020, 533. [Google Scholar] [CrossRef]
  24. Croke, J.; Hairsine, P.; Fogarty, P. Soil recovery from track construction and harvesting changes in surface infiltration, erosion and delivery rates with time. For. Ecol. Manag. 2001, 143, 3–12. [Google Scholar] [CrossRef]
  25. Najafi, A.; Solgi, A.; Sadeghi, S.H. Effects of skid trail slope and ground skidding on soil disturbance. Caspian J. Env. Sci. 2010, 8, 13–23. [Google Scholar]
  26. Kulak, D.; Stańczykiewicz, A.; Szewczyk, G.; Lubera, A.; Strojny, T. Factors affecting the changes in penetration resistance of forest soils during timber harvesting. Sylwan 2015, 159, 318–325. [Google Scholar]
  27. Solgi, A.; Naghdi, R.; Tsioras, P.A.; Ilstedt, U.; Salehi, A.; Nikooy, M. Combined effects of skidding direction, skid trail slope and traffic frequency on soil disturbance in North Mountainous Forest of Iran. Croat. J. For. Eng. 2017, 38, 97–106. [Google Scholar]
  28. Han, H.-S.; Page-Dumroese, D.; Han, S.-K.; Tirocke, J. Effects of Slash, Machine Passes, and Soil Moisture on Penetration Resistance in a Cut-to-length Harvesting. Int. J. For. Eng. 2006, 17, 11–24. [Google Scholar] [CrossRef]
  29. Allman, M.; Jankovský, M.; Messingerová, V.; Allmanová, Z. Soil moisture content as a predictor of soil disturbance caused by wheeled forest harvesting machines on soils of the Western Carpathians. J. For. Res. 2017, 28, 283–289. [Google Scholar] [CrossRef]
  30. Williamson, J.R.; Neilsen, W.A. The influence of forest site on rate and extent of soil compaction and profile disturbance of skid trails during ground-based harvesting. Can. J. For. Res. 2000, 30, 1196–1205. [Google Scholar] [CrossRef]
  31. Makineci, E.; Demir, M.; Comez, A.; Yilmaz, E. Chemical characteristics of the surface soil, herbaceous cover and organic layer of a compacted skidding road in a fir (Abies bornmulleriana Mattf.) forest. Transp. Res. Part D 2007, 12, 453–459. [Google Scholar] [CrossRef]
  32. Kucharzyk, S. Dawne oraz współczesne drogi leśne i szlaki zrywkowe w waloryzacji naturalności ekosystemów leśnych w Bieszczadzkim Parku Narodowym (Former and modern forest roads and skid trails in forest naturalness assessment in the Bieszczady National Park). Roczniki Bieszczadzkie 2015, 23, 95–109. [Google Scholar]
  33. Szabla, K. Praktyczna Realizacja Strategii Ograniczania Liczebności Kornika Drukarza na Przykładzie Świerczyn Beskidu Śląskiego i Żywieckiego w latach 2007–2010. (Practical Implementation of the Strategy of Reducing the Number of the Spruce Bark Beetle on the Example of the Spruce Forests of the Silesian Beskids and Żywiecki in the Years 2007–2010). In Kornik Drukarz i Jego Rola w Ekosystemach Leśnych; OWRLP: Bedoń, Poland, 2013; pp. 161–178. [Google Scholar]
  34. Standard PN-EN ISO 14688. Badania Geotechniczne—Oznaczanie i Klasyfikowanie Gruntów—Część 2: Zasady Klasyfikowania (Geotechnical Research Soil Identification and Classification—Part 2: Classification Rules); Polish Committee for Standardization: Warsaw, Polska, 2018; pp. 1–12. [Google Scholar]
  35. Standard PN-ISO 11465. Jakość Gleby—Oznaczanie Zawartości Suchej Masy Gleby i Wody w Glebie w Przeliczeniu na Suchą Masę Gleby—Metoda Wagowa. (Soil Quality—Determination of Soil Dry Weight and Soil Water Based on Soil Dry Weight—Weight Method); Polish Committee for Standardization: Warsaw, Polska, 1999; pp. 1–4. [Google Scholar]
  36. Herrick, J.E.; Jones, T.L. A dynamic cone penetrometer for measuring soil penetration resistance. Soil Sci. Soc. Am. J. 2002, 66, 1320–1324. [Google Scholar] [CrossRef]
  37. ASAE Standards. Soil Cone Penetrometer; ASAE: Washington, DC, USA, 1998; pp. 820–821. [Google Scholar]
  38. Kozłowski, R. Przestrzenne zróżnicowanie opadu podokapowego w drzewostanie jodłowo-bukowym w centralnej części Gór Świętokrzyskich. (Spatial differentiation of the throughfall in the Fir-Beech forest stand in the central part of the Świętokrzyskie Mountains). Regional Monitoring of the Natural Environment Report. State Environ. 2003, 4, 99–106. [Google Scholar]
  39. Available online: http://www.gorczanskipark.pl (accessed on 23 February 2021).
  40. Cieszkowski, M. Geologiczne walory naukowe Gorczańskiego Parku Narodowego i jego otoczenia. (Scientific geological atractions of Gorce National Park and its surroundings). J. Prot. Western Beskids Publ. House Gorczański Natl. Park. 2006, 1, 45–57. [Google Scholar]
  41. Kondracki, J. Geografia regionalna Polski. (Regional geography of Poland); Polish Scientific Publishers: Warszawa, Polska, 2011; pp. 420–444. [Google Scholar]
  42. Mocek, A.; Drzymała, S. Geneza analiza i klasyfikacja gleb. (Genesis, Soil Analysis and Classification); Publishing House of the University of Poznań: Poznań, Polska, 2010; pp. 1–418. [Google Scholar]
  43. Solgi, A.; Naghdi, R.; Marchi, E.; Laschi, A.; Behjou, F.K.; Hemmati, V.; Masumian, A. Impact Assessment of Skidding Extraction: Effects on Physical and Chemical Properties of Forest Soils and on Maple Seedling Growing along the Skid Trail. Forests 2019, 10, 134. [Google Scholar] [CrossRef] [Green Version]
  44. Achilles, F.; Tischer, A.; Bernhardt-Römermann, M.; Chmara, I.; Achilles, M.; Michalzik, B. Effects of Moderate Nitrate and Low Sulphate Depositions on the Status of Soil Base Cation Pools and Recent Mineral Soil Acidification at Forest Conversion Sites with European Beech (“Green Eyes”) Embedded in Norway Spruce and Scots Pine Stands. Forests 2021, 12, 573. [Google Scholar] [CrossRef]
  45. Potter, C.; Hugny, C. Wildfire effects on permafrost and soil moisture in spruce forests of interior Alaska. J. For. Res. 2020, 31, 553–563. [Google Scholar] [CrossRef]
  46. Jourgholami, M. Effects of soil compaction on growth variables in Cappadocian maple (Acer cappadocicum) seedlings. J. For. Res. 2017, 29, 1–10. [Google Scholar] [CrossRef]
  47. Rab, M.A. Recovery of soil physical properties from compaction and soil profile disturbance caused by logging of native forest in Victorian Central Highlands. Aust. For. Ecol. Manag. 2004, 191, 329–340. [Google Scholar] [CrossRef]
  48. Stańczykiewicz, A.; Szewczyk, G.; Kulak, D. Damage to advance growth resulting from timber harvesting during final cuttings. Balt. For. 2015, 21, 143–150. [Google Scholar]
  49. Dudek, T.; Rejman, B. Wpływ turystyki jeździeckiej na środowisko leśne na przykładzie nadleśnictwa Leżajsk. (Impact of equestrian tourism on the forest environment based on the Leżajsk forest district). Acta Sci. Pol. Silv. Colendar. Ratio Ind. Lignar. 2019, 18, 245–250. [Google Scholar]
Figure 1. Photographs of the sections of skid trails selected for the study: (a) Ht129U, (b) Ht129L, (c) Ht130U, (d) Ht130L, (e) Tt129U, and (f) Tt129L.
Forests 12 00797 g001aForests 12 00797 g001b
Figure 2. Scheme of making measurements on horse (Ht129, Ht130) and tractor (Tt129) skid trails.
Forests 12 00797 g002
Figure 3. Cone impact penetrometer: (a) scheme of the penetrometer: 1—cone, 2—introductory rod, 3—bumper, 4—weight, 5—guide, 6—handle, 7—indicator, and 8—linear gauge; (b) penetrometer measurements in the field (photo: Rygalik).
Forests 12 00797 g003
Figure 4. Changes in the values of (a) moisture content MC and (b) dry bulk density BD in relation to control.
Forests 12 00797 g004
Figure 5. Increase in soil compactness PR on trails relative to control recorded for depths p1 (0.0–10 cm), p2 (10.1–20 cm), and p3 (20.1–30 cm).
Forests 12 00797 g005
Figure 6. Topography on the trail sections before and after skidding: (a) Ht129U and (b) Ht129L.
Forests 12 00797 g006
Figure 7. Topography on the trail sections before and after skidding: (a) Ht130U and (b) Ht130L.
Forests 12 00797 g007
Figure 8. Topography on the trail sections before and after skidding: (a) Tt129U and (b) Tt129L.
Forests 12 00797 g008
Figure 9. Changes in soil volume on trail sections before and after skidding: (a) Ht129U and (b) Ht129L.
Forests 12 00797 g009
Figure 10. Changes in soil volume on trail sections before and after skidding: (a) Ht130U and (b) Ht130L.
Forests 12 00797 g010
Figure 11. Changes in soil volume on trail sections before and after skidding: (a) Tt129U and (b) Tt129L.
Forests 12 00797 g011
Table 1. Characteristics of the trails and study area.
TrailHt129UHt129LHt130UHt130LTt129UTt129L
Slope28.8%26.4%33.4%29.4%11.4%11.3%
Habitat typeFresh mixed mountain forest
Stand
Abundance, age
5 beech, 3 fir, 2 spruce
255 m3·ha−1; 110 years
8 beech, 1 spruce, 1 fir
311 m3·ha−1; 130 years
5 beech, 3 fir, 2 spruce
255 m3·ha−1; 110 years
UndergrowthLackBraun’s holly fern Polystichum braunii (Spenn.)Lack
Granulometric composition [34]Sa/Si/Cl [%]
70.3/25.0/4.7
Sa/Si/Cl [%]
71.8/24.1/4.1
Sa/Si/Cl [%]
68.2/26.8/4.7
Sa/Si/Cl [%]
68.7/26.3/5.1
Sa/Si/Cl [%]
48.0/43.0/9.0
Sa/Si/Cl [%]
59.6/33.9/6.4
Soil typeLeached brown
Table 2. Skidding intensity in the study area between dates T1 and T2 (Gorce National Park data).
Skid TrailNumber of Loaded Transport Passes (3 Months)Average Volume of a Single Wood Load [m3]Total Volume of Skidded Wood [m3]
Ht129200.6 ± 0.0412.1
Ht130100.6 ± 0.026.0
Ht129513.5 ± 0.30180.1
Table 3. Mean (±SD) current soil moisture and dry bulk density in trails and control plots (superscript a–d: homogeneous groups determined by Tukey’s test, p < 0.05).
TrailDateMoisture MC (g∙g−1)Dry Bulk Density BD (g∙cm−3)
LRRRRContrLRRRRContr
Ht129UT10.462 a
±0.37
0.435 b
±0.038
0.450 c
±0.040
0.499 d
±0.036
0.880 b
±0.062
1.123 d
±0.080
0.973 c
±0.069
0.692 a
±0.049
T20.660 a
±0.053
0.471 b
±0.044
0.728 c
±0.058
0.670 a
±0.054
0.840 b
±0.060
1.083 c
±0.077
1.010 c
±0.062
0.678 a
±0.048
Ht129LT10.416 a
±0.04
0.465 b
±0.042
0.466 b
±0.039
0.499 c
±0.040
0.872 b
±0.062
0.980 c
±0.070
0.943 c
±0.067
0.631 a
±0.045
T20.384 a
±3.1
0.557 b
±0.050
0.678 c
±0.061
0.590 d
±0.047
0.896 b
±0.055
1.011 c
±0.062
0.978 c
±0.069
0.662 a
±0.047
Ht130UT10.660 a
±0.053
0.471 b
±0.038
0.728 c
±0.058
0.670 a
±0.054
0.878 b
±0.054
1.028 c
±0.063
1.014 c
±0.062
0.673 a
±0.046
T20.366 a
±0.033
0.635 b
±0.006
0.422 c
±0.004
0.525 d
±0.042
0.838 b
±0.051
0.988 c
±0.060
1.026 c
±0.063
0.651 a
±0.048
Ht130LT10.386 a
±0.035
0.546 c
±0.005
0.391 a
±0.004
0.491 b
±0.039
0.889 b
±0.063
1.045 c
±0.064
1.020 c
±0.062
0.685 a
±0.042
T20.344 a
±0.031
0.468 b
±0.006
0.456 b
±0.005
0.519 c
±0.042
0.849 b
±0.060
1.005 c
±0.071
1.052 c
±0.075
0.669 a
±0.041
Ht129UT10.533 d
±0.029
0.127 a
±0.048
0.165 b
±0.003
0.325 c
±0.026
1.300 b
±0.108
1.345 c
±0.082
1.379 c
±0.097
0.741 a
±0.045
T20.591 d
±0.032
0.161 a
±0.053
0.187 b
±0.023
0.363 c
±0.029
1.276 b
±0.112
1.305 c
±0.088
1.379 c
±0.103
0.717 a
±0.051
Ht129LT10.130 a
±0.018
0.137 a
±0.025
0.131 a
±0.018
0.183 b
±0.023
1.341 b
±0.122
1.859 c
±0.095
1.342 b
±0.132
0.914 a
±0.065
T20.165 a
±0.021
0.162 a
±0.019
0.165 a
±0.022
0.214 b
±0.025
1.301 b
±0.121
1.819 c
±0.098
1.302 b
±0.129
0.874 a
±0.062
Table 4. Mean (±SD) soil compactness in trails and control plots (superscript a–d: homogeneous groups determined by Tukey’s test, p < 0.05).
TrailDatePenetration Resistance PR [MPa]
Depth p1: 0.0–10.0 cmDepth p2: 10.1–20.0 cmDepth p3: 20.1–30.0 cm
LRRRRContrLRRRRContrLRRRRContr
Ht129UT12.42 a
±1.68
4.24 b
±2.01
4.94 b
±1.26
2.24 a
±1.05
1.74 a
±0.76
2.81 ab
±0.86
3.80 b
±2.55
1.74 a
±1.49
2.72 a
±0.68
4.48 b
±1.35
2.74 a
±2.20
3.13 a
±1.88
T22.16 a
±0.99
5.83 b
±4.66
5.30 b
±1.54
2.12 a
±0.62
1.62 a
±0.92
2.75 b
±0.85
3.03 b
±1.12
1.55 a
±0.95
2.67 a
±0.88
4.44 b
±1.31
2.25 a
±0.62
3.09 a
±1.64
Ht129LT12.50 ab
±0.66
3.07 a
±2.13
3.48 a
±1.85
2.06 ab
±0.73
2.13 a
±0.95
4.74 b
±1.18
4.77 b
±2.17
1.62 a
±0.89
1.35 a
±0.68
3.20 a
±2.33
2.84 a
±2.20
2.74 a
±0.97
T22.48 ab
±0.62
2.86 a
±1.64
3.19 a
±1.00
1.92 b
±0.64
2.28 a
±1.24
5.00 b
±1.54
4.86 b
±2.36
1.66 a
±0.92
1.19 a
±0.66
2.79 b
±0.90
2.23 b
±0.49
2.73 b
±0.92
Ht130UT12.24 a
±0.96
6.87 b
±3.26
4.44 a
±4.07
2.21 a
±1.01
1.62 a
±0.98
7.39 b
±2.00
1.49 a
±0.26
1.74 a
±1.49
2.40 a
±0.78
5.60 b
±2.69
7.56 c
±5.12
3.09 a
±1.58
T22.29 a
±1.40
7.40 b
±3.91
3.68 a
±1.26
2.47 a
±2.01
1.82 a
±1.12
7.30 b
±1.99
1.84 a
±0.69
1.32 a
±0.45
2.65 a
±0.19
5.37 a
±2.72
7.85 b
±4.57
3.09 a
±1.58
Ht130LT12.09 a
±0.48
3.54 a
±1.72
4.71 b
±3.61
2.02 a
±0.56
3.38 a
±2.01
7.20 b
±5.36
8.84 b
±3.98
2.91 a
±0.91
1.59 a
±0.38
5.50 b
±6.10
4.95 a
±3.49
1.30 a
±0.32
T22.12 a
±0.46
3.72 bc
±2.42
5.18 c
±3.59
2.52 ab
±1.32
2.92 a
±1.01
8.54 b
±5.32
8.54 c
±3.81
3.05 a
±1.12
1.69 a
±0.38
5.55 b
±6.00
5.22 a
±3.70
1.36 a
±0.70
Tt129UT13.42 a
±1.04
7.92 b
±2.66
3.57 a
±1.12
2.12 a
±1.05
4.31 a
±0.88
8.29 b
±2.43
6.38 b
±1.99
1.97 a
±1.49
3.74 a
±1.32
5.66 a
±0.86
6.49 b
±4.83
4.08 a
±2.14
T23.92 a
±1.17
7.63 b
±2.72
3.59 a
±1.12
2.15 a
±1.1
4.51 a
±0.88
8.48 c
±2.22
6.09 b
±1.99
2.42 a
±1.73
3.54 a
±1.39
6.10 b
±0.86
6.59 b
±4.83
4.02 a
±1.98
Tt129LT14.23 a
±2.22
6.18 a
±1.95
4.71 a
±2.04
2.42 b
±3.55
5.85 a
±1.87
6.34 b
±1.97
5.35 ab
±2.16
1.75 c
±0.47
4.08 a
±1.66
4.89 a
±1.56
5.05 a
±1.79
5.67 b
±3.21
T23.83 ab
±2.13
6.26 b
±2.04
4.83 ab
±2.05
2.51 a
±4.32
4.51 a
±1.85
6.43 ab
±2.05
5.49 b
±2.15
1.78 c
±0.39
4.18 a
±1.66
4.75 a
±1.56
4.90 a
±2.01
5.82 b
±3.4
Table 5. Average and maximum ground slope in the central 1.5-m-wide section of the trail before (T1) and after timber skidding (T2).
Measurement VariantAverage/Maximum Slope Calculated for Profiles I and III (%)
Ht129UHt129LHt130UHt130LTt129UTt129L
Before skidding35.3/42.829.3/34.260.1/68.626.4/36.211.4/24.88.1/17.2
After skidding40.4/44.626.0/31.850.3/58.826.9/35.225.2/39.03.1/19.2
Change (%)14.2/4.2−11.3/−7.0−16.3/−14.31.8/−2.8−121.2/57.3−61.4/11.6
Table 6. Average and maximum depth in the central 1.5-m-wide section of the trail before (T1) and after timber skidding (T2).
Measurement VariantAverage/Maximum Depth on the Trail Calculated for Profiles I, II, and III (cm)
Ht129UHt129LHt130UHt130LTt129UTt129L
Before skidding10.5/22.414.4/28.241.8/67.931.9/49.8128.5/142.936.9/46.0
After skidding11.4/23.414.0/28.142.4/68.933.4/51.7134.8/146.240.8/51.0
Change (%)8.7/4.6−2.5/−0.61.4/1.54.8/3.94.9/2.310.5/10.8
Table 7. Volume of soil applied, moved, and stripped from the trail after skidding.
Soil KindSoil Volume (m3) for 10-m Trail Length
Ht129UHt129LHt130UHt130LTt129UTt129L
(lo)0.4180.1290.3940.3121.5630.675
(ap)0.0280.1580.2740.1190.2490.241
(lo) + (ap)0.4460.2880.6690.4311.8120.917
(lo) − (ap)0.390−0.0290.1200.1941.3140.434
(lo)/(ap) *100 (%)1479.081.6143.8263.3626.9279.7
(ap)—soil applied, (lo)—soil lost.
Publisher’s Note: MDPI stays neutral with regard to jurisdictional claims in published maps and institutional affiliations.

