Abstract
Machine learning techniques (ML) have gained attention in precision agriculture practices since they efficiently address multiple applications, like estimating the growth and yield of trees in forest plantations. The combination between ML algorithms and spectral vegetation indices (VIs) from high-spatial-resolution line measurement, segment: 0.079024 m multispectral imagery, could optimize the prediction of these biometric variables. In this paper, we investigate the performance of ML techniques and VIs acquired with an unnamed aerial vehicle (UAV) to predict the diameter at breast height (DBH) and total height (Ht) of eucalyptus trees. An experimental site with six eucalyptus species was selected, and the Parrot Sequoia sensor was used. Several ML techniques were evaluated, like random forest (RF), REPTree (DT), alternating model tree (AT,) k-nearest neighbor (KNN), support vector machine (SVM), artificial neural network (ANN), linear regression (LR), and radial basis function (RBF). Each algorithm performance was verified using the correlation coefficient (r) and the mean absolute error (MAE). We used, as input, 34 VIs as numeric variables to predict DHB and Ht. We also added to the model a categorical variable as input identifying the different eucalyptus trees species. The RF technique obtained an overall superior estimation for all the tested configurations. Still, the RBF also showed a higher performance for predicting DHB, numerically surpassing the RF both in r and MAE, in some cases. For Ht variable, the technique that obtained the smallest MAE was SVM, though in a particular test. In this regard, we conclude that a combination of ML and VIs extracted from UAV-based imagery is suitable to estimate DBH and Ht in eucalyptus species. The approach presented constitutes an interesting contribution to the inventory and management of planted forests.
1. Introduction
Modeling the growth and yield of trees is an essential issue in forest management. Brazilian tree plantations are the most productive on a worldwide scale, and eucalyptus trees are the most common species used in reforestation activities [1]). In 2018, the mean annual production of eucalyptus in Brazil was 36 m ha year, and this number increased to 39 m ha year in 2019, which corresponds to more than 5.7 million hectares planted with this crop in Brazilian lands [1]. There are more than 700 species of Eucalyptus worldwide, and they are used for different applications, like paper, cellulose, and energy generation, vegetal-charcoal, and others [1]. For this, and as a result of their high expansion rate in many tropical countries [2], eucalyptus trees attracted attention as an important commercial role in the Brazilian economy, and is mainly produced in states like Minas Gerais (24%), São Paulo (17%), and Mato Grosso do Sul (16%). On average, the area planted with eucalyptus grew 1.1% per year in the last seven years. Mato Grosso do Sul led this expansion with an average growth of 7.4% per year [1].
In the past, the traditional strategy to estimate growth and yield in trees was based on the adoption of regression models [2,3,4,5,6,7,8,9,10], which can predict the DBH, Ht, competition index of trees, among other parameters and important metrics to describe the aforementioned variables. Nonetheless, over the last years, more efficient methods related to ML techniques [11,12,13,14] has gained prominence to perform this related task. Classification and regression problems are the core research direction in ML. Lately, research on regression problems, where many of the agricultural and environmental related problems are included, has received high attention, becoming a research hotspot in the ML field [15].
Many studies [2,14,16,17,18,19] show meaningful improvements in the accuracy of estimates when ML models are implemented compared to traditional methods. It is also worth mentioning that there are several studies [2,12,14,20,21,22,23] that have adopted ML algorithms to model yield or determine the DBH and Ht of eucalyptus trees in Brazil. However, a characteristic noted among these studies is the data source used to estimate these variables. Datasets are originated from measurements made directly and annually on the field, resulting in a continuous forest inventory for eucalyptus’ yield estimation. Still, this is a time-consuming, costly, and highly demanding task, which could be supported by new approaches, like the use of remote sensing data.
A study proposed by Maire et al. [2] made the use of time-series of the Normalized Difference Vegetation Index (NDVI) from MODIS satellite data to monitor the biomass of 15,000 ha of eucalyptus plantations in southern Brazil. The authors estimated the stand-age through a time-series analysis, and the volumes and dominant heights of individual forest plots applying linear (Stepwise) and nonlinear RF regression models. The authors concluded that the accuracy of biomass prediction using the RF algorithm was improved by implementing the NDVI data during the first two years after planting. Another research [13] integrated a group of variables like stand-age, remote sensing data (multispectral optical imagery—Landsat 8, Operational Land Imager sensor, and radar imagery—Sentinel-1B satellite), and terrain attribute extracted from a digital elevation model, to map the volume of eucalyptus plantations with the RF algorithm. Among the data combinations evaluated, the model that integrated remote sensing data with standage variables was able to improve volume estimation significantly.
More recently, a popular remote sensing platform for agricultural applications, with emphasis on crop monitoring, is the Unmanned Aerial Vehicle (UAV) [24,25,26]. The wide market availability, low operating cost, and optimization for image acquisition and process are some characteristics of these remote sensing platforms [24,27,28]. Regardless, concerning eucalyptus tree mapping, no study has investigated the performance of ML algorithms for predicting the DBH and Ht using spectral vegetation indices extracted from UAV-imagery, representing a gap in the literature related to precision farming applications. In this regard, here we present the performances of several ML algorithms to predict DBH and Ht for different Eucalyptus species based on spectral indices computed from high-spatial-resolution multispectral imagery acquired by UAV-embed remote sensor. Six species of eucalyptus trees: (1.) Eucalyptus camaldulensis dehnh, (2.) Eucalyptus uroplylla S. T. Blake, (3.) Eucalyptus saligna Sm, (4.) Eucalyptus grandis W.Hill ex Maiden, (5.) Eucalyptus urograndis clone GG100, and (6.) Corymbria citriodora (Hook.) K. D. Hill & L. A. S. Johnson. Were considered to carry out the experiments using the VIs available with UAV, an innovation for the prediction of DBH and Ht.
2. Materials and Methods
2.1. Study Area
The study area has an altitude of approximately 820 m and is located at Chapadão do Sul, Mato Grosso do Sul, Brazil, in the experimental site of the Federal University of Mato Grosso do Sul (Figure 1). The soil is classified as medium-textured Red Oxisol. According to the Köppen classification, the climate is tropical humid (Aw) with a rainy season from October to April and a dry season between May and September. The experiment plantation was initialized in January 2014 in randomized blocks with four replicates, with 20 plants inside each plot. The treatments were composed of six species of eucalyptus, including E. camaldulensis, E. uroplylla, E. saligna, E. grandis, E. urograndis, and Corymbria citriodora. E. grandis is a species that has excellent qualities for silviculture, surpassing any other in increment when the environmental conditions are adequate, this being the cause of its great use [29].
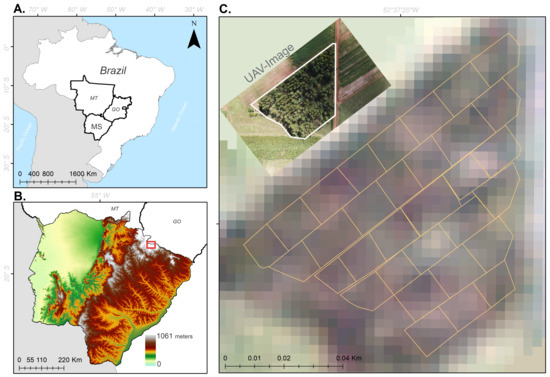
Figure 1.
Location of the study area in Brazil (A), in the state of Mato Grosso do Sul (B) and delimitation of xperimental plots in Chapadão do Sul (C).
There are some restrictions on its ability to regrow after periodic cuts, which makes it inferior to E. saligna in this regard [30]. Corymbria citriodora wood is considered excellent for sawmill, charcoal production, posts, and railroad ties [31]. E. saligna is a species very close to E. grandis in botanical, ecological, and silvicultural aspects. Under Brazilian conditions, the growth of E. saligna is generally lower than that of E. grandis [32]. The interest in E. urophylla has arisen in Brazil in recent years, after its high resistance to eucalyptus canker caused by Cryphonectria cubensis has been proven and, also, due to the properties of its wood, which is highly indicated for the production of cellulose [33]. E. camaldulensis is a preferred species for planting in tropical regions subject to periods of drought, due to its greater tolerance to water deficiency in the soil [34].
2.2. Data Acquisition and Pre-Processing
The DBH and Ht at stand level were obtained by measuring five trees in each experimental unit (24 sample plots located randomly). To obtain the DBH (cm), a tape was used to measure the circumference at breast height, which was later converted to DBH. The Ht (m) was obtained with the aid of a Haglof hypsometer. Seven measurements were performed, which occurred on 1 November 2018, 6 December 2018, 22 January 2019, 29 March 2019, 10 May 2019, 30 October 2019 and 28 November 2019. These measurements were obtained in both seasons (dry and wet) aiming at generating a great variability in the data and, from that, building robust models that can be used at any time of the year. Therefore, 168 samples were used for each model obtained by combining 24 plots multiplied x seven acquisition dates.
The flights were carried out with the Sensefly eBee RTK fixed-wing UAV equipped with the Parrot model Sequoia multispectral sensor (G: 550 nm; R: 660 nm; RE: 735 nm; and NIR: 790 nm). Further details on flight procedures and the acquisition of wavelengths for calculating VIs can be found in [32]. Here we highlight mainly the main aspects of this processing. They were made with 80% lateral overlap and 85% longitudinal images, as well as the same area, which were photographed twice using perpendicular flight lines. The increase in the overlap between the images was necessary to obtain a high number of scenes containing the same control points, allowing greater precision in the orthomosaic generation in the Pix4Dmapper software. This occurs according to the plant height, which is subject to oscillations of the stem due to the wind, because, regardless of its speed, it interferes in the mosaic process. The overflights were carried out close to the zenith due to the minimization of the shadows of the trees at 11 am since the multispectral sensor is passive type, that is, dependent on the solar luminosity.
Radiometric calibration was performed for the entire scene, based on calibrated reflective surfaces. For correcting the parameters of solar irradiation, the Pix4Dmapper [35] software was used and the reflective target of the camera with reflectance calibration plate is individualized for each device. It contains information on the reflectance rates for each wavelength measured by the multispectral sensor, for the entire scene. This procedure is performed in the field immediately before the flight is performed with the e-Motion software. The reflectance of multispectral images was obtained at green (550 nm), red (660 nm), red border (735 nm), and near-infrared (790 nm) wavelengths.The trees were illustrated from the RGB image of the same scene, with that it is possible to define what a leaf and visualize the soil. From the orthomosaic images, the extractions of the VIs were performed by the ArcGis 10.5 program, taking as a reference a layer (polygonal layer) created manually from the image, manually surrounding each crown of the trees. Table S1 contains the vegetation indices (VIs) used for the prediction of DBH and Ht. The combination of ML algorithms with the high spatial-resolution of the VIs ( m), may contribute to optimize the prediction of these biometric variables.
2.3. Statistical Analyses and Machine Learning Approach
To verify the linear relationship between the DBH and Ht variables with the VIs, a correlation network was built. This procedure is a technique used to graphically visualize a Pearson correlation matrix between variables. Variables that are positively correlated are linked by green lines, while variables that are negatively correlated are linked by a red line. The thickness of the line is proportional to the magnitude of the correlation, i.e., when closer to 1 (or −1) thicker is the line. This analysis was performed with the graph package of the R software (Version 3.6.3, The R Foundation for Statistical Computiong, Vienna, Austria) Eight ML algorithms were applied using the correlation coefficient (r) and mean absolute error (MAE) metric into a randomized stratified 10-fold cross-validation with 10 repetitions, giving a total of 100 runs for each model. Aside from using all the VIs (Table S1) as input variables to predict the DBH and Ht, another scenario has been tested where a new categorical variable indicating the species of eucalyptus was included. All 8 ML techniques were tested with (Yes) and without (No) species.
The ML techniques used in this study are displayed in Table 1. Among them is the RF, which is an ensemble-based algorithm capable of producing several classification trees for the same dataset and using a voting scheme among all these learned trees to classify new instances [36,37]. Two other tree-based algorithms were used: The Reduced Error Pruning Decision Tree (DT) and the Alternating Decision Tree (AT). DT is an adaptation of the C4.5 classifier that can be used in regression problems with an additional pruning step based on an error reduction strategy [38,39]. AT is another ensemble-based algorithm that applies a boosting strategy to reduce data overfitting [40]. The K-Nearest Neighbours (KNN) algorithm has also been used, with k = 5, as previous experiments in similar datasets suggest that higher and lower values of k do not improve the overall performance. KNN is a non-parametric lazy learning approach that interpolates the closest training instances to the input to get its regression value [41,42].

Table 1.
UAV-based datasets that are publically available from previous research.
The four last ML techniques adopted are the Support Vector Machines (SVM), the Artificial Neural Networks (ANN), the Linear Regression (LR), and the Radial Basis Function Network (RBF). SVM has been tested with minimal sequential optimization (SMO) strategy and a polynomial kernel [43,44,45]. ANN has been tested using the default Weka’s architecture that consists of a unique hidden layer formed by many neurons that is equal to the number of attributes, plus the number of classes, all divided by 2 [46]. LR has been tested with the Akaike information criteria for attribute selection [47] during linear regression and, lastly, we tested an RBF that induces a Gaussian basis function network by minimizing the quadratic error with the Broyden-Fletcher-Goldfarb-Shanno algorithm (BFGS) [48].
The experiments were run on an Intel® Core™ i7 CPU with 8 Gb RAM and all hyperparameters were set according to the Weka (Version 3.9.4, The University of Waikato, Hamilton, New Zealand) default library. Boxplots for all configurations evaluated are presented together with the Scott–Knott [49] test results at a 5% significance level for r and MAE of DBH and Ht.
3. Results
The linear correlation between the variables was expressed graphically in Figure 2. It is possible to verify that Ht and DBH are positively correlated with each other (r = 0.8361). However, these variables have a low correlation with the evaluated VIs (note that the lines connecting the VIs to Ht and DBH are thin). In general, the VIs have a high correlation with each other and can be viewed in two groups.
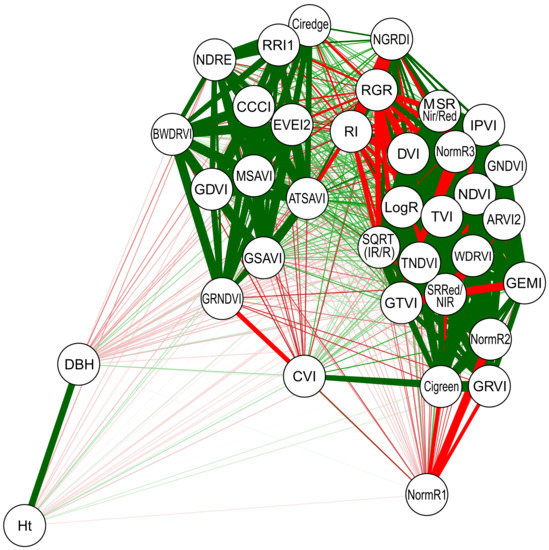
Figure 2.
Pearson’s correlation network between variables diameter at breast height (DBH), total height (Ht), and vegetation indices evaluated in six eucalyptus species. Red lines link negatively correlated variables, while green lines link positively correlated variables. The line thickness is proportional to the magnitude of the correlation.
Figure 3 shows the boxplots for the DBH predictions while Figure 4 shows the boxplots for the Ht predictions both for r and MAE, with (Yes) and without (No) the categorical species variable included in the test datasets, considering 100 runs. A clear pattern is readily indicating that all ML techniques were able to improve their performances, for r and MAE metrics and for DBH and Ht predictions when the species variable was included (Yes) in the models. These improvements varied among techniques, with KNN and LR having a much higher improvement for r in DBH prediction than RF and DT, for instance.
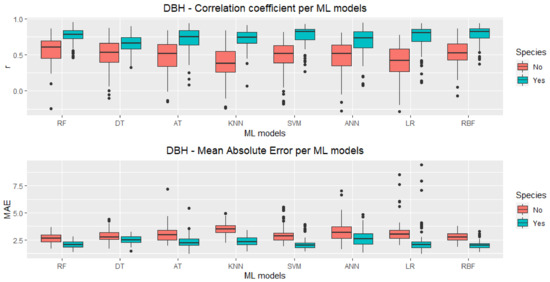
Figure 3.
Boxplots for Pearson’s correlation coefficient (r) and DBH-mean absolute error (MAE) using all VIs, for these machine learning models: Random Forest (RF), REP Tree (DT), Alternating Model Tree (AT), K-Nearest Neighbours (KNN), Support Vector Machine (SVM), Artificial Neural Networks (ANN), Linear Regression (LR) and Radial Basis Functions (RBF).
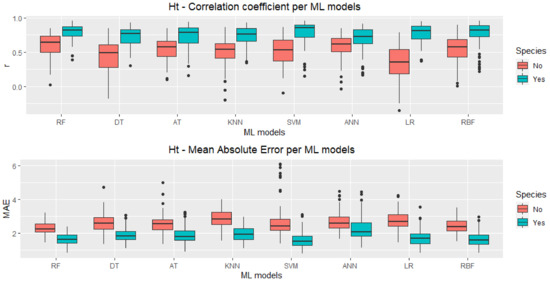
Figure 4.
Boxplots for Pearson’s correlation coefficient (r) and Ht-mean absolute error (MAE) using all VIs, for these machine learning models: Random Forest (RF), REP Tree (DT), Alternating Model Tree (AT), K-Nearest Neighbours (KNN), Support Vector Machine (SVM), Artificial Neural Networks (ANN), Linear Regression (LR) and Radial Basis Functions (RBF).
The number of outliers and the interquartile range (IQR) are also different for distinct techniques, but in the MAE of the Ht predictions, RF and KNN are the only ones with no outliers. However, RF presents a IQR lower than KNN. In general, RF seems to have a more stable performance with fewer outliers and IQR lower than other techniques overall configurations. For RF and some other techniques, besides improving the overall performance (higher median for r and lower median for MAE), the introduction of the species information has also lowered the IQR and reduced the number of outliers. The box plot medians for RF, SVM, and RBF seem to be consistently higher (for r) and lower (for MAE) than for the other techniques.
ML models are differentiated by the type of inductive bias that is a set of hypotheses, in each algorithm, linked to the criteria that a model uses to restrict the concept space or select concepts from that space, generalizing a set of data from training [30,50,51]. An inductive polarization of each method follows: The RF works with data subsets where it will select characteristics to be assembled, generating several decision trees at random, based on the sets [36]; the DT, a model that has agile learning, based on the C4.5 algorithm, produces classifications with a discrete result or regression with the continuous result, regression of built trees, decision and with a variation of information, pruning with reduced error, subsequent adjustment [38,39]; the AT, a method to be applied in a regression of built trees, decision tree with a variation of information, pruning with reduced error, and subsequent adjustment, that shows the linearity with the leaf nodes [48]; the KNN uses the concept of classification and Euclidean distance [42]; the SVM has a separation through classes through wide margins [44]; an ANN is classified in connected systems, through distributed parallel processing represented by numerical values [46,50]; the LR, to minimize the sum of the quadratic errors, is related to the attributes to generate a linear output [47]; and RBF, based on fully supervised training using several parameters, one to penalize the size of the weights in the output layer, and it also uses a global sigma to streamline the combined results [48].
Table 2 and Table 3 show the results of the Scott–Knott [49] statistical test for DBH and Ht predictions, respectively. RF is the only ML technique in the best performance group for all configurations, but RBF has also presented high performance for DBH predictions, numerically outperforming RF both in r (0.776 against 0.765) and MAE (2.019 against 2.068 cm). For Ht prediction, the lowest MAE was achieved by SVM (MAE = 1.596 m). Still, again, all mean values improved significantly when the species information was used. The mean values in both tables that are followed by different letters in the same column differ by the Scott–Knott test at 5% probability.
Table 2.
Grouping of means by the Scott–Knott test for Pearson’s correlation coefficient (r) and mean absolute error (MAE) obtained with machine learning models using Diameter at breast height (DBH, cm) results without “No” and with “Yes” the species. The best values are highlighted in bold.
Table 3.
Grouping of means by the Scott–Knott test for Pearson’s correlation coefficient (r) and mean absolute error (MAE) obtained with machine learning models using Total height (Ht, cm) results without “No” and with “Yes” the species. The best values are highlighted in bold.
The highest correlation coefficient was achieved for Ht prediction using RF (r = 0.793), slightly higher than the correlation coefficient for DBH using RBF (r = 0.776). However, when considering a 5% significance level, RF, SVM, and RBF mean performances were not statistically different for DBH prediction using species information. In the Ht prediction, also using the species categorical variable, we have LR in the same group as RF, SVM, and RBF with the best, non statistically different, performances.
4. Discussion
This research investigated the possibility of VIs obtained with a UAV-multispectral sensor to be used to predict DBH and Ht in six species of eucalyptus. The results shown in Figure 2 indicate that all VIs have a low linear relationship with DBH and Ht. Therefore, it is necessary to look for algorithms based on nonlinear behavior, such as machine learning, to predict DBH and Ht. In this study, we demonstrated the capability of different ML algorithms to predict biometric variables, like DBH and Ht of eucalyptus trees, based on spectral indices only computed from high-spatial-resolution multispectral imagery acquired by a UAV. A robust analysis was conducted using correlation coefficient (r) and mean absolute error (MAE) metrics and a randomized stratified 10-fold cross-validation with 10 repetitions. The main spectral VIs were considered as input to the methods. We also considered the eucalyptus species (E. camaldulensis, E. uroplylla, E. saligna, E. grandis, E. urograndis, and Corymbria citriodora) as categorical variables, which significantly improved the achieved results, as can be verified in Figure 2 and Figure 3.
Based on the statistical results, RF, SVM, and RBF algorithm performances are not statistically different for DBH prediction using species information. Regarding Ht prediction, LR, RF, SVM, and RBF provided similar performances. While the comparison between the eight ML methods showed that the RF did not significantly outperform the other methods, it should be highlighted that our results demonstrate that the RF presented a stable performance, in terms of fewer outliers and smaller interquartile range for both predicted variables DBH and Ht. Previous works [28,52] also showed that RF outperformed other ML methods to estimate variables related to agriculture applications.
According to the literature review, we noted that there are few studies related to the estimation of the DBH and Ht variables. Herein, we apply ML algorithms in spectral VIs which were extracted from images captured by UAV. we found studies that use a similar approach for predicting other variables, such as leaf nutrient content in citrus orchards [28] and yield in corn cultivars [52]. While [23] obtained accurate results, with greater than 0.95 when they applied models of ANN (artificial neural network) and ANFIS (adaptive neuro-diffuse inference system) to estimate DBH and Ht, these models depend on the inclusion of elements inputs that require measurements in loco, which represents a laborious task. Our proposal speeds up the prediction process, eliminating field measurement. Even so, the previous studies analyzed show that the genetic material did not impact the results achieved, which are also different from our findings.
Cut et al. [53] used density point cloud data, provided by UAV LiDAR to estimate DBH and Ht. These authors considered only one species of eucalyptus tree, obtaining a correlation coefficient of 0.77, and 0.91 for the DBH and Ht variables, respectively. Compared to the LiDAR-based approach, our method provided accurate results with a low-cost solution. It is important to highlight that six Eucalyptus species were considered in our study. Multispectral imagery, acquired from UAV-embed remote sensors, are commonly more used in precision farming applications mainly due to the cost-effective resource and production agility [24,26]. When conducting forest inventories, usually, the dendrometric variables measured directly on delimited plots are DBH and Ht. Subsequently, these variables are used to generate indirect estimates of the variables that express production (i.e., volume and biomass), which are extrapolated to the plantation area. However, this process has high costs since it demands a displacement to the planting area, an allocation of plots representative of the entire population, and the measurement itself, which requires time and skilled labor. The main cost to replace the human effort to automate this process is the acquisition of the UAV and the multispectral camera, in addition to costs with training for image processing. The main limitation of UAV-multispectral imagery is the occurrence of winds at the time of flight, which can reduce the accuracy of the process. While the use of multispectral imagery acquired from UAV is still incipient in the forestry sector when compared to agriculture, studies using this approach have been increasingly common in recent years. Given this scenario, our approach may help ease the forest inventory and rapidly provide relevant information to assist technicians in the estimation of such variables.
Our study explores ML algorithms to process spectral VIs extracted from UAV-based multispectral imagery aiming to estimate DBH and Ht of multiple species of eucalyptus. Deep learning-based methods can be assessed in future works; however, there is a need to increase the data set since these models often require higher amounts of samples. Indeed, many relevant and recent works [28,52,54,55] still show the potential of traditional ML methods in agricultural parameters estimation. In this regard, our approach is suitable to predict the DBH and Ht variables with satisfactory performance.
5. Conclusions
Our study explores ML algorithms to process spectral VIs extracted from UAV-based multispectral imagery aiming to estimate the DBH and the Ht of multiple species of eucalyptus. We verified a similar performance for the prediction of DBH among the RF, SVM, and RBF algorithms, while LR, RF, SVM, and RBF methods provide approximative performance on Ht prediction. An important finding is that improvements occurred when the eucalyptus species were considered as categorical variables in the ML models. To conclude, the developed investigation constitutes a promising approach to contribute to forest inventory management. For future works, we intend to evaluate the exploitation of deep learning regression-based methods as more data should become available.
Supplementary Materials
The following are available at https://www.mdpi.com/article/10.3390/f12050582/s1, Table S1: Equations used to calculate the vegetation indices implemented in the experiments.
Author Contributions
Conceptualization, H.P., J.M.J., P.E.T., F.H.R.B., and C.A.d.S.J.; methodology, H.P., P.E.T., F.H.R.B., A.K.V.d.S. and L.P.R.T.; software, H.P., A.K.V.d.S. and W.N.G.; validation, L.P.O., A.P.M.R., H.P., P.E.T. and J.M.J.; formal analysis, H.P., A.K.V.d.S. and W.N.G.; investigation, D.E.G.F., M.V.V.B. and T.S.B.; resources, F.H.R.B., J.M.J., P.E.T., W.N.G. and H.P.; writing—original draft preparation, A.K.V.d.S., A.P.M.R., J.M.J, H.P., L.P.R.T., F.H.R.B. and P.E.T.; writing—review and editing, L.P.O., J.M.J., P.E.T., A.P.M.R. and H.P.; visualization, D.E.G.F., L.P.R.T., M.V.V.B., T.S.B. and C.A.d.S.J.; supervision, H.P., J.M.J. and P.E.T.; project administration, P.E.T., F.H.R.B. and H.P.; funding acquisition, J.M.J., P.E.T., W.N.G. and H.P. All authors have read and agreed to the published version of the manuscript.
Funding
This research was funded by CNPq, grant number 303559/2019-5, 433783/2018-4, 314902/2018-0, and 304173/2016-9; CAPES-PrInt, grant number 88881.311850/2018-01, and FUNDECT, grant number 59/300.066/2015, and 59/300.095/2015.
Acknowledgments
The authors acknowledge the support of UFMS (Federal University of Mato Grosso do Sul), UCDB (Dom Bosco Catholic University), CNPq (National Council for Scientific and Technological), CAPES (Coordination for the Improvement of Higher Education Personnel—Finance code 001) and FUNDECT (Foundation to Support the Development of Education, Science and Technology of the State of Mato Grosso do Sul).
Conflicts of Interest
The authors declare no conflict of interest. The funders had no role in the design of the study; in the collection, analyses, or interpretation of data; in the writing of the manuscript, or in the decision to publish the results.
References
- Indústria Brasileira de Árvores (IBÁ). Relatório 2019; Report 2019; Indústria Brasileira de Árvores (IBÁ): São Paulo, Brazil, 2019; pp. 1–80. [Google Scholar]
- Le Maire, G.; Marsden, C.; Nouvellon, Y.; Grinand, C.; Hakamada, R.; Stape, J.L.; Laclau, J.P. MODIS NDVI time-series allow the monitoring of Eucalyptus plantation biomass. Remote Sens. Environ. 2011, 115, 2613–2625. [Google Scholar] [CrossRef]
- Pienaar, L.V.; Shiver, B.D. Survival Functions for Site-Prepared Slash Pine Plantations in the Flatwoods of Georgia and Northern Florida. South. J. Appl. For. 1981, 5, 59–62. [Google Scholar] [CrossRef]
- Tennent, R.B. Individual-tree growth model for Pinus radiata. N. Z. J. For. Sci. 1982, 12, 62–70. [Google Scholar]
- Lynch, T.B.; Murphy, P.A. A Compatible Height Prediction and Projection System for Individual Trees in Natural, Even-Aged Shortleaf Pine Stands. For. Sci. 1995, 41, 194–209. [Google Scholar] [CrossRef]
- Soares, P.; Tomé, M. Height–diameter equation for first rotation eucalypt plantations in Portugal. For. Ecol. Manag. 2002, 166, 99–109. [Google Scholar] [CrossRef]
- Mabvurira, D.; Miina, J. Individual-tree growth and mortality models for Eucalyptus grandis (Hill) Maiden plantations in Zimbabwe. For. Ecol. Manag. 2002, 161, 231–245. [Google Scholar] [CrossRef]
- Adame, P.; Hynynen, J.; Cañellas, I.; del Río, M. Individual-tree diameter growth model for rebollo oak (Quercus pyrenaica Willd.) coppices. For. Ecol. Manag. 2008, 255, 1011–1022. [Google Scholar] [CrossRef]
- Vospernik, S.; Monserud, R.A.; Sterba, H. Do individual-tree growth models correctly represent height: Diameter ratios of Norway spruce and Scots pine? For. Ecol. Manag. 2010, 260, 1735–1753. [Google Scholar] [CrossRef]
- Martins, F.B.; Soares, C.P.B.; da Silva, G.F. Individual tree growth models for eucalyptus in northern Brazil. Sci. Agric. 2014, 71, 212–225. [Google Scholar] [CrossRef]
- Soares, F.A.A.; Flôres, E.L.; Cabacinha, C.D.; Carrijo, G.A.; Veiga, A.C.P. Recursive diameter prediction and volume calculation of eucalyptus trees using Multilayer Perceptron Networks. Comput. Electron. Agric. 2011, 78, 19–27. [Google Scholar] [CrossRef]
- Vinícius Oliveira Castro, R.; Boechat Soares, C.P.; Leite, H.G.; Lopes de Souza, A.; Saraiva Nogueira, G.; Bolzan Martins, F. Individual Growth Model for Eucalyptus Stands in Brazil Using Artificial Neural Network. ISRN For. 2013, 2013, 1–12. [Google Scholar] [CrossRef]
- Dos Reis, A.A.; Franklin, S.E.; de Mello, J.M.; Acerbi Junior, F.W. Volume estimation in a Eucalyptus plantation using multi-source remote sensing and digital terrain data: A case study in Minas Gerais State, Brazil. Int. J. Remote Sens. 2019, 40, 2683–2702. [Google Scholar] [CrossRef]
- De Freitas, E.C.S.; de Paiva, H.N.; Neves, J.C.L.; Marcatti, G.E.; Leite, H.G. Modeling of eucalyptus productivity with artificial neural networks. Ind. Crop. Prod. 2020, 146, 112149. [Google Scholar] [CrossRef]
- Huang, J.C.; Ko, K.M.; Shu, M.H.; Hsu, B.M. Application and comparison of several machine learning algorithms and their integration models in regression problems. Neural Comput. Appl. 2020, 32, 5461–5469. [Google Scholar] [CrossRef]
- Özçelik, R.; Diamantopoulou, M.J.; Brooks, J.R.; Wiant, H.V. Estimating tree bole volume using artificial neural network models for four species in Turkey. J. Environ. Manag. 2010, 91, 742–753. [Google Scholar] [CrossRef]
- Diamantopoulou, M.J.; Özçelik, R. Evaluation of different modeling approaches for total tree-height estimation in Mediterranean Region of Turkey. For. Syst. 2012, 21, 383. [Google Scholar] [CrossRef]
- Ribeiro, R.B.d.S.; Gama, J.R.V.; de Souza, A.L.; Leite, H.G.; Soares, C.P.B.; da Silva, G.F. Métodos para estimar o volume de fustes e galhos na floresta nacional do TapajÓS1. Rev. Árvore 2016, 40, 81–88. [Google Scholar] [CrossRef]
- Vahedi, A.A. Monitoring soil carbon pool in the Hyrcanian coastal plain forest of Iran: Artificial neural network application in comparison with developing traditional models. CATENA 2017, 152, 182–189. [Google Scholar] [CrossRef]
- Da Silva, M.L.M.; Binoti, D.H.B.; Gleriani, J.M.; Leite, H.G. Ajuste do modelo de Schumacher e Hall e aplicação de redes neurais artificiais para estimar volume de árvores de eucalipto. Rev. Árvore 2009, 33, 1133–1139. [Google Scholar] [CrossRef]
- Leite, H.G.; da Silva, M.L.M.; Binoti, D.H.B.; Fardin, L.; Takizawa, F.H. Estimation of inside-bark diameter and heartwood diameter for Tectona grandis Linn. trees using artificial neural networks. Eur. J. For. Res. 2011, 130, 263–269. [Google Scholar] [CrossRef]
- Bhering, L.L.; Cruz, C.D.; Peixoto, L.d.A.; Rosado, A.M.; Laviola, B.G.; Nascimento, M. Application of neural networks to predict volume in eucalyptus. Crop Breed. Appl. Biotechnol. 2015, 15, 125–131. [Google Scholar] [CrossRef]
- Vieira, G.C.; de Mendonça, A.R.; da Silva, G.F.; Zanetti, S.S.; da Silva, M.M.; dos Santos, A.R. Prognoses of diameter and height of trees of eucalyptus using artificial intelligence. Sci. Total Environ. 2018, 619–620, 1473–1481. [Google Scholar] [CrossRef] [PubMed]
- Candiago, S.; Remondino, F.; De Giglio, M.; Dubbini, M.; Gattelli, M. Evaluating Multispectral Images and Vegetation Indices for Precision Farming Applications from UAV Images. Remote Sens. 2015, 7, 4026–4047. [Google Scholar] [CrossRef]
- Marques, P.; Pádua, L.; Adão, T.; Hruška, J.; Peres, E.; Sousa, A.; Sousa, J.J. UAV-Based Automatic Detection and Monitoring of Chestnut Trees. Remote Sens. 2019, 11, 855. [Google Scholar] [CrossRef]
- Maddikunta, P.K.R.; Hakak, S.; Alazab, M.; Bhattacharya, S.; Gadekallu, T.R.; Khan, W.Z.; Pham, Q.V. Unmanned Aerial Vehicles in Smart Agriculture: Applications, Requirements, and Challenges. IEEE Sens. J. 2021. [Google Scholar] [CrossRef]
- Xu, Y.; Smith, S.E.; Grunwald, S.; Abd-Elrahman, A.; Wani, S.P.; Nair, V.D. Estimating soil total nitrogen in smallholder farm settings using remote sensing spectral indices and regression kriging. CATENA 2018, 163, 111–122. [Google Scholar] [CrossRef]
- Osco, L.P.; Ramos, A.P.M.; Faita Pinheiro, M.M.; Moriya, É.A.S.; Imai, N.N.; Estrabis, N.; Ianczyk, F.; de Araújo, F.F.; Liesenberg, V.; de Castro Jorge, L.A.; et al. A Machine Learning Framework to Predict Nutrient Content in Valencia-Orange Leaf Hyperspectral Measurements. Remote Sens. 2020, 12, 906. [Google Scholar] [CrossRef]
- Chaín, J.M.; Tubert, E.; Graciano, C.; Castagno, L.N.; Recchi, M.; Pieckenstain, F.L.; Estrella, M.J.; Gudesblat, G.; Amodeo, G.; Baroli, I. Growth promotion and protection from drought in Eucalyptus grandis seedlings inoculated with beneficial bacteria embedded in a superabsorbent polymer. Sci. Rep. 2020, 10, 18221. [Google Scholar] [CrossRef]
- Mphahlele, M.M.; Isik, F.; Mostert-O’Neill, M.M.; Reynolds, S.M.; Hodge, G.R.; Myburg, A.A. Expected benefits of genomic selection for growth and wood quality traits in Eucalyptus grandis. Tree Genet. Genomes 2020, 16, 49. [Google Scholar] [CrossRef]
- De Souza, B.M.; Freitas, M.L.M.; Sebbenn, A.M.; Gezan, S.A.; Zanatto, B.; Zulian, D.F.; Lopes, M.T.G.; Longui, E.L.; Guerrini, I.A.; de Aguiar, A.V. Genotype-by-environment interaction in Corymbia citriodora (Hook.) K.D. Hill, L.A.S. Johnson progeny test in Luiz Antonio, Brazil. For. Ecol. Manag. 2020, 460, 117855. [Google Scholar] [CrossRef]
- Da Silva, E.E.; Rojo Baio, F.H.; Ribeiro Teodoro, L.P.; da Silva Junior, C.A.; Borges, R.S.; Teodoro, P.E. UAV-multispectral and vegetation indices in soybean grain yield prediction based on in situ observation. Remote Sens. Appl. Soc. Environ. 2020, 18, 100318. [Google Scholar] [CrossRef]
- Binkley, D.; Campoe, O.C.; Alvares, C.; Carneiro, R.L.; Cegatta, Í.; Stape, J.L. The interactions of climate, spacing and genetics on clonal Eucalyptus plantations across Brazil and Uruguay. For. Ecol. Manag. 2017, 405, 271–283. [Google Scholar] [CrossRef]
- Asao, S.; Hayes, L.; Aspinwall, M.J.; Rymer, P.D.; Blackman, C.; Bryant, C.J.; Cullerne, D.; Egerton, J.J.G.; Fan, Y.; Innes, P.; et al. Leaf trait variation is similar among genotypes of Eucalyptus camaldulensis from differing climates and arises in plastic responses to the seasons rather than water availability. New Phytol. 2020, 227, 780–793. [Google Scholar] [CrossRef]
- Pix4d. Available online: https://www.pix4d.com/product/pix4dmapper-photogrammetry-software (accessed on 6 May 2021).
- Belgiu, M.; Drăguţ, L. Random forest in remote sensing: A review of applications and future directions. ISPRS J. Photogramm. Remote Sens. 2016, 114, 24–31. [Google Scholar] [CrossRef]
- Breiman, L. Random Forest. Mach. Learn. 2001, 5–32. [Google Scholar] [CrossRef]
- Bouckaert, R.; Frank, E.; Hall, M.; Kirkby, R.; Reutemann, P.; Seewald, A.S.D. WEKA Manual for Version 3-7-1; University of Waikato: Hamilton, New Zealand, 2010. [Google Scholar]
- Snousy, M.B.A.; El-Deeb, H.M.; Badran, K.; Khlil, I.A.A. Suite of decision tree-based classification algorithms on cancer gene expression data. Egypt. Inform. J. 2011, 12, 73–82. [Google Scholar] [CrossRef]
- Frank, E.; Mayo, M.; Kramer, S. Alternating model trees. In Proceedings of the 30th Annual ACM Symposium on Applied Computing, Salamanca, Spain, 13–17 April 2015; ACM: New York, NY, USA, 2015; pp. 871–878. [Google Scholar] [CrossRef]
- Aha, D.W.; Kibler, D.; Albert, M.K. Instance-based learning algorithms. Mach. Learn. 1991, 6, 37–66. [Google Scholar] [CrossRef]
- Ali, N.; Neagu, D.; Trundle, P. Evaluation of k-nearest neighbour classifier performance for heterogeneous data sets. SN Appl. Sci. 2019, 1, 1559. [Google Scholar] [CrossRef]
- Bernhard Schölkopf, A.J.S. Advances in Kernel Methods—Support Vector Learning; MIT Press: Cambridge, MA, USA, 1998. [Google Scholar]
- Nalepa, J.; Kawulok, M. Selecting training sets for support vector machines: A review. Artif. Intell. Rev. 2019, 52, 857–900. [Google Scholar] [CrossRef]
- Keerthi, S.S.; Shevade, S.K.; Bhattacharyya, C.; Murthy, K.R. Improvements to Platt’s SMO algorithm for SVM classifier design. Neural Comput. 2001, 13, 637–649. [Google Scholar] [CrossRef]
- Egmont-Petersen, M.; de Ridder, D.; Handels, H. Image processing with neural networks—A review. Pattern Recognit. 2002, 35, 2279–2301. [Google Scholar] [CrossRef]
- Štepanovský, M.; Ibrová, A.; Buk, Z.; Velemínská, J. Novel age estimation model based on development of permanent teeth compared with classical approach and other modern data mining methods. Forensic Sci. Int. 2017, 279, 72–82. [Google Scholar] [CrossRef] [PubMed]
- Frank, E. Fully Supervised Training of Gaussian Radial Basis Function Networks in WEKA; Technical Report; Department of Computer Science, University of Waikato: Hamilton, New Zealand, 2014. [Google Scholar]
- Scott, A.J.; Knott, M. A Cluster Analysis Method for Grouping Means in the Analysis of Variance. Biometrics 1974, 30, 507. [Google Scholar] [CrossRef]
- Luger, G.F. (Ed.) Artificial Intelligence, 6th ed.; Pearson Addison Wesley: Boston, MA, USA, 2008; pp. 320–350. [Google Scholar]
- García Nieto, P.; Martínez Torres, J.; Araújo Fernández, M.; Ordóñez Galán, C. Support vector machines and neural networks used to evaluate paper manufactured using Eucalyptus globulus. Appl. Math. Model. 2012, 36, 6137–6145. [Google Scholar] [CrossRef]
- Marques Ramos, A.P.; Prado Osco, L.; Elis Garcia Furuya, D.; Nunes Gonçalves, W.; Cordeiro Santana, D.; Pereira Ribeiro Teodoro, L.; Antonio da Silva Junior, C.; Fernando Capristo-Silva, G.; Li, J.; Henrique Rojo Baio, F.; et al. A random forest ranking approach to predict yield in maize with uav-based vegetation spectral indices. Comput. Electron. Agric. 2020, 178, 105791. [Google Scholar] [CrossRef]
- Dalla Corte, A.P.; Rex, F.E.; de Almeida, D.R.A.; Sanquetta, C.R.; Silva, C.A.; Moura, M.M.; Wilkinson, B.; Zambrano, A.M.A.; da Cunha Neto, E.M.; Veras, H.F.P.; et al. Measuring Individual Tree Diameter and Height Using GatorEye High-Density UAV-Lidar in an Integrated Crop-Livestock-Forest System. Remote Sens. 2020, 12, 863. [Google Scholar] [CrossRef]
- Li, B.; Xu, X.; Zhang, L.; Han, J.; Bian, C.; Li, G.; Liu, J.; Jin, L. Above-ground biomass estimation and yield prediction in potato by using UAV-based RGB and hyperspectral imaging. ISPRS J. Photogramm. Remote Sens. 2020, 162, 161–172. [Google Scholar] [CrossRef]
- Oliveira, R.A.; Näsi, R.; Niemeläinen, O.; Nyholm, L.; Alhonoja, K.; Kaivosoja, J.; Jauhiainen, L.; Viljanen, N.; Nezami, S.; Markelin, L.; et al. Machine learning estimators for the quantity and quality of grass swards used for silage production using drone-based imaging spectrometry and photogrammetry. Remote Sens. Environ. 2020, 246, 111830. [Google Scholar] [CrossRef]
Publisher’s Note: MDPI stays neutral with regard to jurisdictional claims in published maps and institutional affiliations. |
© 2021 by the authors. Licensee MDPI, Basel, Switzerland. This article is an open access article distributed under the terms and conditions of the Creative Commons Attribution (CC BY) license (https://creativecommons.org/licenses/by/4.0/).