
Spatial Heterogeneity of Plant Diversity within and between Neighborhoods and Its Implications for a Plant Diversity Survey in Urban Areas

 and
and
Abstract
1. Introduction
2. Materials and Methods
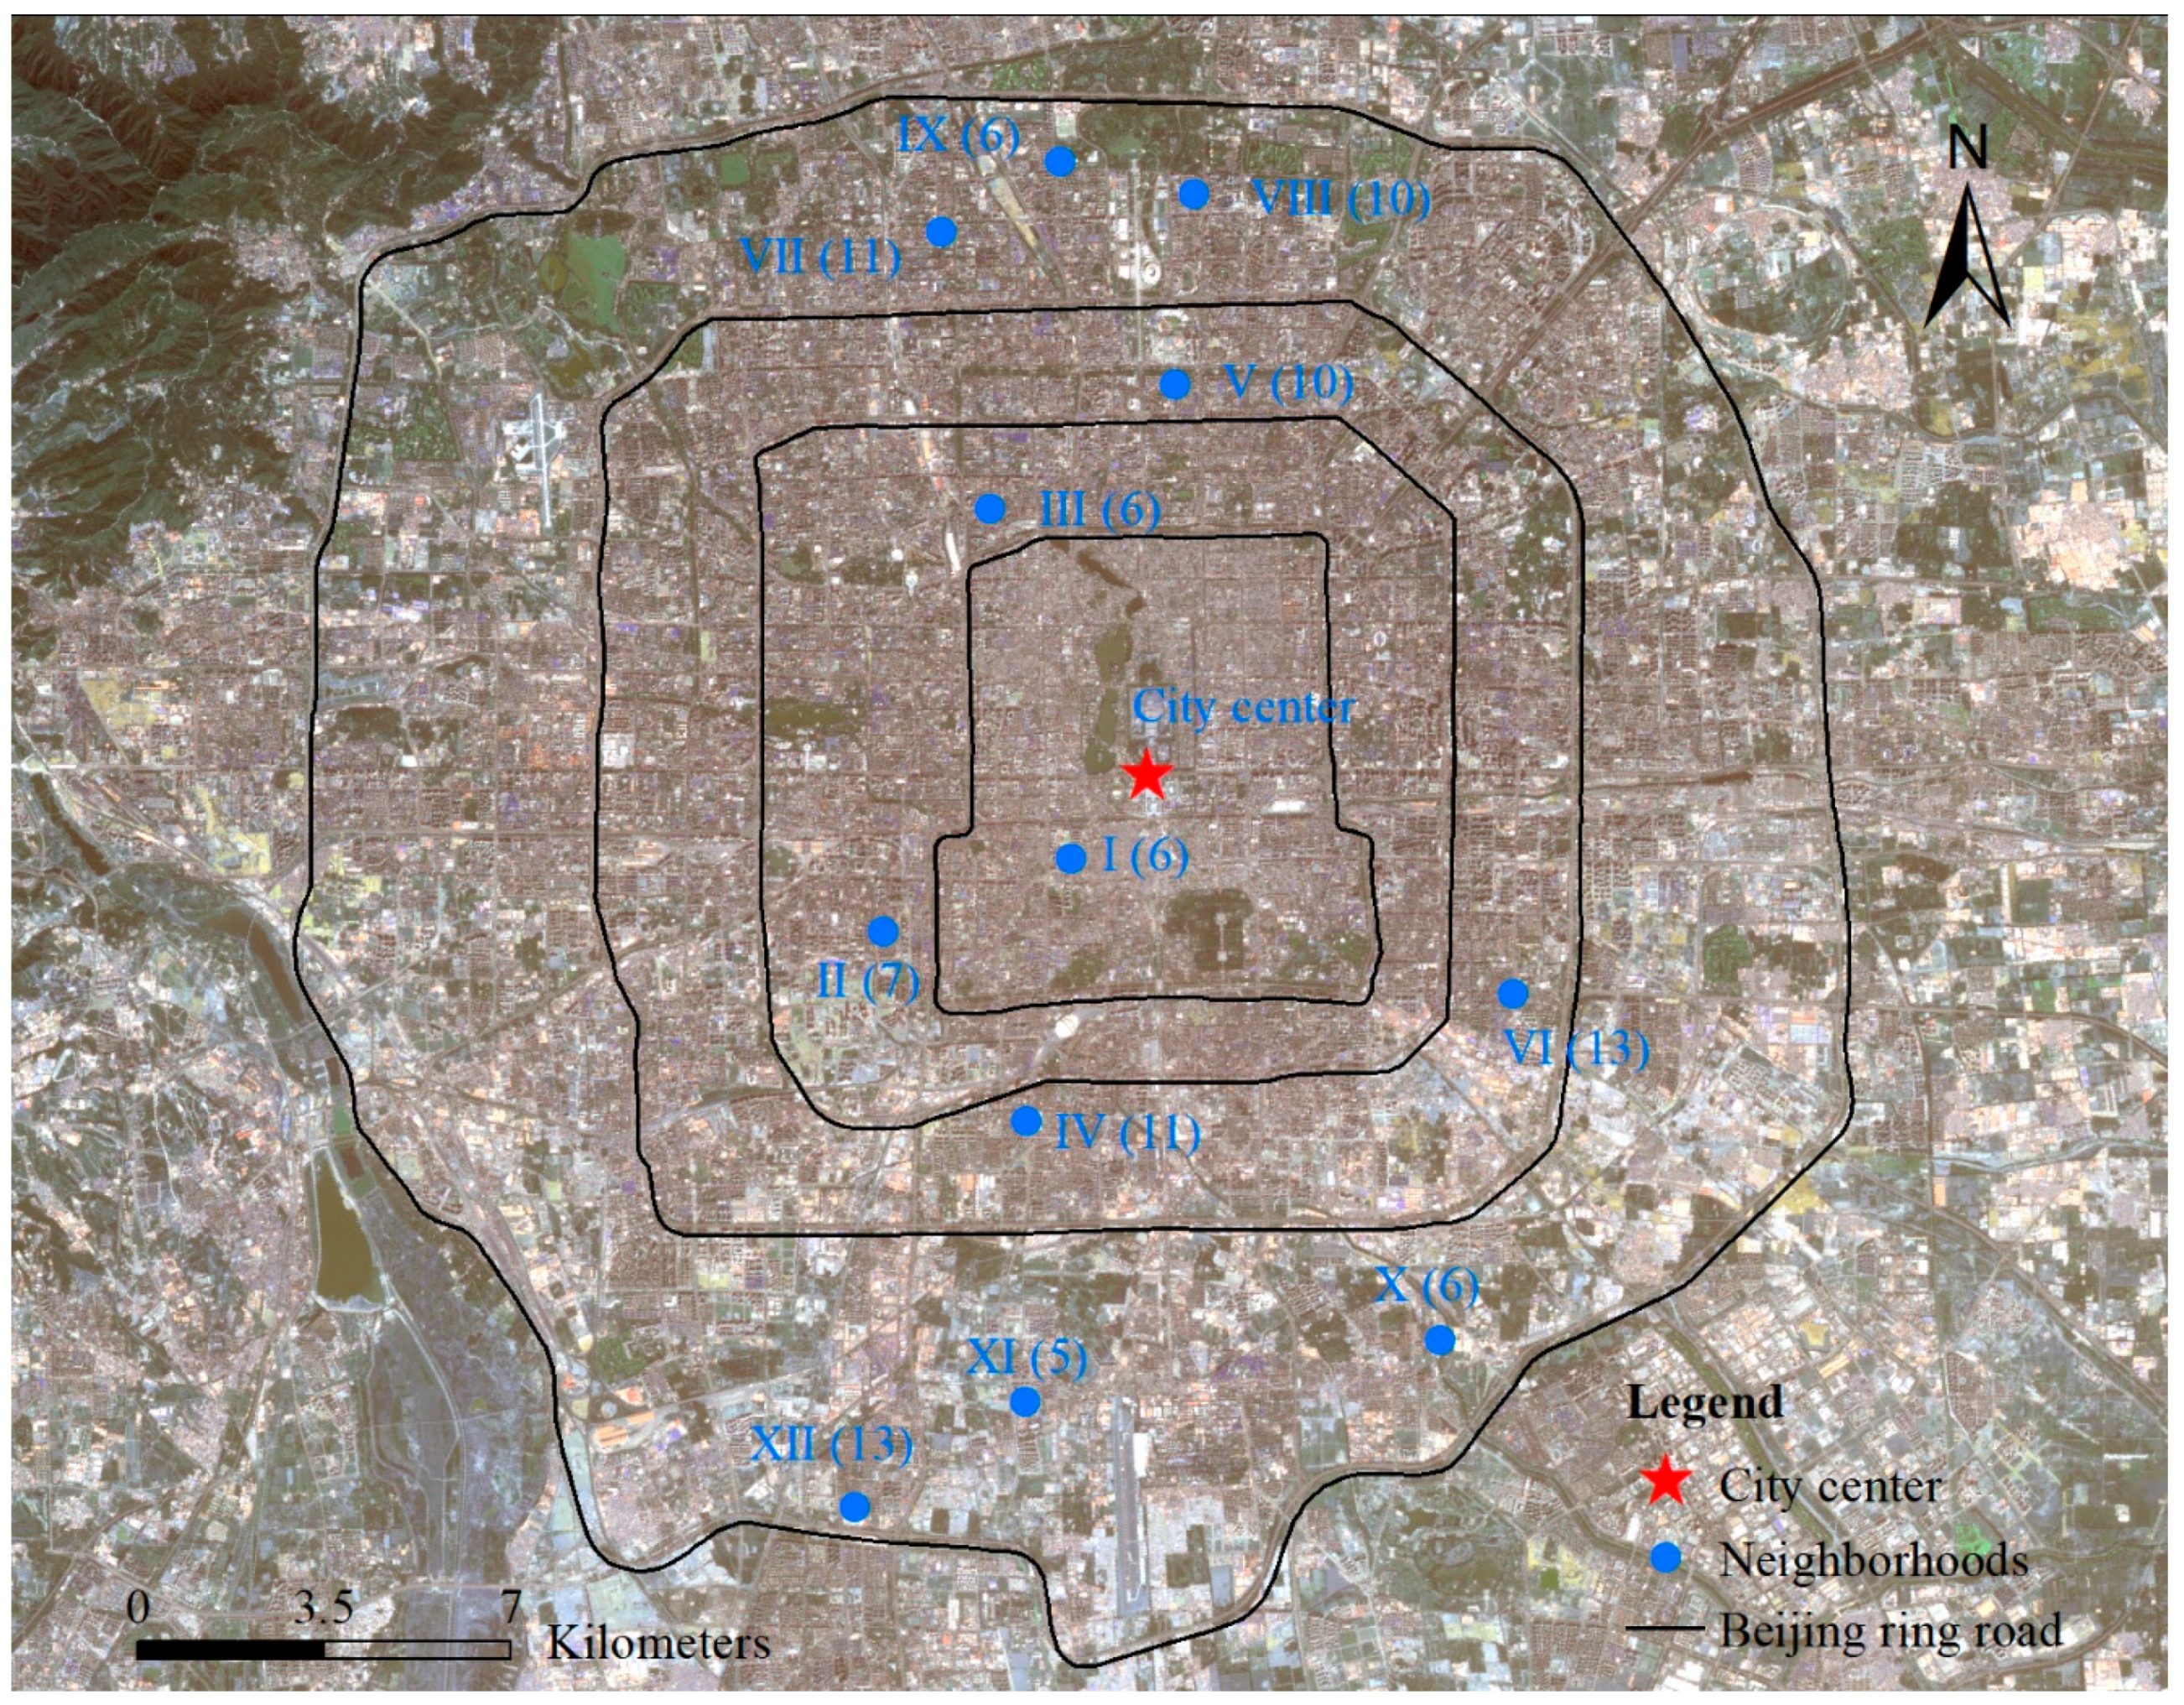
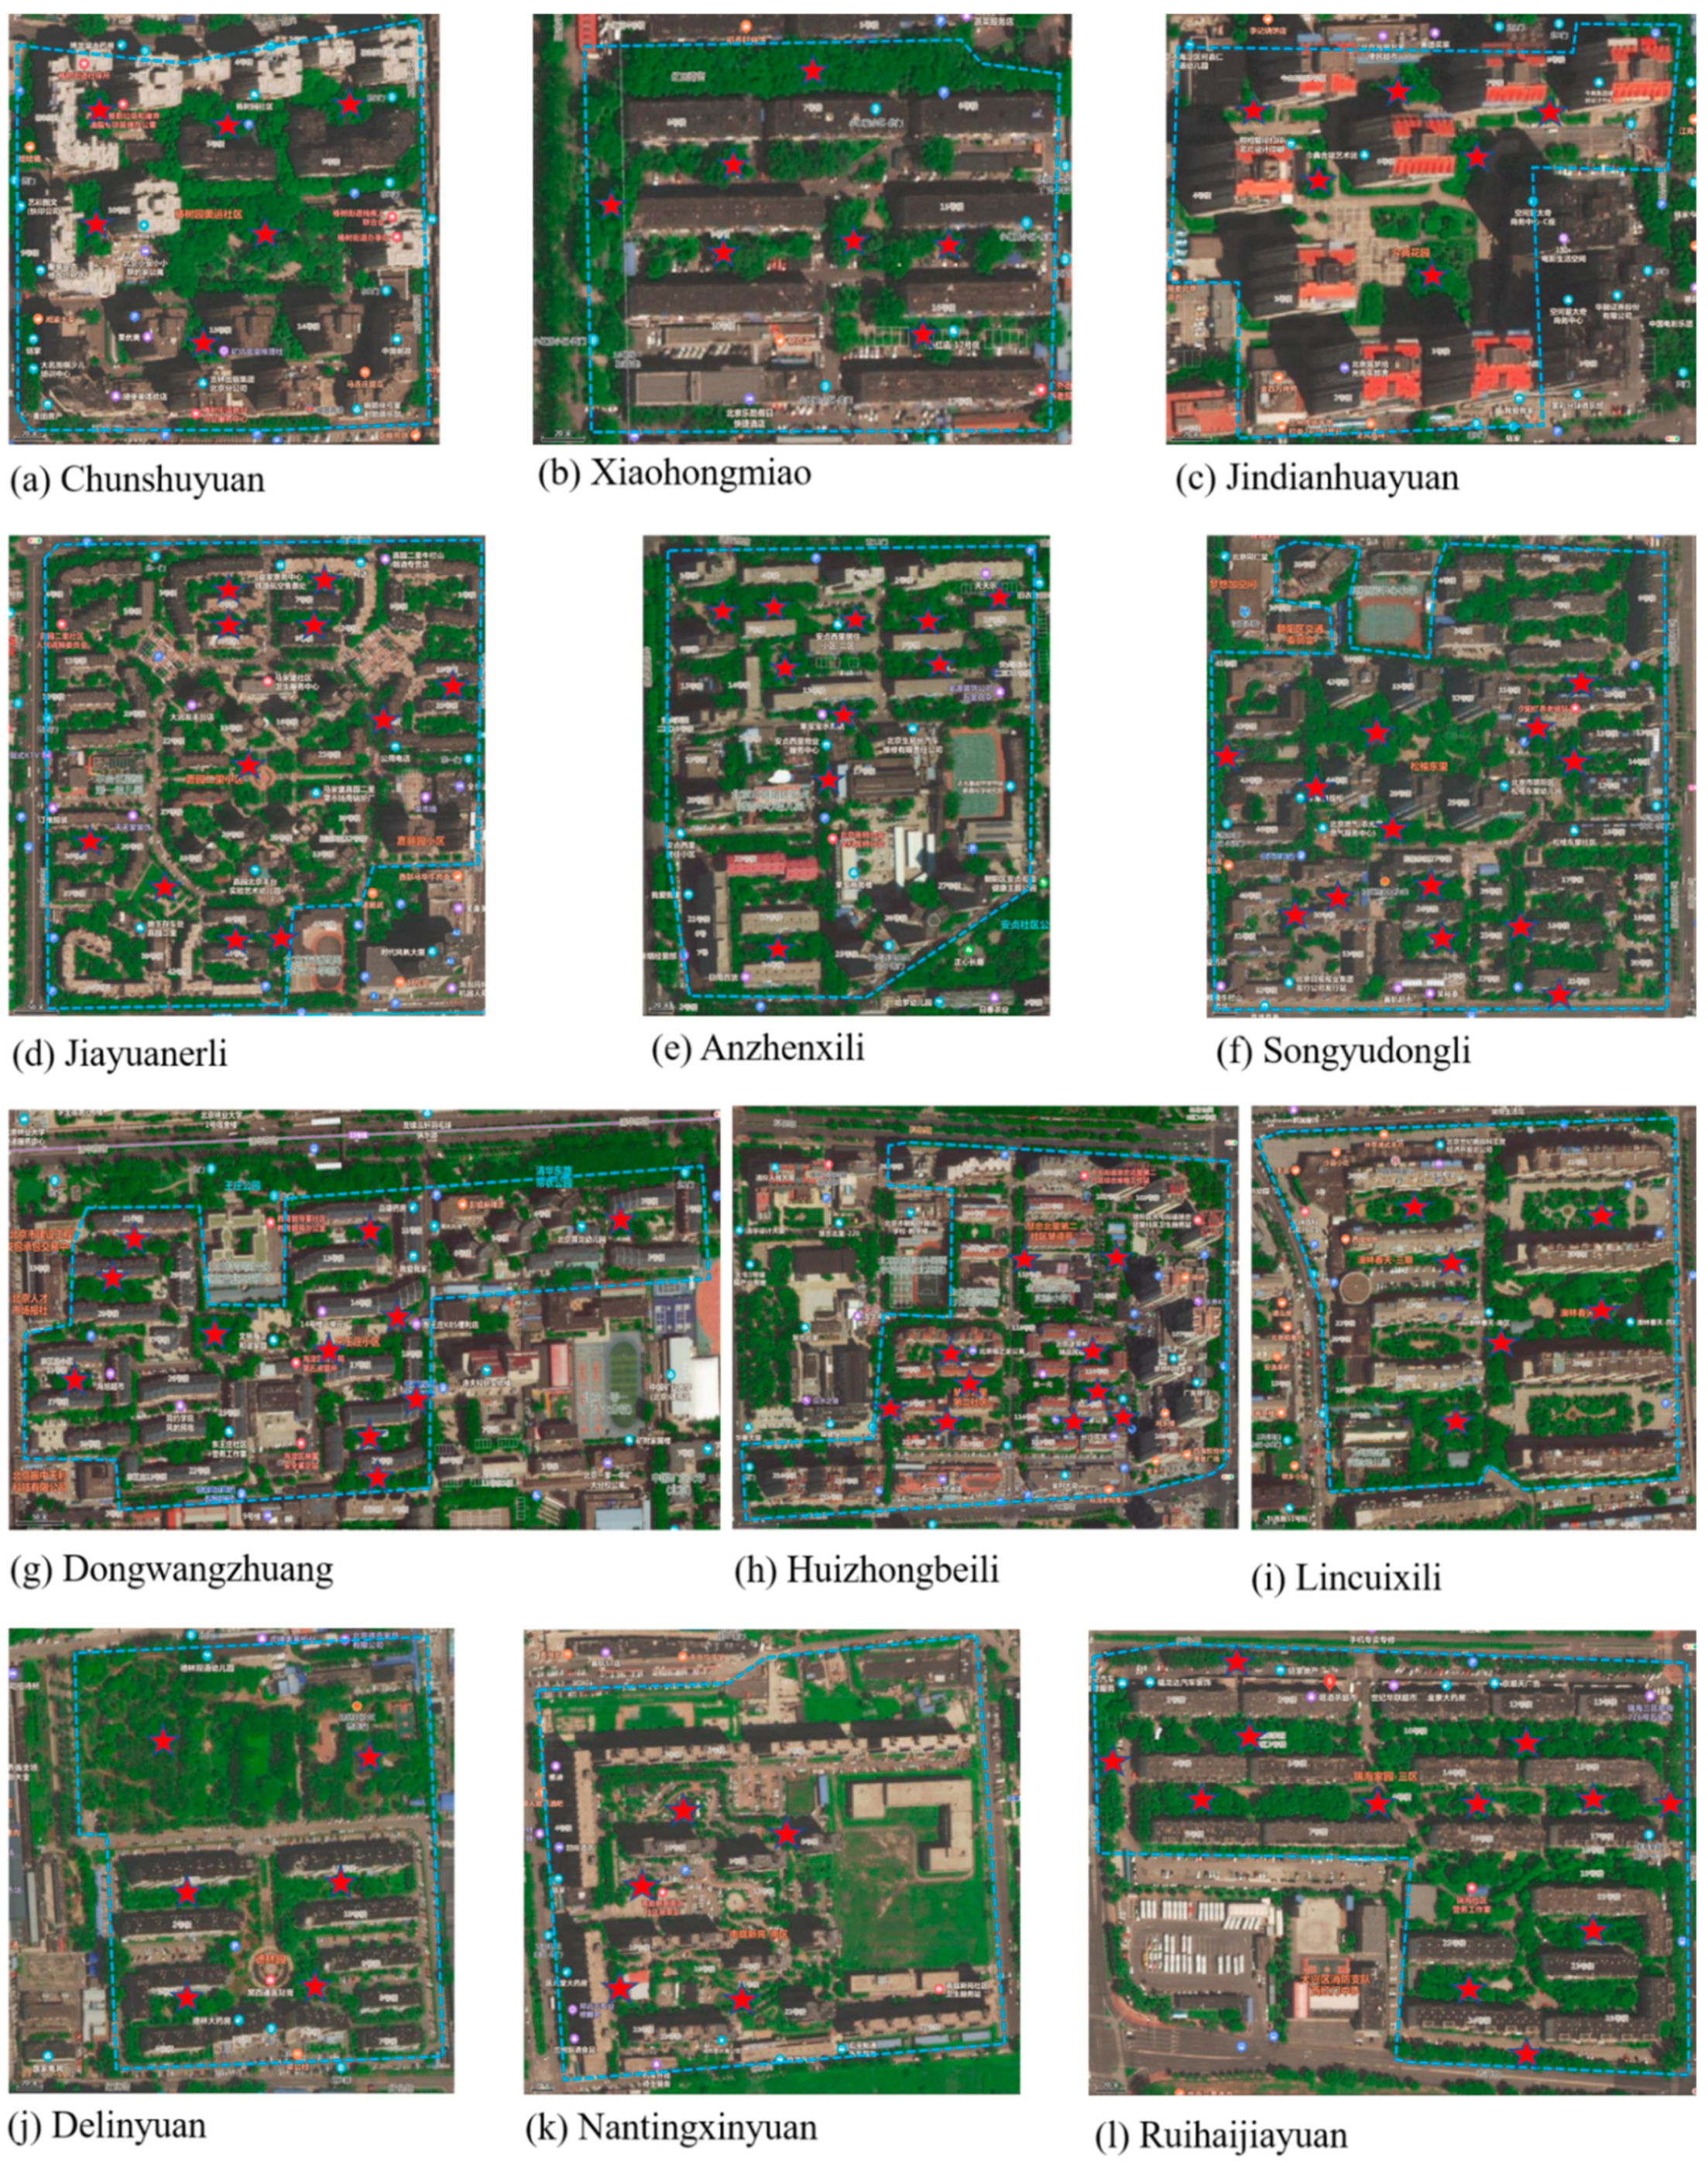
2.1. Study Sites
2.2. Field Survey
2.3. Plant Diversity Indices
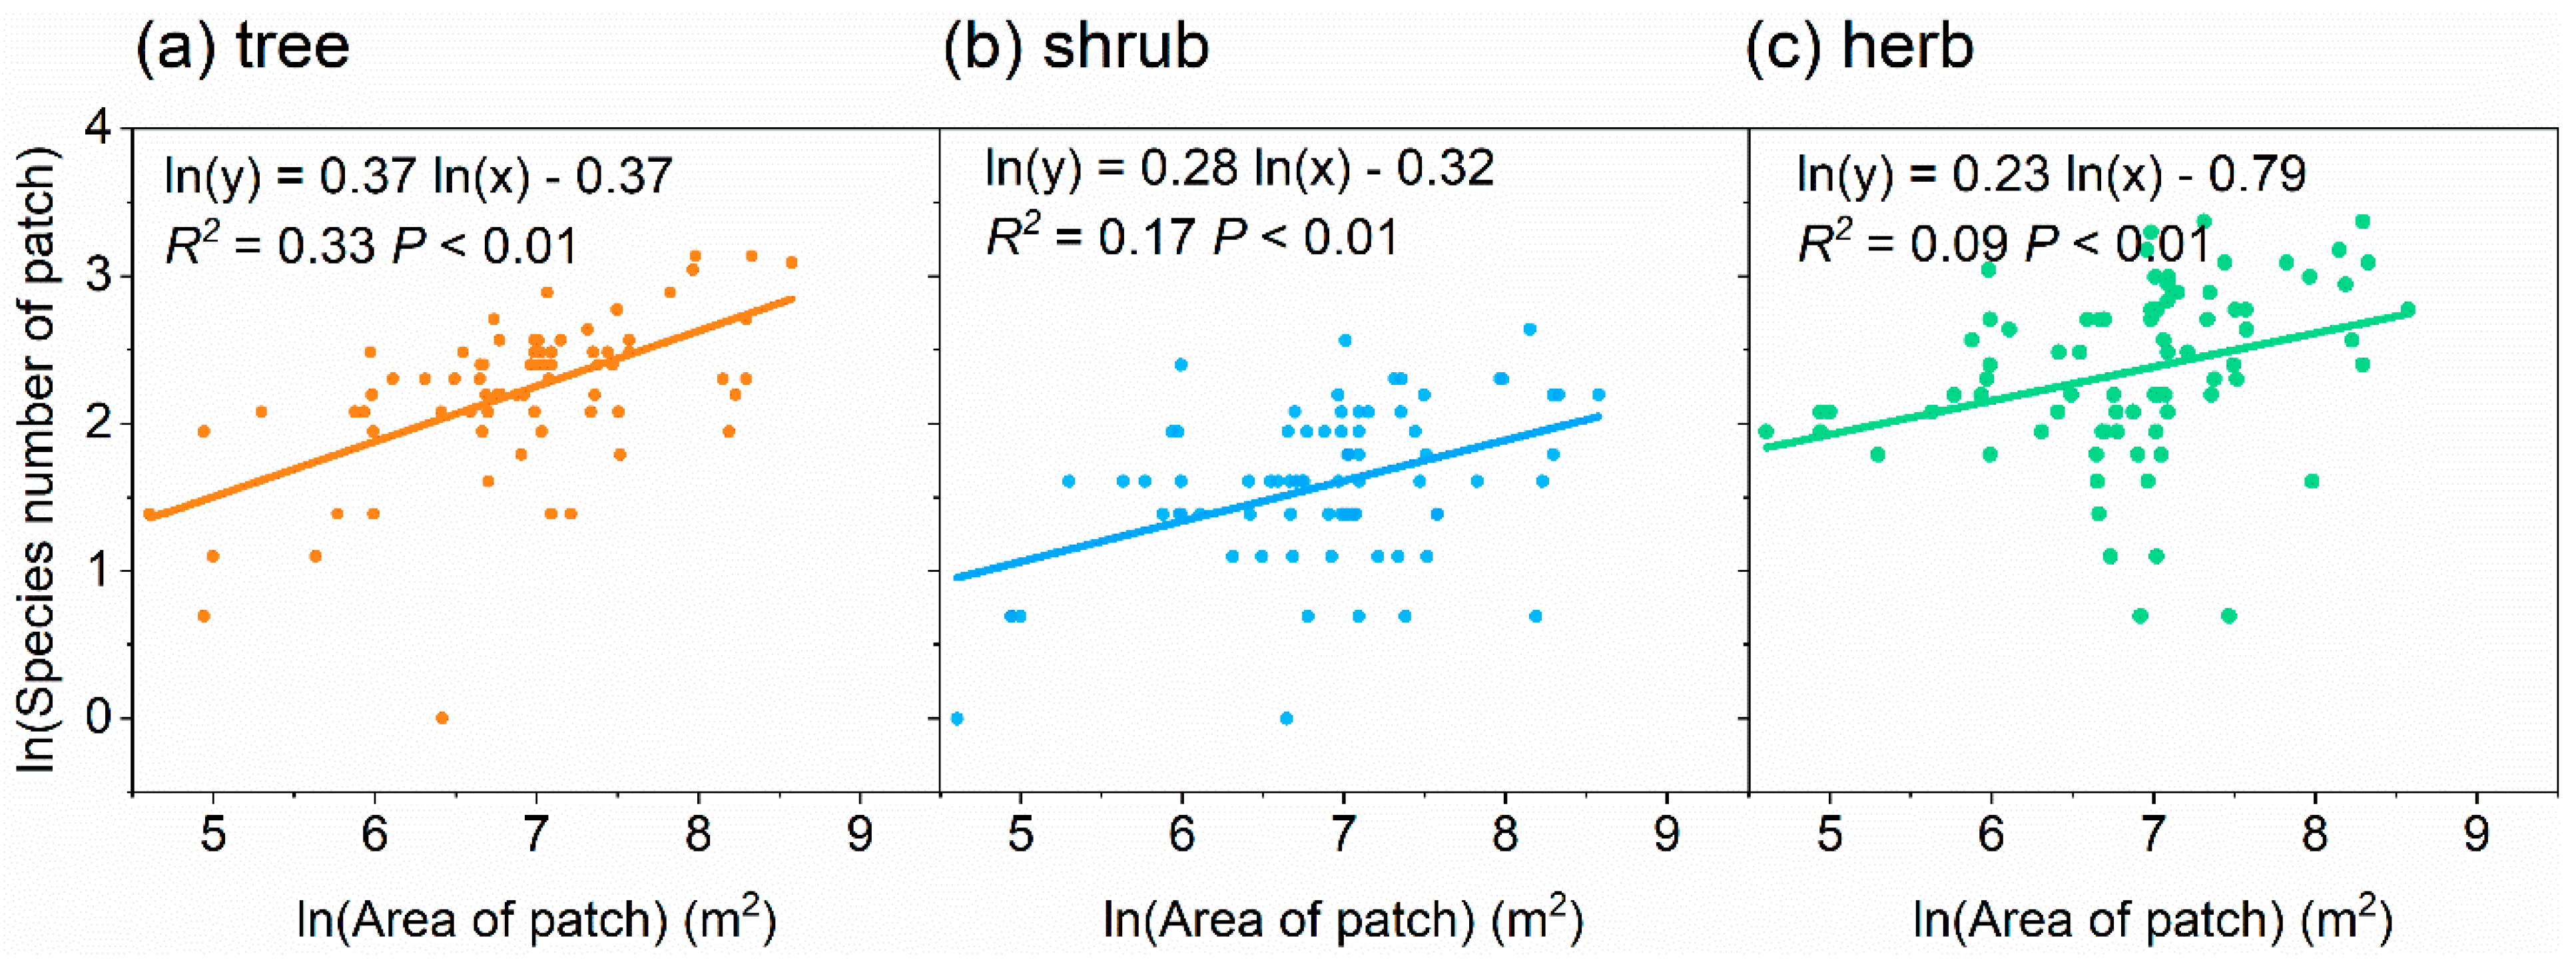
2.4. Species–Area Relationship
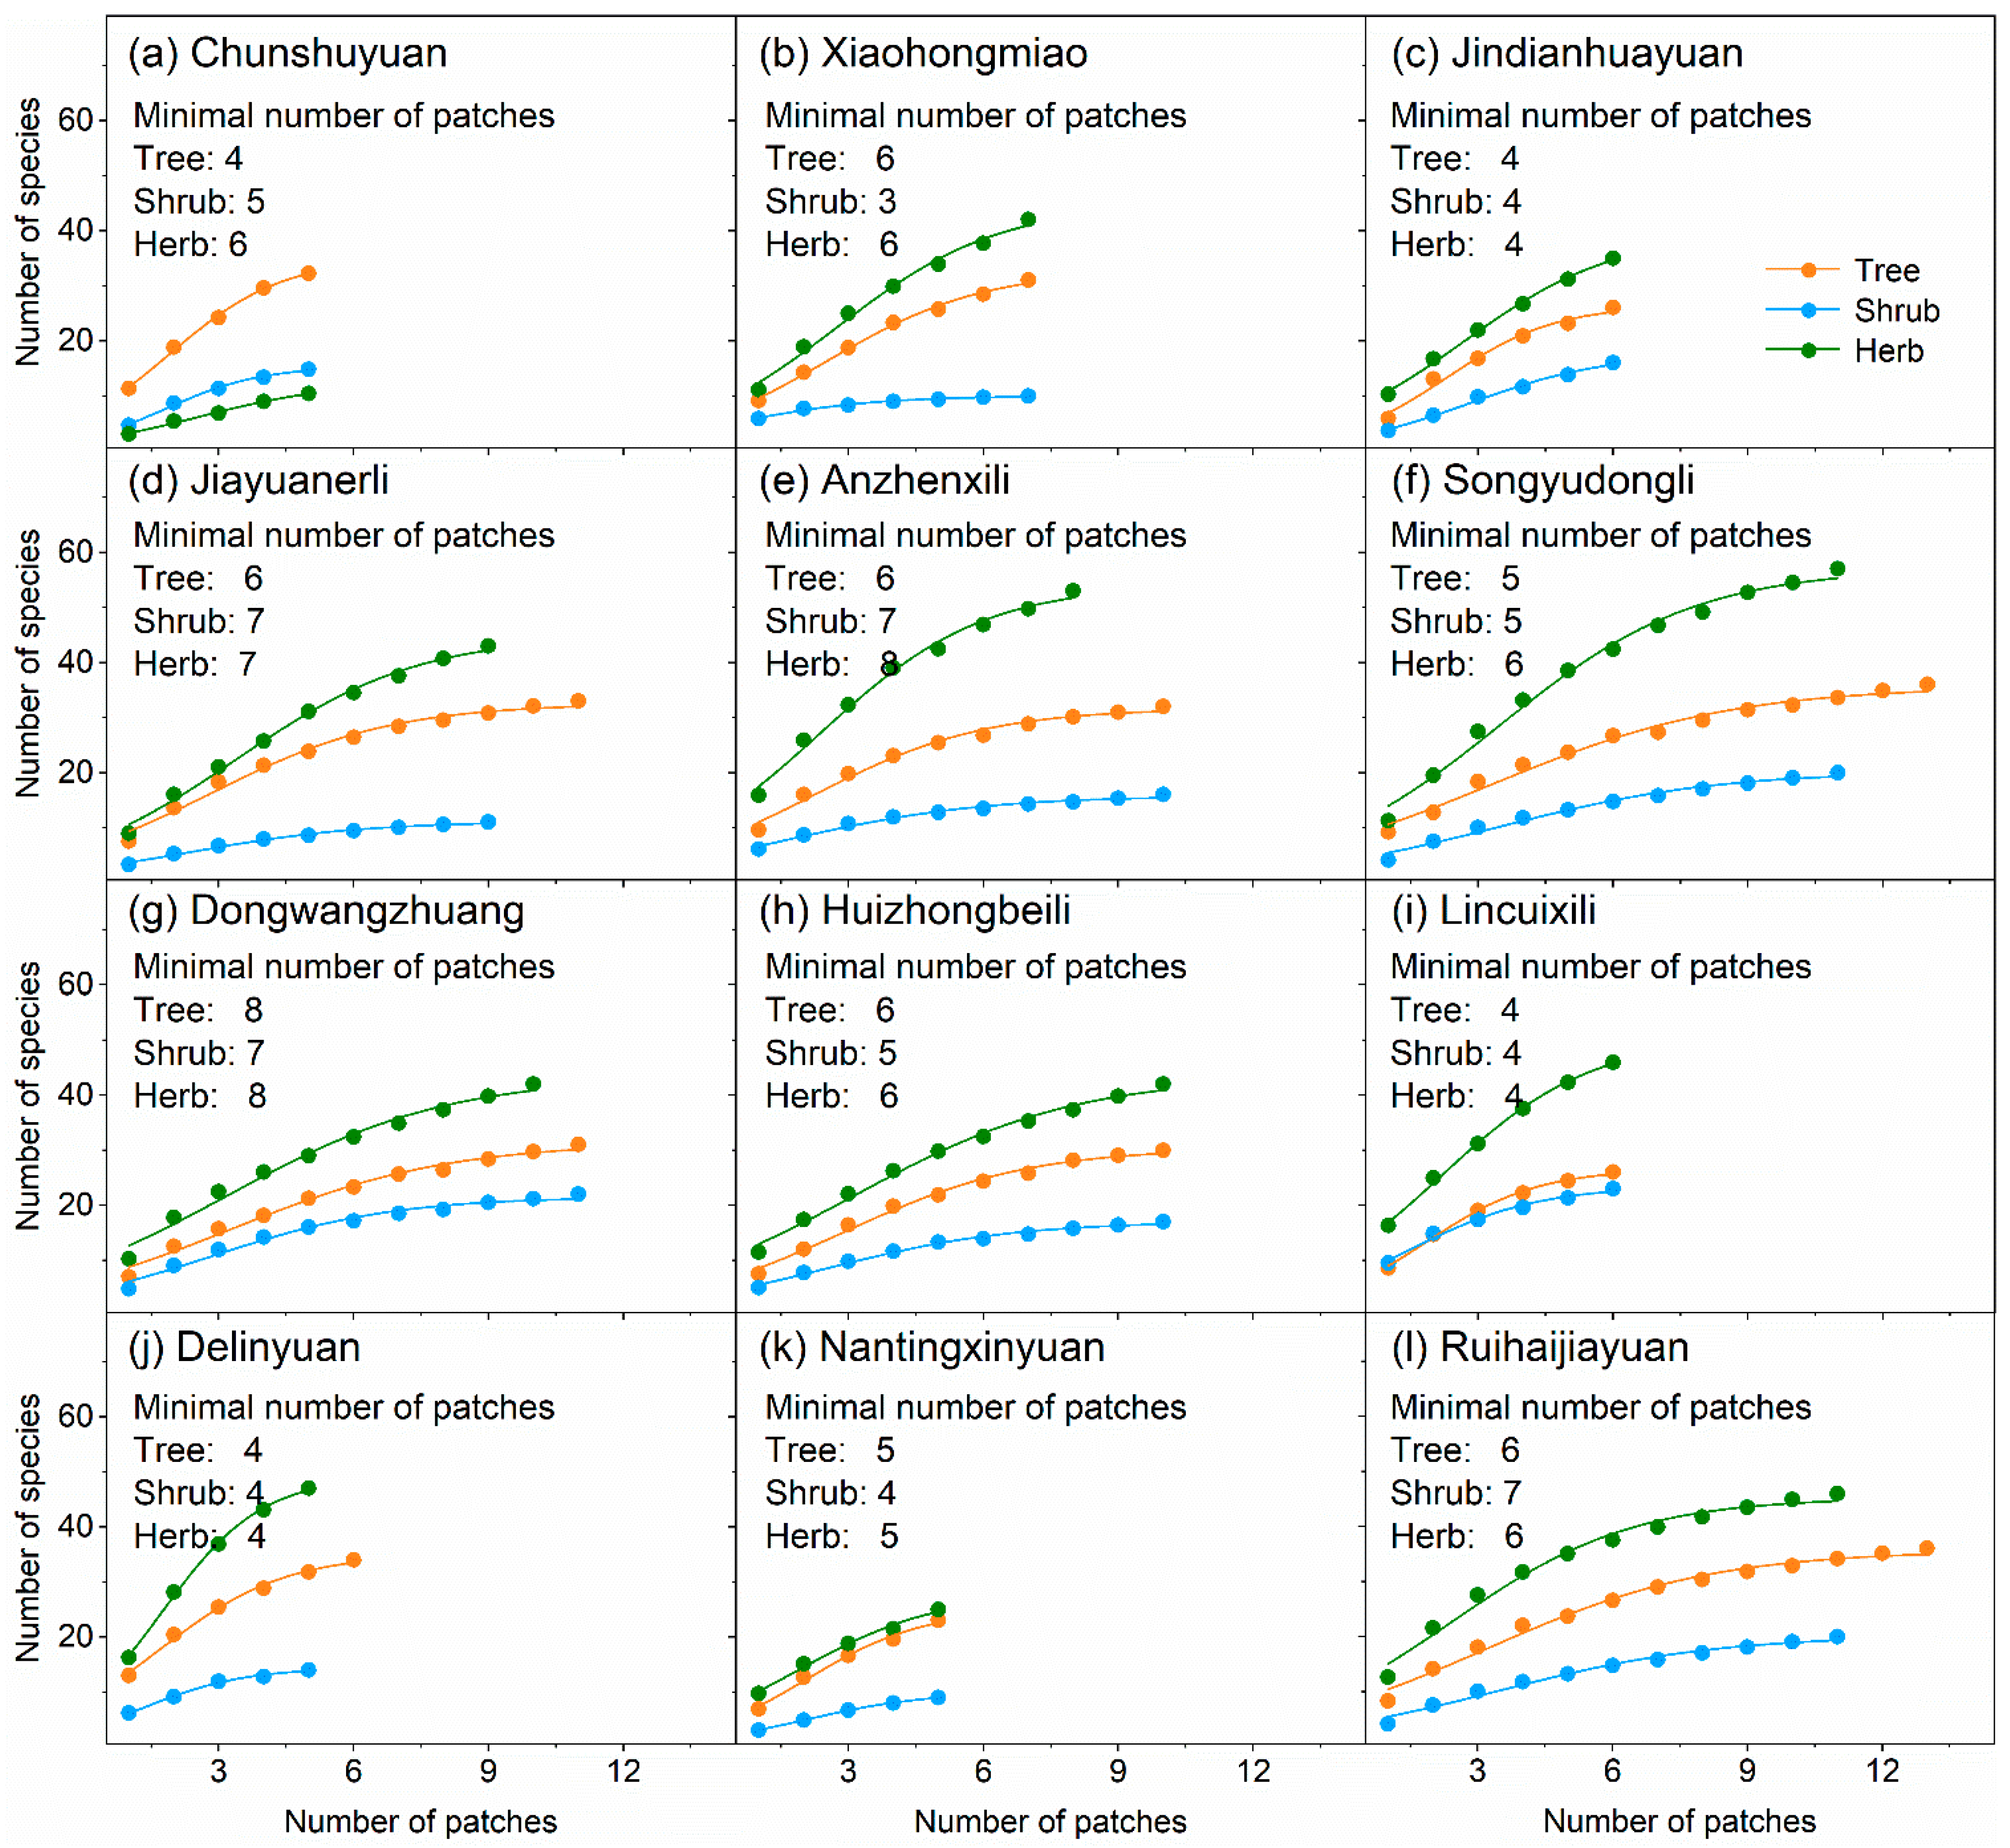
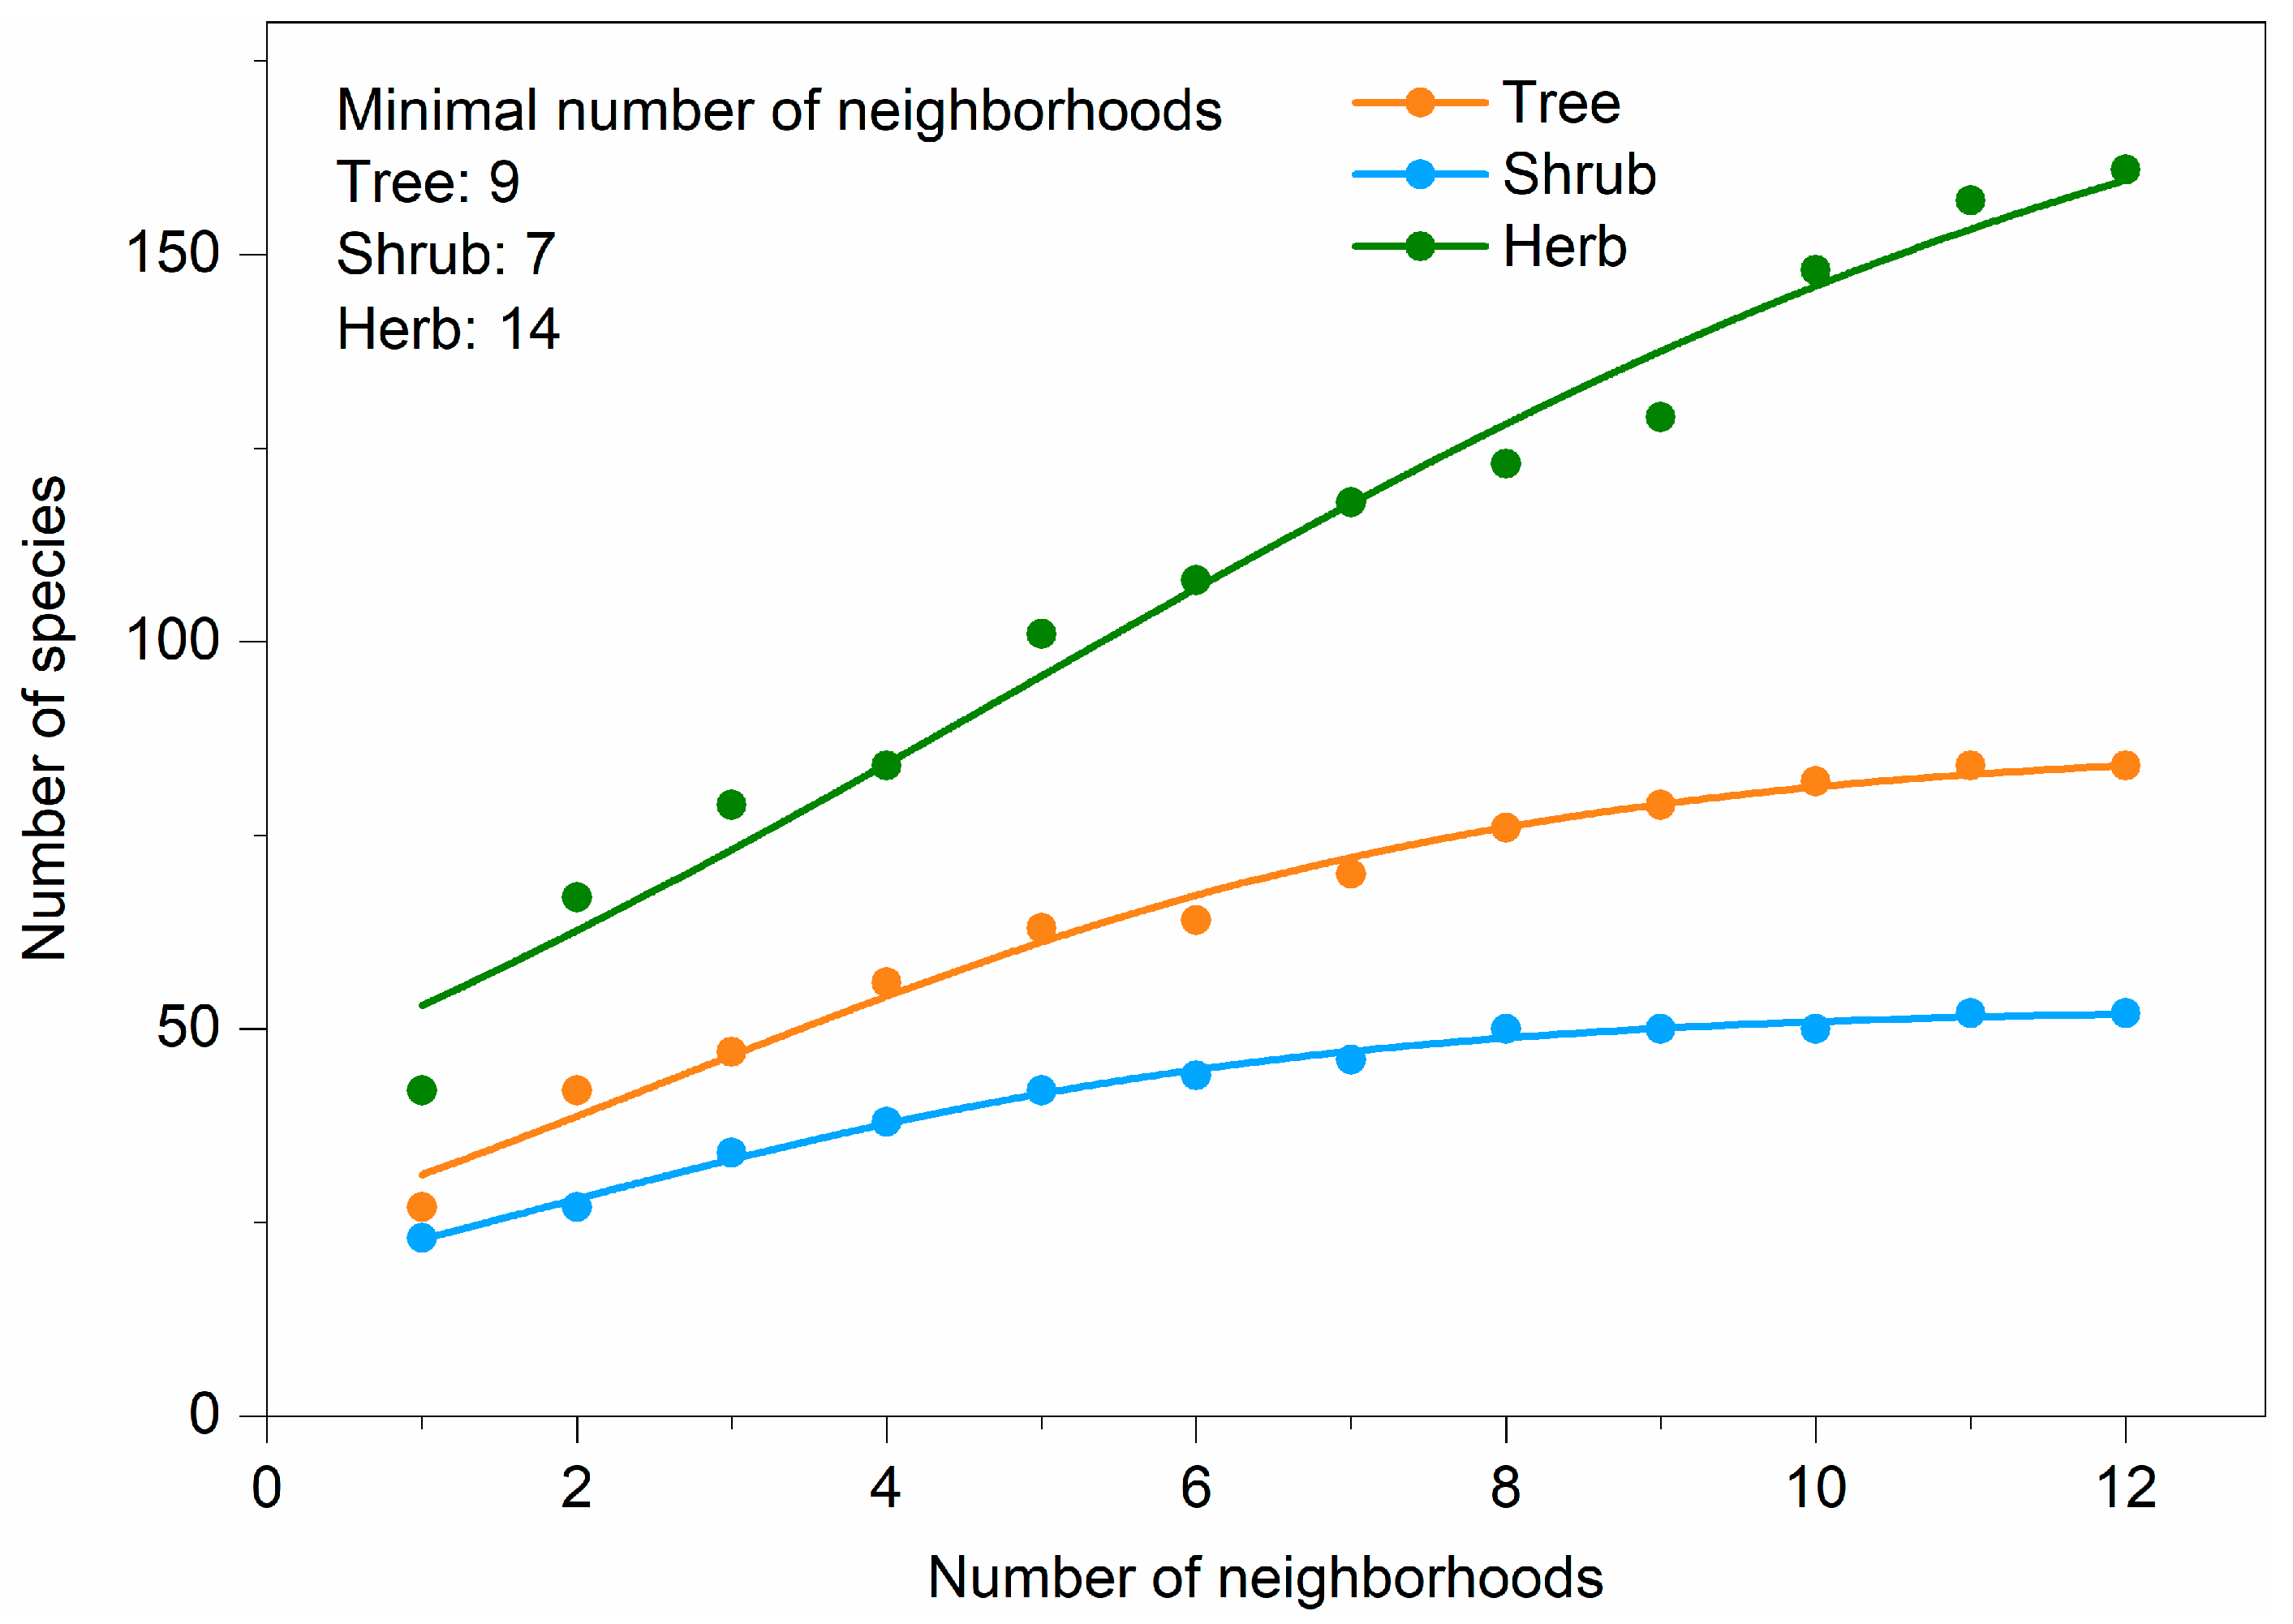
2.5. Species Accumulation Curve
2.6. Data Analysis
3. Results
3.1. Species Diversity at Neighborhood Scale
3.2. Differences in Plant Diversity between Neighborhoods
3.3. Comparison of the Variations in Plant Diversity within and between Neighborhoods
4. Discussion
4.1. Homogeneity of Plant Species Compositions and Diversity between Neighborhoods
4.2. Heterogeneity of Plant Species Compositions and Diversity within Neighborhoods
4.3. Effect of Patch Area on the Number of Species
4.4. Implications for Plant Diversity Surveys
5. Conclusions
Author Contributions
Funding
Acknowledgments
Conflicts of Interest
Appendix A

| Scientific Name | Life Form | Source |
|---|---|---|
| Sabina chinensis (L.) Ant. | Tree | Alien species from other area of China |
| Prunus cerasifera Ehrhar f. atropurpurea (Jacq.) Rehd. | Tree | Alien species from other area of China |
| Magnolia denudata Desr. | Tree | Alien species from other area of China |
| Ginkgo biloba L. | Tree | Alien species from other area of China |
| Toona sinensis (A. Juss.) Roem. | Tree | Alien species from other area of China |
| Malus × micromalus Makino | Tree | Alien species from other area of China |
| Amygdalus persica L. | Tree | Alien species from other area of China |
| Zanthoxylum bungeanum Maxim. | Tree | Alien species from other area of China |
| Juglans regia | Tree | Alien species from other area of China |
| Juniperus formosana Hayata | Tree | Alien species from other area of China |
| Paulownia tomentosa (Thunb.) Steud. | Tree | Alien species from other area of China |
| Amygdalus persica L. var. persica f. atropurpurea Schneid. | Tree | Alien species from other area of China |
| Albizia julibrissin Durazz. | Tree | Alien species from other area of China |
| Prunus salicina Lindl. | Tree | Alien species from other area of China |
| Eucommia ulmoides Oliver | Tree | Alien species from other area of China |
| Pinus bungeana Zucc. ex Endl. | Tree | Alien species from other area of China |
| Fontanesia fortunei Carr. | Tree | Alien species from other area of China |
| Phyllostachys propinqua McClure | Tree | Alien species from other area of China |
| Pinus armandii Franch. | Tree | Alien species from other area of China |
| Ligustrum lucidum Ait. | Tree | Alien species from other area of China |
| Armeniaca vulgaris Lam. | Tree | Alien species from abroad |
| Robinia pseudoacacia | Tree | Alien species from abroad |
| Cedrus deodara (Roxb.) G. Don | Tree | Alien species from abroad |
| Platanus occidentalis L. | Tree | Alien species from abroad |
| Cerasus serrulata (Lindl.) G. Don ex London var. lannesiana (Carr.) Makino | Tree | Alien species from abroad |
| Fraxinus pennsylvanica Marsh. | Tree | Alien species from abroad |
| Platanus orientalis L. | Tree | Alien species from abroad |
| Punica granatum L. | Tree | Alien species from abroad |
| Populus × canadensis Moench | Tree | Alien species from abroad |
| Cerasus yedoensis (Matsum.) Yu et Li | Tree | Alien species from abroad |
| Fraxinus americana Linn. | Tree | Alien species from abroad |
| Platanus acerifolia Willd. | Tree | Alien species from abroad |
| Malus pumila Mill. | Tree | Alien species from abroad |
| Populus alba | Tree | Alien species from abroad |
| Acer truncatum Bunge | Tree | Native species |
| Ulmus pumila L. | Tree | Native species |
| Populus tomentosa | Tree | Native species |
| Salix matsudana var. matsudana f. pendula Schneid. | Tree | Native species |
| Diospyros kaki Thunb. | Tree | Native species |
| Crataegus pinnatifida | Tree | Native species |
| Amygdalus davidiana (Carrière) de Vos ex Henry | Tree | Native species |
| Morus alba L. | Tree | Native species |
| Koelreuteria paniculata Laxm. | Tree | Native species |
| Sophora japonica Linn. var. japonica f. pendula Hort. | Tree | Native species |
| Malus spectabilis (Ait.) Borkh. | Tree | Native species |
| Sophora japonica Linn. | Tree | Native species |
| Broussonetia papyrifera (Linn.) L’Hér. ex Vent. | Tree | Native species |
| Syringa pekinensis Rupr. | Tree | Native species |
| Ailanthus altissima (Mill.) Swingle | Tree | Native species |
| Platycladus orientalis (L.) Franco | Tree | Native species |
| Amygdalus persica L. var. persica f. duplex Rehd. | Tree | Native species |
| Fraxinus chinensis Roxb. | Tree | Native species |
| Salix babylonica | Tree | Native species |
| Salix matsudana | Tree | Native species |
| Diospyros lotus L. | Tree | Native species |
| Pyrus ussuriensis Maxim. | Tree | Native species |
| Pinus tabuliformis Carr. | Tree | Native species |
| Amygdalus triloba (Lindl.) Ricker | Tree | Native species |
| Ziziphus jujuba Mill. var. spinosa (Bunge) Hu ex H. F. Chow | Tree | Native species |
| Ziziphus jujuba Mill. | Tree | Native species |
| Picea wilsonii Mast. | Tree | Native species |
| Picea meyeri Rehd. et Wils. | Tree | Native species |
| Larix principis-rupprechtii Mayr | Tree | Native species |
| Ulmus pumila L. ‘Tenue’ | Tree | Native species |
| Syringa oblata Lindl. | Tree | Native species |
| Acer palmatum Thunb. | Tree | Native species |
| Cotinus coggygria Scop. | Tree | Native species |
| Populus hopeiensis | Tree | Native species |
| Firmiana platanifolia (L. f.) Marsili | Tree | Native species |
| Tamarix chinensis Lour. | Tree | Native species |
| Juglans mandshurica | Tree | Alien species from other area of China |
| Malus spectabilis (Ait.) Borkh. var. riversii (Kirchn.) Rehd. | Tree | Alien species from other area of China |
| Lagerstroemia indica L. | Shrub | Alien species from other area of China |
| Jasminum nudiflorum Lindl. | Shrub | Alien species from other area of China |
| Hibiscus syriacus Linn. | Shrub | Alien species from other area of China |
| Sorbaria sorbifolia (L.) A. Br. | Shrub | Alien species from other area of China |
| Kerria japonica (L.) DC. | Shrub | Alien species from other area of China |
| Buxus sinica (Rehd. et Wils.) Cheng subsp. sinica var. parvifolia M. Cheng | Shrub | Alien species from other area of China |
| Cercis chinensis Bunge | Shrub | Alien species from other area of China |
| Viburnum opulus Linn. var. calvescens (Rehd.) Hara | Shrub | Alien species from other area of China |
| Buxus sinica (Rehd. et Wils.) Cheng | Shrub | Alien species from other area of China |
| Paeonia suffruticosa Andr. | Shrub | Alien species from other area of China |
| Philadelphus incanus Koehne | Shrub | Alien species from other area of China |
| Spiraea vanhouttei (Briot) Zabel | Shrub | Alien species from other area of China |
| Ligustrum quihoui Carr. | Shrub | Alien species from other area of China |
| Berberis thunbergii var. atropurpurea Chenault | Shrub | Alien species from abroad |
| Ficus carica Linn. | Shrub | Alien species from abroad |
| Buxus megistophylla Levl. | Shrub | Alien species from abroad |
| Rosa multiflora Thunb. | Shrub | Alien species from abroad |
| Sabina procumbens (Endl.) Iwata et Kusaka | Shrub | Alien species from abroad |
| Ligustrum × vicaryi Rehder | Shrub | Alien species from abroad |
| Lonicera maackii (Rupr.) Maxim. | Shrub | Native species |
| Forsythia suspensa (Thunb.) Vahl | Shrub | Native species |
| Rosa chinensis Jacq. | Shrub | Native species |
| Weigela florida (Bunge) A. DC. | Shrub | Native species |
| Rosa xanthina Lindl. | Shrub | Native species |
| Sorbaria kirilowii (Regel) Maxim. | Shrub | Native species |
| Swida alba | Shrub | Native species |
| Lycium chinense Mill. | Shrub | Native species |
| Lespedeza bicolor Turcz. | Shrub | Native species |
| Sambucus williamsii Hance | Shrub | Native species |
| Sabina vulgaris Ant. | Shrub | Alien species from other area of China |
| Kerria japonica (L.) DC. f. pleniflora (Witte) Rehd. | Shrub | Alien species from other area of China |
| Hibiscus rosa-sinensis Linn. | Shrub | Alien species from other area of China |
| Dioscorea nipponica Makino | Liana | Alien species from other area of China |
| Parthenocissus quinquefolia (L.) Planch. | Liana | Alien species from abroad |
| Luffa cylindrica (L.) Roem. | Liana | Alien species from abroad |
| Pharbitis nil (L.) Choisy | Liana | Invasive species |
| Vitis vinifera L. | Liana | Alien species from abroad |
| Phaseolus vulgaris Linn. | Liana | Alien species from abroad |
| Cucurbita moschata (Duch. ex Lam.) Duch. ex Poiret | Liana | Alien species from abroad |
| Metaplexis japonica (Thunb.) Makino | Liana | Native species |
| Rubia cordifolia L. | Liana | Native species |
| Humulus scandens | Liana | Native species |
| Cynanchum chinense R. Br. | Liana | Native species |
| Lonicera japonica Thunb. | Liana | Native species |
| Clematis intricata Bunge | Liana | Native species |
| Gynostemma pentaphyllum (Thunb.) Makino | Liana | Alien species from other area of China |
| Perilla frutescens (L.) Britt. | Herb | Alien species from other area of China |
| Teucrium tsinlingense C. Y. Wu et S. Chow var. porphyreum C. Y. Wu et S. Chow | Herb | Alien species from other area of China |
| Iris tectorum | Herb | Alien species from other area of China |
| Hemerocallis fulva (L.) L. | Herb | Alien species from other area of China |
| Impatiens balsamina L. | Herb | Invasive species |
| Hylotelephium erythrostictum (Miq.) H. Ohba | Herb | Alien species from other area of China |
| Ixeris denticulata (Houtt.) Stebb. | Herb | Native species |
| Ixeris polycephala Cass. | Herb | Alien species from other area of China |
| Viola verecunda A. Gray | Herb | Alien species from other area of China |
| Calystegia sepium (L.) R. Br. | Herb | Alien species from other area of China |
| Urtica fissa E. Pritz. | Herb | Alien species from other area of China |
| Malva crispa Linn. | Herb | Alien species from other area of China |
| Cleome spinosa Jacq. | Herb | Alien species from abroad |
| Mirabilis jalapa L. | Herb | Alien species from abroad |
| Phytolacca americana L. | Herb | Invasive species |
| Pharbitis hederacea (L.) Choisy | Herb | Invasive species |
| Helianthus tuberosus L. | Herb | Invasive species |
| Glechoma longituba (Nakai) Kupr | Herb | Alien species from abroad |
| Cosmos bipinnata Cav. | Herb | Alien species from abroad |
| Amaranthus retroflexus | Herb | Invasive species |
| Capsicum annuum L. | Herb | Alien species from abroad |
| Amaranthus viridis | Herb | Invasive species |
| Chloris virgata Sw. | Herb | Invasive species |
| Trifolium repens L. | Herb | Alien species from abroad |
| Euphorbia maculata L. | Herb | Alien species from abroad |
| Aster subulatus Michx. | Herb | Alien species from abroad |
| Galinsoga parviflora Cav. | Herb | Alien species from abroad |
| Viola tricolor L. | Herb | Alien species from abroad |
| Datura stramonium Linn. | Herb | Invasive species |
| Pharbitis purpurea (L.) Voisgt | Herb | Invasive species |
| Solanum melongena L. | Herb | Alien species from abroad |
| Symphyotrichum novi-belgii (L.) G.L.Nesom | Herb | Alien species from abroad |
| Rudbeckia hirta L. | Herb | Alien species from abroad |
| Portulaca grandiflora Hook. | Herb | Alien species from abroad |
| Dahlia pinnata Cav. | Herb | Alien species from abroad |
| Lactuca sativa L. | Herb | Alien species from abroad |
| Helianthus annuus L. | Herb | Alien species from abroad |
| Physostegia virginiana Benth. | Herb | Alien species from abroad |
| Echinacea purpurea (Linn.) Moench | Herb | Alien species from abroad |
| Oxalis corniculata L. | Herb | Native species |
| Viola philippica | Herb | Native species |
| Hosta plantaginea (Lam.) Aschers. | Herb | Native species |
| Leonurus artemisia (Laur.) S. Y. Hu | Herb | Native species |
| Acalypha australis L. | Herb | Native species |
| Duchesnea indica (Andr.) Focke | Herb | Native species |
| Taraxacum mongolicum Hand.-Mazz. | Herb | Native species |
| Euphorbia humifusa Willd. ex Schlecht. | Herb | Native species |
| Ophiopogon japonicus | Herb | Native species |
| Digitaria sanguinalis (L.) Scop. | Herb | Native species |
| Kalimeris indica (L.) Sch. -Bip. | Herb | Native species |
| Portulaca oleracea L. | Herb | Native species |
| Solanum nigrum L. | Herb | Native species |
| Chenopodium glaucum L. | Herb | Native species |
| Arthraxon hispidus (Thunb.) Makino | Herb | Native species |
| Zoysia japonica Steud. | Herb | Native species |
| Setaria viridis (L.) Beauv. | Herb | Native species |
| Trigonotis peduncularis (Trev.) Benth. ex Baker et Moore | Herb | Native species |
| Calystegia hederacea Wall.ex.Roxb. | Herb | Native species |
| Plantago asiatica L. | Herb | Native species |
| Mentha haplocalyx Briq. | Herb | Native species |
| Pinellia ternata | Herb | Native species |
| Chenopodium album L. | Herb | Native species |
| Tribulus terrester L. | Herb | Native species |
| Bidens pilosa L. | Herb | Native species |
| Artemisia annua | Herb | Native species |
| Rehmannia glutinosa (Gaetn.) Libosch. ex Fisch. et Mey. | Herb | Native species |
| Potentilla chinensis Ser. | Herb | Native species |
| Commelina communis | Herb | Native species |
| Inula japonica Thunb. | Herb | Native species |
| Myosoton aquaticum (L.) Moench | Herb | Native species |
| Lythrum salicaria L. | Herb | Native species |
| Oplismenus undulatifolius (Arduino) Beauv. | Herb | Native species |
| Aster tataricus L. f. | Herb | Native species |
| Polygonum aviculare L. | Herb | Native species |
| Convolvulus arvensis L. | Herb | Native species |
| Poa annua L. | Herb | Native species |
| Paeonia lactiflora Pall. | Herb | Native species |
| Dendranthema morifolium (Ramat.) Tzvel. | Herb | Native species |
| Melica scabrosa Trin. | Herb | Native species |
| Viola pekinensis | Herb | Native species |
| Potentilla supina L. | Herb | Native species |
| Cyperus nipponicus Franch. et Savat. | Herb | Native species |
| Cirsium setosum (Willd.) MB. | Herb | Native species |
| Iris lactea Pall. var. chinensis (Fisch.) Koidz. | Herb | Native species |
| Cyperus fuscus L. | Herb | Native species |
| Achyranthes bidentata Blume | Herb | Native species |
| Platycodon grandiflorus (Jacq.) A. DC. | Herb | Native species |
| Belamcanda chinensis (L.) Redouté | Herb | Alien species from other area of China |
| Eleusine indica (L.) Gaertn. | Herb | Native species |
| Allium tuberosum | Herb | Alien species from abroad |
| Hylotelephium pallescens (Freyn) H. Ohba | Herb | Native species |
| Ixeridium sonchifolium (Maxim.) Shih | Herb | Native species |
| Artemisia argyi Levl. et Van. | Herb | Native species |
| Ophiopogon bodinieri | Herb | Alien species from other area of China |
| Erigeron annuus (L.) Pers. | Herb | Alien species from abroad |
| Axyris amaranthoides L. | Herb | Alien species from other area of China |
| Conyza canadensis (L.) Cronq. | Herb | Alien species from abroad |
| Beta vulgaris L. var. cicla L. | Herb | Alien species from abroad |
| Canna indica L. | Herb | Alien species from abroad |
| Amaranthus tricolor | Herb | Alien species from abroad |

References
- Vila-Ruiz, C.; Meléndez-Ackerman, E.; Santiago-Bartolomei, R.; Garcia-Montiel, D.; Lastra, L.; Figuerola, C.; Fumero-Caban, J. Plant species richness and abundance in residential yards across a tropical watershed: Implications for urban sustainability. Ecol. Soc. 2014, 19. [Google Scholar] [CrossRef]
- Clarke, L.W.; Jenerette, G.D. Biodiversity and direct ecosystem service regulation in the community gardens of Los Angeles, CA. Landsc. Ecol. 2015, 30, 637–653. [Google Scholar] [CrossRef]
- McKinney, M.L. Urbanization, Biodiversity, and Conservation: The impacts of urbanization on native species are poorly studied, but educating a highly urbanized human population about these impacts can greatly improve species conservation in all ecosystems. Bioscience 2002, 52, 883–890. [Google Scholar] [CrossRef]
- Gaston, K.J.; Warren, P.H.; Thompson, K.; Smith, R.M. Urban domestic gardens (IV): The extent of the resource and its associated features. Biodivers. Conserv. 2005, 14, 3327–3349. [Google Scholar] [CrossRef]
- Wang, H.F.; Qureshi, S.; Knapp, S.; Friedman, C.R.; Hubacek, K. A basic assessment of residential plant diversity and its ecosystem services and disservices in Beijing, China. Appl. Geogr. 2015, 64, 121–131. [Google Scholar] [CrossRef]
- Zhao, J.; Ouyang, Z.; Zheng, H.; Zhou, W.; Wang, X.; Xu, W.; Ni, Y. Plant species composition in green spaces within the built-up areas of Beijing, China. Plant Ecol. 2010, 209, 189–204. [Google Scholar] [CrossRef]
- Kong, F.; Nakagoshi, N. Spatial-temporal gradient analysis of urban green spaces in Jinan, China. Landsc. Urban Plan. 2006, 78, 147–164. [Google Scholar] [CrossRef]
- Aronson, M.F.; Lepczyk, C.A.; Evans, K.L.; Goddard, M.A.; Lerman, S.B.; MacIvor, J.S.; Nilon, C.H.; Vargo, T. Biodiversity in the city: Key challenges for urban green space management. Front. Ecol. Environ. 2017, 15, 189–196. [Google Scholar] [CrossRef]
- Zhao, J. Species Composition and Spatial Distribution of Urban Plants within the Built-Up Areas of Beijing, China. Ph.D. Thesis, Chinese Academy of Sciences, Beijing, China, 2010. (In Chinese, with English abstract). [Google Scholar]
- Guo, P.; Su, Y.; Wan, W.; Liu, W.; Zhang, H.; Sun, X.; Ouyang, Z.; Wang, X. Urban plant diversity in relation to land use types in built-up areas of Beijing. Chin. Geogr. Sci. 2018, 28, 100–110. [Google Scholar] [CrossRef]
- Kinzig, A.P.; Warren, P.; Martin, C.; Hope, D.; Katti, M. The effects of human socioeconomic status and cultural characteristics on urban patterns of biodiversity. Ecol. Soc. 2005, 10, 23. [Google Scholar] [CrossRef]
- Hope, D.; Gries, C.; Zhu, W.X.; Fagan, W.F.; Redman, C.L.; Grimm, N.B.; Nelson, A.L.; Martin, C.; Kinzig, A. Socioeconomics drive urban plant diversity. Proc. Natl. Acad. Sci. USA 2003, 100, 8788–8792. [Google Scholar] [CrossRef]
- Walz, U. Landscape structure, landscape metrics and biodiversity. Living Rev. Landsc. Res. 2011, 5, 1–35. [Google Scholar] [CrossRef]
- Groffman, P.M.; Cavender-Bares, J.; Bettez, N.D.; Grove, J.M.; Hall, S.J.; Heffernan, J.B.; Hobbie, S.E.; Larson, K.L.; Morse, J.L.; Neill, C.; et al. Ecological homogenization of urban USA. Front. Ecol. Environ. 2014, 12, 74–81. [Google Scholar] [CrossRef]
- Pearse, W.D.; Cavender-Bares, J.; Hobbie, S.E.; Avolio, M.; Bettez, N.; Chowdhury, R.R.; Groffman, P.M.; Grove, M.; Hall, S.J.; Heffernan, J.B.; et al. Ecological homogenisation in North American urban yards: Vegetation diversity, composition, and structure. bioRxiv 2016, 061937. [Google Scholar] [CrossRef]
- Wheeler, M.M.; Neill, C.; Groffman, P.M.; Avolio, M.; Bettez, N.; Cavender-Bares, J.; Chowdhury, R.R.; Darling, L.; Grove, M.; Hall, S.J.; et al. Continental-scale homogenization of residential lawn plant communities. Landsc. Urban Plan. 2017, 165, 54–63. [Google Scholar] [CrossRef]
- Polsky, C.; Grove, J.M.; Knudson, C.; Groffman, P.M.; Bettez, N.; Cavender-Bares, J.; Hall, S.J.; Heffernan, J.B.; Hobbie, S.E.; Larson, K.L.; et al. Assessing the homogenization of urban land management with an application to US residential lawn care. Proc. Natl. Acad. Sci. USA 2014, 111, 4432–4437. [Google Scholar] [CrossRef]
- Williams, N.S.G.; Hahs, A.K.; Vesk, P.A. Urbanisation, plant traits and the composition of urban floras. Perspect. Plant Ecol. Evol. Syst. 2015, 17, 78–86. [Google Scholar] [CrossRef]
- Groffman, P.M.; Avolio, M.; Cavender-Bares, J.; Bettez, N.D.; Grove, J.M.; Hall, S.J.; Hobbie, S.E.; Larson, K.L.; Lerman, S.B.; Locke, D.H.; et al. Ecological homogenization of residential macrosystems. Nat. Ecol. Evol. 2017, 1, 191. [Google Scholar] [CrossRef]
- McKinney, M.L. Urbanization as a major cause of biotic homogenization. Biol. Conserv. 2006, 127, 247–260. [Google Scholar] [CrossRef]
- Bertoncini, A.P.; Machon, N.; Pavoine, S.; Muratet, A. Local gardening practices shape urban lawn floristic communities. Landsc. Urban Plan. 2012, 105, 53–61. [Google Scholar] [CrossRef]
- Stewart, G.H.; Ignatieva, M.E.; Meurk, C.D.; Buckley, H.; Horne, B.; Braddick, T. Urban Biotopes of Aotearoa New Zealand (URBANZ)(I): Composition and diversity of temperate urban lawns in Christchurch. Urban Ecosyst. 2009, 12, 233–248. [Google Scholar] [CrossRef]
- Walker, J.S.; Grimm, N.B.; Briggs, J.M.; Gries, C.; Dugan, L. Effects of urbanization on plant species diversity in central Arizona. Front. Ecol. Environ. 2009, 7, 465–470. [Google Scholar] [CrossRef]
- Yang, J.; La Sorte, F.A.; Pyšek, P.; Yan, P.; Nowak, D.; McBride, J. The compositional similarity of urban forests among the world’s cities is scale dependent. Glob. Ecol. Biogeogr. 2015, 24, 1413–1423. [Google Scholar] [CrossRef]
- Belaire, J.A.; Westphal, L.M.; Minor, E.S. Different social drivers, including perceptions of urban wildlife, explain the ecological resources in residential landscapes. Landsc. Ecol. 2016, 31, 401–413. [Google Scholar] [CrossRef]
- Faeth, S.H.; Bang, C.; Saari, S. Urban biodiversity: Patterns and mechanisms. Ann. N. Y. Acad. Sci. 2011, 1223, 69–81. [Google Scholar] [CrossRef] [PubMed]
- Song, A.C. Study on Plant Diversity and Landscape of Residential Green Area in Beijing Built-Up District. Master’s Thesis, Beijing Forestry University, Beijing, China, 2014. (In Chinese, with English abstract). [Google Scholar]
- Wang, S.; Qi, G.; Knapp, B.O. Topography affects tree species distribution and biomass variation in a warm temperate, secondary forest. Forests 2019, 10, 895. [Google Scholar] [CrossRef]
- Xie, Y.; Fang, C.; Lin, G.; Gong, H.; Qiao, B. Tempo-spatial patterns of land use changes ansd urban development in globalizing China: A study of Beijing. Sensors 2007, 7, 2881–2906. [Google Scholar] [CrossRef] [PubMed]
- Peng, J.; Zhao, S.; Liu, Y.; Tian, L. Identifying the urban-rural fringe using wavelet transform and kernel density estimation: A case study in Beijing City, China. Environ. Modell. Softw. 2016, 83, 286–302. [Google Scholar] [CrossRef]
- Yan, J.L. Quantifying the Fine-Scale Spatiotemporal Pattern of Vegetation Cover and Its Socioeconomic Drivers in Beijing Urban Areas. Ph.D. Thesis, University of Chinese Academy of Sciences, Beijing, China, 2016. (In Chinese, with English abstract). [Google Scholar]
- Sun, W.; Zheng, S.; Geltner, D.M.; Wang, R. The Housing Market Effects of Local Home Purchase Restrictions: Evidence from Beijing. J. Real Estate Financ. Econ. 2016, 55, 288–312. [Google Scholar] [CrossRef]
- Lau, K.M.; Li, S.M. Commercial housing affordability in Beijing, 1992–2002. Habitat Int. 2006, 30, 614–627. [Google Scholar] [CrossRef]
- Chen, J.; Guo, F.; Wu, Y. One decade of urban housing reform in China: Urban housing price dynamics and the role of migration and urbanization, 1995–2005. Habitat Int. 2011, 35, 1–8. [Google Scholar] [CrossRef]
- Tang, X.; Cui, Y.; Li, N.; Fu, Y.; Liu, X.; Run, Y.; Li, M.; Zhao, G.; Dong, J. Human activities enhance radiation forcing through surface albedo associated with vegetation in Beijing. Remote Sens. 2020, 12, 837. [Google Scholar] [CrossRef]
- Flora of China. Compilation Committee of the Flora of China, 1959–2004; Science Press: Beijing, China, 2009. (In Chinese) [Google Scholar]
- He, S.; Xing, Q.; Yin, Z.; Jiang, X. Beijing Flora, 3rd ed.; Beijing Publishing House: Beijing, China, 1993. (In Chinese) [Google Scholar]
- Legendre, P.; De Cáceres, M. Beta diversity as the variance of community data: Dissimilarity coefficients and partitioning. Ecol. Lett. 2013, 16, 951–963. [Google Scholar] [CrossRef] [PubMed]
- Gleason, H.A. On the relation between species and area. Ecology 1922, 3, 158–162. [Google Scholar] [CrossRef]
- Shannon, C.E. A mathematical theory of communication. Bell Syst. Tech. J. 1984, 27, 379–423. [Google Scholar] [CrossRef]
- Scheiner, S.M. Six Types of Species-Area Curves. Glob. Ecol. Biogeogr. 2003, 12, 441–447. [Google Scholar] [CrossRef]
- Zhao, J.; Ouyang, Z.; Xu, W.; Zheng, H.; Meng, X. Sampling adequacy estimation for plant species composition by accumulation curves—A case study of urban vegetation in Beijing, China. Landsc. Urban Plan. 2010, 95, 113–121. [Google Scholar] [CrossRef]
- Oksanen, J.; Blanchet, F.G.; Kindt, R.; Legendre, P.; Minchin, P.R.; O’hara, R.B.; Simpson, G.L.; Solymos, P.; Stevens, M.H.; Wagner, H. Vegan: Community Ecology Package; R Package Version, 2.0-2; The R Foundation: Vienna, Austria, 2011. [Google Scholar]
- Raudenbush, S.W. HLM 6: Hierarchical Linear and Nonlinear Modeling; Scientific Software International: Chicago, IL, USA, 2004. [Google Scholar]
- Woltman, H.; Feldstain, A.; MacKay, J.C.; Rocchi, M. An introduction to hierarchical linear modeling. Tutor. Quant. Methods Psychol. 2012, 8, 52–69. [Google Scholar] [CrossRef]
- Gotelli, N.J.; Colwell, R.K. Quantifying biodiversity: Procedures and pitfalls in the measurement and comparison of species richness. Ecol. Lett. 2001, 4, 379–391. [Google Scholar] [CrossRef]
- Team, R.C. R: A Language and Environment for Statistical Computing; The R Foundation: Vienna, Austria, 2015. [Google Scholar]
- Qian, H.; Guo, Q. Linking biotic homogenization to habitat type, invasiveness and growth form of naturalized alien plants in North America. Divers. Distrib. 2010, 16, 119–125. [Google Scholar] [CrossRef]
- Lososová, Z.; Chytrý, M.; Tichý, L.; Danihelka, J.; Fajmon, K.; Hájek, O.; Kintrová, K.; Láníková, D.; Otýpková, Z.; Řehořek, V. Biotic homogenization of Central European urban floras depends on residence time of alien species and habitat types. Biol. Conserv. 2012, 145, 179–184. [Google Scholar] [CrossRef]
- Williams, N.S.; Schwartz, M.W.; Vesk, P.A.; McCarthy, M.A.; Hahs, A.K.; Clemants, S.E.; Corlett, R.T.; Duncan, R.P.; Norton, B.A.; Thompson, K.; et al. A conceptual framework for predicting the effects of urban environments on floras. J. Ecol. 2009, 97, 4–9. [Google Scholar] [CrossRef]
- Schindler, S.; von Wehrden, H.; Poirazidis, K.; Wrbka, T.; Kati, V. Multiscale performance of landscape metrics as indicators of species richness of plants, insects and vertebrates. Ecol. Indic. 2013, 31, 41–48. [Google Scholar] [CrossRef]
- Li, W.; Ouyang, Z.; Meng, X.; Wang, X. Plant species composition in relation to green cover configuration and function of urban parks in Beijing, China. Ecol. Res. 2006, 21, 221–237. [Google Scholar] [CrossRef]
- Clarke, L.W.; Li, L.; Jenerette, G.D.; Yu, Z. Drivers of plant biodiversity and ecosystem service production in home gardens across the Beijing Municipality of China. Urban Ecosyst. 2014, 17, 741–760. [Google Scholar] [CrossRef]
- Szlavecz, K.; Warren, P.; Pickett, S. Biodiversity on the Urban Landscape Human Population; Springer: Berlin, Germany, 2011; pp. 75–101. [Google Scholar]
- Beninde, J.; Veith, M.; Hochkirch, A. Biodiversity in cities needs space: A meta-analysis of factors determining intra-urban biodiversity variation. Ecol. Lett. 2015, 18, 581–592. [Google Scholar] [CrossRef] [PubMed]
- Lindgren, J.P.; Cousins, S.A. Island biogeography theory outweighs habitat amount hypothesis in predicting plant species richness in small grassland remnants. Landsc. Ecol. 2017, 32, 1895–1906. [Google Scholar] [CrossRef]
- Hobbs, E.R. Species richness of urban forest patches and implications for urban landscape diversity. Landsc. Ecol. 1988, 1, 141–152. [Google Scholar] [CrossRef]
- Malkinson, D.; Kopel, D.; Wittenberg, L. From rural-urban gradients to patch–matrix frameworks: Plant diversity patterns in urban landscapes. Landsc. Urban Plan. 2018, 169, 260–268. [Google Scholar] [CrossRef]
- Honnay, O.; Endels, P.; Vereecken, H.; Hermy, M. The role of patch area and habitat diversity in explaining native plant species richness in disturbed suburban forest patches in northern Belgium. Divers. Distrib. 1999, 5, 129–141. [Google Scholar] [CrossRef]
- Angold, P.G.; Sadler, J.P.; Hill, M.O.; Pullin, A.; Rushton, S.; Austin, K.; Small, E.; Wood, B.; Wadsworth, R.; Sanderson, R.; et al. Biodiversity in urban habitat patches. Sci. Total Environ. 2006, 360, 196–204. [Google Scholar] [CrossRef]
- Wilson, E.O.; MacArthur, R.H. The Theory of Island Biogeography; Princeton University Press: Princeton, NJ, USA, 1967. [Google Scholar]
- Brice, M.H.; Pellerin, S.; Poulin, M. Environmental filtering and spatial processes in urban riparian forests. J. Veg. Sci. 2016, 27, 1023–1035. [Google Scholar] [CrossRef]
- Lang, J.D.; Liu, Y.H.; Meng, F.G. Study on Plant Composition and Species Diversity of Residential Greenbelt in Beijing City. Forest Inventory Plan. 2007, 32, 17–21, (In Chinese, with English abstract). [Google Scholar]
- Martin, C.A.; Warren, P.S.; Kinzig, A.P. Neighborhood socioeconomic status is a useful predictor of perennial landscape vegetation in residential neighborhoods and embedded small parks of Phoenix, AZ. Landsc. Urban Plan. 2004, 69, 355–368. [Google Scholar] [CrossRef]
- Turner, K.; Lefler, L.; Freedman, B. Plant communities of selected urbanized areas of Halifax, Nova Scotia, Canada. Landsc. Urban Plan. 2005, 71, 191–206. [Google Scholar] [CrossRef]
- Avolio, M.; Pataki, D.E.; Gillespie, T.; Jenerette, G.D.; McCarthy, H.R.; Pincetl, S.; Weller-Clarke, L. Tree diversity in southern California’s urban forest: The interacting roles of social and environmental variables. Front. Ecol. Evol. 2015, 3, 73. [Google Scholar] [CrossRef]
- Magnussen, S.; Smith, B.; Uribe, A.S. National Forest Inventories in North America for monitoring forest tree species diversity. Plant Biosyst. 2007, 141, 113–122. [Google Scholar] [CrossRef]


| Neighborhood [a] | Distance from City Center (km) | Area (ha) [b] | Green Land (ha) [b] | House Price (103 Yuan/m2) [c] | House Age (year) [c] |
|---|---|---|---|---|---|
| Chunshuyuan (I) | 2.15 | 6.61 | 1.80 | 115.49 | 19 |
| Xiaohongmiao (II) | 5.73 | 3.29 | 1.25 | 90.55 | 38 |
| Jindianhuayuan (III) | 5.82 | 3.53 | 0.97 | 95.99 | 18 |
| Jiayuanerli (IV) | 7.01 | 22.11 | 7.93 | 56.03 | 24 |
| Anzhenxili (V) | 7.46 | 11.25 | 3.74 | 89.30 | 33 |
| Songyudongli (VI) | 7.96 | 13.83 | 4.02 | 62.58 | 26 |
| Dongwangzhuang (VII) | 11.02 | 15.39 | 6.04 | 76.93 | 20 |
| Huizhongbeili (VIII) | 11.11 | 9.90 | 4.26 | 69.69 | 20 |
| Lincuixili (IX) | 11.81 | 6.25 | 1.74 | 74.89 | 14 |
| Delinyuan (X) | 12.11 | 9.90 | 5.01 | 48.94 | 17 |
| Nantingxinyuan (XI) | 12.20 | 8.11 | 1.59 | 42.78 | 7 |
| Ruihaijiayuan (XII) | 15.02 | 11.25 | 3.74 | 41.90 | 17 |
| Scale | Index | Tree | Shrub | Herb |
|---|---|---|---|---|
| Within neighborhoods | Species number | 6.11 ± 3.61 | 3.84 ± 1.96 | 8.00 ± 3.13 |
| Gleason index | 0.95 ± 0.50 | 0.60 ± 0.27 | 1.27 ± 0.47 | |
| Shannon index | 1.35 ± 0.67 | 0.95 ± 0.51 | 1.32 ± 0.47 | |
| Between neighborhoods | Species number | 30.50 ± 4.10 | 18.80 ± 5.00 | 31.90 ± 10.70 |
| Gleason index | 3.33 ± 0.42 | 2.07 ± 0.58 | 3.47 ± 1.13 | |
| Shannon index | 2.83 ± 0.18 | 2.20 ± 0.29 | 2.58 ± 0.88 |
| Plants | Diversity Indices | χ2 | p-Value | Percentage of Variations in Diversity Indices (%) | |
|---|---|---|---|---|---|
| within Neighborhoods | between Neighborhoods | ||||
| Trees | Species richness | 12.23 | >0.05 | 99.94 | 0.06 |
| Gleason index | 10.26 | >0.05 | 99.98 | 0.02 | |
| Shannon index | 10.38 | >0.05 | 99.94 | 0.06 | |
| Shrubs | Species richness | 61.77 | <0.01 | 60.87 | 39.13 |
| Gleason index | 76.74 | <0.01 | 54.34 | 45.66 | |
| Shannon index | 29.74 | <0.01 | 81.20 | 18.80 | |
| Herbs | Species richness | 39.68 | <0.01 | 72.83 | 27.17 |
| Gleason index | 44.54 | <0.01 | 69.41 | 30.59 | |
| Shannon index | 78.17 | <0.01 | 52.33 | 47.67 | |
Publisher’s Note: MDPI stays neutral with regard to jurisdictional claims in published maps and institutional affiliations. |
© 2021 by the authors. Licensee MDPI, Basel, Switzerland. This article is an open access article distributed under the terms and conditions of the Creative Commons Attribution (CC BY) license (https://creativecommons.org/licenses/by/4.0/).
Share and Cite
Su, Y.; Gong, C.; Cui, B.; Guo, P.; Ouyang, Z.; Wang, X. Spatial Heterogeneity of Plant Diversity within and between Neighborhoods and Its Implications for a Plant Diversity Survey in Urban Areas. Forests 2021, 12, 416. https://doi.org/10.3390/f12040416
Su Y, Gong C, Cui B, Guo P, Ouyang Z, Wang X. Spatial Heterogeneity of Plant Diversity within and between Neighborhoods and Its Implications for a Plant Diversity Survey in Urban Areas. Forests. 2021; 12(4):416. https://doi.org/10.3390/f12040416
Chicago/Turabian StyleSu, Yuebo, Cheng Gong, Bowen Cui, Peipei Guo, Zhiyun Ouyang, and Xiaoke Wang. 2021. "Spatial Heterogeneity of Plant Diversity within and between Neighborhoods and Its Implications for a Plant Diversity Survey in Urban Areas" Forests 12, no. 4: 416. https://doi.org/10.3390/f12040416
APA StyleSu, Y., Gong, C., Cui, B., Guo, P., Ouyang, Z., & Wang, X. (2021). Spatial Heterogeneity of Plant Diversity within and between Neighborhoods and Its Implications for a Plant Diversity Survey in Urban Areas. Forests, 12(4), 416. https://doi.org/10.3390/f12040416