Article

The Effect of Nitrogen Fertilization on Tree Growth, Soil Organic Carbon and Nitrogen Leaching—A Modeling Study in a Steep Nitrogen Deposition Gradient in Sweden

1
Department of Physical Geography and Ecosystem Science, Lund University, Sölvegatan 12, SE-223 62 Lund, Sweden
2
Department of Physical Geography, Stockholm University, Svante Arrhenius väg 8, SE-114 18 Stockholm, Sweden
*
Author to whom correspondence should be addressed.
Forests 2021, 12(3), 298; https://doi.org/10.3390/f12030298
Submission received: 15 January 2021 / Revised: 27 February 2021 / Accepted: 1 March 2021 / Published: 5 March 2021
(This article belongs to the Section Forest Ecology and Management)

Abstract

:
Nitrogen (N) fertilization in forests has the potential to increase tree growth and carbon (C) sequestration, but it also means a risk of N leaching. Dynamic models can, if the important processes are well described, play an important role in assessing benefits and risks of nitrogen fertilization. The aim of this study was to test if the ForSAFE model is able to simulate correctly the effects of N fertilization when considering different levels of N availability in the forest. The model was applied for three sites in Sweden, representing low, medium and high nitrogen deposition. Simulations were performed for scenarios with and without fertilization. The effect of N fertilization on tree growth was largest at the low deposition site, whereas the effect on N leaching was more pronounced at the high deposition site. For soil organic carbon (SOC) the effects were generally small, but in the second forest rotation SOC was slightly higher after fertilization, especially at the low deposition site. The ForSAFE simulations largely confirm the N saturation theory which state that N will not be retained in the forest when the ecosystem is N saturated, and we conclude that the model can be a useful tool in assessing effects of N fertilization.

1. Introduction

Sweden has committed to progressively reduce its net greenhouse gas emissions to zero, and achieve carbon neutrality by 2045 [1]. In order to reach this goal, the share of renewable energy, including bioenergy, will have to increase, leading to an increased pressure on forests to supply more biomass for bioenergy [2]. Nitrogen (N) fertilization in forests became a common growth-enhancing method in the mid-1960s, peaking in the mid-1970s and thereafter declining to a relatively low level in the 1990–2000s for environmental reasons, after which it started to increase again [3]. The commitments to mitigate climate change has put N fertilization higher up on the agenda again, since increased forest growth due to fertilization can enhance bioenergy production, and simultaneously have a positive effect on carbon (C) sequestration in biomass and soil [4,5]. However, the effect of N addition on biomass growth and C sequestration depends on the N status of the ecosystems, i.e., if the ecosystem is capable of retaining N or if it is N saturated [6,7,8]. Moreover, the N that is not retained will be leached, and can potentially contribute to eutrophication and acidification of aquatic ecosystems and deterioration of ground water quality [9].
Forests in Sweden are generally N limited and capable of retaining N in the soil [10]. However, there is an N deposition gradient across Sweden, ranging from 20 kg per hectare and year in the South to less than 2 kg per hectare a year in the North [11]. In Southwestern Sweden, where N deposition has been elevated in recent decades, signs of N saturation have been detected and leaching occurs even from undisturbed growing forests [12]. Furthermore, a study of N leaching after final felling in Sweden showed that the N leaching, which naturally occurs after disturbances such as final fellings, is higher in the areas with highest N deposition [13]. Based on these results, the current recommendations about N fertilization vary between northern, central and southern Sweden [14,15]. In Southwestern Sweden it is recommended to avoid N fertilization in forests. However, a recent investigation suggested a change of the recommendations to allow N fertilization in all Swedish forests, in order to increase forest growth and biomass production [16]. Although this suggestion was not approved by the Swedish Forest Agency, there is still an ongoing debate, both among scientists and policy makers, on benefits and risks related to forest fertilization.
There are many experimental studies on the effect of N fertilization on tree growth, with varying fertilization composition, dose and frequency. Many of them show increased growth after fertilization [17,18,19,20,21], but some fertile spruce sites in southern Sweden show no fertilization effects on forest growth [22,23]. Effects of N fertilization on soil organic carbon (SOC) have been reviewed by [4], who concluded that SOC increases after fertilization on nutrient-poor sites, due to the increase of primary productivity. Potential N leaching to surface waters has been indicated by substantially elevated concentrations of N in soil solution [24,25] and in surface water [26] during the first few years after treatment. Fertilization has been proposed to increase N leaching also after final felling [27], but different responses have been reported from experiments: higher [28,29], lower [30] and unaltered [31,32,33] N concentrations in soil solution in the fertilized sites compared to the control plots.
The differences in N concentration response, as well as differences in tree growth and SOC response in fertilized sites, can be attributed to differences in site fertility, ground vegetation cover, fertilization regimes and harvest intensity. Few experiments, in combination with those differences, make it more difficult to draw general conclusions based on geographical location and site conditions or to scale up the results to a regional and national level. Dynamic modeling has the potential to simulate the effects of N fertilization at different sites, by considering different N fertilization schemes and the effects of climate change. As a consequence, dynamic modeling can complement existing experiments and contribute to increased process knowledge related to N effects on forest ecosystems. Based on this integration, it is possible to evaluate opportunities and risks with N fertilization in areas with different N status, as a basis for management recommendations.
This study aims to test if three basic tenets of the nitrogen saturation theory [6,7,8] can be reproduced by the forest ecosystem model ForSAFE, and if so to describe the process interactions behind ecosystem response to N fertilization:
  • N fertilization gives no or little increase in tree growth at sites with high historical N deposition while it increases tree growth at sites with low N deposition
  • N fertilization gives no or little increase in SOC at sites with high historical N deposition while it increases SOC at sites with low N deposition,
  • N fertilization increases N leaching with largest effects at sites with historically high N deposition.
The evaluation is an important test before the model can be used on a larger scale.

2. Materials and Methods

In this study, the dynamic ecosystem model ForSAFE [34,35] was used to simulate the effects of N fertilization on tree biomass, SOC in the organic layer and N leaching on three managed forest sites, during a time span from the first fertilization event, i.e., about 30 years before the following final felling, to 20 years after the final felling. The sites are part of the long-term monitoring network SWETHRO [36], and represent different deposition and climate conditions in Sweden (Figure 1).

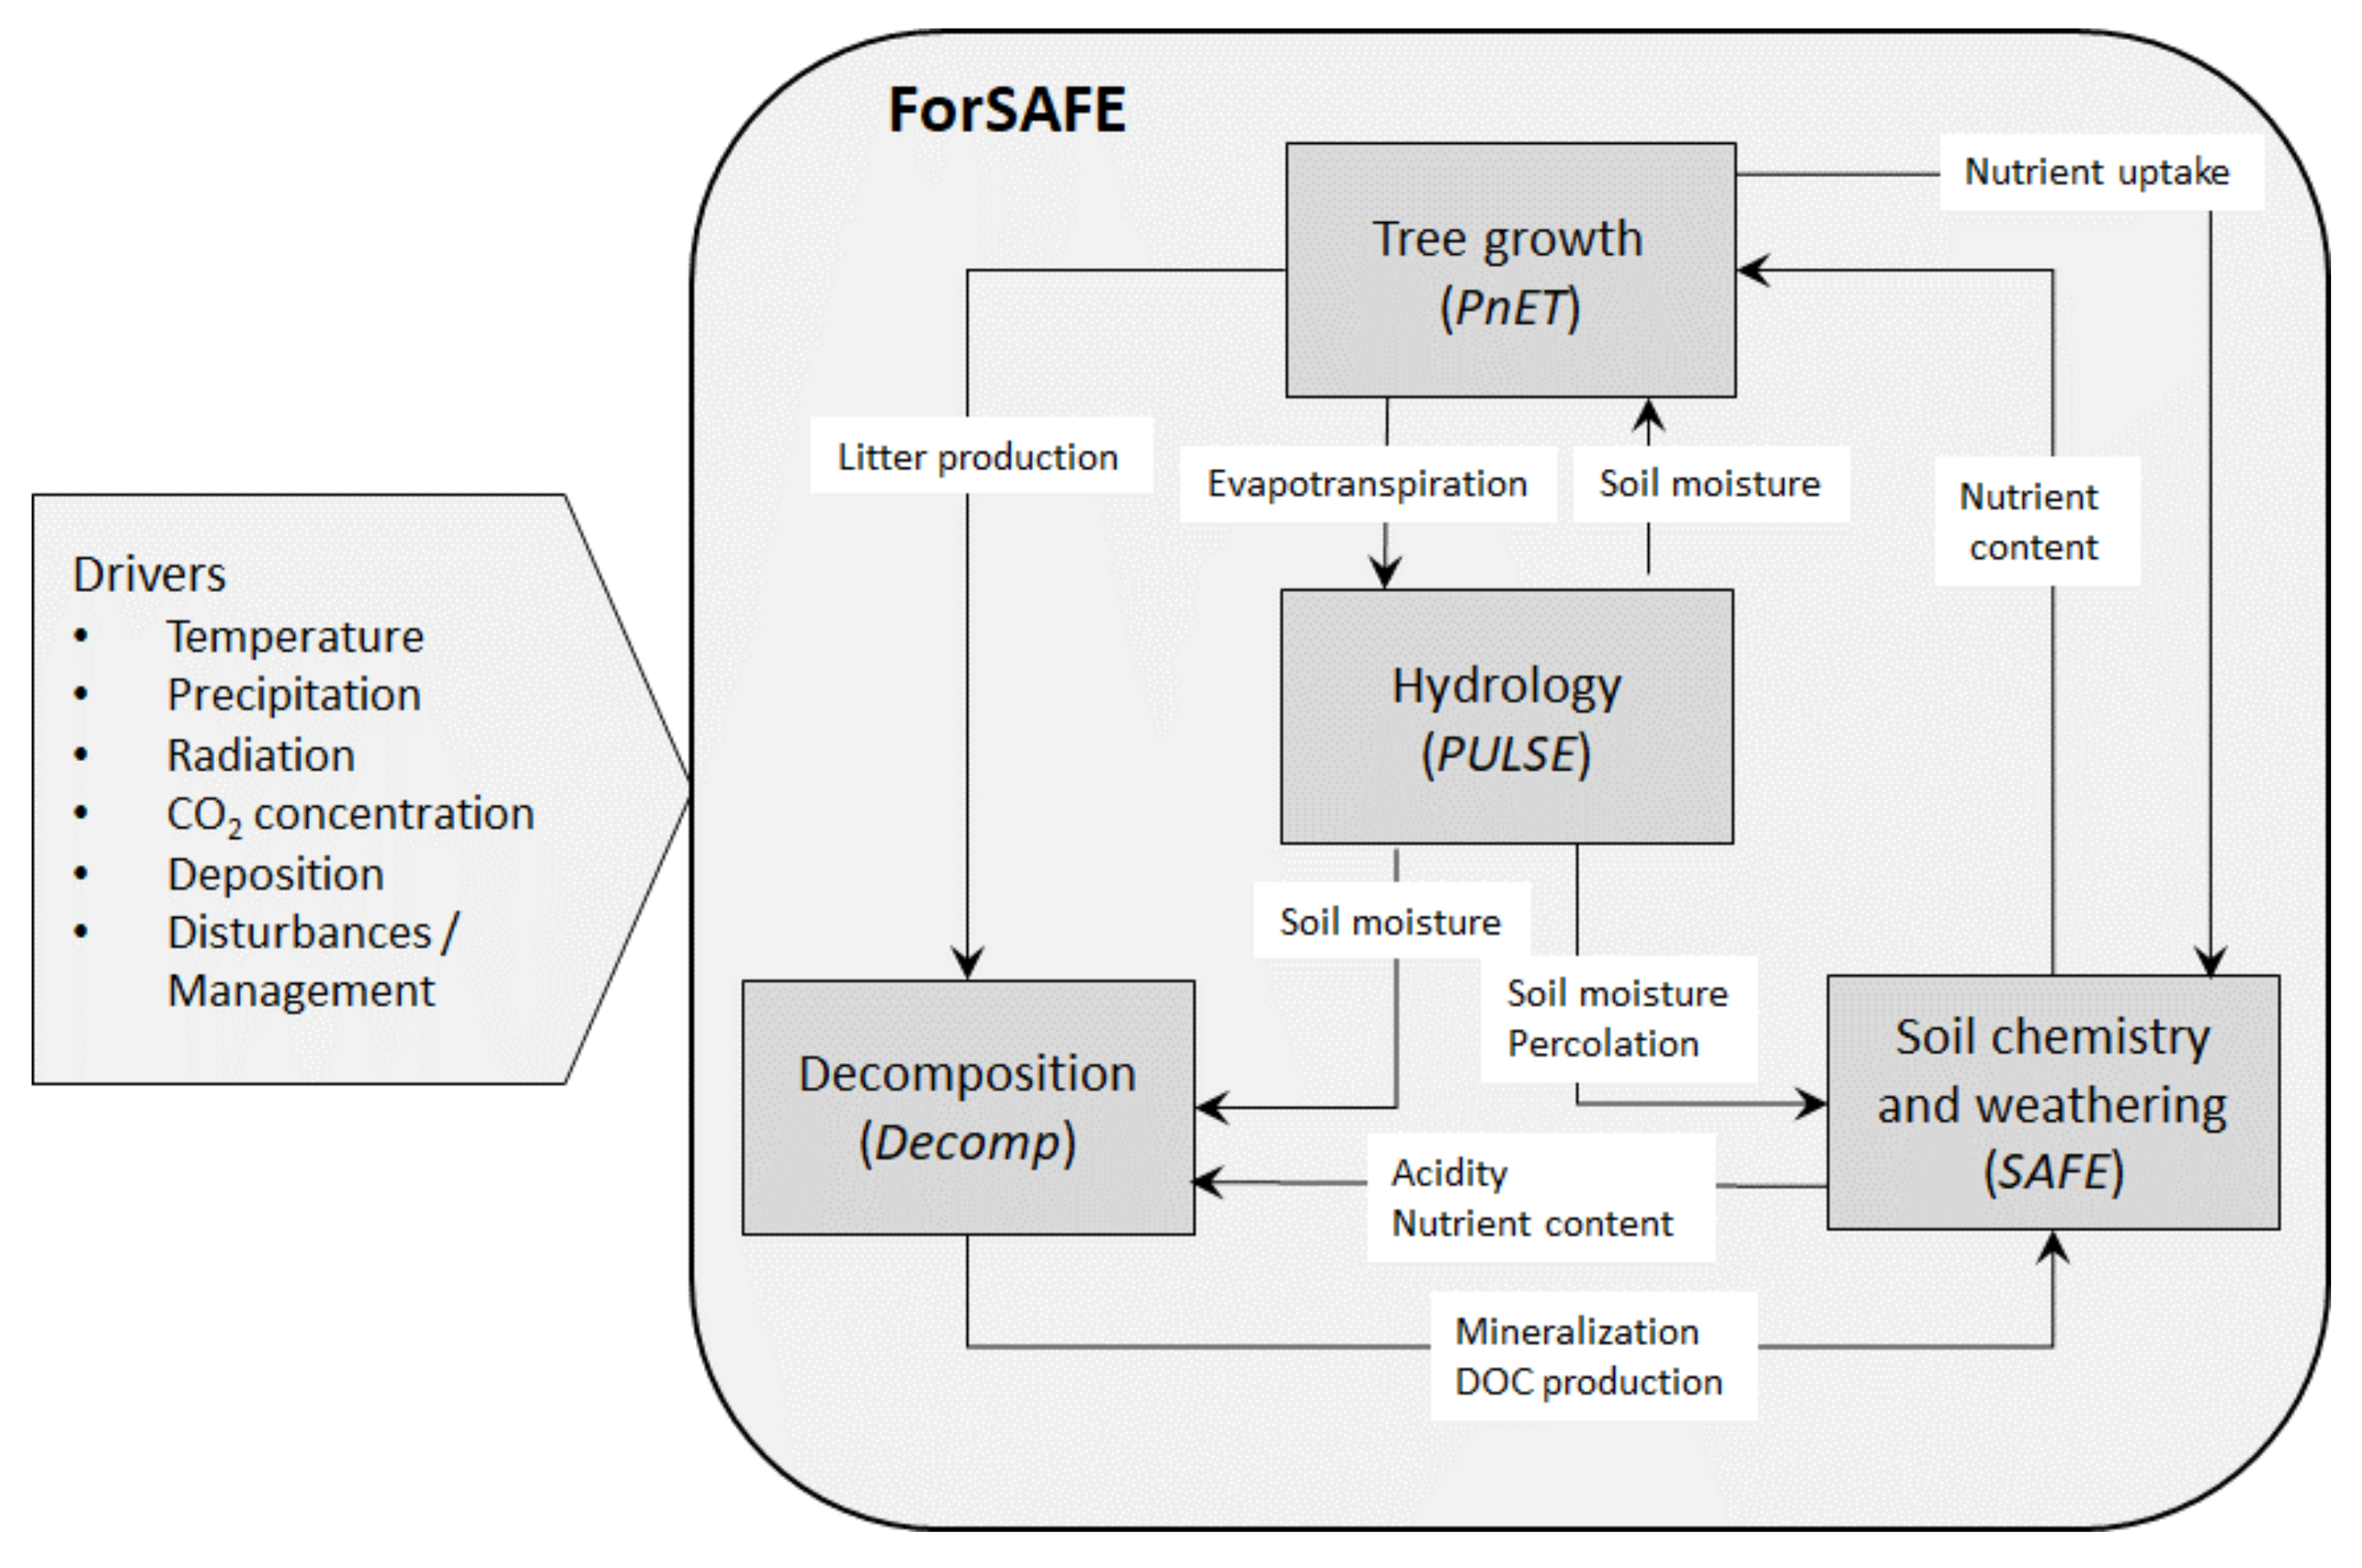
2.1. The ForSAFE Model
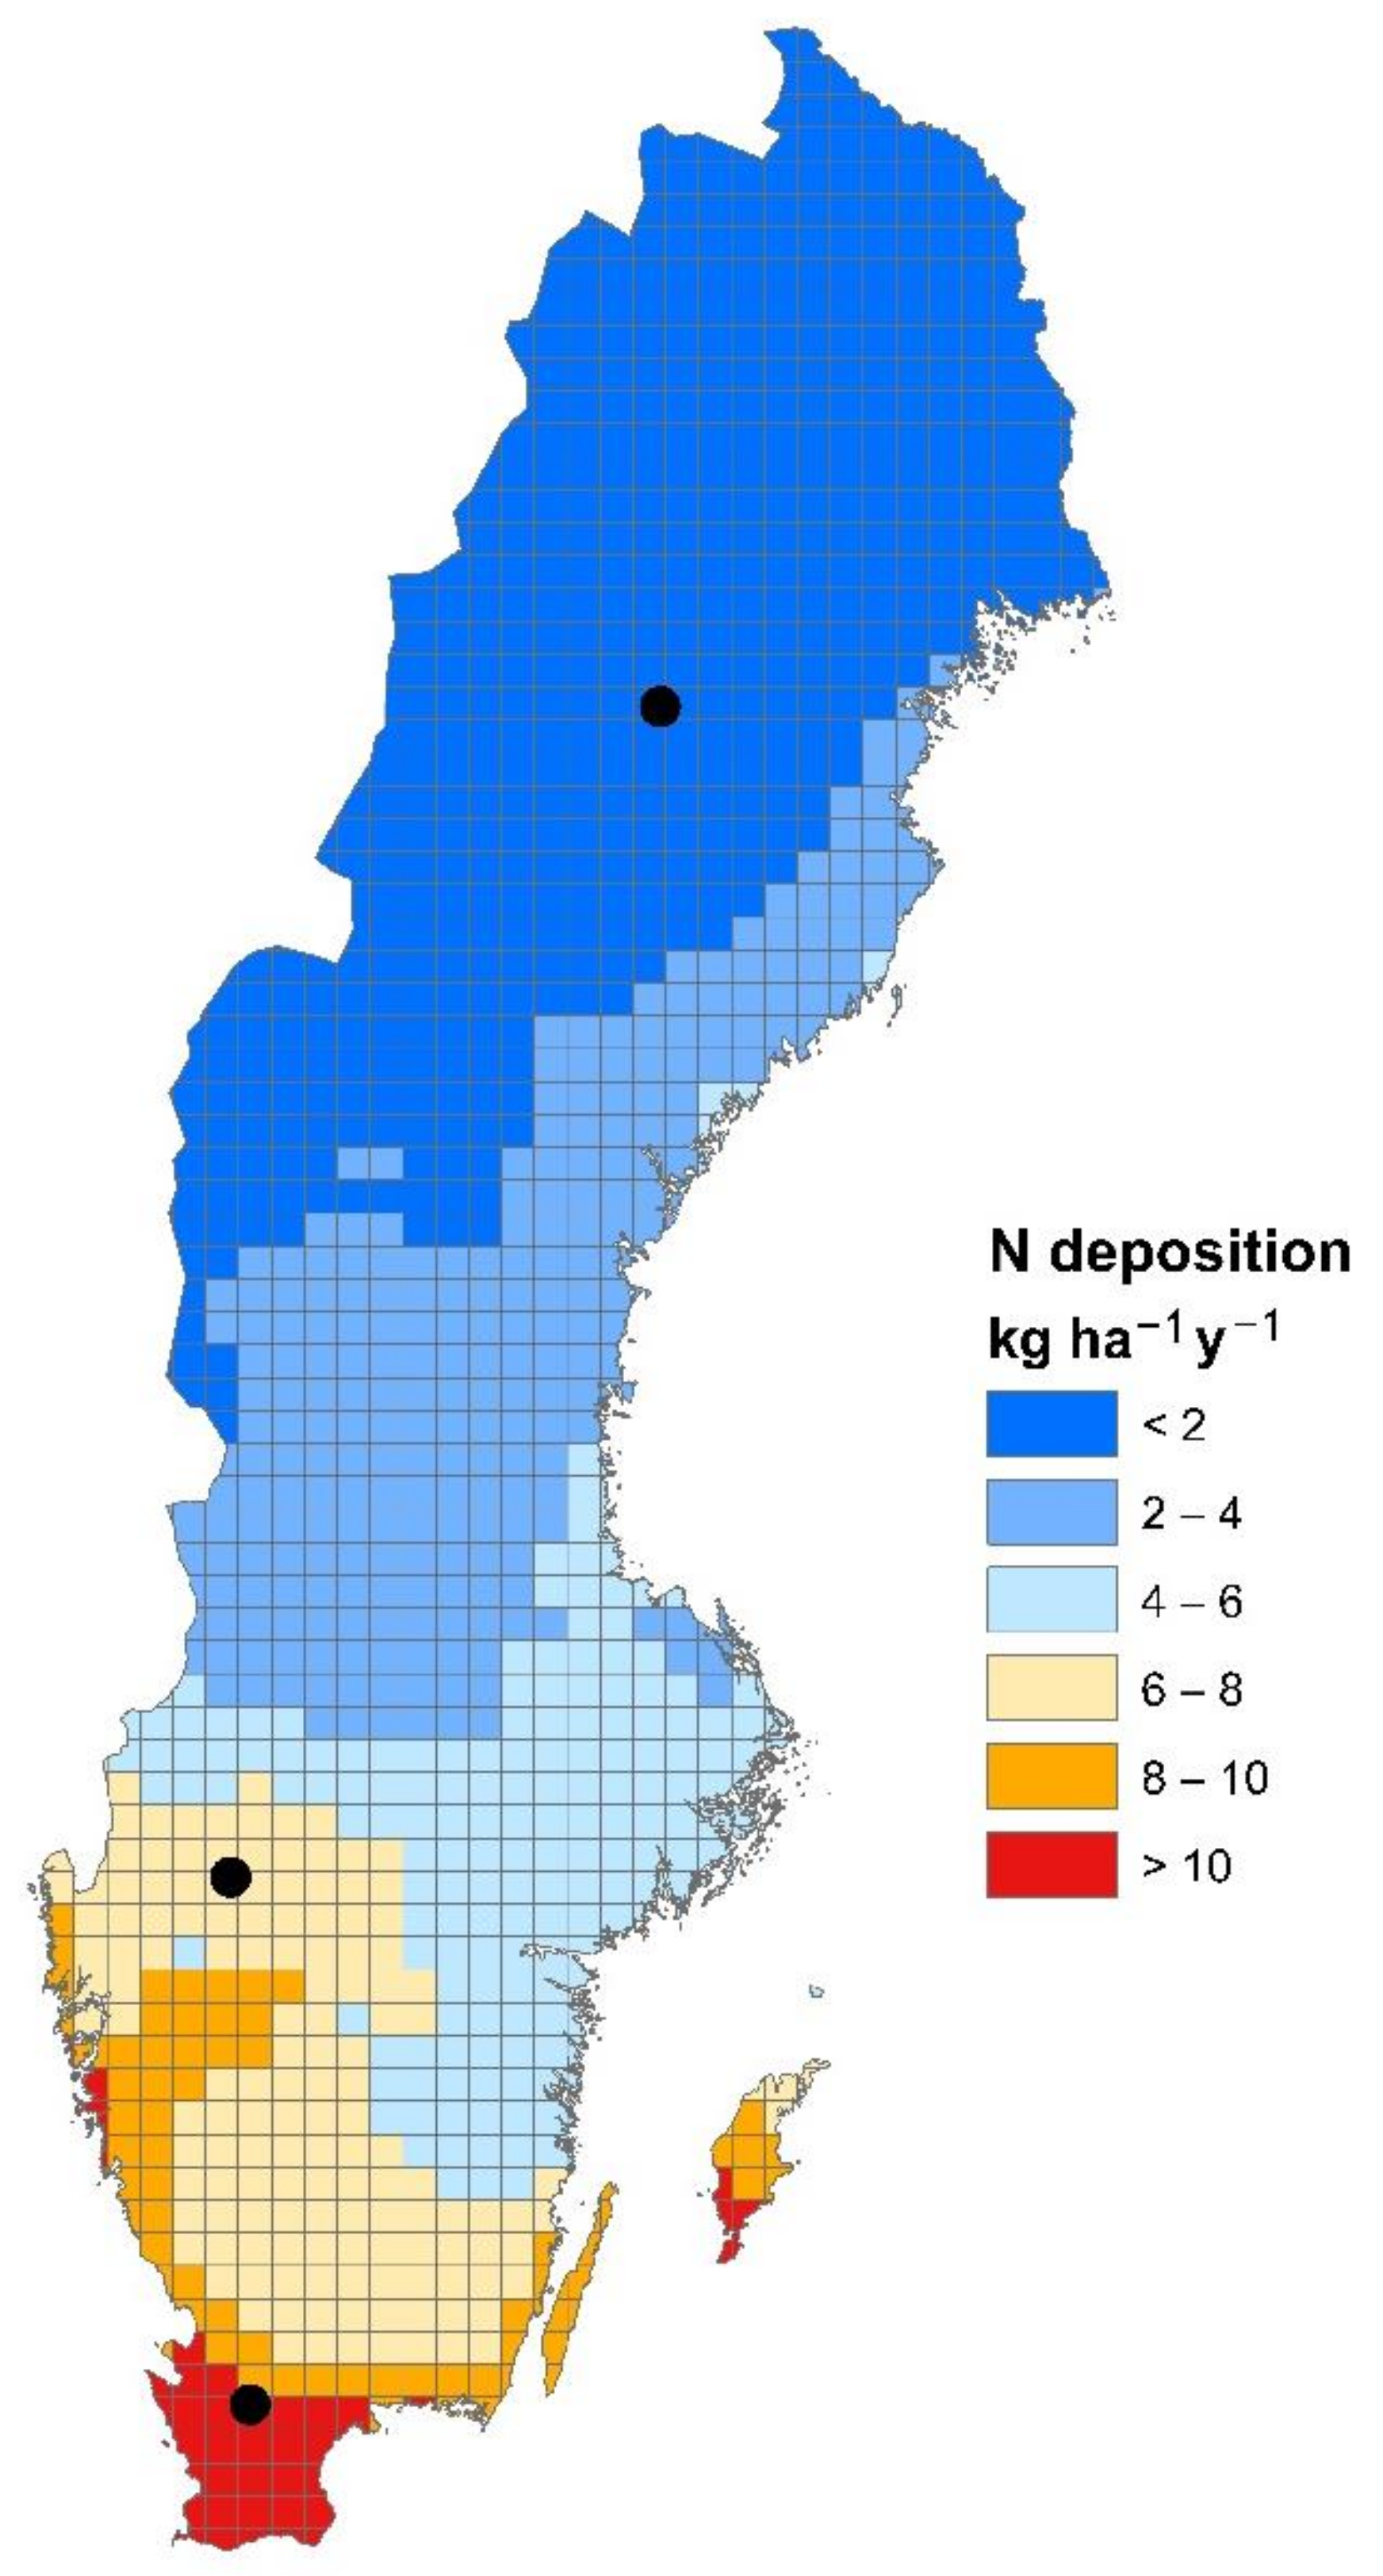
ForSAFE is a mechanistic biogeochemical model designed to simulate the dynamic responses of forest ecosystems to environmental change [34,35]. The modeled processes are represented by three interacting cycles: the biological cycle including the processes regulating tree growth, the biochemical cycle representing the processes regulating uptake, decomposition and soil nutrient dynamics and the geochemical cycle including atmospheric deposition and weathering processes. ForSAFE is built on four established models: the soil chemistry model SAFE [38], the tree growth model PnET [39], the decomposition model Decomp [40,41], and the hydrology model PULSE [42]. ForSAFE is entirely integrated, not consisting of models in sequence, with stepwise processes within each of the model’s time steps. The interconnection between these models allows the simulation of feedbacks between the biogeochemical processes represented in the model (Figure 2). To deal with error propagation within the model, a mass balance check routine is called after each major process (such as soil solution chemical exchange, tree allocation, soil hydrology, or soil organic matter decomposition). This routine does not allow the model to proceed if it detects an error higher than 10−15 in any of the elements simulated. Errors induced by model inputs will always appear in model outputs, therefore great care is taken checking the quality of the input data. The inputs are never modified based on a comparison of model output and observations. Concerning model output diversion from observations, the model does not readjust any process rates based on discrepancy with observations. This is because of the conceptual principle we use of not calibrating the model, but instead focusing on revising the process descriptions.
In this study ForSAFE was applied with a daily time-step [43]. The daily version of ForSAFE includes a new hydrology module simulating water flows at higher time resolution. It has shown to generate higher soil water content than the monthly version [44], which in turns leads to a substantial increase in the decomposition of the soil organic matter. This effect is due to the increase of decomposition rates in ForSAFE with soil water content according to an S-shaped function [41]. However, the parameters regulating the decomposition rates were determined based on low soil moisture conditions, over a range of 0–50% of field capacity [40]. Therefore, some additional adjustments were made in this study to better reflect the change of decomposition rates at higher soil water content. To avoid excessive decomposition rates at soil water contents above 50% of field capacity, we corrected the parameters regulating the maximum decomposition rates at optimum conditions (kpot, Table 1). This correction was done by assuming that the soil moisture conditions in experimental data [40] were relative to field saturation rather than to field capacity. In addition, the kpot and the activation energy (Ea) regulating the decomposition rate of DOC were modified by assuming that DOC is not only composed by recalcitrant material but by a mixture of all the organic pools.

2.2. Study Sites

The three study sites are Högbränna in Northern Sweden (hereafter referred to as “Northern Site”), Södra Averstad in Midwest Sweden (“Central Site”) and Västra Torup in Southern Sweden (“Southern Site”) (Figure 1; Table 2). The sites are part of the environmental monitoring program Swedish Throughfall Monitoring Network (SWETHRO) [36]. In the program, atmospheric deposition and soil water chemistry has been measured at over 60 managed forest sites all over Sweden for up to 34 years. The sites are 30 × 30 m squared plots located in forest stands. Throughfall deposition is measured every month, and soil water chemistry is measured three times per year with lysimeters at a depth of 50 cm. For many of the sites, deposition measurements are also conducted on an open field nearby.
The Northern site represents the boreal zone, with an N deposition close to background levels. The site is situated in a Norway spruce stand on a ferric podzolic till soil. The Central site is in the boreo-nemoral zone. It is located near the coast of lake Vänern and is therefore exposed to air pollutants coming in with the southwest winds. The measurements are done in a Norway spruce stand on a brown podzolic till soil. The Southern site is located in the nemoral zone and is the site with the highest historical and present N deposition (Figure 1; Table 2). The site is situated in a managed, Norway spruce dominated forest, on a brown podzolic soil. The topography of the site is flat, except for a hillock on the south boarder.

2.3. Input Data

ForSAFE requires time series of climate variables, atmospheric deposition and forest management practices, as well as data on soil properties and information about the dominant tree species. In this study, a time period of about 200 years was modeled (1900–2115 for the Central site and 1900–2100 for the other sites).

2.3.1. Climate

Data series on temperature (average, maximum and minimum), precipitation and photosynthetically active radiation (PAR) are required on a daily time scale for the period 1900–2100. Temperature and precipitation for the period 1961–2100 originates from the regional climate model RCA3 [46], based on the global climate model ECHAM5-r3 [47] simulated with emission scenario A1B [48]. For daily mean temperature and precipitation, bias-corrected data was used, based on distribution-based scaling [49] towards climatic observations [50] from nearby SMHI weather stations. Daily minimum and maximum temperatures were obtained from uncorrected climate data which were bias corrected on measured climate data at the SMHI stations for the period 1981–2010. The bias correction was based on an algorithm [51] that ensures that in the historical period, the mean distance between the maximum/minimum daily temperature value and the daily average temperature is preserved. For the period 1900–1960 there are no regionally modeled temperature and precipitation data. Thus, data for a random year of the period 1961–1970 was used to generate climate driving data for each year in the period 1900–1960, assuming that the temperature and precipitation was on the same level during 1900–1960 as during 1961–1970.
Data for the period 1900–2100 on photosynthetically active radiation (PAR) were obtained from monthly data from the NCEP/NCAR Reanalysis global solar radiation and calibrated using the SMHI STRÅNG model [52].

2.3.2. Atmospheric Deposition and Nitrogen Fixation

Atmospheric yearly deposition of sulphate (SO42−), nitrate (NO3) and ammonium (NH4+) for the period 1900–2100 was obtained from a simulation with the MATCH atmospheric dispersion model [53,54]. In the MATCH simulation, air pollutant emissions according to the CLEO Eurobase scenario [55] were used for the period 1961–2100, while emissions from the ECLAIRE project [56] were used for the period 1900–1960. Climatic drivers for MATCH were produced with the ECHAM5-r3 model for the period 1960–2100 (see above). The RCA3 meteorological output from a random year of the period 1960–1969 was the climatic driving input to MATCH for each simulated year of the period 1900–1960. Modeled deposition was replaced with deposition data measured at the study sites (as they are part of the SWETHRO network), when available (see Section 2.2 for more information). Measurements of precipitation chemistry from the SWETHRO network were used to estimate the average deposition of chloride (Cl) and base cations (Ca2+, K+, Mg2+, Na+) which were assumed constant over the simulation period (1900–2100). Details on how the deposition time series were created can be found in an earlier modeling study [57].
In high latitude systems where N deposition is low, biological N fixation (bryophyte-cyanobacteria associations) is often the dominant source of N input, and rates up to 7 kg N ha−1 year−1 in boreal forest have been observed in studies presented in a review [58]. Since biological fixation is not a dynamic process in the current version of ForSAFE, 2 kg N/ha/year was added in the Northern site to simulate biological N fixation.

2.3.3. Soil Data

Soil samples were obtained from five soil layers (organic layer plus the upper 50 cm of the mineral soil) of a soil pit in each site in 2010 (Southern and Central site) and 2011 (Northern site), and analyzed with regards to total elemental content, exchangeable soil chemistry, soil texture and density, more thoroughly described in [59,60]. In this version of ForSAFE, hydrological parameters (e.g., field capacity, wilting point) and mineral surface area are calculated in the model. Soil texture and density are required as inputs to ForSAFE, and total elemental content was used for calculating normative mineralogy [61], which is another required input to ForSAFE. Data on current base saturation were used to backcast the historical base saturation through an iterative procedure that changes the value at the beginning of the simulation period until the current modeled base saturation is in accordance with the measured values [62]. Soil input data are described in detail in Appendix A, Appendix B and Appendix C (Table A1, Table A2, Table A3, Table A4 and Table A5).

2.3.4. Tree Species and Management

ForSAFE requires information about tree species, along with historical data on time for planting, thinning and N fertilization. The tree species on all three sites in this study is Norway spruce. Model parameters for Norway spruce were obtained from previous studies [59,60,63]. For the majority of the parameters, there are no site-specific data, and the same parameter values were thus used for all three sites, as a deliberate effort to minimize site specific adjustments of model parameters. Only four of the parameters varied between the sites, with values determined by different conditions linked to climate properties at the site. Different foliage retention time was used at the sites to reflect the longer retention time at higher latitudes [64]. Fractional mortality of live wood was reduced in the Southern site compared to the original value [65], to better represent conditions in intensively managed forest sites [59]. The constant for calculating water use efficiency was set 50% higher than the original value [63], to match the forests ability to more efficiently make use of the available water at the Southern site. At the Southern site, the light half saturation level (HalfSat) was modified within a defined range [66], to better match observed canopy growth (Table 3).
In this study two management scenarios for every site were applied, one with fertilization (FERT) and one without (BAS). The same climate and deposition time series data and the same management strategies (except fertilization or not) were applied for both scenarios.
In the FERT scenario N was added three times in the future forest rotation, 150 kg/ha each time (Table 4). Time of fertilization application was chosen to end of May to coincide with growing season while avoiding snow cover. Fertilization was given to the model as dissolved N in incoming precipitation proportionally distributed over the following 30 days, to simulate the gradual dissolving of the granulates and gradually becoming available to the trees. The last N fertilization was applied 10 years before final felling. The timing of the events and amount of fertilizer added in the FERT scenario was based on the Swedish Forest Agency’s recommendations for optimal forest N fertilization in Northern Sweden [14,15].
The scenarios included thinning events and nitrogen fertilization before the last planned thinning. The forest management (past and present) of the sites in both scenarios was based on information on management history at the sites complemented with management recommendations on thinnings provided by the Swedish Forest Agency [67,68]. The same management activities were applied in the future scenario (Table 4). The modeled time period for the Central site was extended to year 2115 to include 20 years of simulation after final felling.

2.4. Model Initialization

The conditions at the sites at the beginning of the simulation period are determined through a period of initialization of the model [62]. The length of this period differed among sites, 150 years in the Southern and Central sites and 250 years in the Northern site. The different periods were chosen to reflect the historical conditions at the sites, given that forests in southern and central Sweden have been established more recently than in the North.

2.5. Statistical Metrics

To evaluate the ability of the model to depict biomass, SOC in the organic layer and N concentrations in the soil solution, we calculated the bias and the normalized average error (NAE) between modeled and measured data. For both indices, the sign denotes an over- or under-prediction of the model. The bias, or average error, is the average difference between simulated and measured data in absolute terms:
B i a s =   i = 1 N P i O i   N = P ¯ O ¯ ,
where Pi and Oi are the simulated and observed values and N the total number of data.
NAE represents the bias between the mean simulated and observed values, normalized against the observed mean value and expressed as a percentage:
N A E =   P ¯   O ¯   O ¯   ×   100 ,
where P ¯ and O ¯ are the mean simulated and observed values, respectively [69].
We also used the Nash–Sutcliffe Efficiency (NSE) index [70] to evaluate the agreement between simulated and measured N concentrations in the soil solution:
N S E = 1 i = 1 N P i O i 2 i = 1 N O i O ¯ 2 .

3. Results and Discussion

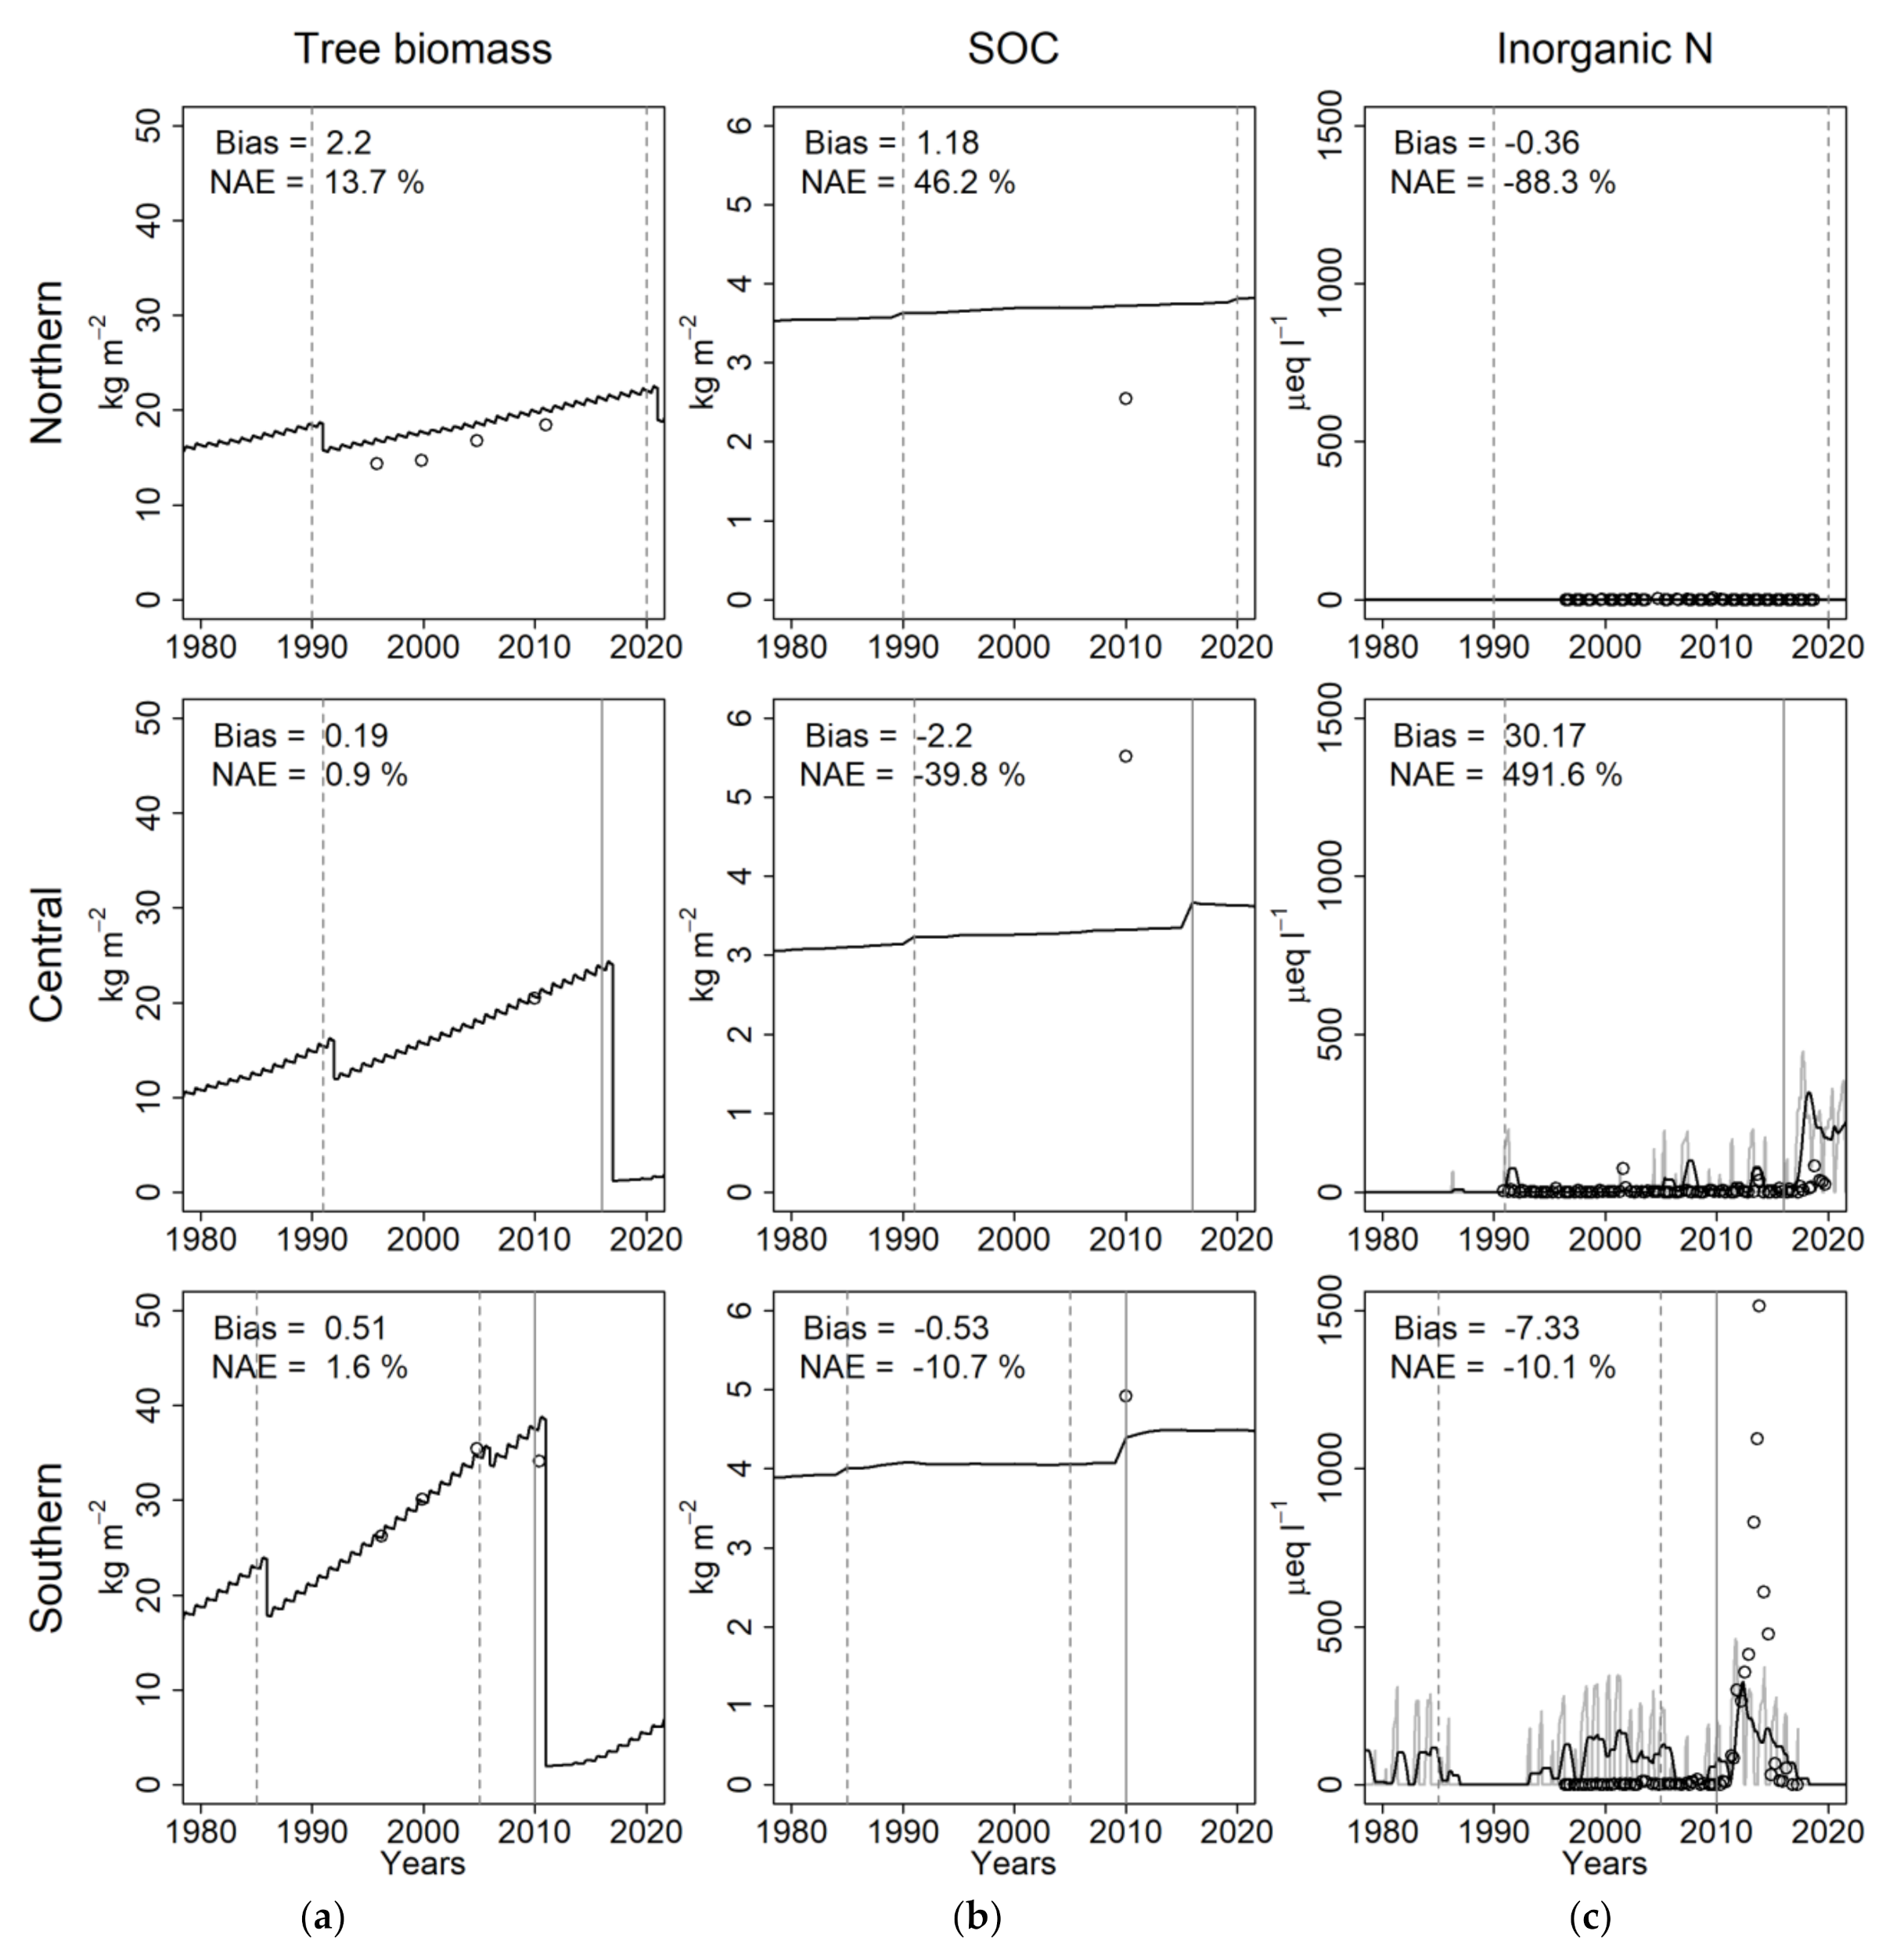
3.1. Model Evaluation

3.1.1. Tree Growth

There was generally good agreement between the modeled and measured tree biomass (Figure 3a). For the Northern site the modeled tree biomass was about 13% higher than the observed value, whereas the modeled and measured tree biomass were on average very similar at the Central site (NAE = +3.6%) and the Southern site (NAE = +4.3%). The model overestimated total biomass at the time for the last measurement at the Southern site after a storm event in 2005, which can be explained by an underestimation of the biomass removal in 2005.
The capability of the model to correctly estimate biomass accumulation was dependent on the application of different water use efficiency values at different sites (see Section 2.3.4). This highlights the importance of water availability as a controlling factor of forest growth and is worth noting given the increasing prominence of water limitation for growth of Swedish forests [71].

3.1.2. SOC

For SOC in the organic layer, the discrepancies between modeled and measured values were larger (Figure 3b). The modeled SOC was higher than the measured SOC at the Northern site (NAE = +48.1%), but lower at the Central site (NAE = −38.6%). At the Southern site, modeled SOC was in better agreement with the measured value (NAE = −11.6%). However, there are high uncertainties related to SOC measurements due to large local variation in SOC, according to a study by Schrumpf et al. [72]. In the study, which sampled SOC in several sites, average SOC in the organic layer in a boreal forest in central Sweden (Norunda) was 3267 (g m−2) with a standard deviation of 2005 (g m−2) (sample size = 100). Since SOC was only measured in one soil pit at each site in our study, a high degree of uncertainty in the measured value can be expected.
At the same time, simulated SOC could differ from measured values due to local soil moisture conditions. For instance, a survey at the Central site showed that the soil is often water saturated under longer periods and mesic-to-wet sites have been shown to be prone to sequester more carbon in the organic layer than mesic sites [73]. Another study based on nationwide random sampling showed that, on a regional scale, soil hydrological class had the strongest influence on SOC stocks in the O-horizon, which increased from on average 2.0 kg C m−2 at dry sites to 4.4 kg C m−2 slightly moist sites (Olsson et al., 2009). In the version of ForSAFE used in this study it is assumed that water can percolate without impediment through the soil profile. Under this assumption, soil water content is simulated correctly in well-drained soil (i.e., mesic sites) but could be underestimated at wet sites which are saturated under longer periods due to low soil conductivity.
The modeled SOC in the organic layer appeared not to be sensitive to climatic differences in different parts of Sweden. This result can be explained by the counteracting effects of temperature and water availability: while higher temperature can promote decomposition, low moisture decreases decomposition rates. Our results are in agreement with results from a survey from Swedish Forest Soil Inventory, showing no clear geographical gradient of SOC in the humus layer, unlike SOC in the whole soil profile showing a clearer gradient from south to north [74]. The simulated SOC was very stable over time, at all the sites, which was confirmed by the inventory data, showing no clear SOC change with stand age. The model results are also in agreement with other studies, where long-term soil monitoring at plot scale on undisturbed forests often showed insignificant changes in SOC over time or inconsistency in temporal and spatial trends [75,76,77].

3.1.3. N Leaching

For N leaching, both measurements and model simulations showed no or very little leaching before final felling at the Northern and Central sites (Figure 3c). However, at the Southern site there was a clear discrepancy (Bias = −7.33, NAE = −10.1%), with no or very small N leaching according to the measurements, but substantial N leaching according to the modeling. This discrepancy could prove that the site is N saturated or at least close to N saturation, which was also supported by two other observations. First, measured N concentrations after the final felling event were high, which indicates substantially enhanced N mineralization and nitrification typical for N rich sites [13]. Second, at a nearby SWETHRO site, Hissmossa, just 5 km north from the Southern site, nitrate leaches continuously in the growing forest, which is a clear sign of that the site is N saturated [78]. These two observations, along with the results from the modeling of the Southern site where the site leached nitrate also before final felling, leads to the conclusion that the Southern site was on the verge of becoming N saturated before the final felling 2016, although no elevated nitrate concentrations were measured.
The model was also able to reproduce the pattern of increased N leaching after final felling in both the Southern and Central site, although the effect was considerably underestimated at the Southern site and slightly overestimated at the Central site. The underestimation at the Southern site is possibly connected to the high mineralization rates that occur after clear felling on N saturated sites. Nitrification has been put forward as the likely reason for increased nitrate-N after final felling [33], but in the current version of the model, we do not model nitrification dynamically, and this is a plausible reason that we do not see as high peaks in nitrate concentrations as we see in the measurements.
At the Central site, there was a systematic underestimation of simulated N concentrations in the soil solution, as showed by the high Bias (30.17) and NAE (491.6%) values. In particular, the model produced a slightly higher N peak after final felling compared to measurements, showing low N concentrations. However data were available only for two years after the final felling in 2016, and earlier studies have shown that the peak of N leaching can appear 4–10 years after final felling [79], possibly due to a slower response of the nitrifier population in less N rich areas. This is not accounted for in the model, which could possibly explain the discrepancy between modeled and measured N concentrations after final felling in the Central site. Continued measurements of N concentrations will reveal if this is a likely explanation. Another explanation could be the absence of ground vegetation in the model. Ground vegetation plays an important role in reducing the risk of N leaching after final felling [31,80].
The statistical indicators showed a lower difference between simulated and measured data at the Southern site than at the Central site. However, this result is connected to an overestimate before final felling balancing a model underestimate after the final felling, rather than to a better agreement between data.
At the Northern site, there was a small overestimation of the simulated N concentration (Bias = −0.36, NAE = −88.3%). Both measurements and modeled concentrations after thinning were very low throughout the measuring period, with measured concentrations often under the quantification limit, i.e., the lowest concentration that can be quantitatively determined with acceptable precision. This leads to the conclusion that the Northern site should not be in the risk of leaching N under non-disturbed conditions.
The NSE index was less than zero at all sites, suggesting that the observed mean is a better predictor than the model and that the predictive skills of the model on N concentrations in the soil solution are very poor at all sites. This result is due to the fact that this index tends to show strong disagreement between model and measurements when the evaluated data are close to zero, even when the differences in absolute terms are very small. The evaluation through NSE does not reflect the capability of the model to simulate the lack of N leaching before clear-felling at the Northern and Central site and therefore it is not a proper index to evaluate the ability of the model to simulate full N retention in the soil.

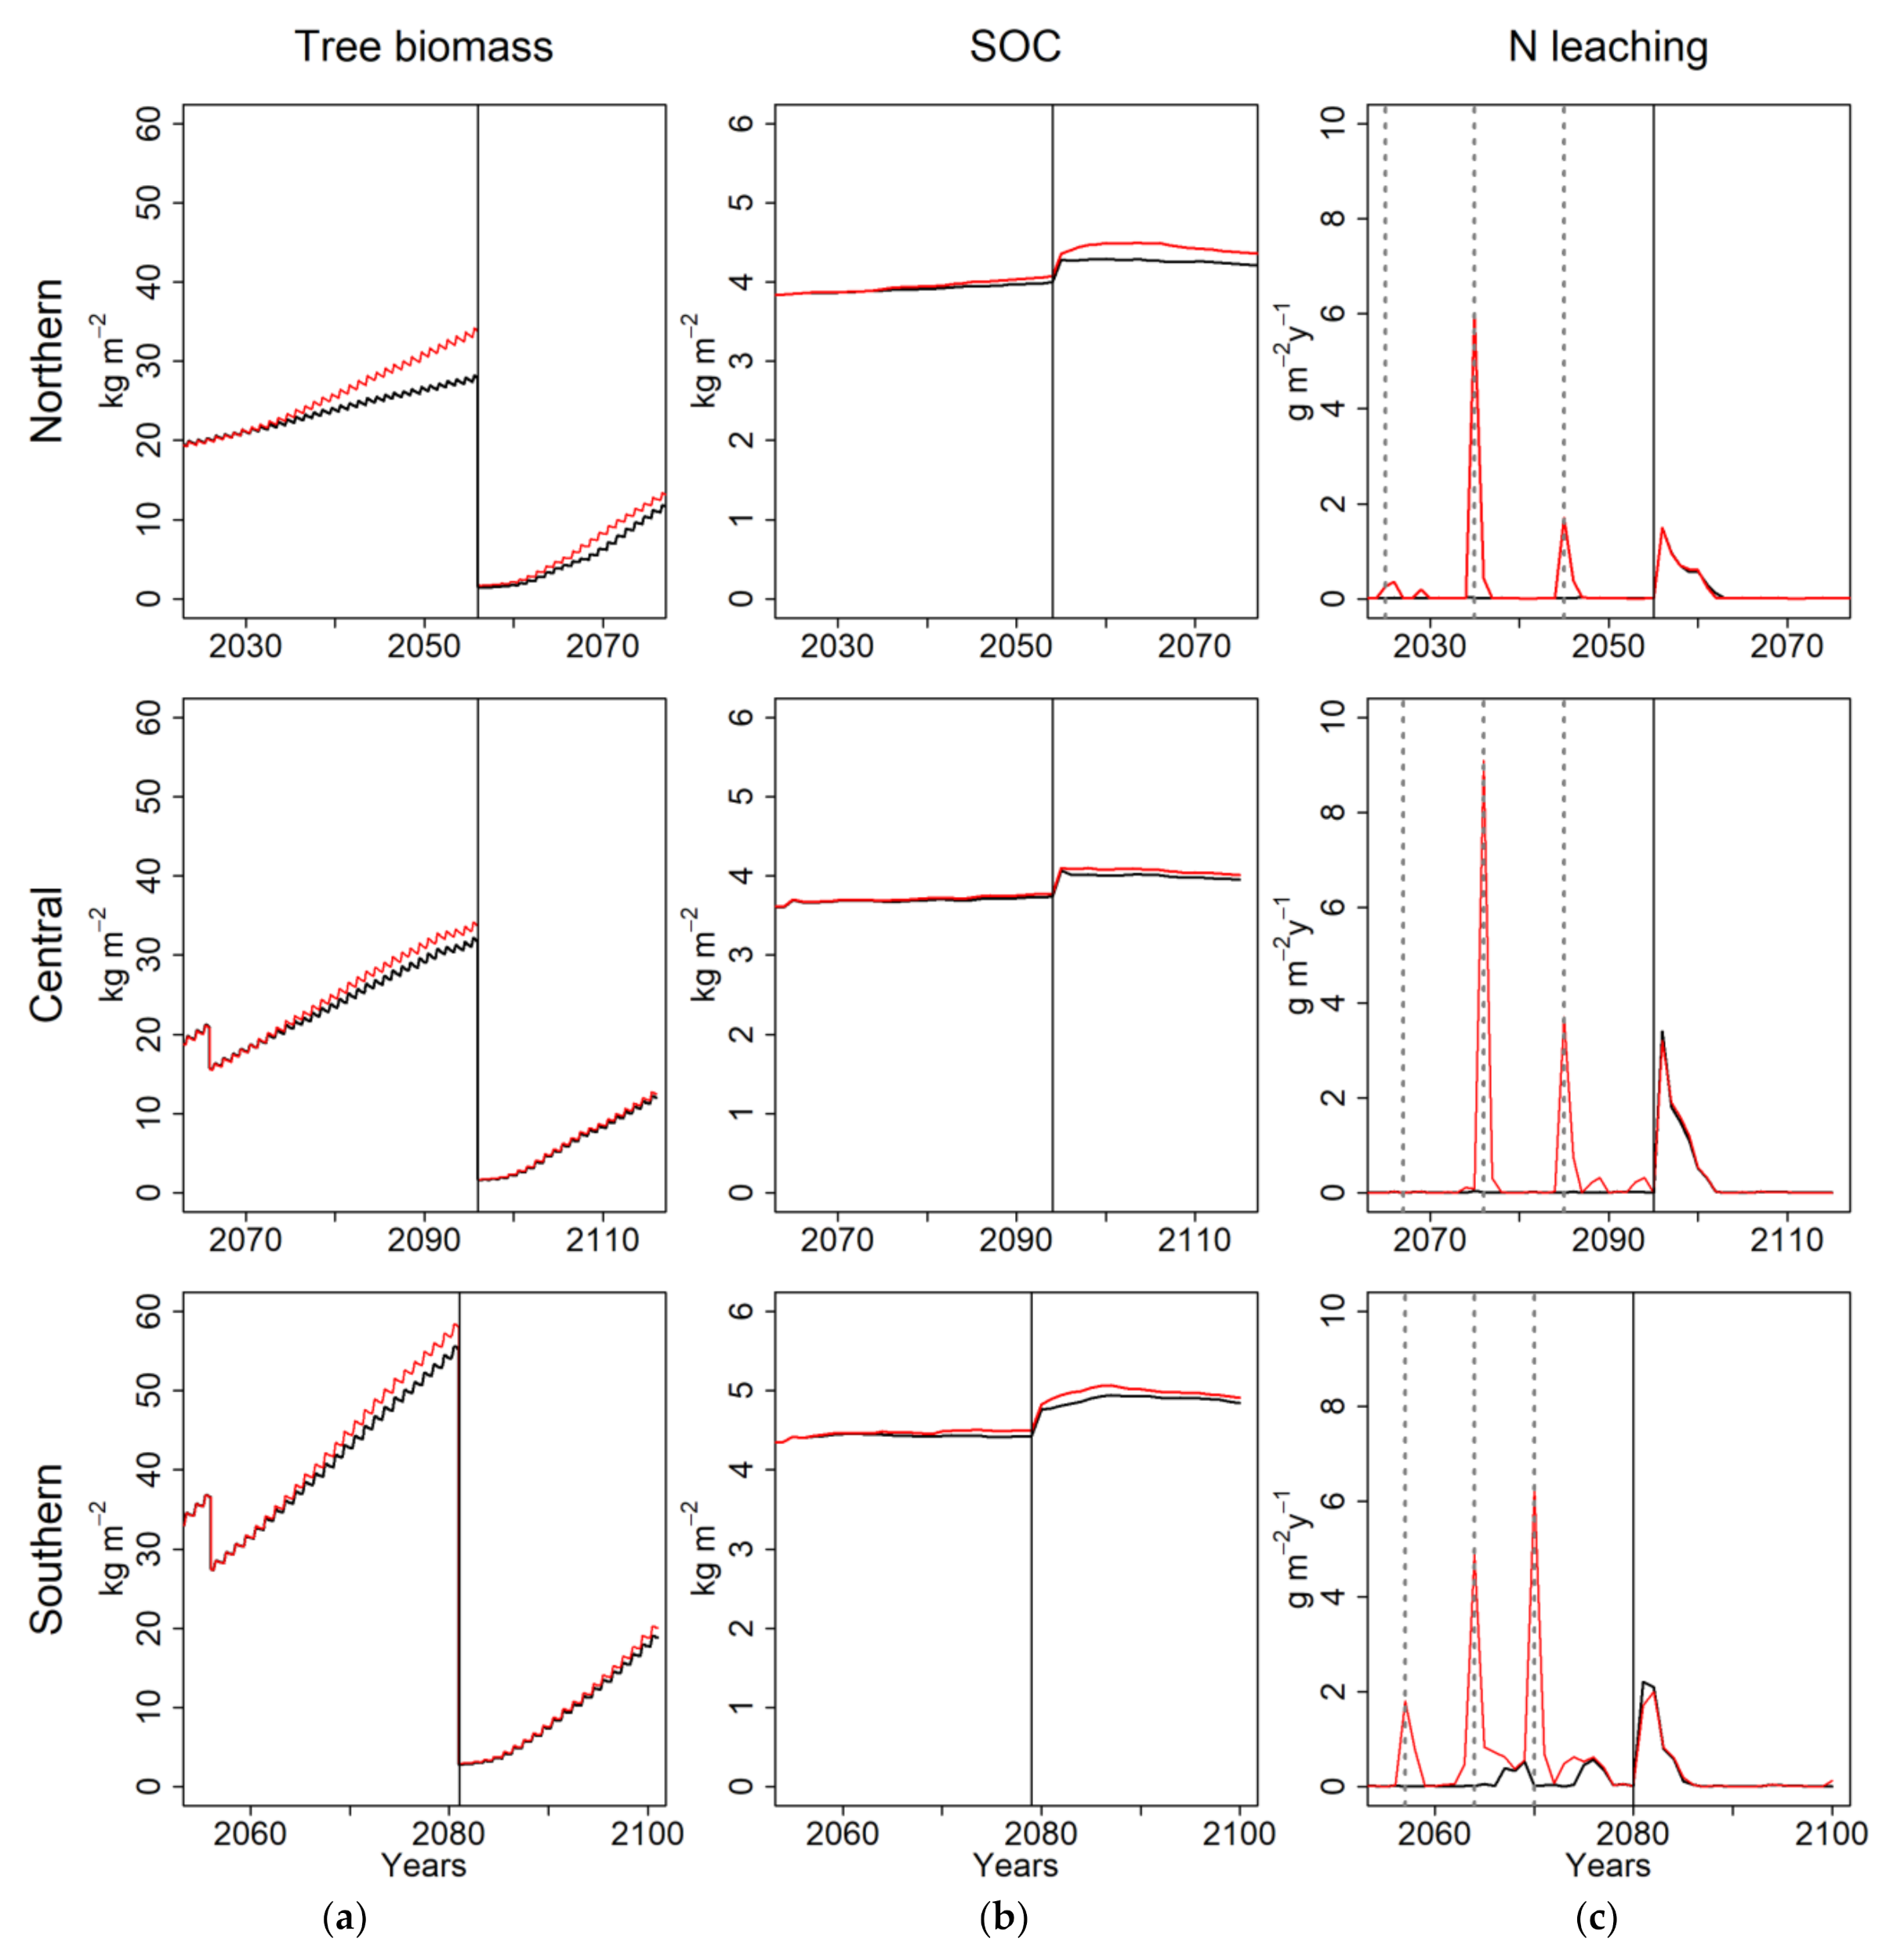
3.2. Fertilization Effects

The model simulations showed that N fertilization had effects on tree growth, SOC and N leaching, but the effects varied in size and differed between sites (Figure 4; Table 5 and Table 6).

3.2.1. Tree Growth

The model simulated an effect of N fertilization on tree biomass at the Northern site and limited effects at the Central and Southern sites in the period between fertilization and final felling (Figure 4; Table 5). A similar pattern was simulated during the first 20 years after final felling.
The results support our first hypothesis that N fertilization has a limited effect on tree growth in forests where the historical N deposition has been high, the Southern site in this study, while it can increase tree growth in forests with low N deposition, represented by the Northern site in this study. Furthermore, the model results indicate that the growth effect is limited also at the Central site with intermediate historical deposition. These results also support the N saturation theory [8], stating that growth is no longer limited by N in N saturated forests, and adding N will thus not increase net primary productivity (NPP). According to this theory, growth in an N saturated forest will be limited by some other factor, e.g., phosphorus availability [81,82] or base cation availability [83], that especially at the Southern site has been leached in large amounts due to high sulphur deposition.
The common, long prevailing view in Sweden is that N fertilization can be beneficial to forest growth all over Sweden. This view is grounded on experimental data, showing that N fertilization leads to a substantial effect on tree growth both in Northern and Southern forest sites [18]. In contrast to those results, a more recent study including 13 fertilization experiments in Norway spruce stands in the southern part of Sweden showed that these forests were nonresponsive to N fertilization [23], which is in agreement with the N saturation theory [8] and the results from the present study.
Studies on residual effects in the second rotation after N fertilization are sparse, but a residual growth effect after final felling has been observed in a study in central Sweden [84]. The N deposition at this site was 2–4 kg ha−1 year−1 which is comparable to the Northern site in this study, where a residual effect was simulated. Experimental data on the residual effect of N fertilization in N saturated forests are missing. However, given that the fertilization effect before clear-felling is very marginal, the simulated lack of residual effect in the Southern and Central sites seems reasonable.

3.2.2. SOC

The model simulated a slightly higher SOC in the organic layer in the FERT scenario than in the BAS scenario in the period between fertilization and final felling at all sites (Figure 4; Table 5). Just before final felling, the SOC concentration was only 1–2% higher in the FERT scenario than in the BAS scenario at all sites, suggesting that N fertilization could have almost no effect on SOC accumulation in the short term. However, 20 years after final felling, the model simulated a 4% increase of SOC in the organic layer at the Northern site due to N fertilization, whereas the increase at the Southern and Central sites was still 1% and 2%, respectively. These results partially confirm our second hypothesis that N fertilization might have little effect on SOC accumulation in the organic layer in areas with high historic N deposition, while it can increase SOC at sites with low N deposition. However, the results also suggest that SOC increase might be small even with low N inputs. A difference in SOC accumulation was simulated only in a longer-time period of 40 years, with a higher % increase at the Northern site as compared to the other two sites. Therefore, the results also suggest that fertilization can produce a slight SOC accumulation in the long-term at N limited forest sites.
The simulated SOC changes were connected to a slight increase in woody litter production, but no apparent increase in leaf litter production, which was the reason why the SOC increased the most at the Northern site and after the final felling. That is, the increase in woody litter production was strictly connected to forest growth increase after N fertilization which was simulated only at the Northern site. This result support with the hypothesis that fertilization can lead to an increase in primary production and litter production on nutrient poor sites [4]. In addition, the long term-response of SOC was linked to two elements combined. First, woody litter has slower decomposition rates and therefore has a long term rather than a short term effect on SOC accumulation [85]. Second, woody litter mostly increased after harvesting events when woody residues were left on the ground, and corresponded to the sharper SOC increase after the final felling (Figure 4). Similar effects have been seen in previous studies [74,86]. In these studies, however, the peaks have been shorter, followed by a decrease in SOC after the residues have decomposed. Alternatively, decomposition rates could be slowed down by an another possible effect of N fertilization, that is the suppressed production of lignin-degrading enzymes through a shift from fungal- to bacterial dominated microbial communities [87]. In conclusion, the results suggest that N fertilization could have a long-term positive effect on carbon sequestration in the soil in N limited forest sites. These results are in line with a recent study [88] that points to the transient effect of N enrichment on SOC.

3.2.3. N Leaching

N fertilization led to higher N concentrations in soil solution below the root zone at all sites before final felling, and thereby increased N leaching in the model simulations (Figure 4; Table 6). Unlike the effect on biomass and SOC, simulated N leaching was triggered by both clear-felling and the fertilization events. The greatest effect occurred at the southern site, where 38% of the applied N was leached. The corresponding fractions at the central and northern sites were 29% and 17%, suggesting a higher N retention capacity with decreasing N atmospheric deposition from the South to the North of Sweden. The modeled N concentrations following the fertilization events (data not shown) are in agreement with experimental studies in central Sweden [24,25], showing similar patterns of N concentrations in the soil solution directly after N fertilization and similar heightened concentrations in the following years.
However, none of the sites showed any fertilization effect on the simulated N leaching in the 20-year period after final felling, in contrast to what has been proposed earlier [27]. Results from experiments on fertilization effects after final felling widely vary [28,29,30,31,32,33] and therefore highlight the complexity of causal relationships between fertilization and N leaching and the importance of site characteristics on N export. The missing fertilization effect on N leaching after final felling in the model simulations can be attributed to the fact that the fertilization had effects mainly on woody biomass, which decomposes slowly and it is less N rich than foliage litter. The study results support the third hypothesis, that N fertilization can increase N leaching especially at sites with historically high N deposition. However, this effect was simulated only for the period between N fertilization and final felling, suggesting that N fertilization might have only a short time effect on N leaching. Moreover, the comparison with measurements showed that the model overestimated N concentrations in the soil solution before clear-felling at the Southern site. Therefore, it is possible that the model underestimated the retention capacity of the soil in areas with high N deposition and thereby overestimated the short-term effects of N fertilization on N leaching.

4. Conclusions

The model simulations supported our hypotheses regarding differences in N fertilization effects on tree growth and N leaching between areas with high and low N deposition. These effects were more evident in the short-term, while the only clear long-term effect was on tree growth in the least N-rich site in the North. The results, thus, support the Swedish Forest Agency’s recommendations for N fertilization, which differ between regions depending on historical and present N deposition.
There were also some differences for simulated SOC in the organic layer, but only over longer time periods. A higher SOC accumulation was simulated after 40 years at the Northern site, suggesting a possible long-term positive effect on N fertilization on soil carbon at N poor sites.
Based on the validation against measured data and the simulations to test the postulates of the N saturation theory, we conclude that ForSAFE can be a useful tool in assessing effects of N fertilization on tree growth and N leaching. For SOC the uncertainties are larger, and a review and revision of the process descriptions in the model is desirable. Soil moisture plays a central role in all model processes governing the simulated responses to N fertilization presented above. By considering a wider range of climate conditions, it should be possible to draw more general conclusions on the role of local moisture conditions and better understand the possible consequences of climate change of N fertilization in different parts of Sweden.

Author Contributions

Conceptualization, K.L., C.A. and S.B.; methodology, K.L., C.A. and S.B.; software, S.B., G.Z., K.L.; validation, K.L., G.Z., S.B., C.A.; formal analysis, K.L.; investigation, K.L.; resources, C.A., S.B.; data curation, K.L.; writing—original draft preparation, K.L., C.A., G.Z., S.B.; writing—review and editing, K.L., C.A., G.Z., S.B.; visualization, K.L.; supervision, C.A., S.B., G.Z.; project administration, K.L., C.A.; funding acquisition, C.A. All authors have read and agreed to the published version of the manuscript.

Funding

This research was funded by Lund University (75%) and by the Swedish research Council for Environment, Agricultural Sciences and Spatial Planning (FORMAS), through the strong research environment, QWARTS (212-2011-1691) (25%).

Data Availability Statement

Input data on soils is available in Appendix A, Appendix B and Appendix C. Stand biomass data is presented in Table 2. Climate and deposition data for the past and the future were derived from simulations by SMHI (Swedish Meteorological and Hydrological Institute), as described in the Methods section. For these data we refer to SMHI, in their role as data host for the data. Measured deposition and soil solution chemistry from recent years were obtained from IVL Swedish Research Institute. Those data can be downloaded from the IVL website, www.ivl.se, accessed on 14 January 2021. Model Parameterization Data for the ForSAFE Model Are Published in Earlier Papers: For the original monthly version see [34] and for modifications for the daily version see [43]. In this study the daily version was used, with some modified parameters which are listed in Table 1 and Table 3. For the Model Code: We refer to the model developers, since our experience is that new model users need guidance at start to be able to run the model properly. Contact details: [email protected]; [email protected].

Conflicts of Interest

The authors declare no conflict of interest. The funders had no role in the design of the study; in the collection, analyses, or interpretation of data; in the writing of the manuscript, or in the decision to publish the results.

Appendix A

For the northern and central site, clay and silt was not separated in the grain size analysis. At those sites, the average fraction from soil samples from three different databases, where clay and silt were separated, was used (Table A1).
Table A1. Average proportions of clay in the clay + silt fraction in three different databases, and the overall average used in this study.
DatabaseNumber of SitesSite NamesAverage (%)St Dev
NORDSOIL 116See [89]128
SWETHRO 29L05, LO7, M10, BD06, O35B, M16B, P95B, P95C, P95D2515
Whole-tree harvesting experiments 34Tönnersjöheden, Kosta, Lövliden, Lund97
Total29 1513
1 [89], 2 [36], 3 [90].

Appendix B

Table A2. Soil parameters for the Northern site.
Layer12345
HorizonOAABBC
Thickness (m)0.030.080.090.20.13
Clay (kg/kg)0.000.010.010.010.01
Silt (kg/kg)0.010.040.050.060.02
Sand (kg/kg)0.120.710.680.700.59
Gravel (kg/kg)0.010.210.210.200.36
Stoniness (m3/m3)0.000.200.200.200.20
Org mtrl (kg/kg)0.860.030.050.030.02
Bulk density (kg/dm3)1741140115413561471
Kgibb6.56.57.68.69.2
CEC (keq/kg)0.250.060.040.020.02
Base saturation (%)77.4018.8021.2031.0038.80
Albite (%)2.8919.2619.1523.8422.62
Anorthite (%)0.201.341.882.091.91
Apatite (%)0.010.100.340.330.30
Biotite (%)0.040.281.031.471.36
Chlorite1 (%)
Chlorite2 (%)0.020.150.550.790.73
Clinopyroxene (%)0.030.170.590.810.74
Epidote (%)0.181.171.631.801.65
Hornblende (%)0.040.270.971.351.25
Illite1 (%)
Illite2 (%)0.815.4110.575.184.63
K-Feldspar90 (%)3.0020.0013.4819.6718.29
K-Feldspar100 (%)
Muscovite (%)
Vermiculite1 (%)0.050.361.351.961.81
Vermiculite2 (%)
Table A3. Soil parameters for the Central site.
Layer12345
HorizonOAABBC
Thickness (m)0.060.120.20.150.13
Clay (kg/kg)0.000.020.020.020.02
Silt (kg/kg)0.010.090.090.090.11
Sand (kg/kg)0.060.800.610.710.70
Gravel (kg/kg)0.000.070.270.160.15
Stoniness (m3/m3)0.000.050.050.050.05
Org mtrl (kg/kg)0.930.020.010.020.02
Bulk density (kg/dm3)2321309150113901515
Kgibb6.56.57.68.69.2
CEC (keq/kg)0.320.020.020.020.02
Base saturation (%)35.0017.2010.7012.7016.10
Albite (%)1.1723.3519.7120.4422.78
Anorthite (%)0.173.502.292.672.68
Apatite (%)0.000.040.040.120.20
Biotite (%)
Chlorite1 (%)0.020.310.480.530.44
Chlorite2 (%)0.010.210.300.360.28
Clinopyroxene (%)
Epidote (%)0.163.113.392.383.36
Hornblende (%)0.020.380.540.650.53
Illite1 (%)0.061.222.501.504.12
Illite2 (%)
K-Feldspar90 (%)
K-Feldspar100 (%)0.8817.5711.5614.0013.43
Muscovite (%)0.122.344.992.855.15
Vermiculite1 (%)0.030.511.500.891.65
Vermiculite2 (%)0.010.200.280.350.28
Table A4. Soil parameters for the Southern site.
Layer12345
HorizonOAABBC
Thickness (m)0.050.060.20.20.14
Clay (kg/kg)0.010.040.050.030.02
Silt (kg/kg)0.040.240.250.180.13
Sand (kg/kg)0.080.570.510.640.68
Gravel (kg/kg)0.000.090.140.110.15
Stoniness (m3/m3)0.000.200.200.200.20
Org mtrl (kg/kg)0.870.060.050.040.02
Bulk density (kg/dm3)181959106212791446
Kgibb6.56.57.68.69.2
CEC (keq/kg)0.210.050.040.020.02
Base saturation (%)0.430.050.060.070.05
Albite (%)1.5817.9318.3119.2320.00
Anorthite (%)0.012.102.312.422.60
Apatite (%)0.420.140.210.280.33
Biotite (%)
Chlorite1 (%)0.200.300.490.590.70
Chlorite2 (%)0.130.210.330.400.48
Clinopyroxene (%)
Epidote (%)0.011.882.072.162.32
Hornblende (%)0.020.360.580.700.82
Illite1 (%)0.321.803.243.122.59
Illite2 (%)
K-Feldspar90 (%)
K-Feldspar100 (%)1.1515.3712.8813.9315.65
Muscovite (%)0.733.446.195.954.89
Vermiculite1 (%)0.110.510.810.991.18
Vermiculite2 (%)0.120.200.320.390.46

Appendix C

Table A5. Stoichiometry used for the normative mineralogy.
MineralSiTiAlFeMgCaNaKPH
Albite3010001000
Anorthite2020010000
Apatite0000050031
Biotite2.180.091.360.90.900.040.6801.62
Chlorite10.690.0050.620.620.5350.0150.01002.21
Chlorite20.4350.0050.50.290.51500001.51
Clinopyroxene0.9430.0070.0530.1070.4330.3900.020000
Epidote0.6200.480.1500.40000.22
Hornblende1.010.01830.360.30.350.27670.090.0300.3133
Illite10.6800.5200000.1200.4
Illite20.6600.420.080.040.0200.1300.4
K-Feldspar903010000.10.900
K-Feldspar1003010000100
Muscovite1.20.020.960.120.0800.020.4400.94
Vermiculite11.46500.810.910.5150.10004.02
Vermiculite20.61500.340.110.5150.050002.45
Quartz1000000000

References

  1. Swedish Government. Regeringens Proposition 2008/09: 163. En Sammanhållen Klimat-Och Energipolitik–Energi. Available online: https://www.regeringen.se/rattsliga-dokument/proposition/2009/03/prop.-200809163/ (accessed on 15 January 2021).
  2. Börjesson, P.; Hansson, J.; Berndes, G. Future Demand For Forest-Based Biomass For Energy Purposes In Sweden. For. Ecol. Manag. 2017, 383, 17–26. [Google Scholar] [CrossRef]
  3. Lindkvist, A.; Kardell, Ö.; Nordlund, C. Intensive Forestry As Progress Or Decay? An Analysis Of The Debate About Forest Fertilization In Sweden, 1960–2010. Forests 2011, 2, 112–146. [Google Scholar] [CrossRef] [Green Version]
  4. Johnson, D.W.; Curtis, P.S. Effects Of Forest Management On Soil C And N Storage: Meta Analysis. For. Ecol. Manag. 2001, 140, 227–238. [Google Scholar] [CrossRef]
  5. Sathre, R.; Gustavsson, L.; Bergh, J. Primary Energy And Greenhouse Gas Implications Of Increasing Biomass Production Through Forest Fertilization. Biomass Bioenergy 2010, 34, 572–581. [Google Scholar] [CrossRef]
  6. Aber, J.D.; Nadelhoffer, K.J.; Steudler, P.; Melillo, J.M. Nitrogen Saturation In Northern Forest Ecosystems. Bioscience 1989, 39, 378–386. [Google Scholar] [CrossRef]
  7. Aber, J. Nitrogen Saturation In Temperate Forest Ecosystems: Current Theory, Remaining Questions And Recent Advances. In Progress in Plant Nutrition: Plenary Lectures of the XIV International Plant Nutrition Colloquium; Springer: Dordrecht, The Netherlands, 2002; pp. 179–188. [Google Scholar] [CrossRef]
  8. Emmett, B. Nitrogen Saturation Of Terrestrial Ecosystems: Some Recent Findings And Their Implications For Our Conceptual Framework. Water Air Soil Pollut. Focus 2007, 7, 99. [Google Scholar] [CrossRef]
  9. Cowling, E.; Galloway, J.; Furiness, C.; Barber, M.; Bresser, T.; Cassman, K.; Erisman, J.W.; Haeuber, R.; Howarth, R.; Melillo, J.; et al. Optimizing Nitrogen Management In Food And Energy Production And Environmental Protection: Summary Statement From The Second International Nitrogen Conference. Sci. World J. 2001, 1 (Suppl. 2), 1–9. [Google Scholar] [CrossRef] [PubMed] [Green Version]
  10. Tamm, C.O. Nitrogen In Terrestrial Ecosystems: Questions of Productivity, Vegetational Changes, and Ecosystem Stability; Springer: Dordrecht, The Netherlands, 1991. [Google Scholar]
  11. Karlsson, P.E.; Pihl Karlsson, G.; Hellsten, S.; Akselsson, C.; Ferm, M.; Hultberg, H. Total Deposition Of Inorganic Nitrogen To Norway Spruce Forests–Applying A Surrogate Surface Method Across A Deposition Gradient In Sweden. Atmos. Environ. 2019, 217. [Google Scholar] [CrossRef]
  12. Akselsson, C.; Belyazid, S.; Hellsten, S.; Klarqvist, M.; Pihl-Karlsson, G.; Karlsson, P.-E.; Lundin, L. Assessing The Risk of N Leaching From Forest Soils Across A Steep N Deposition Gradient In Sweden. Environ. Pollut. 2010, 158, 3588–3595. [Google Scholar] [CrossRef] [Green Version]
  13. Akselsson, C.; Westling, O.; Orlander, G. Regional Mapping Of Nitrogen Leaching From Clearcuts In Southern Sweden. For. Ecol. Manag. 2004, 202, 235–243. [Google Scholar] [CrossRef]
  14. Swedish Forest Agency. Kvävegödsling av Skogsmark; Meddelande 2: 2007; Skogsstyrelsen: Jönköping, Sweden, 2007.
  15. Swedish Forest Agency. Föreskrifter om Ändring i Skogsstyrelsens föreskrifter och allmänna råd (SKSFS 2011:7) till Skogsvårdslagen; SKSFS 2013:2; Skogsstyrelsen: Jönköping, Sweden, 2014.
  16. Högberg, P.; Larsson, S.; Lundmark, T.; Moen, J.; Nilsson, U.; Nordin, A. Effekter Av Kvävegödsling På Skogsmark Kunskapssammanställning Utförd Av Slu På Begäran Av Skogsstyrelsen; Swedish Forest Agency: Linköping, Sweden, 2014. [Google Scholar]
  17. Jacobson, S.; Pettersson, F. Growth Responses Following Nitrogen and NPK Mg Additions to Previously N-Fertilized Scots Pine and Norway Spruce Stands on Mineral Soils in Sweden. Can. J. For. Res. 2001, 31, 899–908. [Google Scholar] [CrossRef]
  18. Nohrstedt, H.-Ö. Response Of Coniferous Forest Ecosystems On Mineral Soils To Nutrient Additions: A Review of Swedish Experiences. Scand. J. For. Res. 2001, 16, 555–573. [Google Scholar] [CrossRef]
  19. Andersson, F.; Brække, F.H.; Hallbäcken, L. Nutrition and Growth of Norway Spruce Forests in a Nordic Climate and Deposition Gradient; TemaNord 1998:566; Nordic Council of Ministers: Copenhagen, Denmark, 1998. [Google Scholar]
  20. Tamm, C.O.; Aronsson, A.; Popovic, B.; Flower-Ellis, J. Optimum Nutrition and Nitrogen Saturation in Scots Pine Stands; Studia Forestalia Suecica No 206; Swedish University of Agricultural Sciences: Uppsala, Sweden, 1999. [Google Scholar]
  21. Mälkönen, E. Estimation of Nitrogen Saturation on the Basis of Long-Term Fertilization Experiments. Plant Soil 1990, 128, 75–82. [Google Scholar] [CrossRef]
  22. Sikstrom, U. Effects of Low-Dose Liming and Nitrogen Fertilization on Stemwood Growth and Needle Properties of Picea Abies and Pinus Sylvestris. For. Ecol. Manag. 1997, 95, 261. [Google Scholar] [CrossRef]
  23. Bergh, J.; Nilsson, U.; Allen, H.L.; Johansson, U.; Fahlvik, N. Long-Term Responses of Scots Pine and Norway Spruce Stands in Sweden to Repeated Fertilization and Thinning. For. Ecol. Manag. 2014, 320, 118–128. [Google Scholar] [CrossRef]
  24. Ring, E.; Jacobson, S.; Nohrstedt, H.-Ö. Soil-Solution Chemistry in a Coniferous Stand after Adding Wood Ash and Nitrogen. Can. J. For. Res. 2006, 36, 153–163. [Google Scholar] [CrossRef]
  25. Högbom, L.; Nohrstedt, H.-Ö.; Nordlund, S. Nitrogen Fertilization Effects on Stream Water Cadmium Concentration. J. Environ. Qual. 2001, 30, 189–193. [Google Scholar] [CrossRef]
  26. Binkley, D.; Burnham, H.; Lee Allen, H. Water Quality Impacts Of Forest Fertilization With Nitrogen And Phosphorus. For. Ecol. Manag. 1999, 121, 191–213. [Google Scholar] [CrossRef]
  27. Gundersen, P.; Schmidt, I.K.; Raulund-Rasmussen, K. Leaching of Nitrate From Temperate Forests–Effects of Air Pollution and Forest Management. Environ. Rev. 2006, 14, 1–57. [Google Scholar] [CrossRef]
  28. Ring, E. Effects of Previous N Fertilizations on Soil—Water Ph and N Concentrations after Clear—Felling and Soil Scarification at a Pinus Sylvestris Site. Scand. J. For. Rese. 1996, 11, 7–16. [Google Scholar] [CrossRef]
  29. Berdén, M.; Nilsson, S.I.; Nyman, P. Ion Leaching before and after Clear-Cutting in a Norway Spruce Stand—Effects of Long-Term Application of Ammonium Nitrate and Superphosphate. Water Air Soil Pollut. 1997, 93, 1–26. [Google Scholar] [CrossRef]
  30. Ring, E.; Bergholm, J.; Olsson, B.A.; Jansson, G. Urea Fertilizations of a Norway Spruce Stand: Effects on Nitrogen in Soil Water and Field-Layer Vegetation after Final Felling. Can. J. For. Res. 2003, 33, 375–384. [Google Scholar] [CrossRef]
  31. Hedwall, P.-O.; Grip, H.; Linder, S.; Lövdahl, L.; Nilsson, U.; Bergh, J. Effects of Clear-Cutting and Slash Removal on Soil Water Chemistry and Forest-Floor Vegetation in a Nutrient Optimised Norway Spruce Stand. Silva Fenn. 2013, 47, 933. [Google Scholar] [CrossRef] [Green Version]
  32. Ring, E.; Högbom, L.; Nohrstedt, H.O. Effects of Brash Removal after Clear Felling on Soil and Soil-Solution Chemistry and Field-Layer Biomass in an Experimental Nitrogen Gradient. Sci. World J. 2001, 1 (Suppl. 2), 457–466. [Google Scholar] [CrossRef] [Green Version]
  33. Ring, E.; Högbom, L.; Jacobson, S.; Jansson, G.; Nohrstedt, H.-Ö. Long-Term Effects on Soil-Water Nitrogen and Ph of Clearcutting and Simulated Disc Trenching of Previously Nitrogen-Fertilised Pine Plots. Can. J. For. Res. 2018, 48, 1115–1123. [Google Scholar] [CrossRef]
  34. Wallman, P.; Svensson, M.; Sverdrup, H.; Belyazid, S. Forsafe—An Integrated Process-Oriented Forest Model for Long-Term Sustainability Assessments. For. Ecol. Manag. 2005, 207, 19–36. [Google Scholar] [CrossRef]
  35. Belyazid, S.; Westling, O.; Sverdrup, H. Modelling Changes in Forest Soil Chemistry at 16 Swedish Coniferous Forest Sites Following Deposition Reduction. Environ. Pollut. 2006, 144, 596–609. [Google Scholar] [CrossRef] [PubMed]
  36. Pihl Karlsson, G.; Akselsson, C.; Hellsten, S.; Karlsson, P.E. Reduced European Emissions of S and N—Effects on Air Concentrations, Deposition and Soil Water Chemistry in Swedish Forests. Environ. Pollut. 2011, 159, 3571–3582. [Google Scholar] [CrossRef] [PubMed] [Green Version]
  37. Langner, J. Air Pollution Assessment Study Using the Match Modelling System: Application to Sulphur and Nitrogen Compounds over Sweden 1994; SMHI: Norrköping, Sweden, 1996.
  38. Alveteg, M. Dynamics of Forest Soil Chemistry; Lund University: Lund, Sweden, 1998. [Google Scholar]
  39. Aber, J.D.; Federer, C.A. A Generalized, Lumped-Parameter Model of Photosynthesis, Evapotranspiration and Net Primary Production in Temperate and Boreal Forest Ecosystems. Oecologia 1992, 92, 463–474. [Google Scholar] [CrossRef]
  40. Walse, C.; Berg, B.; Sverdrup, H. Review and Synthesis of Experimental Data on Organic Matter Decomposition with Respect to the Effect of Temperature, Moisture, and Acidity. Environ. Rev. 1998, 6, 25–40. [Google Scholar] [CrossRef]
  41. Wallman, P.; Belyazid, S.; Svensson, M.G.E.; Sverdrup, H. Decomp—A Semi-Mechanistic Model of Litter Decomposition. Environ. Model. Softw. 2006, 21, 33–44. [Google Scholar] [CrossRef]
  42. Lindström, G.; Gardelin, M. Model structure. In Modelling Groundwater Response to Acidification; Sandén, P., Warfvinge, P., Eds.; SMHI: Norrköping, Sweden, 1992. [Google Scholar]
  43. Yu, L.; Zanchi, G.; Akselsson, C.; Wallander, H.; Belyazid, S. Modeling the forest phosphorus nutrition in a southwestern Swedish forest site. Ecol. Model. 2018, 369, 88–100. [Google Scholar] [CrossRef] [Green Version]
  44. Zanchi, G.; Belyazid, S.; Akselsson, C.; Yu, L.; Bishop, K.; Köhler, S.J.; Grip, H. A Hydrological Concept Including Lateral Water Flow Compatible with the Biogeochemical Model Forsafe. Hydrology 2016, 3, 11. [Google Scholar] [CrossRef] [Green Version]
  45. Sverdrup, H.; Stjernquist, I. (Eds.) Developing Principles and Models for Sustainable Forestry in Sweden; Kluwer Academic Publishers: Dordrecht, The Netherlands, 2002. [Google Scholar]
  46. Kjellström, E.; Sveriges Meteorologiska Och Hydrologiska Institut. A 140-Year Simulation of European Climate with the New Version of the Rossby Centre Regional Atmospheric Climate Model (RCA3); SMHI: Norrköping, Sweden, 2005.
  47. Roeckner, E.; Brokopf, R.; Esch, M.; Giorgetta, M.; Hagemann, S.; Kornblueh, L.; Manzini, E.; Schlese, U.; Schulzweida, U. Sensitivity of Simulated Climate to Horizontal and Vertical Resolution in the Echam5 Atmosphere Model. J. Clim. 2006, 19, 3771. [Google Scholar] [CrossRef]
  48. Nakicenovic, N.; Swart, R. Special Report on Emissions Scenarios (SRES)—A Special Report of Working Group III of the Intergovernmental Panel on Climate Change; Cambridge University Press: Cambrige, UK, 2000; Volume 559. [Google Scholar]
  49. Yang, W.; Andréasson, J.; Graham, L.P.; Olsson, J.; Rosberg, J.; Wetterhall, F. Distribution-Based Scaling to Improve Usability of Regional Climate Model Projections for Hydrological Climate Change Impacts Studies. Hydrol. Res. 2010, 41, 211–229. [Google Scholar] [CrossRef]
  50. Johansson, B. Areal Precipitation and Temperature in the Swedish Mountains: An Evaluation from a Hydrological Perspective. Hydrol. Res. 2000, 31, 207–228. [Google Scholar] [CrossRef]
  51. Hempel, S.; Frieler, K.; Warszawski, L.; Schewe, J.; Piontek, F. A Trend-Preserving Bias Correction—The Isi-Mip Approach. Earth Syst. Dyn. 2013, 4, 219–236. [Google Scholar] [CrossRef] [Green Version]
  52. David, R.; (University of Gothenburg, Gothenburg, Sweden). Personal communication, 2010.
  53. Robertson, L.; Langner, J.; Engardt, M. An Eulerian Limited-Area Atmospheric Transport Model. J. Appl. Meteorol. 1999, 38, 190–210. [Google Scholar] [CrossRef]
  54. Engardt, M.; Langner, J. Simulations of Future Sulphur and Nitrogen Deposition over Europe Using Meteorological Data from Three Regional Climate Projections. Tellus B Chem. Phys. Meteorol. 2013, 65, 20348. [Google Scholar] [CrossRef]
  55. Munthe, J.; Arnell, J. (Eds.) Klimatförändringen och Miljömål; Report 6705; Swedish Environmental Protection Agency: Stockholm, Sweden, 2016.
  56. Lamarque, J.F.; Bond, T.C.; Eyring, V.; Granier, C.; Heil, A.; Klimont, Z.; Lee, D.; Liousse, C.; Mieville, A.; Owen, B.; et al. Historical (1850–2000) Gridded Anthropogenic and Biomass Burning Emissions of Reactive Gases and Aerosols: Methodology and Application. Atmos. Chem. Phys. 2010, 10, 7017–7039. [Google Scholar] [CrossRef] [Green Version]
  57. Lampa, M.E.; Belyazid, S.; Zanchi, G.; Akselsson, C. Effects of Whole-Tree Harvesting on Soil, Soil Water and Tree Growth—A Dynamic Modelling Exercise in Four Long-Term Experiments. Ecol. Model. 2019, 414. [Google Scholar] [CrossRef]
  58. Lindo, Z.; Nilsson, M.-C.; Gundale, M. Bryophyte-Cyanobacteria Associations as Regulators of the Northern Latitude Carbon Balance in Response to Global Change. Global Chang. Biol. 2013, 19, 2022–2035. [Google Scholar] [CrossRef]
  59. Zanchi, G.; Belyazid, S.; Akselsson, C.; Yu, L. Modelling the Effects of Management Intensification on Multiple Forest Services: A Swedish Case Study. Ecol. Model. 2014, 284, 48–59. [Google Scholar] [CrossRef] [Green Version]
  60. Yu, L.; Belyazid, S.; Akselsson, C.; Van Der Heijden, G.; Zanchi, G. Storm Disturbances in a Swedish Forest-A Case Study Comparing Monitoring and Modelling. Ecol. Model. 2016, 320, 102–113. [Google Scholar] [CrossRef] [Green Version]
  61. Posch, M.; Kurz, D. A2m—A Program to Compute All Possible Mineral Modes from Geochemical Analyses. Comput. Geosci. 2007, 33, 563–572. [Google Scholar] [CrossRef]
  62. Belyazid, S. Dynamic Modelling of Biogeochemical Processes in Forest Ecosystems. Ph.D. Thesis, Lund University, Lund, Sweden, 2006. [Google Scholar]
  63. Aber, J.D.; Ollinger, S.V.; Federer, C.A.; Reich, P.B.; Goulden, M.L.; Kicklighter, D.W.; Melillo, J.M.; Lathrop, R.G. Predicting the Effects of Climate Change on Water Yield and Forest Production in the Northeastern United States. Clim. Res. 1995, 5, 207–222. [Google Scholar] [CrossRef]
  64. Ågren Göran, I.; Hyvönen, R.; Nilsson, T. Are Swedish Forest Soils Sinks or Sources for CO2: Model Analyses Based on Forest Inventory Data. Biogeochemistry 2007, 82, 217–227. [Google Scholar] [CrossRef]
  65. Aber, J.D.; Ollinger, S.V.; Driscoll, C.T. Modeling Nitrogen Saturation in Forest Ecosystems in Response to Land Use and Atmospheric Deposition. Ecol. Model. 1997, 101, 61–78. [Google Scholar] [CrossRef]
  66. Gustafson, E.J.; Miranda, B.R. Pnet-Succession V3.1 Extension User Guide. Available online: https://sites.google.com/site/landismodel/extensions/pnet-succession (accessed on 15 January 2021).
  67. Swedish Forest Agency. Gallringsmallar: Norra Sverige; Skogsstyrelsen: Jönköping, Sweden, 1985.
  68. Swedish Forest Agency. Gallringsmallar: Södra Sverige; Skogsstyrelsen: Jönköping, Sweden, 1985.
  69. Janssen, P.H.M.; Heuberger, P.S.C. Calibration of Process-Oriented Models. Ecol. Model. 1995, 83, 55–66. [Google Scholar] [CrossRef]
  70. Nash, J.E.; Sutcliffe, J.V. River Flow Forecasting through Conceptual Models Part I—A Discussion of Principles. J. Hydrol. 1970, 10, 282–290. [Google Scholar] [CrossRef]
  71. Belyazid, S.; Giuliana, Z. Water Limitation Can Negate the Effect of Higher Temperatures on Forest Carbon Sequestration. Eur. J. For. Res. 2019, 138, 287–297. [Google Scholar] [CrossRef] [Green Version]
  72. Schrumpf, M.; Schulze, E.D.; Kaiser, K.; Schumacher, J. How Accurately Can Soil Organic Carbon Stocks and Stock Changes Be Quantified by Soil Inventories? Biogeosciences 2011, 8, 1193–1212. [Google Scholar] [CrossRef] [Green Version]
  73. Yurova, A.Y.; Lankreijer, H. Carbon Storage in the Organic Layers of Boreal Forest Soils under Various Moisture Conditions: A Model Study for Northern Sweden Sites. Ecol. Model. 2007, 204, 475–484. [Google Scholar] [CrossRef]
  74. Stendahl, J. Skogsdata 2017: [Aktuella Uppgifter om de Svenska Skogarna Från Riksskogstaxeringen]; Institutionen För Skoglig Resurshushållning, SLU: Umeå, Sweden, 2017. [Google Scholar]
  75. Fahey, T.J.; Siccama, T.G.; Driscoll, C.T.; Likens, G.E.; Campbell, J.; Johnson, C.E.; Battles, J.J.; Aber, J.D.; Cole, J.J.; Fisk, M.C.; et al. The Biogeochemistry of Carbon at Hubbard Brook. Biogeochemistry 2005, 75, 109–176. [Google Scholar] [CrossRef]
  76. Johnson, D.W.; Todd, J.D.E.; Trettin, C.F.; Sedinger, J.S. Soil Carbon and Nitrogen Changes in Forests of Walker Branch Watershed, 1972 to 2004. Soil Sci. Soc. Am. J. 2007, 71, 1639–1646. [Google Scholar] [CrossRef] [Green Version]
  77. Kiser, L.C.; Kelly, J.M.; Mays, P.A. Changes in Forest Soil Carbon and Nitrogen after a Thirty-Year Interval. Soil Sci. Soc. Am. J. 2009, 73, 647–653. [Google Scholar] [CrossRef]
  78. Pihl Karlsson, G.; Hellsten, S.; Akselsson, C.; Karlsson, P.E. Försurning Och Övergödning I Skåne Län Resultat Från Krondroppsnätet Till Och Med 2018/19; Report C535; IVL Swedish Environmental Research Institute: Stockholm, Sweden, 2020. [Google Scholar]
  79. Futter, M.N.; Ring, E.; Högbom, L.; Entenmann, S.; Bishop, K.H. Consequences of Nitrate Leaching Following Stem-Only Harvesting of Swedish Forests Are Dependent on Spatial Scale. Environ. Pollut. 2010, 158, 3552–3559. [Google Scholar] [CrossRef]
  80. Emmett, B.A.; Anderson, J.M.; Hornung, M. The Controls on Dissolved Nitrogen Losses Following Two Intensities of Harvesting in a Sitka Spruce Forest (N. Wales). For. Ecol. Manag. 1991, 41, 65–80. [Google Scholar] [CrossRef]
  81. Blanes, M.C.; Emmett, B.A.; Viñegla, B.; Carreira, J.A. Alleviation of P Limitation Makes Tree Roots Competitive for N against Microbes in a N-Saturated Conifer Forest: A Test through P Fertilization and 15n Labelling. Soil Biol. Biochem. 2012, 48, 51–59. [Google Scholar] [CrossRef]
  82. Vitousek Peter, M.; Porder, S.; Houlton Benjamin, Z.; Chadwick Oliver, A. Terrestrial Phosphorus Limitation: Mechanisms, Implications, And Nitrogen—Phosphorus Interactions. Ecol. Appl. 2010, 20, 5–15. [Google Scholar] [CrossRef] [Green Version]
  83. Likens, G.E.; Driscoll, C.T.; Buso, D.C. Long-Term Effects of Acid Rain: Response and Recovery of a Forest Ecosystem. Science 1996, 272, 244–246. [Google Scholar] [CrossRef]
  84. From, F.; Strengbom, J.; Nordin, A. Residual Long-Term Effects of Forest Fertilization on Tree Growth and Nitrogen Turnover in Boreal Forest. Forests 2015, 6, 1145–1156. [Google Scholar] [CrossRef] [Green Version]
  85. Zhang, M.; Cheng, X.; Geng, Q.; Shi, Z.; Luo, Y.; Xu, X.; Morellato, P. Leaf Litter Traits Predominantly Control Litter Decomposition in Streams Worldwide. Glob. Ecol. Biogeogr. 2019, 28, 1469–1486. [Google Scholar] [CrossRef]
  86. Peltoniemi, M.; Mäkipää, R.; Liski, J.; Tamminen, P. Changes in Soil Carbon With Stand Age—An Evaluation of a Modelling Method with Empirical Data. Glob. Chang. Biol. 2004, 10, 2078–2091. [Google Scholar] [CrossRef]
  87. Frey, S.D.; Knorr, M.; Parrent, J.L.; Simpson, R.T. Chronic Nitrogen Enrichment Affects the Structure and Function of the Soil Microbial Community in Temperate Hardwood and Pine Forests. For. Ecol. Manag. 2004, 196, 159–171. [Google Scholar] [CrossRef]
  88. Tipping, E.; Davies, J.A.C.; Henrys, P.A.; Kirk, G.J.D.; Lilly, A.; Dragosits, U.; Carnell, E.J.; Dore, A.J.; Sutton, M.A.; Tomlinson, S.J. Long-Term Increases In Soil Carbon Due to Ecosystem Fertilization by Atmospheric Nitrogen Deposition Demonstrated by Regional-Scale Modelling and Observations. Sci. Rep. 2017, 7, 1–11. [Google Scholar] [CrossRef] [PubMed] [Green Version]
  89. Stendahl, J.; Akselsson, C.; Melkerud, P.-A.; Belyazid, S. Pedon-Scale Silicate Weathering: Comparison of the Profile Model and the Depletion Method at 16 Forest Sites in Sweden. Geoderma 2013, 211–212, 65–74. [Google Scholar] [CrossRef] [Green Version]
  90. Brandtberg, P.-O.; Olsson, B.A. Changes in the Effects of Whole-Tree Harvesting on Soil Chemistry during 10 years of Stand Development. For. Ecol. Manag. 2012, 277, 150–162. [Google Scholar] [CrossRef]
Figure 1. Total deposition of inorganic N (NO3-N + NH4-N) to spruce forest 2017, according to the MATCH model [37]. The black dots are the three modeling sites: Högbränna in Northern Sweden, Södra Averstad in Central Sweden and Västra Torup in Southern Sweden.
Forests 12 00298 g001
Figure 2. Illustration of different model components included in the ForSAFE model and their interactions. The names of the original models combined in ForSAFE are reported in brackets. The factors driving model processes are listed on the left of the figure.
Forests 12 00298 g002
Figure 3. Comparison of modeled data (lines) to measured data (dots) for total biomass, i.e., stem, branches and leaves (a), SOC in the organic layer (b) and inorganic N, i.e., NO3 + NH4 (c). The black line represents daily modeled results, except for inorganic N in the soil solution (inorganic N) which is the moving average on a yearly basis of the daily modeled results (grey line). The years when the forest management events occurred are represented by the grey vertical lines—final felling by a solid line and thinning by dotted lines.
Forests 12 00298 g003
Figure 4. Modeled tree biomass (a), SOC in the organic layer (b) and N leaching (c) according to a fertilization scenario (red line) and a baseline scenario (black line). Vertical lines represent management activities: final felling (black solid line) and N fertilization events before final felling (grey dashed lines).
Forests 12 00298 g004
Table 1. Revised parameters regulating decomposition rates in ForSAFE. In bold: parameters modified from [41].
Poolkpot
(year−1)
f(T)g(θ)φ(pH)
Ea
(kJ mol−1)
KWnWKpH (kmol−3)m
EDCa24189.43.465,6001
Holocellulose1.1339.43.420,5001
Lignin0.17509.43.410501
Resistant0.003539.43.410501
DOC154511102.45420,5001
1. Based on data from decomposition of mixed litter [45].
Table 2. Description of the three modeled sites.
ParametersNorthern Site
(Högbränna) 1
Central Site
(Södra Averstad) 2
Southern Site
(Västra Torup) 3
Coordinates (N, E)65.41, 18.1059.01, 13.1156.14, 13.51
Year of planting191619321941
Year of final felling-20162010
Standing stem biomass (kg m−2)9443 (year 2011)11,680 (year 2010)18,841 (year 2010)
Average annual temp. (°C) 41.07.28.0
Average annual prec. (mm) 4720744859
Measured throughfall deposition 5
N deposition (kg ha−1 year−1)0.5 ± 0.24.6 ± 1.29.4 ± 1.8
S deposition (kg ha−1 year−1)0.8 ± 0.25.8 ± 3.611.7 ± 6.7
Cl deposition (kg ha−1 year−1)1.9 ± 0.429.2 ± 6.837.0 ± 8.0
Ca + Mg + Na + K dep. (kg ha−1 year−1)7.9 ± 2.137.6 ± 5.446.8 ± 7.7
Measured open field deposition 5
N deposition (kg ha−1 year−1)1.2 ± 0.26.7 ± 1.511.4 ± 2.9
S deposition (kg ha−1 yar−1)1.0 ± 0.24.4 ± 1.76.9 ± 2.0
Cl deposition (kg ha−1 year−1)1.4 ± 0.48.5 ± 3.724.8 ± 13.6
Ca + Mg + Na + K dep. (kg ha−1 year−1)3.0 ± 0.88.3 ± 4.020.8 ± 10.9
1 Deposition data for the period 1996–2015; 2 Deposition data for the period 1991–2015; 3 Deposition data for the period 1988–2010; 4 From gridded data (4·4 km) for the years 1989–2018 from weather measurement stations, Swedish Meteorological and Hydrological Institute (SMHI), luftweb.smhi.se/, April 2020. 5 Mean value ± SD
Table 3. Modified tree species parameters.
ParameterDefinition (Units)Value
FolRetenFoliage retention time (year)(1/FolRet = 0.489 − 0.0063 * Latitude)
WoodTurnoverFractional mortality of live wood (year−1)0.01 (Southern site)
0.025 (Central and Northern sites)
WUECnstConstant for calculating water use efficiency15.9
HalfSatHalf saturation constant for light (μmol/m2/s)170
Table 4. Fertilization scenarios.
SiteThinningFinal FellingFertilization (150 kg ha−1)
Northern1990, 20201915, 20552025, 2035, 2045
Central1961, 1991, 2045, 20651931, 2016, 20952067, 2076, 2085
Southern1965, 1985, 2005, 2035, 20551940, 2010, 20802057, 2064, 2070
Table 5. Fertilization effect, i.e., % difference in biomass and SOC between BAS and FERT scenario, before final felling and 20 years after final felling.
Before Final Felling20 Years after Final Felling
BiomassSOCBiomassSOC
Northern21%2%14%4%
Central6%1%4%2%
Southern5%1%7%1%
Table 6. Cumulative leaching for the BAS and FERT scenarios, from first fertilization to final felling and from final felling to 20 years after. The total N applied as fertilizer before final felling is equal to 450 kg ha−1.
SiteBefore Final Felling (kg ha−1)20 Years after Final Felling (kg ha−1)Fraction Leached (%)
BASFERTBASFERT
Northern496494820%
Central2152878834%
Southern30210605639%
Publisher’s Note: MDPI stays neutral with regard to jurisdictional claims in published maps and institutional affiliations.

