Abstract
Research Highlights: Our results provide novel perspectives on the effectiveness and collapse of compensatory mechanisms of tracheid development of Norway spruce during intra-seasonal drought and the environmental control of intra-annual density fluctuations. Background and Objectives: This study aimed to compare and integrate complementary methods for investigating intra-annual wood formation dynamics to gain a better understanding of the endogenous and environmental control of tree-ring development and the impact of anticipated climatic changes on forest growth and productivity. Materials and Methods: We performed an integrated analysis of xylogenesis observations, quantitative wood anatomy, and point-dendrometer measurements of Norway spruce (Picea abies (L.) Karst.) trees growing along an elevational gradient in South-western Germany during a growing season with an anomalous dry June followed by an extraordinary humid July. Results: Strong endogenous control of tree-ring formation was suggested at the highest elevation where the decreasing rates of tracheid enlargement and wall thickening during drought were effectively compensated by increased cell differentiation duration. A shift to environmental control of tree-ring formation during drought was indicated at the lowest elevation, where we detected absence of compensatory mechanisms, eventually stimulating the formation of an intra-annual density fluctuation. Transient drought stress in June also led to bimodal patterns and decreasing daily rates of stem radial displacement, radial xylem growth, and woody biomass production. Comparing xylogenesis data with dendrometer measurements showed ambivalent results and it appears that, with decreasing daily rates of radial xylem growth, the signal-to-noise ratio in dendrometer time series between growth and fluctuations of tree water status becomes increasingly detrimental. Conclusions: Our study provides new perspectives into the complex interplay between rates and durations of tracheid development during dry-wet cycles, and, thereby, contributes to an improved and mechanistic understanding of the environmental control of wood formation processes, leading to the formation of intra-annual density fluctuations in tree-rings of Norway spruce.
1. Introduction
Research efforts to investigate the seasonal dynamics of tree-ring development based on the repeated sampling of microcores have gained considerable momentum during the last two decades [1,2,3,4]. In contrast to dendrometer measurements that detect changes in radial or circumferential stem dimension in high spatial and temporal resolution, microcoring allows us to glance behind the stem surface and observe and model xylem and phloem phenology and cell differentiation processes during the growing season [5,6,7,8]. The acquired data increases our understanding of the endogenous and environmental control of tree-ring formation and the impact of anticipated climatic changes on forest growth and productivity [9,10]. In particular, the cell differentiation process of secondary wall thickening and lignification of cell walls is of eminent importance in forest carbon cycling, as the synthesis of non-structural carbohydrates (NSC) to components of cellulose and lignin is known to be the key process of biomass production and carbon sequestration in forest ecosystems [11,12].
The typical tree-ring structure of conifers growing in temperate climates is characterized by gradually decreasing cell radial diameters and cell lumen diameters and increasing wall thickness from earlywood to latewood cells and is assumed to be largely under endogenous control [13,14]. According to the morphogenetic-gradient hypothesis, endogenous control is executed by an auxin concentration profile, peaking at the cambial zone and decreasing in a centripetal stem direction while signaling positional information to the individual tracheids and, thereby, controlling their transition through the subsequent stages of cell differentiation as well as their final geometry and relative position within the developed tree-ring [13,15]. However, recent studies demonstrated that model-based simulations need to implement the interaction of auxin with a second biochemical signal, such as cytokinin or a TDIF peptide to realistically predict radial growth rates and zonation of cell differentiation [10,16].
Several xylogenesis studies identified compensatory mechanisms between the rate and duration of cell differentiation processes to mitigate environmental control of variations in a tree-ring structure and to maintain the structural and functional trade-offs of water transport and mechanical stability between earlywood and latewood tracheids [9,14,17,18]. Cuny and Rathgeber identified compensatory mechanisms for conifers in the Vosges mountains during earlywood and transition wood formation to modulate the effects of exogenous factors on conifer tree-ring structure, indicating that, during normal climatic conditions, wood anatomical variability is mainly under endogenous control [14]. However, during latewood formation, the same study identified temperature to positively stimulate the rate of secondary wall thickening, which provided a possible explanation for maximum latewood density to record high summer temperature conditions. Comparable compensatory mechanisms were identified for Norway spruce and European larch (Larix decidua Mill.) in the Vosges mountain and Swiss Alps, where, due to decreasing temperatures with increasing elevation, trees compensated reduced rates of most cell differentiation processes by prolonging their duration [9]. Different types of compensatory mechanisms were found for black spruce (Picea mariana (Mill.) B.S.P.) in Canada or maritime pine (Pinus pinaster Aiton) in Portugal, which responded to drought conditions by reducing the rate of cambial xylem cell production but maintain the conventional shape of conifer tracheidograms by the compensation of decreased cell differentiation rates with increasing durations [17,18]. However, no information on the kinetics of tracheid differentiation triggering valuable dendroecological signals, such as drought-induced intra-annual density fluctuations (IADFs) in tree-rings, is documented so far [18,19,20,21]. It can be speculated that such tree-ring anomalies are caused by ineffective compensatory mechanisms between the rate and duration of cell enlargement during intra-seasonal drought [14,17], as changes in radial cell enlargement and cell radial diameter strongly influence variations in other tree-ring characteristics, such as cell wall thickness and wood density as well [9].
By integrating the information on the rates of tracheid development with the number of cells in the corresponding xylogenetic phases, the seasonal dynamics of radial xylem growth and woody biomass production can be modeled in daily resolution [11,22]. This is currently the only feasible approach, which allows the daily tracking of aboveground carbon sequestration processes on the cellular and tissue level of the xylem and, thereby, enables an improved understanding of carbon fluxes within forest ecosystems [12]. The daily rate of woody biomass production and carbon sequestration (represented by the deposition of cell walls and their lignification) was documented to occur time-lagged to the daily rate of radial xylem growth (represented by cambial xylem cell production and xylem cell enlargement) by several weeks to up to one month [11,22]. It is assumed that this time-lag is also valid across boreal, temperate, subalpine, and Mediterranean biomes [11]. In addition, models of the daily rate of radial xylem growth are a benchmark for the better interpretation of the complex and ambivalent signals of high-resolution dendrometer data, where production and collapse of phloem and bark cells and temporary fluctuations of tree water status are intertwined with irreversible radial xylem growth processes, such as cambial cell divisions and radial cell enlargement [11,23,24,25]. The reversible dynamics of stem size variations during the growing season registered by the dendrometer sensors are driven by diurnal cycles of swelling and shrinking of non-lignified and elastic tissues mainly located in the bark and are caused by imbalances between root water uptake and transpiration-driven water loss [24,26]. Several straightforward modeling approaches exist to extract and separate the irreversible component of daily xylem growth rates from the reversible changes of tree water status and stem size [27,28,29,30,31,32], but the uncertainties when interpreting the complex signal of dendrometer data remain high [23,24,25]. More sophisticated approaches integrating sap flux and water potential measurements allow for a more detailed separation of the reversible and irreversible components of stem dimensional changes [25,33], but validations of radial xylem growth simulations based on dendrometer data with support of the objective reference of state-of-the-art wood formation models remain scarce [25].
This study investigates the impact of weather and climate on the kinetics of tracheid development, tracheid morphology, and the seasonal dynamics of radial xylem growth and woody biomass production of Norway spruce (Picea abies (L.) Karst.) trees growing along an elevational gradient in the Southwestern Black Forest, Germany. Micro-cores were sampled at three elevation sites (450 m, 750 m, and 1250 m a.s.l.) in weekly intervals during the growing season in 2014 on trees that were also equipped with automatic precision point-dendrometer sensors at breast height. Based on the previously mentioned findings of previous research, we examined the following working hypotheses.
- Durations of cell differentiation processes increase with elevation to compensate for generally lower temperatures and concomitant lower differentiation rates.
- Compensatory mechanisms of cell differentiation are also expected during drought periods, which would also reduce daily rates of xylem cell production and radial xylem growth. Drought would also negatively affect the daily rates of stem radial displacement and tree water status as registered by the dendrometer sensors.
- Daily rates of stem radial displacement correlate closer with daily rates of radial xylem growth compared to the rates of xylem cell production or the rates of woody biomass production. In addition, a time lag of approximately one month of the peak of the daily rate of woody biomass production compared to the peak of the daily rate of radial xylem growth is expected for all investigated elevation sites.
2. Materials and Methods
2.1. Study Sites and Tree Selection
The three study sites are located along an elevational gradient in the Southwestern Black Forest south of the city of Freiburg im Breisgau (Germany) at 450 m, 750 m, and 1250 m a.s.l., respectively [34]. The 450 m a.s.l. elevation site “Günterstal” (47.957067° N, 7.868090° E) is a beech-oak-fir forest of the Galio odorati-Fagetum type on a loamy-gritty western slope. The 750 m a.s.l. elevation site “Heibrain” (47.926254° N, 7.872882° E) is a beech-fir forest on a loamy-gritty western slope and is an intermediary type between Galio odorati-Fagetum and Luzulo-Fagetum. Both elevation sites are covered with managed forest stands, currently dominated by mature silver fir (Abies alba Mill.), Douglas fir (Pseudotsuga menziesii (Mirb.) Franco), Norway spruce, and European beech (Fagus sylvatica L.) trees, whereas the proportion of Norway spruce was considerably reduced on the 450 m elevation site by forest management activities in previous years. The research site on the 1250 m a.s.l. elevation (47.912869° N, 7.904526° E) close to the summit of the “Schauinsland” mountain is forest of the type Luzulo-Fagetum, managed for conservation and is currently dominated by mature European beech and Norway spruce trees. Cambisols are the predominant soil types throughout the study area. The three research sites represent an ecological gradient as indicated by a decrease in mean annual temperature (8.1 °C, 6.9 °C, and 4.4 °C) and an increase in a mean annual precipitation sum (1128 mm, 1446 mm, and 1683 mm) for the 450 m, 750 m, and 1250 m elevation sites, respectively [35]. Three healthy co-dominant or dominant Norway spruce trees of a similar diameter class were selected in each of the three elevation sites for dendrometer monitoring, weekly microcore sampling, and wood anatomical analysis during the growing season in 2014. More detailed information on sample tree characteristics is compiled in Table 1.

Table 1.
Sample size, arithmetic mean, and standard deviation (in parentheses) of diameter at breast height (DBH), tree height, height of crown base, crown percentage, and cambial age at breast height of the studied Norway spruce trees grouped by elevation. All trees were selected for dendrometer monitoring, microcore sampling, and wood anatomical analyses during 2014.
2.2. Environmental Data
To monitor environmental conditions during the growing season, each of the three research sites was equipped with an HMP sensor (type 45C or 55C, Campbell Scientific, Logan, UT, USA) for relative humidity (%) and air temperature (°C) measurements in 1997. The sensors were installed two meters above ground below an opening in the canopy of the forest stand. In addition, soil matrix potential has been measured at each site since 2013 using two pF-meters (EcoTech GmbH, Bonn, Germany) installed in 30-cm and 60-cm soil depth, respectively. The environmental variables were recorded by Campbell Scientific data loggers (Logan, UT, USA) in time intervals of 15 min. To gain more representative results, the daily mean values of soil matrix potential at the two soil depths were averaged within each site. Daily precipitation sums for each site were obtained based on 1-km2 grid data of the German Meteorological Service (DWD). Modeled data of the daily sum of global radiation on inclined surfaces (1/100 MJ m−2) were obtained from the “NFI 2012 environmental data base climate” based on a 250 m × 250 m resolution grid [36].
2.3. Dendrometer Measurements
For direct comparisons with xylogenesis observations and analysis of the effects of climate and weather on stem radial displacement, each sample tree was equipped with an electronic point-dendrometer sensor before the onset of the growing season in 2014. Dendrometer sensors were mounted at 1.40-m stem height and perpendicular to the direction of the slope to avoid possible influences of compression wood formation on the measurements. The dendrometer type is based on a linear displacement transducer (Trans-Tek Inc., Ellington, CT, USA) in a stainless steel cylinder that registers the changes of stem radial displacement with an accuracy of approximately 1 µm [37]. The measurements took place in time intervals of 15 min and were recorded by data loggers of Campbell Scientific (Logan, UT, USA).
2.4. Microcore Sampling and Preparation
To assess cambial cell divisions and cell differentiation processes, microcores were sampled during the complete growing season in 2014 in weekly intervals from the dendrometer trees using the Trephor tool [3]. Tree-ring phenology and wood formation dynamics might vary considerably at opposite sides of the trunk [37]. To ensure a better compatibility with dendrometer measurements, we sampled the microcores exclusively within an extraction field that encompassed 1/3 of the stem circumference, i.e., 1/6 to the left side and right side of the dendrometer sensor, respectively. Microcores were sampled below the dendrometer sensors and sequentially along ascending rows from left to right in the extraction field, warranting a minimum vertical distance of 30 cm between the uppermost extraction row and the point-dendrometer sensor. Microcores were sampled at locations that were 2.5 cm apart in the horizontal and vertical direction, respectively. Subsequent rows started 10 cm above previous rows. In the field, microcores were placed immediately in Eppendorf microtubes in a solution of 50% ethanol and then stored in the laboratory at 5 °C to avoid tissue disintegration until further processing. Microcores were then dehydrated in increasing ethanol concentrations and embedded in blocks of glycolmethacrylate (Technovit 7100, Heraeus Kulzer GmbH, Hanau, Germany) [35]. Thin sections of 15–20 µm thickness were taken from the polymerized blocks using the GSL-1 microtome [38], stained with Cresyl Violet Acetate (0.16% in 100 mL distilled water), and mounted on glass slides using Canada balsam.
2.5. Microscopic Observations of Tracheid Differentiation
With support of a Nikon Eclipse Ni-E transmission light microscope (Nikon Corporation, Düsseldorf, Germany), we first collected raw data by counting for each tree j within elevation site i and at each sampling date t and tracheid file f, the number of cambial cells (nCi,j,f,t), cells in radial enlargement (nEi,j,f,t), cells in secondary wall thickening (nWi,j,f,t), and mature cells (nMi,j,f,t) along three tracheid files of the developing tree-ring within each prepared thin section of the microcores. Cambial cells were identified by thin primary cell walls and small cell radial diameters. The border between cambial zone and enlarging cells was defined by the irreversible transition of cell radial diameters across the threshold of 14 µm, which corresponds to twice the radial diameter of an average cambial cell [11]. Secondary wall thickening cells were identified by birefringence in polarized light as well as by protoplasmic contents within the cell lumina and purple colorations within the stained cell walls. Mature cells were recognized by an absence of protoplasmic contents and entirely blue cell walls, indicating completed lignification [39].
2.6. Wood Anatomical Measurements
Wood anatomical analysis was conducted to investigate the effects of weather and climate on the intra-annual variations of wood anatomical variables in order to model the rates of tracheid development during the growing season in 2014. In 2015, the dendrometers were removed and increment cores (5 mm in diameter) were sampled at the previous locations of the dendrometer sensors using a Haglöf borer (Haglöf Sweden AB, Långsele, Sweden). The cross-sections of the wood samples collected from each tree were prepared with an ultra-precise diamond fly cutter [40] and, subsequently, cross-dated using the tree-ring measurement system PAST4 (SCIEM, Vienna, Austria). Segments of the increment cores including the tree-ring of the year 2014 were preconditioned with a corn-starch solution and thin sections of 15–20 µm thickness were prepared with the GSL-1 microtome followed by double-staining in a mixture of Safranin and Astra-blue to optimize contrasts for automatic image analysis [38,41].
High resolution scans (0.49 µm px−1) of the thin sections were taken with a color camera (Nikon DS-Fi2, 5 megapixels and 12-Bit color depth) mounted on a Nikon Eclipse Ni-E transmission light microscope (Nikon Corporation, Düsseldorf, Germany). The microscope is equipped with a motorized X/Y/Z table that enables the automatic scanning and stitching of picture sequences with support of the NIS-Elements software (Version 4.20.01, Nikon Corporation, Düsseldorf, Germany).
Cell lumen radial diameter (LRDi,j,f,c), cell lumen tangential diameter (LTDi,j,f,c), cell wall tangential thickness (WTTi,j,f,c) in µm as well as cell lumen cross-sectional area (LCAi,j,f,c) in µm2 of each cell c within tracheid file f were measured along five files in total within each tree-ring using Image Pro Plus 7.0 (Media Cybernetics Inc., Rockville, MD, USA) in combination with a binary image analysis algorithm that we developed in the R programming environment [42].
2.7. Modeling and Statistical Data Analyis
All calculations, including modeling and statistical data analyses, within this study were conducted in the R programming environment [42]. A list of abbreviations used in this study with their definitions and units is compiled in Table A1.
2.7.1. Modeling Cell Numbers in Subsequent Cell Differentiation Stages
Based on the collected xylogenesis raw data, we modeled for each individual tree j within elevation site i and day of year t, the number of cambial cells (nCi,j,t), enlargement cells (nEi,j,t), secondary wall thickening cells (nWi,j,t), mature cells (nMi,j,t), cells with secondary cell walls (nWMi,j,t = nWi,j,t + nMi,j,t), and total number of xylem cells (nEWMi,j,t = nEi,j,t + nWi,j,t + nMi,j,t) using a sequence of methods of data normalization and harmonization steps, followed by smoothing procedures involving generalized additive mixed models (GAMMs, R package mgcv) and shape constrained additive mixed models (R package scam) [43,44,45]. A more detailed description and illustration of xylogenesis modeling, including model validation, is provided in the supplementary material (Figures S1–S6, Tables S1–S3). For further analysis, the tree individual fits of the mixed models were averaged for each elevation on the stand level.
2.7.2. Modeling and Alignment of Wood Anatomical Profiles
To link xylogenesis information to the measured wood anatomical variables, we first rescaled the number of tracheids in each measured file to the total number of cells produced during the growing season within the corresponding elevation site based on the upper asymptote nTi of the xylogenesis models. Tracheid numbers and measured wood anatomical variables were then estimated at equidistant relative tree-ring positions x = {1%, 2%,…, 100%} by fitting cubic smoothing splines to the tree level raw data using the smooth.spline() function in R (Figures S7–S15). To assess the goodness-of-fit and to quantify the accuracy of the models fitted to the normalized xylogenesis count data and wood anatomical raw measurements, the modeling efficiency, mean absolute error, and mean absolute percentage error is provided in the Supplementary Material (Tables S1–S3) [44,46]. We then used linear interpolation to estimate the corresponding lumen radial diameter (LRDi,j,c), lumen tangential diameter (LTDi,j,c), cell wall tangential thickness (WTTi,j,c) in µm as well as cell lumen cross-sectional area (LCAi,j,c) in µm2 for each tracheid number within the tree-ring based on the predicted values of the cubic, smoothing splines.
Multiple interval-based curve alignment (MICA) was applied to average the tree individual data and stabilize common environmental signals in the wood anatomical profiles at the stand level (Figure S16) [47,48,49]. The MICA algorithm is designed to automatically align and synchronize corresponding inflection points and local extreme values of given wood anatomical or wood density profiles. We chose lumen radial diameter (LRDi,j,c) for the MICA alignment procedure, as it contained the highest modeling efficiency and integrates the signals of the cell enlargement as well as the secondary wall thickening phase. The transformed cell numbers of the MICA alignment to generate stand level consensus profiles of LRDi,c were also used to transform and average the corresponding wood anatomical profiles for LTDi,c, WTTi,c, and LCAi,c. Based on the initial measurements and their MICA aligned cubic smoothing spline predictions, we then derived the additional wood anatomical variables, cell radial diameter (CRDi,c), cell tangential diameter (CTDi,c), cell cross-sectional area (CCAi,c), and cell wall cross-sectional area (WCAi,c) based on the equations of Cuny et al. [7,9]. In addition, we calculated Mork’s Criterion (MCi,c = (WTTi,c x 4)/LRDi,c) and classified cells according to their morphology into earlywood and latewood [50]. An overview on the acquisition and calculation of all wood anatomical variables within this study is given in Table S4.
2.7.3. Durations and Rates of Tracheid Development
Based on the inverse functions of the equations of nEWMi,t, nWMi,t, and nMi,t, we calculated the duration d that each cell c has spent in the enlargement phase (dEi,c) and the secondary wall thickening phase (dWi,c) based on the approach described by Cuny et al. [44]. We assumed that cambial cells at the transition to the cell enlargement stage have individual cell tangential diameters (CTDi,c) corresponding to their final tangential diameter, as calculated in Table S4. In addition, we assumed a constant cambial cell radial diameter (CCRD) of 7 µm and primary cell wall thickness (PWT) of 0.5 µm [11]. The cambial cell wall cross-sectional area (CWCAi,c) in µm2 at the transition stage to cell enlargement was calculated according to Equation (1).
CWCAi,c = 2 × CCRD × PWT + 2 × CTDi,c × PWT
The cell cross-sectional area of a cambial cell (CCCAi,c) in µm2 of each tracheid at the transition stage between the cambial zone and cell enlargement was calculated according to Equation (2).
CCCAi,c = CCRD × CTDi,c
Based on the definitions above that cambial cells at the transition stage to cell enlargement already have a predefined cell radial diameter (CCRD) as well as an individual cell cross-sectional area (CCCAi,c) and wall cross-sectional area (CWCAi,c), the rate of radial cell enlargement (rEi,c) in µm day−1, the rate of cell cross-sectional area enlargement (rAi,c) in µm2 day−1, and the rate of secondary wall thickening (rWi,c) in µm2 day−1 of each cell c, and elevation site i were calculated according to Equations (3)–(5).
rEi,c = (CRDi,c − CCRD)/dEi,c
rAi,c = (CCAi,c − CCCAi,c)/dEi,c
rWi,c = (WCAi,c − CWCAi,c)/dWi,c
Based on the information of the rate and duration of cell enlargement and secondary wall thickening of each tracheid, we could now derive the average daily rates of wood formation processes including all tracheids undergoing cell differentiation. To calculate the average daily rates of radial cell enlargement rEi,t (µm day−1 cell−1) and cell cross-sectional area enlargement rAi,t (µm2 day−1 cell−1), we averaged for each day of year t the previously mentioned calculated rates of all cells currently in the enlargement process. To calculate the average rates of secondary wall thickening rWi,t (µm2 day−1 cell−1), we averaged the rates of all cells being currently in the secondary wall thickening process for each day of the year. When modeling the daily rate of xylem cell production rCi,t (cells day−1) [51], we did not include the cambial cells in the cumulative cell count nEWMi,j,t, as for major proportions of the growing season, the cambial zone produces xylem and phloem cells simultaneously [52]. Therefore, rCi,t was modeled exclusively based on new tracheids unambiguously contributing to the accumulation of xylem cells and, therefore, was derived by the first order differences of the daily sums of enlargement, wall thickening, and mature xylem cells (rCi,t = nEWMi,t − nEWMi,t−1).
In addition, we linked the duration and rate of tracheid enlargement and cell radial diameter on a temporal scale, by calculating the average day of year of its enlargement process for each cell. The temporal annotation of the duration and rate of wall thickening and wall cross-sectional area was attributed by calculating the average day of year of its secondary wall thickening process for each cell.
2.7.4. Daily Rate of Radial Xylem Growth and Woody Biomass Production
Based on the cell production rates, the rates of tracheid development and the number of cells in the enlargement phase, we also calculated for each day of year t the rate of radial xylem growth rRGi,t in µm day−1 as follows:
where the product of rEi,t and nEi,t accounts for the contribution of cell enlargement and the product of the cell production rate rCi,t and the cambial cell radial diameter CCRD accounts for the contribution of cambial xylem cell production to the daily rate of radial xylem growth, respectively.
rRGi,t = rEi,t × nEi,t + rCi,t × CCRD
For the modeling of the daily rate of aboveground woody biomass production, we first calculated the cell wall proportion (CWPi,t) of a developing tracheid file using Equation (7).
where the product of rWi,t′ and nWi,t′ accounts for the contribution of secondary wall thickening and the product of rEi,t′ and nEi,t′ accounts for the contribution of cell enlargement, assuming that each cell has two radially enlarging cell walls of 0.5 µm primary wall thickness (PWT), to the increase of biomass in a tracheid file. In addition, the product of rCi,t′ and CWCAi,t′ accounts for the biomass contribution of primary cell wall material due to cambial xylem cell production. The product of rAi,t′ and nEi,t′ represents the contribution of cell cross-sectional area enlargement and the product rCi,t′ and CCCAi,t′ denotes the contribution of cambial xylem cell production to the increase in size of the tracheid file. As we linked xylogenesis data with wood anatomical measurements, we could derive the corresponding values of CCCAi,t′ and CWCAi,t′ from the function of nEWMi,t for each day of year. The quotient of the cumulative numerator by the cumulative denominator represents the daily fraction of cell wall material within a developing tracheid file.
The xylem apparent density (XADi,t) was then calculated by multiplying CWPi,t with the estimated cell wall density of 1.509 g cm3 [22,53]. Based on the assumption of a carbon content of 50% [54], the aboveground woody biomass production (AWPi,t) in gC tree−1 and the rate of woody biomass production (rAWPi,t) in gC day−1 tree−1 were calculated based on the following equations [11,22].
where Fi is the form coefficient of the stem [55], Hi is the tree height, DBHi is the diameter at breast height, both averaged for every elevation site i before the onset of the growing season, whereas XADi,t and rRGi,t were calculated as described above. All metric units in Equation (8) were converted to centimeters.
rAWPi,t = AWPi,t − AWPi,t−1
2.7.5. Linear Mixed-Effects Modeling
For a better understanding of the effects of environmental variables on the kinetics of tracheid development during earlywood and latewood formation, linear mixed-effects models (R package nlme [56]) were formulated for earlywood and latewood separately, as follows:
where y is the response variable (dEi,c, rEi,c, dWi,c, or rWi,c), β0 is the intercept, β1TM, β2RD, β3TP, β4MP, and β5RH denote the fixed effects of time (i.e., day of year), global radiation, air temperature, soil matrix potential, and relative humidity, each averaged for the duration of cell enlargement (for the response variables dEi,c, rEi,c) or wall thickening (for the response variables dWi,c, rWi,c) of the corresponding cell c [14], whereas b0 represents the random intercept accounting for the repeated measures of each elevation site i, b1,i × TMi,c denotes the random slope allowing the changes in the response variables to vary over time, and ε is the residual error term. To ensure model convergence, the random part was confined to the intercept for the rates of cell differentiation of latewood cells. To account for non-independence and to reduce temporal autocorrelation, a first order autocorrelation structure with a continuous time covariate was applied to the residuals [56]. Due to variance inflation factors above 5 and high collinearity with radiation, we removed relative humidity as a fixed effect in the models predicting the kinetics of wall thickening of earlywood cells [57]. In addition, we calculated the marginal and conditional R2 of the linear mixed-effects models with support of the R package MuMIn [58]. Earlywood and latewood categorization of cells for the modeling of the kinetics of tracheid development with environmental factors was based on the irreversible transition of the value of the Mork’s Criterion above 1 within a tracheid file [50].
yi,c = β0 + β1TMi,c + β2RDi,c + β3TPi,c + β4MPi,c + β5RHi,c + b0,i + b1,i × TMi,c + εi,c
2.7.6. Correlations between Intra-Annual Growth Models
With support of the R package scam, we fitted shape constrained additive models to the dendrometer data on the individual tree level to isolate the irreversible growth component in the stem radial displacement raw data from reversible fluctuations caused by volatile changes in tree water status [30,45]. Model predictions were averaged on the elevational level and their first-order differences were used to derive the daily rate of stem radial displacement (rRDi,t) in µm day−1 as a possible proxy for the rate of radial xylem growth (rRGi,t) as modeled by the xylogenesis data. In addition, we calculated based on the dendrometer raw data, the monthly mean daily course of radial displacement for an explorative comparison of the changes in stem circadian cycles between elevation sites and during the growing season [59].
Bivariate correlation analyses based on the Pearson correlation coefficient were used to detect and quantify for each elevation site the statistical relationships between the rate of stem radial displacement (rRDi,t), xylem cell production (rCi,t), rate of radial xylem growth (rRGi,t), and rate of aboveground woody biomass production (rAWPi,t). We applied first-order differencing of the modelled growth data to reduce effects of non-stationarity characteristics of the individual time series prior to the correlation analyses [60].
3. Results
3.1. Characterization of the Environmental Conditions during the Observation Period
For most parts of the growing season, lower values of mean air temperature (Figure 1a–c) and higher values of relative humidity (Figure 1d–f) were measured with increasing elevation. In contrast, the average level of the daily sum of global radiation did not differ significantly between the elevation sites and reached its general maximum in June (Figure 1g–i).
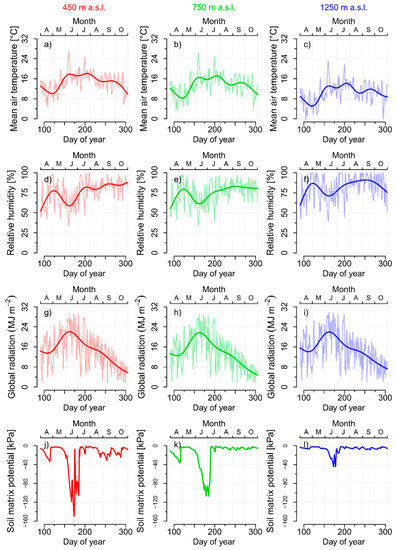
Figure 1.
Daily mean values and GAM (generalized additive model) smoothing curves of in situ measurements of air temperature (a–c), relative humidity (d–f), and of modeled values of the daily sum of global radiation on inclined surfaces (g–i). Daily mean values of in situ measurements of soil matrix potential (j–l), all for the 450 m (left), 750 m (center), and 1250 m a.s.l. (right) elevation sites, respectively, during the growing season in 2014.
June was characterized by high atmospheric evaporative demand as indicated by a distinct local minimum of relative humidity and a seasonal peak of daily mean air temperature, especially pronounced at the 450 m elevation site. In addition, the soil matrix potential decreased sharply during the first half of June and reached its seasonal minimum during the last weeks of this month (Figure 1j–l). This intra-seasonal drought period in June was most distinct at 450 m elevation, where soil matrix potential temporarily fell below −140 kPa. In contrast, soil matrix potential increased sharply at the beginning of July and remained at relatively high levels for the remaining part the growing season.
To detect possible anomalies of the climatic conditions during the growing season in 2014, monthly means of air temperature and relative humidity as well as the monthly sums of precipitation and the cumulative, daily, climatic water balance were compared with the 20-year baseline climate period of 1997–2016 (Figure 2). At the 450 m elevation site, monthly mean values of air temperature during most spring, autumn, and winter months were higher than the multi-year average of the baseline climate period. During the summer, only June was clearly warmer than average, but no distinct temperature anomalies were detected in general (Figure 2a). In contrast, monthly averages of relative humidity were extremely low in June (Figure 1b). Monthly precipitation sums were constantly below average in the spring and early summer with negative anomalies in March and June. However, July 2014 was an extraordinary humid month and climate anomaly, due to over 150 mm more precipitation than the average of the baseline climate period (Figure 1c). Climatic water balance was anomalously low in March and June, but extremely high in July of the 2014 observation period (Figure 1d). Similar patterns of monthly climate anomalies were observed for the 750 m and 1250 m elevation sites (Figures S17 and S18).
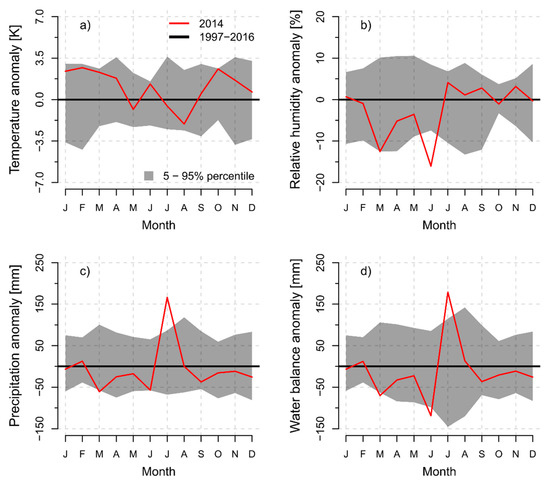
Figure 2.
Monthly anomalies of (a) air temperature, (b) relative humidity, (c) monthly precipitation sum, and (d) climatic water balance (modeled according to Haude [61]) for the 450 m a.s.l. site during 2014 as a deviation from the 20-year baseline climate period of 1997–2016 (bold horizontal zero line). Shaded areas represent the 5th and 95th percentile of the annual deviations of the 20-year mean values for the baseline climate period.
3.2. Timings of Tracheid Development
The first earlywood cells started their enlargement process at day of year (DOY) 104, DOY 106, and DOY 129 for the 450 m, 750 m, and 1250 m elevation sites, respectively (Figure 3a–c). A more pronounced delay with increasing elevation was present for the first cells entering the process of secondary wall thickening (DOY 117, DOY 125, and DOY 146), whereas the first earlywood cells reached cell maturity at DOY 139 (450 m), DOY 142 (750 m), and DOY 163 (1250 m). The last latewood cells ceased their enlargement and secondary wall thickening processes at DOY 243 and DOY 301 (450 m), DOY 271 and DOY 306 (750 m), and DOY 235 and DOY 281 (1250 m), respectively.
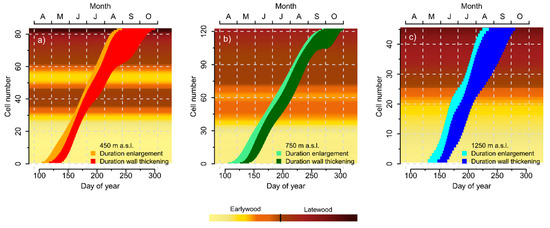
Figure 3.
Timings of the individual tracheids in the cell enlargement and secondary wall thickening phase for the (a) 450 m, (b) 750 m, and (c) 1250 m a.s.l. elevation sites, respectively. Background colors reflect its Mork’s Criterion (MC) for each cell, according to earlywood (MC < 1) and latewood (MC ≥ 1) morphology, as defined in Denne [50].
Latewood cells generally remained shorter time periods in the cell enlargement than in the secondary wall thickening phase (Figure 3a–c). Furthermore, a weak tendency of decreasing enlargement duration was observed from the earlywood to latewood proportion of the tree-rings. In contrast, a distinct trend of increasing duration of secondary wall thickening generally occurred during the course of the growing season.
At 450 m in elevation, a distinct intra-annual density fluctuation (IADF) was formed in June and July of the growing season in 2014 (Figure 3a). The first tracheids with latewood morphology started their formation on DOY 166, but cells that started cell enlargement between DOY 179 and DOY 198 again displayed earlywood characteristics before definite latewood formation began on DOY 199. Tracheids formed in June had very short residence times in the cell enlargement phase compared to May and July, but their duration of secondary wall thickening was not conspicuously long. At the 750 m elevation, a similar wood anatomical pattern was observed during June, but the IADF appeared only attenuated and actual latewood formation did not start before DOY 200 (Figure 3b). No deviations of the typical pattern of earlywood to latewood transition were detected in the tree-ring structure of the 1250 m elevation site, where latewood formation was initiated at DOY 188 (Figure 3c). The 750 m elevation site was the most productive during the growing season of 2014 with 122 tracheids formed in comparison to 83 tracheids at 450 m and only 45 tracheids at the 1250 m elevation sites.
3.3. Average Kinetics of Tracheid Development in Earlywood and Latewood
Average durations of radial cell enlargement and wall thickening in earlywood increased with elevation (Figure 4a,b). In comparison to earlywood, the average duration of cell enlargement in latewood was considerably shorter at the 750 m and 1250 m elevation sites. However, only slight reductions were detected at the 450 m elevation (Figure 4a). The longest average wall thickening duration was observed in the latewood of the 450 m elevation, which is followed by the 1250 m and the 750 m elevation sites (Figure 4b).
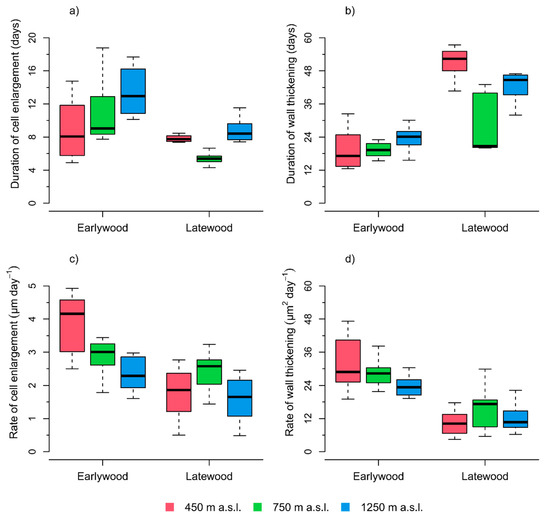
Figure 4.
Boxplots of (a) the durations of cell radial enlargement, (b) durations of wall thickening, (c) rate of radial cell enlargement, and (d) rate of wall thickening for earlywood and latewood tracheids of the 450 m, 750 m, and 1250 m a.s.l. elevation sites, respectively. The boundary for grouping earlywood and latewood cells was based on the irreversible transition of the Mork’s Criterion > 1 (see Figure 3).
In earlywood, the average rates of tracheid enlargement and wall thickening were decreasing with increasing elevation. Rates of cell differentiation were generally lower in the latewood fraction and no clear relations with elevation were detected (Figure 4c,d).
3.4. Seasonal Variation of Kinetics of Tracheid Development
At the beginning of the second half of June, a local minimum of the duration of cell enlargement was detected at the two lower elevation sites, particularly at the 450 m elevation (Figure 5a). In contrast, the 1250 m elevation had a local minimum after the first week of June and prolonged cell enlargement duration until the end of June.
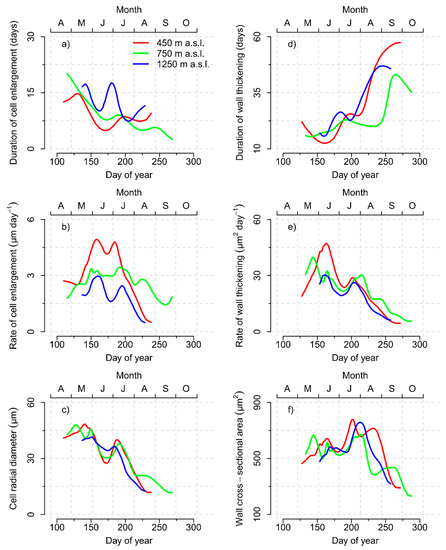
Figure 5.
Seasonal variation of (a) the durations and (b) the rates of radial cell enlargement and (c) temporally annotated cell radial diameters. Seasonal variation of (d) the durations and (e) rates of wall thickening and (f) the temporally annotated cell wall cross-sectional areas for the 450 m, 750 m, and 1250 m a.s.l. elevation sites, respectively. Temporal annotation was conducted by calculating the average day of year (DOY) of enlargement (c) or average DOY of wall thickening (f) for each cell.
The 450 m elevation showed a parabolic seasonal pattern of the enlargement rates during the growing season with the highest rates in the first weeks of June and July and a short local minimum during the second half of June (Figure 5b). In addition, the 750 m and 1250 m elevation sites showed slight parabolic patterns with the exception of low enlargement rates in the second half of June before increasing until the middle of July. The 450 m and 1250 m elevations eventually decreased their enlargement rates in August, whereas the 750 m elevation remained on higher levels in comparison until the end of cell enlargement in September.
As a consequence of temporarily low durations and rates of cell enlargement, cell radial diameters at the 450 m and 750 m elevation showed a distinct intra-annual cell diameter fluctuation in the second half of June (Figure 5c). The low enlargement rates at the 1250 m elevation in the second half of June were compensated by the concomitantly increased duration of enlargement, resulting in a much more attenuated intra-annual cell diameter fluctuation in comparison.
Duration of cell wall thickening showed a general trend to increase during the growing season with mostly asynchronous local minima between the elevations (Figure 5d). The rate of wall thickening reached at all elevations an early seasonal maximum before dropping during June with subsequent recovery until the middle of July (450 m and 1250 m) or beginning of August (750 m) (Figure 5e). After relatively small wall cross-sectional areas produced at the end of June and, as a consequence of recovering rates and medium durations of wall thickening, the seasonal maximum of wall cross-sectional area was reached during the middle of July at 450 m or the end of July at 750 m and 1250 m elevation, respectively (Figure 5f).
3.5. Environmental Control of Kinetics of Tracheid Development
A positive effect of soil matrix potential was identified as the only significant environmental driver when predicting the duration of enlargement of earlywood cells (Table 2). No significant effects of any predictor variable were detected for the rate of cell enlargement of earlywood cells, even though the positive effect of air temperature was close to significant (p < 0.06). Temperature was also the only significant environmental driver when modeling the kinetics of wall thickening of earlywood cells with negative and positive effects on the duration and rate, respectively.
Table 2.
Parameter estimates, standard errors, t-statistics, and p-values of fixed effects of linear mixed-effects models to predict the duration of cell enlargement, rate of cell enlargement, duration of cell wall thickening, and rate of cell wall thickening of earlywood cells.
The variance explained by the fixed effects was only moderate when modeling the durations of enlargement (marginal R2 = R2 M = 31%) and wall thickening (R2 M = 34%), but low for the rates of enlargement (R2 M = 5%) and wall thickening (R2 M = 11%) of earlywood cells. Only in the case of the duration of wall thickening, a significant amount of additional variance could be attributed to the random effects (conditional R2 = R2 C = 47%).
Significant effects of the environmental factors soil matrix potential and relative humidity were detected when modeling the duration of enlargement of latewood cells (Table 3). A negative influence of relative humidity was detected as the only significant environmental predictor variable when modeling the rate of enlargement of latewood cells. When modeling the duration of wall thickening of latewood cells, only soil matrix potential was detected as a significant environmental effect. The rate of wall thickening of latewood cells was significantly influenced by the positive effects of the environmental predictor variables soil matrix potential and, in particular, air temperature.
Table 3.
Parameter estimates, standard errors, t-statistics, and p-values of fixed effects of linear mixed-effects models to predict the duration of cell enlargement, rate of cell enlargement, duration of cell wall thickening, and rate of cell wall thickening of latewood cells.
The variance partitions attributed to the fixed effects when modeling the kinetics of tracheid development of latewood cells were low for the duration of enlargement (R2 M = 4%), moderate for the rate of enlargement (R2 M = 25%), and duration of wall thickening (R2 M = 34%), but relatively high for the rate of wall thickening (R2 M = 69%). A significant additional amount of variance explained by the random effects was only identified in case of the duration of wall thickening (R2 C = 69%).
3.6. Seasonal Dynamics of Stem Radial Displacement
Trees at the 450 m and 750 m elevation increased their radial stem size rather synchronous in the second half of April (Figure 6a). Stem radial displacement of the trees at 450 m elevation stagnated during June, before increasing substantially again in July and reaching a distinct plateau in August. In contrast, size of the trees growing at a 750 m elevation showed almost no stagnation during June and trees increased their dimension until the end of September. However, trees showed continuous shrinkage during October, leading to considerable discrepancies between the fits of the shape constrained additive model and the dendrometer raw data. Trees at 1250 m did not show a clear trend of increasing stem size before the beginning from June and, finally, reached a plateau during the first weeks of August.
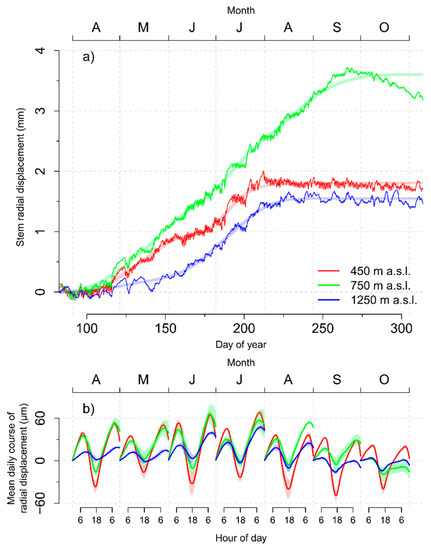
Figure 6.
(a) Seasonal variation of cumulative stem radial displacement with fits of shape constrained additive models and (b) mean daily course of stem radial displacement of trees growing at 450 m, 750 m, and 1250 m a.s.l. elevation, respectively. Transparent ribbons indicate the standard error of the estimate.
Daily amplitudes (i.e., the difference between the morning maximum and the late afternoon minimum of stem size) decreased with increasing elevation and were higher during the summer months when compared to spring or autumn (Figure 6b). The 450 m elevation reached net gains (i.e., positive increments between two subsequent maxima) of average daily stem size changes during April, May, and July. In contrast, June showed only a small positive increment and a high amplitude caused by pronounced stem shrinkage processes during the daytime. In contrast, trees growing at the 750 m elevation showed net gains of average daily stem size changes during all months except for October, whereas clear positive increments at 1250 m elevation were limited to June, July, and August.
3.7. Seasonal Dynamics of Radial Xylem Growth and Woody Biomass Production
At 450 m elevation, the daily rate of radial displacement (i.e., the first derivative of the shape constrained additive model in Figure 6a as an estimator for daily radial xylem growth) started to increase in April and showed a distinct local minimum during June (Figure 7a). The highest rates were registered in the first half of July (DOY 189). The daily rate of xylem cell production also increased during April, and reached its maximum at the end of July (DOY 208) before falling to zero at the end of August (Figure 7b). In contrast, the maximum number of cambial cells was already reached in the first half of June (DOY 165). The daily rate of radial xylem growth showed synchronous onset and cessation as xylem cell production, reached its maximum already at the end of May (DOY 151), and showed a distinct and local minimum during the second half of June synchronized with the number of enlargement cells. The rate of woody biomass production at 450 m elevation increased sharply in May, before reaching the annual maximum during the first half of June (DOY 162) before reaching a local minimum at the beginning of July and recovering again until August (Figure 7d). The number of cells in secondary wall thickening showed a left-skewed seasonal distribution with reaching a late maximum at DOY 237. The rate of radial displacement at 450 m elevation correlated best with the rate of radial xylem growth (r = 0.59, p < 0.0001), which was followed by the rate of xylem cell production (r = 0.20, p < 0.001) and woody biomass production (r = −0.02, p > 0.05).
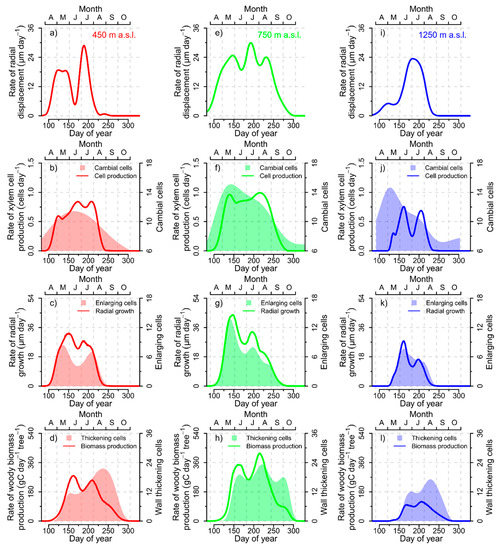
Figure 7.
(a) Daily rate of stem radial displacement, (b) daily rate of xylem cell production and number of cambial cells, (c) daily rate of radial xylem growth and number of enlarging cells, and (d) daily rate of woody biomass production and number of cells in secondary wall thickening for the 450 m a.s.l. elevation site. The same list of variables is displayed for the 750 m (e–h) and 1250 m a.s.l (i–l) elevation sites, respectively.
The rate of radial displacement at 750 m elevation started to increase already before April and reached its maximum at the beginning of July (DOY 193) (Figure 7e). Local minima were detected in the middle of June and beginning of August before rates continued to decline toward zero in the middle of October. The rate of xylem cell production at 750 m increased in April, showed a slight bimodal pattern with maximum rates occurring at DOY 216, and falling to zero before the beginning of October (Figure 7f). In contrast, the maximum number of cambial cells was already reached in May. Rate of radial xylem growth increased in April, reached its maximum at the end of May (DOY 147), and showed together with the number of enlarging cells a clear bimodal pattern with a local minimum in June (Figure 7g). The rate of woody biomass production showed a local minimum at the beginning of July, before peaking at DOY 215 only shortly before the number of wall-thickening cells did culminate (DOY 222) (Figure 7h). The daily rate of radial displacement at 750 m elevation correlated best with the rate of radial xylem growth (r = 0.78, p < 0.0001), which was followed by the rate of xylem cell production (r = 0.52, p < 0.0001) and woody biomass production (r = 0.22, p < 0.001).
At 1250 m elevation, the daily rate of radial displacement showed already moderate increases during April (Figure 7i), while xylem cell production and rate of radial xylem growth did not increase before the beginning of May (Figure 7j–k). However, all three models approached the zero line at about the same time during the second half of August. The rate of radial displacement reached its maximum at the beginning of July (DOY 183), while the rate of xylem cell production (DOY 162) and radial xylem growth (DOY 161) reached their seasonal maximum over 20 days earlier. The rate of xylem cell production and radial xylem growth also showed local minima at the beginning of July. These bimodal patterns were not reflected in the right-skewed seasonal distributions of cambial cells or enlargement cells. The rate of woody biomass production showed only a slight bimodal pattern and peaked at DOY 206 (Figure 7l). The rate of radial displacement showed the highest correlations with the rate of woody biomass production (r = 0.43, p < 0.0001), which was followed by the rate of radial growth (r = 0.37, p < 0.0001) and xylem cell production (r = 0.26, p < 0.0001).
4. Discussion
4.1. Effectiveness and Collapse of Compensatory Mechanisms during Tracheid Development
Previous studies detected durations of cell enlargement to decrease, but durations of wall thickening to increase from earlywood to latewood and from the beginning toward the end of the growing season [7,18,62]. This tendency could be recognized for the duration of wall thickening, but clear deviations from this assumption were identified for the duration of cell enlargement. Trees at the 1250 m elevation responded to decreasing rates of cell enlargement during the water deficit period in June by prolonging the duration of cell enlargement, which is a similar and effective compensatory mechanism to mitigate the effect of drought on the tree-ring structure as documented for Picea mariana in the boreal forest and Pinus pinaster in the Mediterranean region [17,18]. However, in contrast to previous findings, no such compensatory mechanism was identified for trees growing at the more drought-prone 450 m elevation. Here, parallel to the reductions of the rate of cell enlargement, the durations of enlargement reached their seasonal minimum. The process of cell enlargement is closely linked to positive turgor pressure, which decreases during periods of increasingly negative hydrostatic pressure in xylem conduits and low stem water potentials caused by high evapotranspiration rates and low soil matrix potential [63,64]. In addition to the precondition of sufficient water supply, cell turgor is regulated by osmotic adjustments via the accumulation of free sugars and amino acids in the protoplasm of the enlarging cells [64,65]. Besides the compensation of the effect of reduced turgor pressure, trees growing at 1250 m elevation might have prolonged their enlargement duration due to lower availability of non-structural carbohydrates during drought, effectively decelerating the synthesis and deposition of lignocellulose components of secondary cell walls [65]. The more severe drought conditions at 450 m elevation might have prematurely ended cell individual enlargement processes by collapsing turgor pressure as a result of drought stress and plasmolysis due to the reallocation of soluble sugars for maintenance respiration of tree physiological processes with higher relevance for tree survival [66,67,68]. As an isohydric tree species, Norway spruce reduces stomatal conductance during drought, which minimizes water loss and maintains stem and leaf water potentials, but has the effect of simultaneously inhibiting photosynthetic capacity [69]. A possibly lower availability of carbon for structural growth processes was also indicated by the synchronous decrease of the rate of wall thickening during June at all three elevations, which was partly compensated by increased durations, as it was also documented for black spruce and maritime pine [17,18]. However, in comparison with the more immediate negative effects of water deficit on turgor pressure, cambial activity, and cell enlargement, the process of photosynthesis is considered less sensitive and more resilient to drought [25,70].
Trees at all elevations responded immediately to the improved growing conditions in July, which were characterized by abundant precipitation and an extraordinarily positive climatic water balance. Recovering rates of cell enlargement and wall thickening were observed at all elevations. Under controlled experimental conditions, rates of cell differentiation of Picea mariana saplings were also positively stimulated by irrigation in comparison to samples undergoing 20 days of artificial drought in early summer [17]. However, in the same study kinetics of cell differentiation that remained inversely coupled, i.e., low rates were accompanied by long durations and vice versa.
After recovery of soil water availability starting from the end of June, we observed tendencies of simultaneously increasing rates and durations of cell enlargement at 750 m and in particular at 450 m elevation. This indicates decoupling of compensatory effects of tracheid development also during phases of recovering soil water availability. Consequently, trees at the 450 m elevation formed a distinct intra-annual density fluctuation (IADF) within the tree-ring structure, as characterized by tracheids with latewood morphology encompassed by earlywood cells, which is a phenomenon most common in trees growing in the Mediterranean area with frequent and severe summer droughts [19,71,72]. With decreasing drought stress at higher elevations, the intensity of the IADF was mitigated (750 m) or not existent (1250 m), indicating increasingly effective compensatory effects at higher elevations. IADFs are not restricted to Mediterranean ecosystems and the potential of Norway spruce wood anatomy to show plastic responses to intra-seasonal drought periods by IADF formation has been documented by previous studies as well [47,73,74]. However, as studies in the Mediterranean area demonstrated, IADF formation is a facultative and complex phenomenon and irrigation after post-summer drought does not necessarily trigger cambial reactivation [18]. Our results suggest that the sequence of sharply contrasting environmental conditions during the dry-wet cycle in June and July initiated IADF formation of submontane Norway spruce trees on lower elevations. Based on our knowledge, our study reports for the first time the decoupling of kinetics of cell differentiation processes during intra-seasonal drought. Therefore, our results contribute to an improved and mechanistic understanding of the underlying xylogenetic processes of IADF formation and their environmental control.
Despite these findings, we identified a consistent pattern of increasing durations of cell differentiation to compensate lower rates at higher elevations during earlywood formation, confirming our expectations based on previous research on Norway spruce and European larch growing along thermal gradients [9]. Highly effective compensatory mechanisms between rates and durations, completely counterbalancing the impact of environmental predictor variables on kinetics of tracheid development during earlywood and transition wood formation were also documented for conifers growing in the Vosges mountains of France [14]. However, the highly significant effect of temperature on the rates of wall thickening during latewood formation in our sample trees, which were not counterbalanced by shorter durations, underpins the cause-effect understanding of the links between late summer temperature, cell wall thickness, and maximum latewood density documented in previous research [9,14].
In addition, tree age, tree height, and crown characteristics of our sample trees were not completely uniform between the elevational levels but have been documented as significant confounding factors to climate and weather altering phenology and dynamics of wood formation of conifers. Rossi et al. detected in timberline conifers that older trees had altered timings and significantly shorter durations of xylogenesis [39]. Rathgeber et al. found that dominant trees (i.e., taller trees with larger dbh and crown projection area) in a silver fir plantation had significantly longer duration of cambial activity compared to suppressed trees [75]. In addition, anatomical variables directly related to the calculation of the kinetics of tracheid differentiation, such as the radial diameter, and, in particular, the tangential diameter of tracheids were found to be positively correlated with tree height [76]. Furthermore, tracheid diameters also depend on the distance of the stem tip [77]. The inclusion of such effects in combination with larger sample sizes in future research could considerably support the disentangling of endogenous and exogenous factors and quantify their control of wood formation processes.
4.2. Analogies and Discrepancies of Growth Models Derived from Dendrometer and Xylogenesis Data
The gradual increase of xylem size during the growing season is known to be controlled by xylem cell enlargement and, to a lesser degree, by cambial xylem cell production [11,22]. Therefore, we expected the modeled daily rate of radial xylem growth based on xylogenesis observations to show the closest correlation with the irreversible growth component that we extracted from the dendrometer time series using shape constrained additive models [30,45,47]. This could be confirmed for the 450 m and 750 m elevation, but the rate of radial displacement at 1250 m showed the closest correlation with the daily rate of woody biomass production. Secondary wall thickening is the main process for allocating biomass, but does not alter stem size, as it occurs after cells have determined their final dimension [11,78]. Our results, therefore, indicate that, for trees with generally lower xylem growth rates, as exemplified by the 1250 m elevation site, the ratio of the signal (i.e., irreversible xylem cell production and enlargement) to noise (i.e., reversible fluctuations of tree water status as well as production and collapse of phloem and bark cells) in dendrometer data becomes increasingly unfavorable to estimate xylem growth rates. Therefore, the risk of systematic errors when predicting the phenology or daily rates of radial xylem growth based exclusively on dendrometer data should be critically discussed [23,29,30]. Accumulation of cells in the cambial zone, but also the formation of phloem cells, might have contributed to the increase of stem size at 1250 m elevation before the actual onset of xylem cell enlargement [52,79,80]. In contrast to tracheids, sieve cells remain functioning to conduct assimilates for only 1–2 years [64]. However, there seems to be no equilibrium between the production and collapse of sieve cells to counterbalance their effects on stem size, as the maximum number of non-collapsed and conducting phloem cells of Norway spruce was identified late in the growing season [52].
Our results indicated an existing link between the daily rates of radial displacement and radial xylem growth for the faster growing trees on the two lower elevations. Close relationships between actual xylem radial growth observations and a turgor driven growth model based on dendrometer data were also recently demonstrated for Norway spruce and European larch growing in the Swiss Alps [25]. However, we also detected discrepancies at the 750 m elevation site, where a period of continuous stem shrinkage during October caused a considerable underfit of the shape constrained additive model, resulting in distinct differences between the radial growth models based on xylogenesis and dendrometer data. Based on the assumption that growth processes depend on positive turgor pressure [25,81,82], Zweifel et al. hypothesized that actual rates of radial growth are likely very low or non-existent during continuous periods of stem shrinkage [24], but, without independent growth data from microcores, their study could not ultimately validate their own conclusions. Our study integrated xylogenesis and dendrometer data from the same trees and provided supporting evidence for this hypothesis, as xylem cell enlargement at 750 m elevation ceased at the end of September, at about the same time when continuous stem shrinkage began.
Our analysis provided no clear evidence, whether the bimodal growth patterns and decreasing rates of radial displacement and radial xylem growth at the 750 m elevation and, in particular, at the 450 m elevation site in June were caused by low rates of xylem cell production. This is also reflected by the fact that the bimodal pattern of seasonal xylem cell production at the 1250 m elevation site in June did not translate into distinct lower rates of stem radial displacement. This partly underlines the superior importance of xylem cell enlargement for the increase in stem size compared to cambial cell divisions [11,22]. However, our results provided interesting evidence that the distinct stagnation of stem radial displacement during the June drought at 450 m elevation, was likely triggered by a low number of enlarging cells combined with decreasing enlargement rates. It can be speculated that these negative effects on stem size increase were possibly exacerbated by decreasing stem water potentials and bark shrinkage due to transpirational water loss not being fully compensated by root water uptake during drought [24,27,64]. The synergistic effects of integrating dendrometer measurements with models of the kinetics of tracheid differentiation provides novel insights on the actual dynamics of wood formation processes behind stem size variations and enables a better interpretation of dendrometer measurements during intra-seasonal drought periods.
4.3. Phase Shift between Daily Rates of Radial Xylem Growth and Woody Biomass Production
We also examined whether the seasonal peak of the daily rate of woody biomass production would appear time-lagged to the occurrence of the maximum daily rate of xylem growth, as suggested in previous studies [11,22]. Although this assumption was confirmed at all elevations, the time-lag of 11 days at 450 m elevation was considerably shorter than one month documented for conifers growing in the Vosges mountains of France. A similar reduction of the phase shift between daily rates of radial xylem growth and woody biomass production was also documented for Norway spruce growing in North-east France during the drought year of 2015, whereas the seasonal growth pattern retained a unimodal shape [22]. At the peak of the drought period during the middle and end of June 2014, concurrent to the formation of the intra-annual density fluctuation at 450 m elevation, we found the rate of woody biomass production almost immediately starting to decline, before increasing again under more favorable growing conditions in July. During the heat wave and drought conditions in June, Norway spruce trees growing at 450 m and 750 m elevation might have shifted their carbon allocation patterns away from the synthesis of lignocellulose components and xylem carbon sequestration to the maintenance respiration of living tissues with higher priority for tree survival [83]. In contrast to previous assumptions that the seasonal course of woody biomass production is mainly controlled by temperature [11], the considerably longer time lags of 68 days at 750 m and 45 days at 1250 m elevation combined with the formation of bimodal growth patterns, highlight the importance of water availability and turgor for woody biomass production and carbon sequestration of Norway spruce [25].
5. Conclusions
We performed an integrated analysis of xylogenesis observations, quantitative wood anatomy, and precision point-dendrometer measurements of Norway spruce during the growing season in 2014, where the summer was characterized by a distinct dry-wet cycle with an anomalous dry June followed by an extraordinarily humid July. While effective compensatory mechanisms of the kinetics of tracheid development at the highest elevations indicated strong internal control of tree-ring formation, a collapse of compensatory effects at the lowest elevation with very short durations and decreasing rates of cell enlargement during drought triggered the formation of an intra-annual density fluctuation (IADF). Parallel to IADF formation, these trees responded to water stress with bimodal growth patterns characterized by temporarily decreasing daily rates of radial xylem growth and woody biomass production. Simultaneously, dendrometer measurements indicated stagnating rates of stem radial displacement and increasing daily shrinkages of radial stem size. However, intra-annual growth models based on xylogenesis data and dendrometer measurements showed only a moderate agreement. It appears that, in particular, during low rates of radial xylem growth, the signal-to-noise ratios between growth and fluctuations in tree water status might become increasingly detrimental for an accurate and realistic estimation of growth rates based on dendrometer data.
In contrast to findings of previous studies, where compensatory mechanisms of tracheid differentiation remained intact during drought periods [17,18], our study demonstrates, for the first time, the complex interplay between rates and durations of tracheid development during in-situ dry-wet cycles. Thereby, we contribute to an improved mechanistic understanding of the environmental control of wood formation processes, leading to the formation of intra-annual density fluctuations in tree-rings of coniferous tree species. Since our time series encompasses only one year and a small sample size, we suggest future research to validate these findings with comparable modeling approaches based on xylogenesis data collected at sites with more frequent and severe intra-seasonal drought periods, as can be found in the Mediterranean regions.
Supplementary Materials
The following are available online at https://www.mdpi.com/1999-4907/12/3/274/s1. The supplementary material presents original data, data processing steps, model fitting, model validation, alignment of wood anatomical profiles and monthly climate anomalies for the 750 m and 1250 m a.s.l. elevation.
Author Contributions
Conceptualization, H.S., H.-P.K., and D.F.S. Field work, D.F.S. and E.L. Laboratory work, D.F.S. and E.L. Data processing, D.F.S. Data analysis, D.F.S., M.R., E.L., and H.-P.K. Interpretation of analysis, D.F.S., H.-P.K., M.R., E.L., H.S., and T.S. Writing—original draft preparation, D.F.S. Writing—review and editing, H.-P.K., M.R., H.S., E.L., and T.S. Project administration, H.S. Funding acquisition, H.S., H.-P.K., M.R., and D.F.S. All authors have read and agreed to the published version of the manuscript.
Funding
This work was partially supported by the German Research Foundation with grants SP-437/17, SP-437/19, and BA 2168/12.
Informed Consent Statement
Not applicable.
Data Availability Statement
The data presented in this study are available on request from the corresponding author.
Acknowledgments
The authors thank Johannes Schorr, Lea Großpietsch, Susanne Hermann, Jérôme Milch, Felix Baab, and the local forest administration for supporting field and laboratory tasks. We also acknowledge Olaf Grobbel for the constant quality control of the dendrometer data. Our thanks go to Heike Puhlmann and Thilo Wolf, who compiled the global radiation data. Our gratitude goes to the two anonymous reviewers, whose helpful comments and suggestions contributed to improve the quality of this paper.
Conflicts of Interest
The authors declare that they have no conflict of interest.
Appendix A
Table A1.
List of abbreviations used in this study with their definitions (and units where applicable).
Table A1.
List of abbreviations used in this study with their definitions (and units where applicable).
| Abbreviation | Definition | Unit |
|---|---|---|
| Xylogenesis variables | ||
| nC | Number of cambial cells | cells |
| nE | Number of enlarging cells | cells |
| nEWM | Total number of cells | cells |
| nM | Number of mature cells | cells |
| nT | Mean total number of cells after the end of cell enlargement | cells |
| nW | Number of wall thickening cells | cells |
| nWM | Number of cells with secondary walls | cells |
| Wood anatomical variables | ||
| CCA | Cell cross-sectional area | µm2 |
| CCCA | Cambial cell cross-sectional area | µm2 |
| CCRD | Cambial cell radial diameter | µm |
| CRD | Cell radial diameter | µm |
| CTD | Cell tangential diameter | µm |
| CWCA | Cambial cell wall cross-sectional area | µm2 |
| IADF | Intra-annual density fluctuation | |
| LCA | Cell lumen cross-sectional area | µm2 |
| LRD | Cell lumen radial diameter | µm |
| LTD | Cell lumen tangential diameter | µm |
| MC | Mork’s Criterion | unitless |
| PWT | Primary cell wall thickness | µm |
| WCA | Cell wall cross-sectional area | µm2 |
| WTT | Cell wall tangential thickness | µm |
| Kinetics variables | ||
| dE | Duration of cell enlargement | days |
| dW | Duration of secondary wall thickening | days |
| rA | Rate of cell cross-sectional area enlargement | µm2 day−1 |
| rE | Rate of radial cell enlargement | µm day−1 |
| rW | Rate of cell wall thickening | µm2 day−1 |
| Radial growth and biomass variables | ||
| AWP | Aboveground woody biomass | gC tree−1 |
| CWP | Cell wall proportion | unitless |
| rAWP | Rate of aboveground woody biomass production | gC day−1 tree−1 |
| rC | Rate of xylem cell production | cells day−1 |
| rRD | Rate of stem radial displacement | µm day−1 |
| rRG | Rate of radial xylem growth | µm day−1 |
| XAD | Xylem apparent density | g cm3 |
| Tree characteristics | ||
| DBH | Diameter at breast height | cm |
| F | Form coefficient of Norway spruce stems | unitless |
| H | Tree height | m |
| Linear mixed-effects model and environmental variables | ||
| MP | Daily mean of soil matrix potential | kPa |
| RD | Daily sum of global radiation on inclined surfaces | MJ m−2 |
| RH | Daily mean of relative humidity | % |
| TM | Time | Day of year |
| TP | Daily mean of air temperature | °C |
| Subscript indices | ||
| c | Cell | |
| f | Tracheid file | |
| i | Elevational level | |
| j | Individual tree | |
| t | Day of year | |
| Methodology | ||
| GAM | Generalized additive model | |
| GAMM | Generalized additive mixed model | |
| MICA | Multiple interval-based curve alignment |
References
- Bäucker, E.; Bues, C.-T.; Vogel, M. Radial Growth Dynamics of Spruce (Picea abies) Measured by Micro-Cores. IAWA J. 1998, 19, 301–309. [Google Scholar] [CrossRef]
- Förster, T.; Schweingruber, F.H.; Denneler, B. INCREMENT PUNCHER: A tool for extracting small cores of wood and bark from living trees. IAWA J. 2000, 21, 169–180. [Google Scholar] [CrossRef]
- Rossi, S.; Anfodillo, T.; Menardi, R. Trephor: A New Tool for Sampling Microcores from tree stems. IAWA J. 2006, 27, 89–97. [Google Scholar] [CrossRef]
- Delpierre, N.; Lireux, S.; Hartig, F.; Camarero, J.J.; Cheaib, A.; Čufar, K.; Cuny, H.; Deslauriers, A.; Fonti, P.; Gričar, J.; et al. Chilling and forcing temperatures interact to predict the onset of wood formation in Northern Hemisphere conifers. Glob. Chang. Biol. 2019, 25, 1089–1105. [Google Scholar] [CrossRef]
- Moser, L.; Fonti, P.; Büntgen, U.; Esper, J.; Luterbacher, J.; Franzen, J.; Frank, D. Timing and duration of European larch growing season along altitudinal gradients in the Swiss Alps. Tree Physiol. 2010, 30, 225–233. [Google Scholar] [CrossRef]
- Rossi, S.; Morin, H.; Deslauriers, A. Causes and correlations in cambium phenology: Towards an integrated framework of xylogenesis. J. Exp. Bot. 2012, 63, 2117–2126. [Google Scholar] [CrossRef] [PubMed]
- Cuny, H.E.; Rathgeber, C.B.K.; Frank, D.; Fonti, P.; Fournier, M. Kinetics of tracheid development explain conifer tree-ring structure. New Phytol. 2014, 203, 1231–1241. [Google Scholar] [CrossRef]
- Huang, J.-G.; Ma, Q.; Rossi, S.; Biondi, F.; Deslauriers, A.; Fonti, P.; Liang, E.; Mäkinen, H.; Oberhuber, W.; Rathgeber, C.B.K.; et al. Photoperiod and temperature as dominant environmental drivers triggering secondary growth resumption in Northern Hemisphere conifers. Proc. Natl. Acad. Sci. USA 2020, 117, 20645–20652. [Google Scholar] [CrossRef]
- Cuny, H.E.; Fonti, P.; Rathgeber, C.B.K.; Von Arx, G.; Peters, R.L.; Frank, D.C. Couplings in cell differentiation kinetics mitigate air temperature influence on conifer wood anatomy. Plant Cell Environ. 2018, 42, 1222–1232. [Google Scholar] [CrossRef]
- Hartmann, F.P.; Rathgeber, C.B.K.; Badel, É.; Fournier, M.; Moulia, B. Modelling the spatial crosstalk between two biochemical signals explains wood formation dynamics and tree-ring structure. J. Exp. Bot. 2020. [Google Scholar] [CrossRef] [PubMed]
- Cuny, H.E.; Rathgeber, C.B.K.; Frank, D.; Fonti, P.; Mäkinen, H.; Prislan, P.; Rossi, S.; Del Castillo, E.M.; Campelo, F.; Vavrčík, H.; et al. Woody biomass production lags stem-girth increase by over one month in coniferous forests. Nat. Plants 2015, 1, 15160. [Google Scholar] [CrossRef]
- Sass-Klaassen, U. Tree physiology: Tracking tree carbon gain. Nat. Plants 2015, 1, 15175. [Google Scholar] [CrossRef]
- Uggla, C. Function and Dynamics of Auxin and Carbohydrates during Earlywood/Latewood Transition in Scots Pine. Plant Physiol. 2001, 125, 2029–2039. [Google Scholar] [CrossRef] [PubMed]
- Cuny, H.E.; Rathgeber, C.B.K. Xylogenesis: Coniferous Trees of Temperate Forests Are Listening to the Climate Tale during the Growing Season But Only Remember the Last Words! Plant Physiol. 2016, 171, 306–317. [Google Scholar] [CrossRef]
- Bhalerao, R.P.; Bennett, M.J. The case for morphogens in plants. Nat. Cell Biol. 2003, 5, 939–943. [Google Scholar] [CrossRef]
- Hartmann, F.P.; Rathgeber, C.B.K.; Fournier, M.; Moulia, B. Modelling wood formation and structure: Power and limits of a morphogenetic gradient in controlling xylem cell proliferation and growth. Ann. For. Sci. 2017, 74, 14. [Google Scholar] [CrossRef]
- Balducci, L.; Cuny, H.E.; Rathgeber, C.B.K.; Deslauriers, A.; Giovannelli, A.; Rossi, S. Compensatory mechanisms mitigate the effect of warming and drought on wood formation. Plant Cell Environ. 2016, 39, 1338–1352. [Google Scholar] [CrossRef] [PubMed]
- Vieira, J.; Carvalho, A.; Campelo, F. Tree Growth Under Climate Change: Evidence From Xylogenesis Timings and Kinetics. Front. Plant Sci. 2020, 11, 90. [Google Scholar] [CrossRef] [PubMed]
- Vieira, J.; Campelo, F.; Nabais, C. Age-dependent responses of tree-ring growth and intra-annual density fluctuations of Pinus pinaster to Mediterranean climate. Trees 2008, 23, 257–265. [Google Scholar] [CrossRef]
- De Micco, V.; Campelo, F.; De Luis, M.; Bräuning, A.; Grabner, M.; Battipaglia, G.; Cherubini, P. Intra-annual density fluctuations in tree rings: How, when, where, and why? IAWA J. 2016, 37, 232–259. [Google Scholar] [CrossRef]
- Zhang, J.; Alexander, M.R.; Gou, X.; Deslauriers, A.; Fonti, P.; Zhang, F.; Pederson, N. Extended xylogenesis and stem biomass production in Juniperus przewalskii Kom. during extreme late-season climatic events. Ann. For. Sci. 2020, 77, 1–11. [Google Scholar] [CrossRef]
- Andrianantenaina, A.N.; Rathgeber, C.B.K.; Pérez-De-Lis, G.; Cuny, H.; Ruelle, J. Quantifying intra-annual dynamics of carbon sequestration in the forming wood: A novel histologic approach. Ann. For. Sci. 2019, 76, 62. [Google Scholar] [CrossRef]
- Mäkinen, H.; Seo, J.-W.; Nöjd, P.; Schmitt, U.; Jalkanen, R. Seasonal dynamics of wood formation: A comparison between pinning, microcoring and dendrometer measurements. Eur. J. For. Res. 2008, 127, 235–245. [Google Scholar] [CrossRef]
- Zweifel, R.; Haeni, M.; Buchmann, N.; Eugster, W. Are trees able to grow in periods of stem shrinkage? New Phytol. 2016, 211, 839–849. [Google Scholar] [CrossRef]
- Peters, R.L.; Steppe, K.; Cuny, H.E.; De Pauw, D.J.; Frank, D.C.; Schaub, M.; Rathgeber, C.B.K.; Cabon, A.; Fonti, P. Turgor—A limiting factor for radial growth in mature conifers along an elevational gradient. New Phytol. 2020, 229, 213–229. [Google Scholar] [CrossRef] [PubMed]
- Zweifel, R. Radial stem variations—A source of tree physiological information not fully exploited yet. Plant Cell Environ. 2016, 39, 231–232. [Google Scholar] [CrossRef]
- Zweifel, R.; Zimmermann, L.; Newbery, D.M. Modeling tree water deficit from microclimate: An approach to quantifying drought stress. Tree Physiol. 2005, 25, 147–156. [Google Scholar] [CrossRef] [PubMed]
- Vieira, J.; Rossi, S.; Campelo, F.; Freitas, H.; Nabais, C. Seasonal and daily cycles of stem radial variation of Pinus pinaster in a drought-prone environment. Agric. For. Meteorol. 2013, 180, 173–181. [Google Scholar] [CrossRef]
- Stangler, D.F.; Hamann, A.; Kahle, H.-P.; Spiecker, H. A heat wave during leaf expansion severely reduces productivity and modifies seasonal growth patterns in a northern hardwood forest. Tree Physiol. 2017, 37, 47–59. [Google Scholar] [CrossRef]
- Sprengel, L.; Stangler, D.F.; Sheppard, J.; Morhart, C.; Spiecker, H. Comparative Analysis of the Effects of Stem Height and Artificial Pruning on Seasonal Radial Growth Dynamics of Wild Cherry (Prunus avium L.) and Sycamore (Acer pseudoplatanus L.) in a Widely Spaced System. Forests 2018, 9, 174. [Google Scholar] [CrossRef]
- Van Der Maaten, E.; Pape, J.; Van Der Maaten-Theunissen, M.; Scharnweber, T.; Smiljanić, M.; Cruz-García, R.; Wilmking, M. Distinct growth phenology but similar daily stem dynamics in three co-occurring broadleaved tree species. Tree Physiol. 2018, 38, 1820–1828. [Google Scholar] [CrossRef] [PubMed]
- Vospernik, S.; Nothdurft, A. Can trees at high elevations compensate for growth reductions at low elevations due to climate warming? Can. J. For. Res. 2018, 48, 650–662. [Google Scholar] [CrossRef]
- Mencuccini, M.; Salmon, Y.; Mitchell, P.; Hölttä, T.; Choat, B.; Meir, P.; O’Grady, A.; Tissue, D.; Zweifel, R.; Sevanto, S.; et al. An empirical method that separates irreversible stem radial growth from bark water content changes in trees: Theory and case studies. Plant Cell Environ. 2017, 40, 290–303. [Google Scholar] [CrossRef]
- Kahle, H.P. Impact of the drought in 2003 on intra- and inter-annual stem radial growth of beech and spruce along an alti-tudinal gradient. In TRACE—Tree Rings in Archaeology, Climatology and Ecology, Volume 4, Proceedings of the Dendrosymposium 2005, 21–23 April 2005, Fribourg, Switzerland; Heinrich, I., Gärtner, H., Monbaron, M., Schleser, G.H., Eds.; Forschungszentrum Jülich: Jülich, Germany, 2006; p. 151. ISBN 3893364250. [Google Scholar]
- Stangler, D.F. Seasonal Wood Formation Dynamics and Tree-Ring Structure of Selected Tree Species in Response to Climate and Forest Management. Ph.D. Thesis, Albert-Ludwigs-Universität Freiburg, Freiburg, Breisgau, 2016. [Google Scholar]
- Dietrich, H.; Wolf, T.; Kawohl, T.; Wehberg, J.; Kändler, G.; Mette, T.; Röder, A.; Böhner, J. Temporal and spatial high-resolution climate data from 1961 to 2100 for the German National Forest Inventory (NFI). Ann. For. Sci. 2019, 76, 6. [Google Scholar] [CrossRef]
- Hauser, S. Dynamik Hochaufgelöster Radialer Schaftveränderungen und des Dickenwachstums bei Buchen (Fagus sylvatica L.) der Schwäbischen Alb unter dem Einfluss von Witterung und Bewirtschaftung. Ph.D. Thesis, Albert-Ludwigs-Universität Freiburg, Freiburg, Breisgau, 2003. [Google Scholar]
- Gärtner, H.; Lucchinetti, S.; Schweingruber, F.H. New perspectives for wood anatomical analysis in dendrosciences: The GSL1-microtome. Dendrochronologia 2014, 32, 47–51. [Google Scholar] [CrossRef]
- Rossi, S.; Deslauriers, A.; Anfodillo, T.; Carrer, M. Age-dependent xylogenesis in timberline conifers. New Phytol. 2008, 177, 199–208. [Google Scholar] [CrossRef]
- Spiecker, H.; Schinker, M.G.; Hansen, J.; Park, Y.I.; Ebding, T.; Doll, W. Cell structure in tree rings: Novel methods for prepa-ration and image analysis of large cross sections. IAWA J. 2000, 21, 361–373. [Google Scholar] [CrossRef]
- Gärtner, H.; Schweingruber, F.H. Microscopic Preparation Techniques for Plant Stem Analysis; Originalausg; Kessel: Remagen, Germany, 2013; ISBN 3941300768. [Google Scholar]
- R Core Team. R Programming Language. Available online: http://www.r-project.org (accessed on 1 December 2020).
- Wood, S.N. Fast stable restricted maximum likelihood and marginal likelihood estimation of semiparametric generalized linear models. J. R. Stat. Soc. Ser. B Statistical Methodol. 2011, 73, 3–36. [Google Scholar] [CrossRef]
- Cuny, H.E.; Rathgeber, C.B.K.; Kiessé, T.S.; Hartmann, F.P.; Barbeito, I.; Fournier, M. Generalized additive models reveal the intrinsic complexity of wood formation dynamics. J. Exp. Bot. 2013, 64, 1983–1994. [Google Scholar] [CrossRef]
- Pya, N.; Wood, S.N. Shape constrained additive models. Stat. Comput. 2015, 25, 543–559. [Google Scholar] [CrossRef]
- Mayer, D.; Butler, D. Statistical validation. Ecol. Model. 1993, 68, 21–32. [Google Scholar] [CrossRef]
- Stangler, D.F.; Mann, M.; Kahle, H.-P.; Rosskopf, E.; Fink, S.; Spiecker, H. Spatiotemporal alignment of radial tracheid diameter profiles of submontane Norway spruce. Dendrochronologia 2016, 37, 33–45. [Google Scholar] [CrossRef]
- Mann, M.; Kahle, H.-P.; Beck, M.; Bender, B.J.; Spiecker, H.; Backofen, R. MICA: Multiple interval-based curve alignment. SoftwareX 2018, 7, 53–58. [Google Scholar] [CrossRef]
- Raden, M.; Mattheis, A.; Spiecker, H.; Backofen, R.; Kahle, H.-P. The potential of intra-annual density information for crossdating of short tree-ring series. Dendrochronologia 2020, 60, 125679. [Google Scholar] [CrossRef]
- Denne, M. Definition of Latewood According to Mork (1928). IAWA J. 1989, 10, 59–62. [Google Scholar] [CrossRef]
- Rossi, S.; Deslauriers, A.; Morin, H. Application of the Gompertz equation for the study of xylem cell development. Dendrochronologia 2003, 21, 33–39. [Google Scholar] [CrossRef]
- Miller, T.W.; Stangler, D.F.; Larysch, E.; Seifert, T.; Spiecker, H.; Kahle, H.-P. Plasticity of seasonal xylem and phloem production of Norway spruce along an elevational gradient. Trees 2020, 34, 1281–1297. [Google Scholar] [CrossRef]
- Barnett, J.R.; Jeronimidis, G. Wood Quality and Its Biological Basis; Blackwell: Oxford, UK, 2013; ISBN 978-1-84127-319-8. [Google Scholar]
- Lamlom, S.; Savidge, R. A reassessment of carbon content in wood: Variation within and between 41 North American species. Biomass Bioenergy 2003, 25, 381–388. [Google Scholar] [CrossRef]
- Vallet, P.; Dhôte, J.-F.; Le Moguédec, G.; Ravart, M.; Pignard, G. Development of total aboveground volume equations for seven important forest tree species in France. For. Ecol. Manag. 2006, 229, 98–110. [Google Scholar] [CrossRef]
- Pinheiro, J.; Bates, D.; DebRoy, S.; Sarkar, D.; R Core Team. Nlme: Linear and Nonlinear Mixed Effects Models. 2020. Available online: http://CRAN.R-project.org/package=nlme (accessed on 1 December 2020).
- Sheather, S. A Modern Approach to Regression with R; Springer: New York, NY, USA, 2009; ISBN 978-0-387-09608-7. [Google Scholar]
- Barton, K. MuMIn: Multi-Model Inference. 2020. Available online: http://CRAN.R-project.org/package=MuMIn (accessed on 1 December 2020).
- King, G.; Fonti, P.; Nievergelt, D.; Büntgen, U.; Frank, D. Climatic drivers of hourly to yearly tree radius variations along a 6 °C natural warming gradient. Agric. For. Meteorol. 2013, 168, 36–46. [Google Scholar] [CrossRef]
- Metcalfe, A.V.; Cowpertwait, P.S. Introductory Time Series with R; Springer Science and Business Media LLC: Berlin/Heidelberg, Germany, 2009. [Google Scholar]
- Haude, W. Zur Bestimmung der Verdunstung auf Möglichst Einfache Weise; Dt. Wetterdienst: Bad Kissingen, Germany, 1955. [Google Scholar]
- Buttò, V.; Rossi, S.; Deslauriers, A.; Morin, H. Is size an issue of time? Relationship between the duration of xylem development and cell traits. Ann. Bot. 2019, 123, 1257–1265. [Google Scholar] [CrossRef]
- Hinckley, T.M.; Lassoie, J.P. Radial growth in conifers and decidious trees a comparison. Mitt. Forstl. Bundesversuchsanstalt Wien 142 1981, 17–56. [Google Scholar]
- Steppe, K.; Sterck, F.; Deslauriers, A. Diel growth dynamics in tree stems: Linking anatomy and ecophysiology. Trends Plant Sci. 2015, 20, 335–343. [Google Scholar] [CrossRef]
- Cartenì, F.; Deslauriers, A.; Rossi, S.; Morin, H.; De Micco, V.; Mazzoleni, S.; Giannino, F. The Physiological Mechanisms Behind the Earlywood-To-Latewood Transition: A Process-Based Modeling Approach. Front. Plant Sci. 2018, 9, 1053. [Google Scholar] [CrossRef] [PubMed]
- Allen, C.D.; Macalady, A.K.; Chenchouni, H.; Bachelet, D.; McDowell, N.; Vennetier, M.; Kitzberger, T.; Rigling, A.; Breshears, D.D.; (Ted) Hogg, E.H.; et al. A global overview of drought and heat-induced tree mortality reveals emerging climate change risks for forests. For. Ecol. Manag. 2010, 259, 660–684. [Google Scholar] [CrossRef]
- Hartmann, H.; Ziegler, W.; E Trumbore, S. Lethal drought leads to reduction in nonstructural carbohydrates in Norway spruce tree roots but not in the canopy. Funct. Ecol. 2013, 27, 413–427. [Google Scholar] [CrossRef]
- Hartmann, H.; Trumbore, S. Understanding the roles of nonstructural carbohydrates in forest trees—From what we can measure to what we want to know. New Phytol. 2016, 211, 386–403. [Google Scholar] [CrossRef] [PubMed]
- Ditmarová, L.; Kurjak, D.; Palmroth, S.; Kmeť, J.; Střelcová, K. Physiological responses of Norway spruce (Picea abies) seedlings to drought stress. Tree Physiol. 2010, 30, 205–213. [Google Scholar] [CrossRef]
- Tardieu, F.; Granier, C.; Muller, B. Water deficit and growth. Co-ordinating processes without an orchestrator? Curr. Opin. Plant Biol. 2011, 14, 283–289. [Google Scholar] [CrossRef]
- Vieira, J.; Campelo, F.; Nabais, C. Intra-annual density fluctuations of Pinus pinaster are a record of climatic changes in the western Mediterranean region. Can. J. For. Res. 2010, 40, 1567–1575. [Google Scholar] [CrossRef]
- Campelo, F.; Vieira, J.; Nabais, C. Tree-ring growth and intra-annual density fluctuations of Pinus pinaster responses to climate: Does size matter? Trees 2013, 27, 763–772. [Google Scholar] [CrossRef]
- von Wilpert, K. Intraannual variation of radial tracheid diameters as monitor of site specific water stress. Dendrochronologia 1991, 9, 95–113. [Google Scholar]
- Bouriaud, O.; Leban, J.-M.; Bert, D.; Deleuze, C. Intra-annual variations in climate influence growth and wood density of Norway spruce. Tree Physiol. 2005, 25, 651–660. [Google Scholar] [CrossRef] [PubMed]
- Rathgeber, C.B.K.; Rossi, S.; Bontemps, J.-D. Cambial activity related to tree size in a mature silver-fir plantation. Ann. Bot. 2011, 108, 429–438. [Google Scholar] [CrossRef] [PubMed]
- Piermattei, A.; Von Arx, G.; Avanzi, C.; Fonti, P.; Gärtner, H.; Piotti, A.; Urbinati, C.; Vendramin, G.G.; Büntgen, U.; Crivellaro, A. Functional Relationships of Wood Anatomical Traits in Norway Spruce. Front. Plant Sci. 2020, 11, 683. [Google Scholar] [CrossRef]
- Olson, M.E.; Anfodillo, T.; Gleason, S.M.; McCulloh, K.A. Tip-to-base xylem conduit widening as an adaptation: Causes, consequences, and empirical priorities. New Phytol. 2021, 229, 1877–1893. [Google Scholar] [CrossRef]
- Rathgeber, C.B.K.; Cuny, H.E.; Fonti, P. Biological Basis of Tree-Ring Formation: A Crash Course. Front. Plant Sci. 2016, 7, 734. [Google Scholar] [CrossRef]
- Gričar, J.; Prislan, P.; Gryc, V.; Vavrčík, H.; de Luis, M.; Čufar, K. Plastic and locally adapted phenology in cambial seasonality and production of xylem and phloem cells in Picea abies from temperate environments. Tree Physiol. 2014, 34, 869–881. [Google Scholar] [CrossRef]
- Gričar, J.; Prislan, P.; De Luis, M.; Gryc, V.; Hacurova, J.; Vavrčík, H.; Čufar, K. Plasticity in variation of xylem and phloem cell characteristics of Norway spruce under different local conditions. Front. Plant Sci. 2015, 6, 730. [Google Scholar] [CrossRef]
- Lockhart, J.A. An analysis of irreversible plant cell elongation. J. Theor. Biol. 1965, 8, 264–275. [Google Scholar] [CrossRef]
- Steppe, K.; De Pauw, D.J.W.; LeMeur, R.; Vanrolleghem, P.A. A mathematical model linking tree sap flow dynamics to daily stem diameter fluctuations and radial stem growth. Tree Physiol. 2006, 26, 257–273. [Google Scholar] [CrossRef] [PubMed]
- Teskey, R.; Wertin, T.; Bauweraerts, I.; Ameye, M.; McGuire, M.A.; Steppe, K. Responses of tree species to heat waves and extreme heat events. Plant Cell Environ. 2015, 38, 1699–1712. [Google Scholar] [CrossRef] [PubMed]
Publisher’s Note: MDPI stays neutral with regard to jurisdictional claims in published maps and institutional affiliations. |
© 2021 by the authors. Licensee MDPI, Basel, Switzerland. This article is an open access article distributed under the terms and conditions of the Creative Commons Attribution (CC BY) license (http://creativecommons.org/licenses/by/4.0/).