Article

Seasonal Variations in Carbon, Nitrogen, and Phosphorus Stoichiometry of a Robinia pseudoacacia Plantation on the Loess Hilly Region, China

1
State key Laboratory of Soil Erosion and Dryland Farming on the Loess Plateau, Institute of Soil and Water Conservation, Northwest A&F University, Yangling 712100, China
2
Institute of Soil and Water Conservation, Chinese Academy of Sciences and Ministry of Water Resources, Yangling 712100, China
*
Author to whom correspondence should be addressed.
Forests 2021, 12(2), 214; https://doi.org/10.3390/f12020214
Submission received: 6 January 2021 / Revised: 6 February 2021 / Accepted: 8 February 2021 / Published: 12 February 2021
(This article belongs to the Section Forest Ecology and Management)

Abstract

:
Seasonal variations in stoichiometry are a crucial regulatory mechanism for plant communities that respond to environmental changes. However, the seasonal characteristics of stoichiometry in plants, litter, and soil are poorly understood, especially in plantation ecosystems. Therefore, we explored the seasonal variations of C, N, and P contents and ratios between plants, litter, and soil of a Robinia pseudoacacia plantation on the Loess Plateau in China in 2017. The results indicate that the C, N, P contents and ratios in plants, litter and soil showed different seasonal patterns. The N and P contents of tree and shrub leaves substantially decreased over the growing season, while the C:N, C:P, and N:P ratios exhibited the opposite trend. The utilization efficiency of the N and P elements by trees and shrubs gradually increased with the change of the growing season. These results suggest that the C:N:P stoichiometry of plants was more sensitive to seasonal changes than the litter and soil; therefore, the potential impacts of time should be considered when using stoichiometry to explore the utilization of plant nutrients. Additionally, the P content between tree leaves and soil and the N content between herb leaves and soil were significantly positively correlated, indicating that the growth of the tree and herb layer in the R. pseudoacacia plantation in the area was restricted by P and N, respectively. Meanwhile, the N content in the leaves between trees and herbs showed a significant negative correlation, indicating that N competition existed between R. pseudoacacia and understory herbs, which was not conducive to the effective use of environmental resources by the R. pseudoacacia plantation ecosystem. This study contributes to vegetation restoration and plantation management on the Loess Plateau and provides basic information for global stoichiometric analyses.

1. Introduction

Ecological stoichiometry has become an important scientific theory that connects different levels and scales in biological research, reflecting the dynamic balance and interactions between multiple chemical elements and energy [1]. It emphasizes the proportional relationships between chemical elements in ecological processes, especially those of carbon (C), nitrogen (N), and phosphorus (P) [2,3]. The elements of C, N, and P are strongly coupled in plants, and understanding their stoichiometric characteristics plays a crucial role in exploring plant growth, litter decomposition, and biogeochemical cycling [4,5,6].
Plantation forests occupy an important position in global forest resources and play a significant role in environmental restoration and economic development; thus, the stability and sustainability of artificial forests have become a focus of social concern [7]. The plantation ecosystem has a composition and structure similar to that of other forest ecosystems, of which plants, litter, and soil are the primary components [8,9]. The “plants–litter–soil” system is often described as a micro-continuum in which the chemical elements within the ecosystem are transferred between the different parts, leading to complex ecological processes [10,11]. At present, research on the stoichiometry of plantation ecosystems has mainly focused on the tree layer [12,13], but the stability of forest ecosystem functions depends on the specific interrelationships among the plant communities and the interactions between biotic and abiotic factors [14]. The competition of species in a plant community for limited resources can reflect the current development status of the community [15]. Therefore, a comprehensive study of the stoichiometry of plantation ecosystems is helpful to understand the ecological restoration of plantation forests.
In addition, the material circulation and energy flow in a forest ecosystem undergo obvious temporal and spatial changes, which increase the complexity of the nutrient relationship between the plants, litter, and soil [16,17]. Meanwhile, there are few studies on the time-varying mechanism of forest ecosystems’ stoichiometry [18]. Plants will maintain a relative balance with external environments by regulating their own nutrient characteristics and physiological activities. Their metabolism also varies with the growing season, which affects the stoichiometry of the plant body and even that of the ecosystem [19,20]. For example, Grigal et al. [21] found that foliage N:P ratios in five shrubs in Minnesota varied twofold over the course of a season. Moreover, Kerkhoff et al. [22] observed that with the delay of plant phenology, the proportion of stored substances in plant cells gradually increases. Therefore, only analyzing the stoichiometric characteristics of a certain growth stage in a forest ecosystem may magnify or weaken the understanding of its nutrient balance mechanism [23]. Identifying seasonal stoichiometric features in the “plants–litter–soil” continuum contributes to our understanding of the adaptation strategies of forest ecosystems to environmental changes.
The ecological environment of the Loess Plateau in China is extremely fragile, mainly due to the loss of its original vegetation and serious soil erosion [24]. In order to carry out ecological restoration, the “Grain for Green” project was implemented, and artificial vegetation was planted extensively in 1999. Robinia pseudoacacia, which has the advantages of extensive roots and strong nitrogen fixation abilities, has become the main afforestation species and performs critical ecological functions in the Loess Plateau [25,26]. However, due to climate change and high planting density, soil desiccation in the R. pseudoacacia plantation has increased, and its growth is subject to degradation. Therefore, it is necessary to understand the nutrient circulation pattern and stability mechanism of this species, subsequently allowing reasonable vegetation management and restoration measures to be formulated. Previous studies have paid attention to the spatial patterns and age sequence of the stoichiometry of the R. pseudoacacia plantation ecosystem [12,27]. However, systematic research on the seasonal variations in stoichiometry of this plantation is lacking. The seasonal patterns of nutrient contents in plant tissues represent the difference in nutrients’ absorption and utilization by vegetation, which is essential information for plantation tending and fertilization [28]. Here, we examine the C, N, and P contents and ratios in plants, litter, and soil during different growth periods of an R. pseudoacacia plantation on the Loess Plateau in 2017. We hypothesize that (i) the contents and ratios of carbon, nitrogen, and phosphorus in plants, litter, and soil have different seasonal variations; (ii) different vegetation types exhibit specific nutrient distribution patterns, and their N- and P-limiting conditions are different; (iii) different nutrients and stoichiometric relationships exist among trees, shrubs, and herbs, as well as among plants, litter, and soil.

2. Materials and Methods
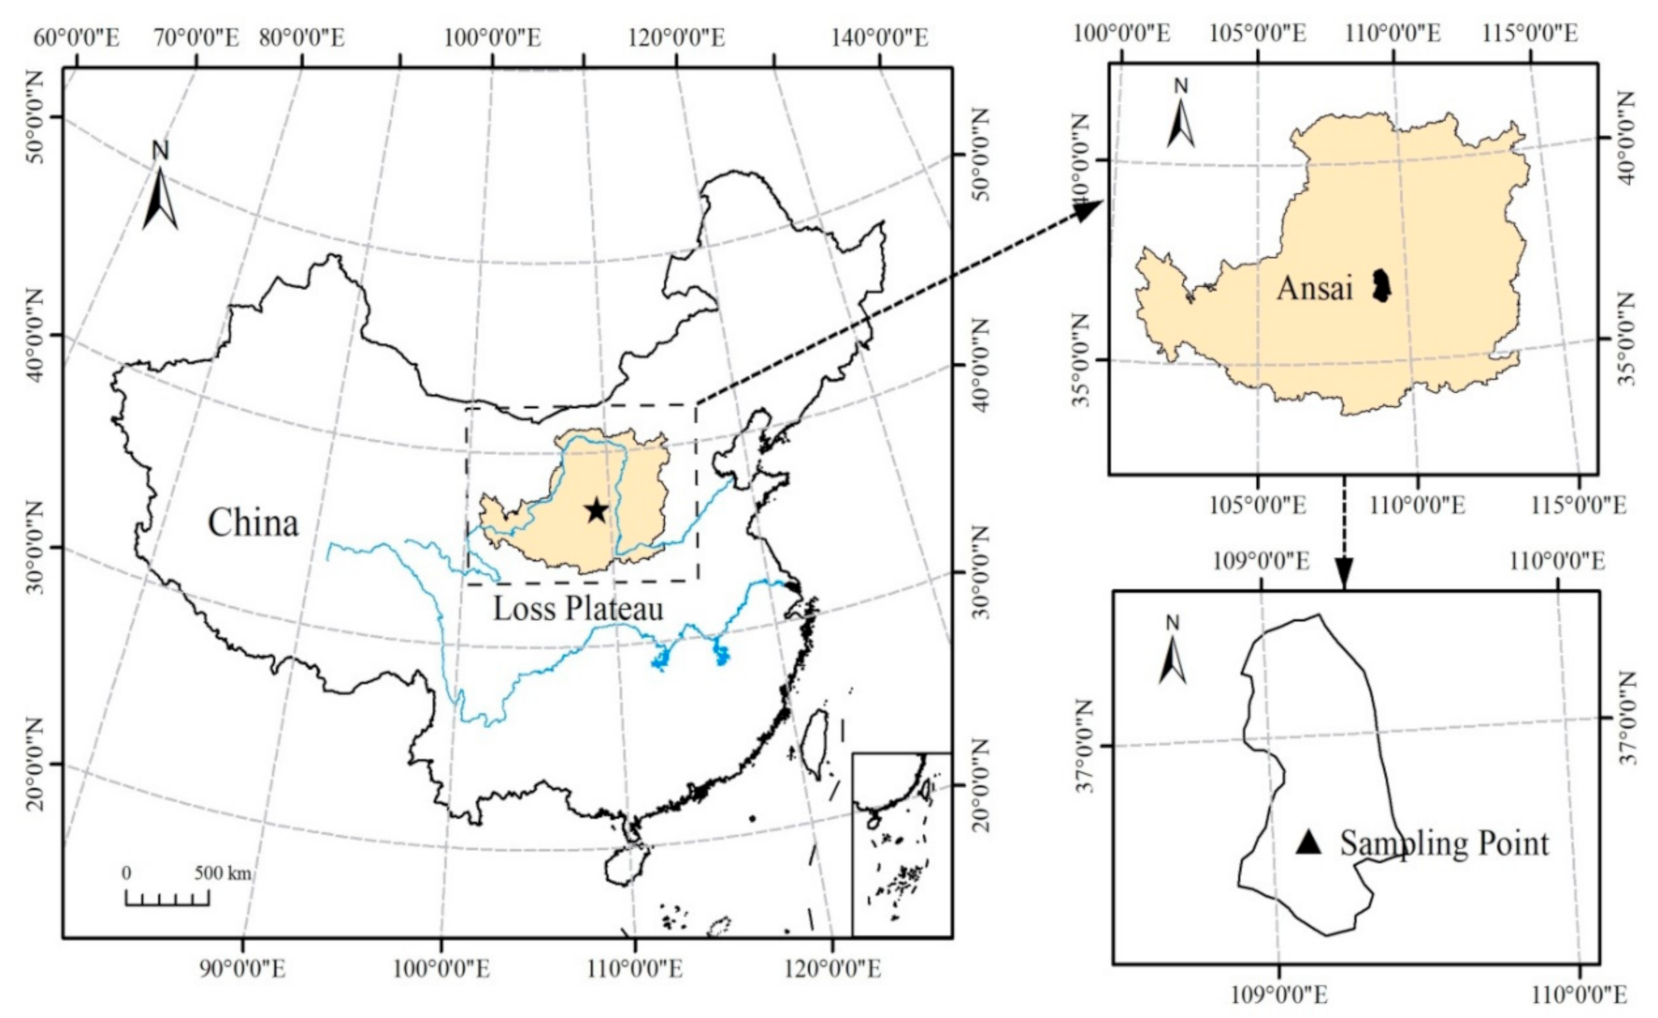
2.1. Study Area

This study was conducted in the Zhifanggou Watershed (36°46′29″–36°46′45″ N, 109°13′01″–109°16′44″ E), located in the Ansai County of Shaanxi Province, China (Figure 1). The study region contains typical loess hilly-gully landform types. The region has a warm, temperate semi-arid climate, with a mean annual precipitation of 505 mm, ~60% of which occurs over 7–9 months. The annual average temperature is 8.8 °C, and there are 2300–2400 h annual hours of sunshine. The soil type is mainly loess soil produced from the parent loess material and the soil texture is silt loam, which is susceptible to erosion. Vegetation types in the region belong to the forest-steppe zone. The dominant tree species is R. pseudoacacia, the understory shrubs are mainly Periploca sepium, and the herbs are Bothriochloa ischaemum, Artemisia gmelinii, and Patrinia heterophylla.

2.2. Experimental Design

We set up three sample plots in the mature forest of the R. pseudoacacia plantation (26 years old) with the same densities and areas (20 × 30 m), and the previous type of land use was farmland. The stand conditions in each plot were the same, and the distance between adjacent plots was at least 20 m. In each plot, three small shrub plots (2 × 2 m), herb plots (1 × 1 m), and litter plots (1 × 1 m) were arranged diagonally. Before sampling, the R. pseudoacacia data in the sample plot were investigated, including the tree heights, diameters at breast height (DBHs), and crown sizes. Robinia pseudoacacia in the study area germinate in late April, grow slowly before the end of June, grow rapidly from July to September, and grow slowly again in late September and October. According to the growth and development cycle of R. pseudoacacia, samples were collected in May (incipient growing season), August (middle growing season), and October (late growing season) of 2017.

2.3. Data Collection

Five healthy trees with consistent size and growth were selected according to their average DBHs. The leaves and branches of the trees were collected using a pole pruner from different directions in the canopy, and a growth cone was used to drill the stem samples. Fine root (<2 mm in diameter) samples were collected using a root drill at 20 cm in the topsoil to reduce damage to the plots. Understory shrubs and herbs were dug out of whole plants using the full harvest method [27], and the shrubs were divided into leaves, branches, and roots. The herbs were collected separately from the above-ground (leaves) and below-ground (roots) parts. A total of 243 plant samples were collected (108 tree samples, 81 shrub samples, and 54 herb samples). After the litter was collected from the litter frame, a soil core was drilled with a depth of 20 cm in each litter plot. A total of 27 litter and 27 soil samples were taken, respectively.
In the laboratory, the plant and litter samples were dried in an oven at 80 °C for 24 h to a constant weight and ground into powder by ball mill (Retsch MM 400, Retsch GmbH and Co KG, Haan, Germany). The soil samples were dried naturally and crushed. Afterwards, all dry samples of plants, litter, and soil were sieved through a 0.25-mm mesh before nutrient analyses. The organic carbon contents of the samples were determined using the dichromate oxidation method [29], while the total N and P contents of the samples were determined using the Kjeldahl method [30] and the HClO4–H2SO4 colorimetric method [31], respectively.

2.4. Statistical Analysis

A statistical analysis was conducted with SPSS 25.0 (IBM SPSS, Somers, NY, USA) software. After a one-sample Kolmogorov–Smirnov (K-S) test was performed to satisfy the normal distribution, a one-way ANOVA with a least significant difference (LSD) test was applied to analyze the differences of the C, N, and P contents and ratios in the plants, litter, and soil during different growth periods, and the significance was identified as p = 0.05. The coefficient of variation (CV) was the main index used to reflect the degree of a discrete random variable, whereby CV ≤ 0.1 is a weak variation, 0.1 < CV < 1.0 is a medium variation, and CV ≥ 1.0 is a strong variation. Relationships of the C:N:P stoichiometry between the different components of the ecosystem were quantified using Pearson’s correlation method. Cartograms were prepared with the Origin Pro 2017 (Originlab Lab, Northampton, MA, USA) software.

3. Results

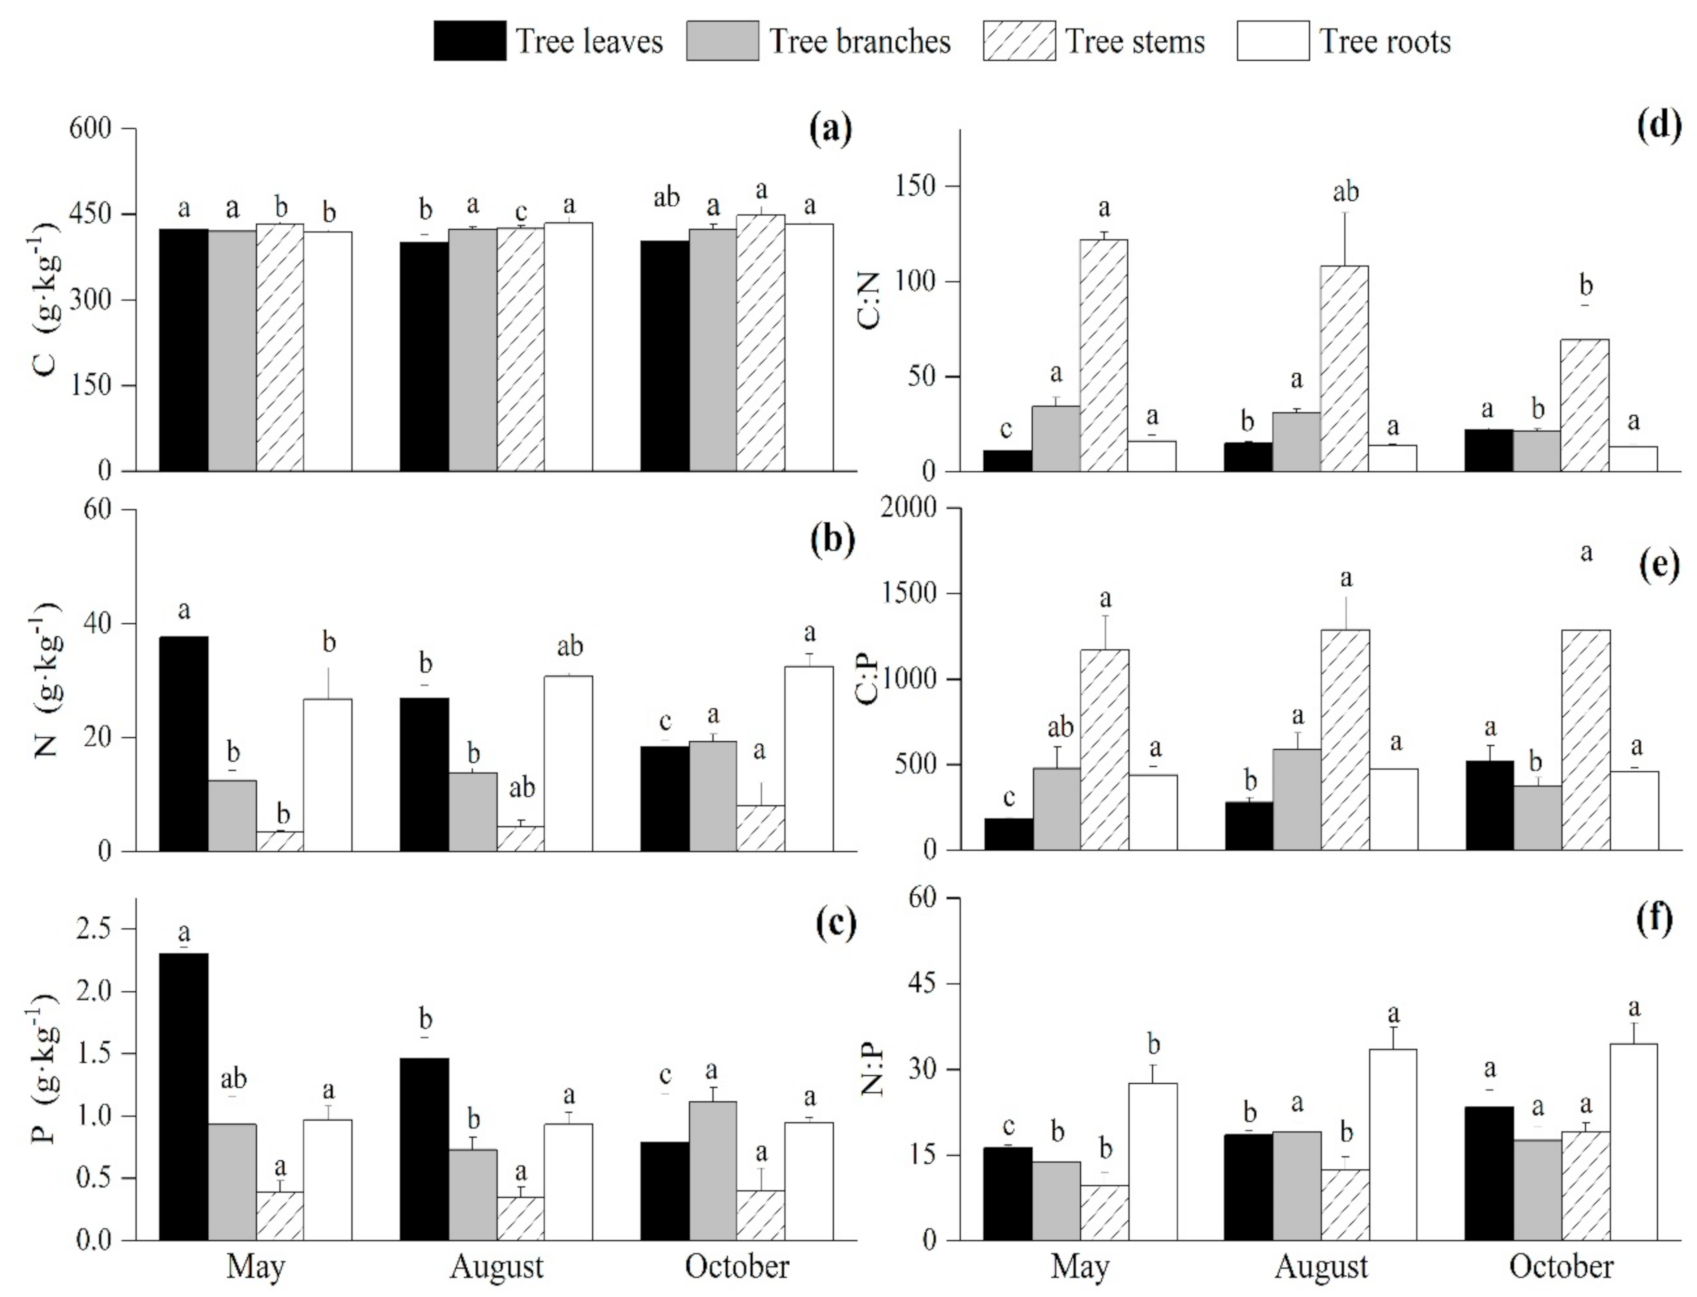
3.1. Seasonal Variations of the C:N:P Stoichiometry in the Arbor Layer

Throughout the growing season, the CV of the C content in each tissue was lower than 10%, which corresponds to a weak variation (Table 1). Except for the P content in the root system, the CVs of the N and P contents in the different tissues and the C:N:P ratios exceeded 10%, which corresponds to a medium variation. The C contents in the leaves and stems were obviously higher during the incipient growing season than during the middle growing season, while the branch and root C contents were the lowest in the incipient growing season (p < 0.05) (Figure 2a). Otherwise, the N and P contents in the leaves gradually decreased and the difference was significant (p < 0.05) (Figure 2b,c). Moreover, the N contents in the branches, stems, and roots during the late growing season were apparently higher than those during the incipient growing season, while the P contents were the lowest during the middle growing season (p < 0.05). The C:N, C:P, and N:P ratios in leaves gradually increased with time, and the difference was significant (p < 0.05) (Figure 2d–f). However, the C:N ratios in branches, stems, and roots exhibited the opposite trend to that in the leaves; the peak C:P ratios in the branches, stems, and roots occurred during the middle growing season, and their N:P ratios during the incipient growing season were considerably lower than those during the other periods (p < 0.05).

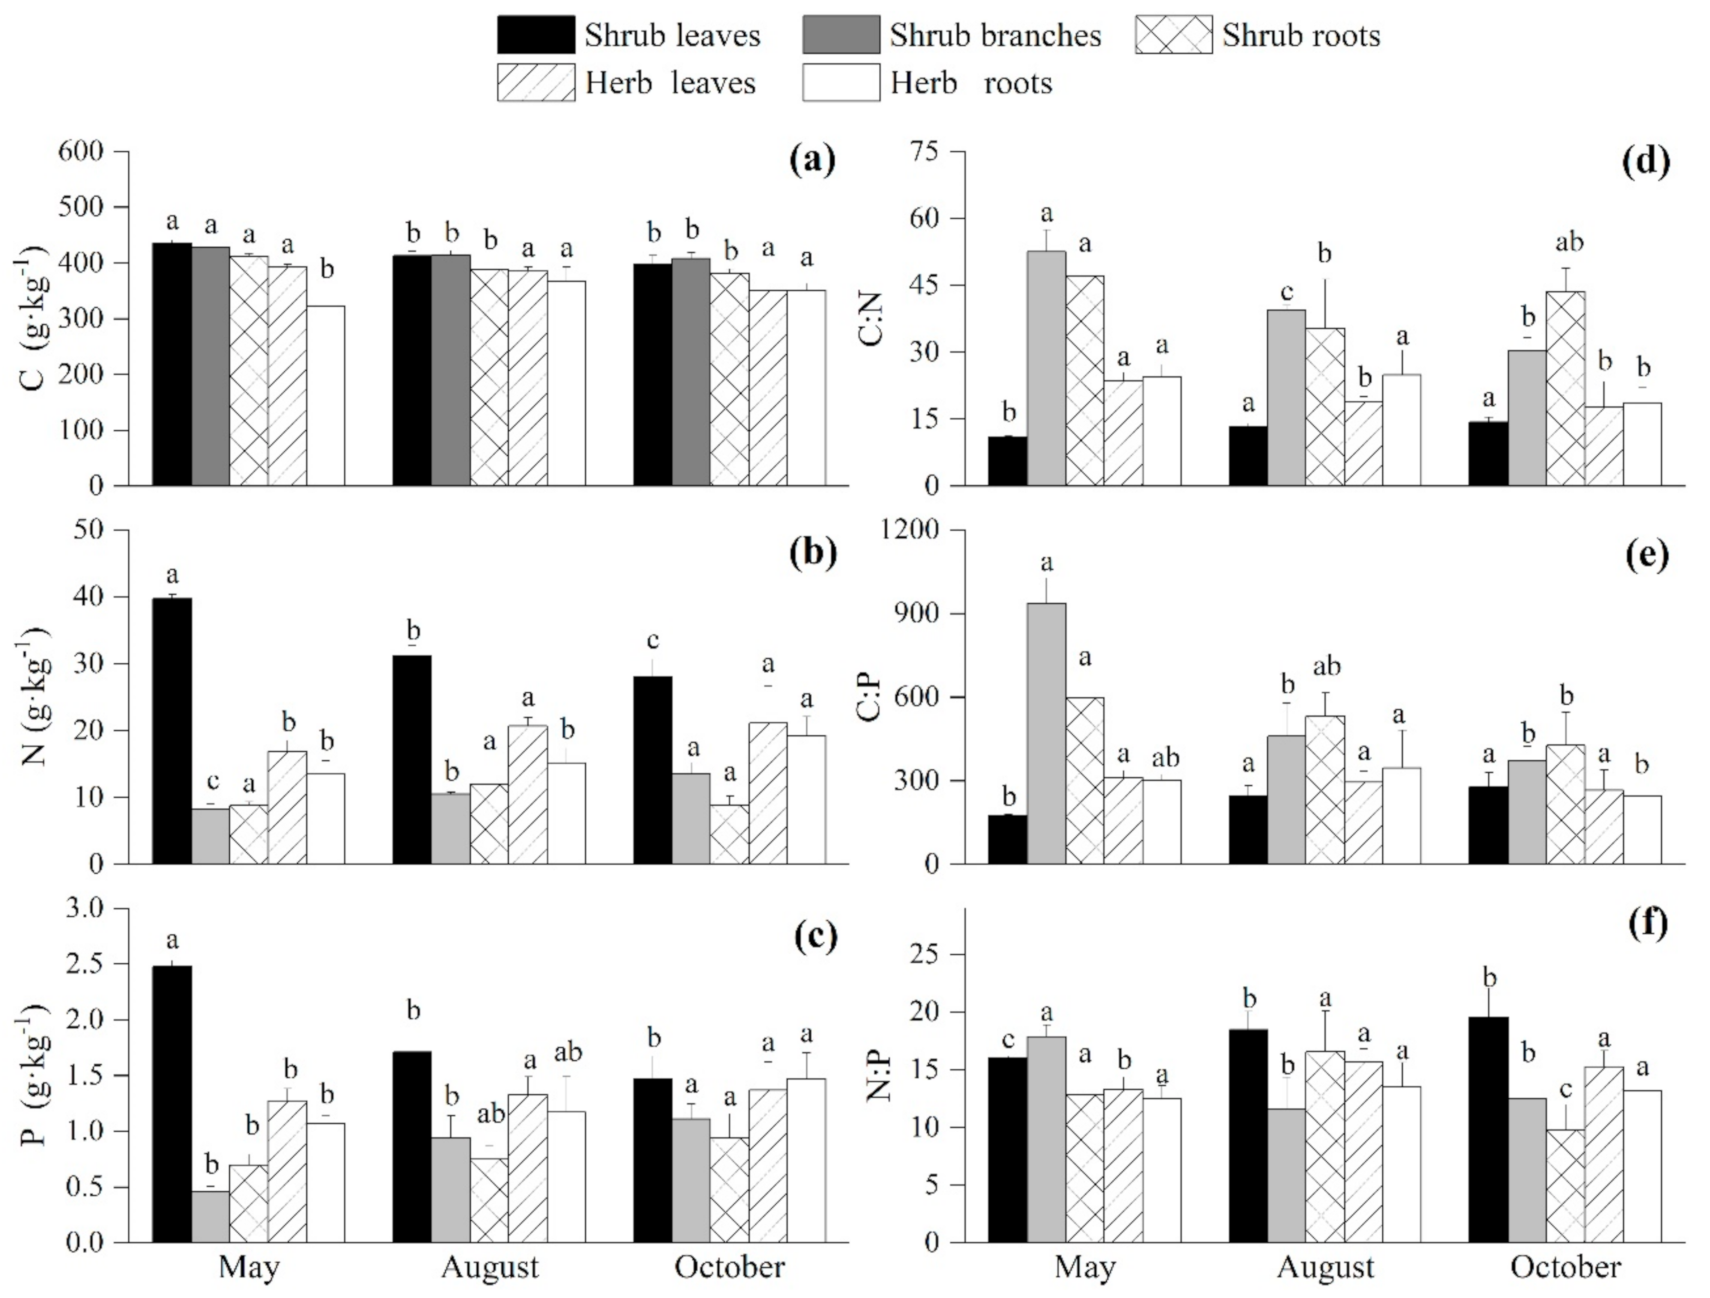
3.2. Seasonal Variations of the C:N:P Stoichiometry in the Undergrowth Layer

In addition to the C content, the CVs of the nutrient contents and ratios in the shrub and herb tissues were higher than 10%, indicating a moderate degree of variation (Table 1). Specifically, the C content in the shrub layer during the incipient growing season was notably higher than that during the other growth periods (p < 0.05; Figure 3a). The C content in the herb leaves decreased slowly with the change in the growing season but was significantly lower in the herb roots during the incipient growing season than in the other growing periods (p < 0.05). Unlike the shrub leaves, the shrub branch and herb layer N and P contents, as well as the P content of the shrub roots, increased gradually with time. The differences between the incipient and late growth seasons were significant (p < 0.05; Figure 3b,c). The C:N, C:P, and N:P ratios in the shrub leaves gradually increased, while the shrub branch ratios were significantly different between the incipient and late growing seasons (p < 0.05) (Figure 3d–f). Meanwhile, the peak C:N and C:P ratios in the shrub roots and herb leaves and the peak N:P ratios in the shrub roots and the herb layer were observed during the incipient and middle growing seasons, respectively.

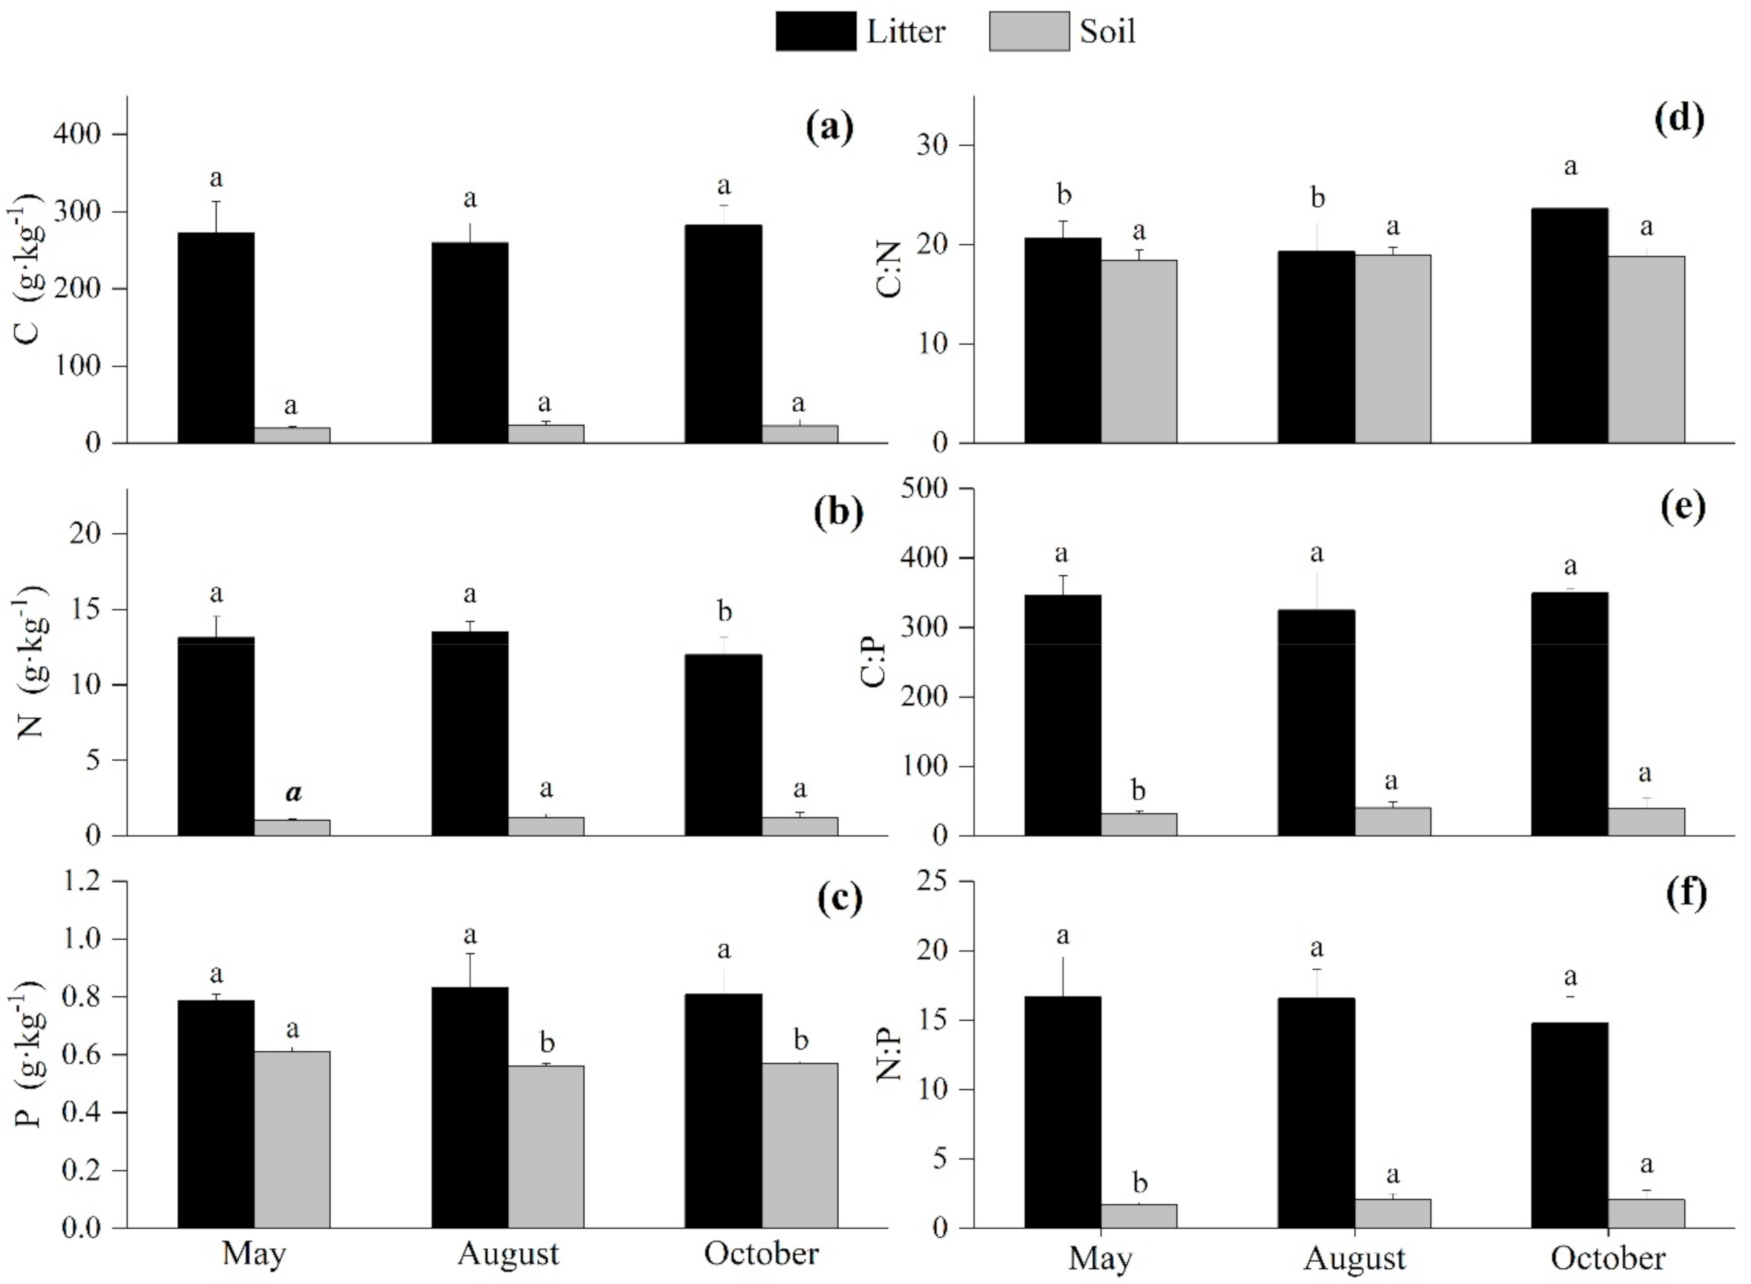
3.3. Seasonal Variations of the C:N:P Stoichiometry in the Litter and Soil

Overall, the C, N, and P contents and ratios in the litter all had medium degrees of variation, among which the CV of the C:P ratio was the highest (23.38%; Table 1). The CVs of the soil P content and C:N ratio were 3.89% and 4.63%, respectively, indicating weak variations. Litter and soil C contents during the different growth periods were relatively stable (Figure 4a). Both the litter and soil peak N contents occurred during the middle growing season, while the litter N content during the late growing season was significantly different from that of the other growth periods (p < 0.05; Figure 4b). Unlike in the litter, we observed that the soil P content during the incipient growing season was obviously higher than that during the other growing stages (p < 0.05; Figure 4c). Additionally, the C:N ratios in the litter and soil were the highest during the late and middle growing seasons, respectively (Figure 4d). The C:P and N:P ratios in the litter during the different growth periods fluctuated slightly, while those of the soil during the incipient growing season were obviously lower than those during other periods (p < 0.05; Figure 4e,f).

3.4. Correlations of the C:N:P Stoichiometry Among the Plants, Litter, and Soil

The nutrient elements in the different plant tissues were closely linked (Table 2). The C content of the leaves showed a significant positive correlation with the C contents in branches and stems in the tree layer (p < 0.05). By contrast, the N and P contents of the leaves were negatively correlated with those in the other tissues. With the exception of the stems and roots, the N contents were significantly correlated among the different tissues (p < 0.01). In the shrub layer, the C contents in the different tissues showed a significant positive correlation, while the N and P contents in the leaves were negatively correlated with those in the other tissues. In addition, the N and P contents in the herb leaves and herb roots showed a significant positive correlation (p < 0.01).
Strong positive correlations were present between the nutrient contents and ratios in the tree and shrub leaves, while the N contents and the C:N and C:P ratios in the tree and herb leaves were inversely correlated (p < 0.01; Table 3). The C and N contents in the tree leaves and the C:N ratio were positively correlated with those in the litter (p < 0.05). Moreover, the C and P contents in the soil were also significantly correlated with those in the tree and shrub leaves (p < 0.05). Except for the C:N ratio, there were no correlations among the nutrients in the shrubs, herbs, and litter. A significant positive correlation was observed between the P content in the herb leaves and litter, as well as between the N content and N:P ratio in the herb leaves and soil (p < 0.05). However, the C and N contents and C:P and N:P ratios between the litter and soil had significant negative correlations (p < 0.05).

4. Discussion

4.1. Seasonal Variations of the C, N, and P Contents and Ratios of the Plants

The average C content of the R. pseudoacacia leaves was lower than the average C content of Chinese and global plants (Table 4), which is consistent with the law of low C content in angiosperm tissues [32]. In addition, the C:P and N:P ratios of the leaves were higher than the Chinese and global averages, while C:N was lower than the global average (Table 4). These differences may be related to different vegetation types, climatic features, and sampling periods [33,34,35]. Notably, previous studies have found that the P content and C:N ratio of the R. pseudoacacia leaves in the Loess Plateau were significantly higher than the Chinese and global averages [27,36], which is inconsistent with our results. This indicated that the sampling period may cause deviations in our understanding of plant nutrient balance.
In order to adapt to environmental changes, plants can regulate the relative abundances of their own nutrients; thus, changes in nutrient contents among plant tissues may be due to trade-offs between utilization and storage efficiency [33,37]. Overall, the content of structural substance C in plants was relatively high and stable, and the C contents were positively correlated among the different tissues of tree and shrub, which is consistent with the results of other studies [38,39]. The contents of N and P in plant tissues were low, and the N and P contents of the tree and shrub leaves decreased during the growth season (Figure 2 and Figure 3). Meanwhile, those of the leaves and other tissues were negatively correlated, while the opposite correlation was observed for the branches, stems, and roots (Table 2). This indicates that N and P were transferred and had an influence on each other among the tissues. Specifically, during the incipient growing season, the substances in perennial plants mainly carry out morphological construction, which requires a large amount of protein and nucleic acids to support the rapid division of cells [35,40]; therefore, the leaves had higher N and P absorption during this period. Meanwhile, higher N contents in the leaves will increase the concentration of cell fluid, improve the water potential in the leaves, and reduce the drought stress on the plant [41]. Aside from the biological characteristics of the plant itself, significant changes in temperature and precipitation during the different seasons also affect the absorption of nutrients [42]. During the middle growing season, the plant metabolic rate increases with increased ambient temperatures and precipitation. This is accompanied by a rapid increase in biomass, resulting in the dilution of nutrients [43]. Plants grow slowly during the late growing season; therefore, the demand for nutrients in the leaves decreases. Meanwhile, the plant re-absorbs nutrients from senescent tissues, causing the transfer of nutrients in senescent leaves [44]. The herbs of annual vegetation will store a large amount of nutrients for reproduction in a short growth period [45], so the N and P contents in herb tissues gradually increased with the growing season.
The growth rate hypothesis states that organisms with lower C:N and C:P ratios have higher growth rates [46]. In this study, the C:N and C:P ratios of tree leaves enlarged with the variation in the growing season (Figure 2), which was mainly related to the migration and dilution of N and P nutrients. The seasonal variations of the C:N and C:P ratios of the other organs did not conform to this theory, which is consistent with previous findings [47,48]. This may be because the growth rate hypothesis is mainly based on marine organisms, while the material composition and growth mode of higher plants are more complex [46,49,50]. In addition, as the production organ for organic matter synthesis in green plants, leaves can best reflect the growth status of plants [51]. Therefore, it may be more appropriate to analyze threats to the health of the forest ecosystem using the stoichiometry of leaves. Generally, the C:N and C:P ratios represent the ability of plants to assimilate and store carbon when they absorb nutrients, reflecting the utilization efficiency of nutrients by plants [52,53]. The C:N ratio of the R. pseudoacacia leaves was significantly lower than the global average, while the C:P ratio was the opposite, indicating that the growth of R. pseudoacacia in the area had lower N use efficiency and higher P use efficiency. Furthermore, the R. pseudoacacia had a higher utilization efficiency of N and P elements in the late growing season. The N:P ratios in the leaves reflect the nutrients supplied by the environment to plant growth. Koerselman and Meuleman [54] found that when leaves’ N:P < 14, N is limited, and when leaves’ N:P > 16, P is limited. For an N:P ratio of between 14 and 16, plant growth is limited by both N and P. The form and intensity of plant nutrient restriction may change in different growth periods [51]. Although seasonal factors had a remarkable impact on leaf N:P ratio in our study, leaf N:P ratio during the different growth periods was > 16 (Figure 2), indicating that the growth of R. pseudoacacia was mainly restricted by P in this region. This may be caused by low soil P contents in the Loess Plateau, such that the plants are more restricted by P than N, which is also related to the strong nitrogen fixation ability of R. pseudoacacia [55].

4.2. Seasonal Variation of the C:N:P Stoichiometry in the Litter and Soil

Litter is the carrier that connects plants and soil and is where organic matter is broken down into small inorganic molecules by microorganisms and supplied to the plants. The litter C:N ratio can reflect its ability to decompose and store nutrients, whereby a lower ratio means less lignin content that is conducive to the decomposition of litter [30]. When the litter C:N > 25, the microorganisms will not only use N in the matrix, but will also compete with the plants for the available N in the soil to meet their own growth needs [56]. We found that the litter C:N ratios in the different growth periods were lower than 25 (Figure 4) and were lower than the Chinese and global averages, thus benefiting the decomposition of the litter. Suitable temperatures and abundant precipitation can optimize the microbial community and improve extracellular enzyme activity in soil [57]. Therefore, the litter C:N ratio was the lowest during the middle growing season, at which time the turnover of litter decomposes faster and the nutrient storage capacity is poor. In addition, the litter C:N ratio in the late growing season was higher than that in the other growth periods (Figure 4), which may be due to the enhanced plant nutrient re-absorption capacity from the senescent tissues and the decreased N proportion in the litter. Aerts [44] found that plants growing in nutrient-rich environments have relatively high litter C:P and N:P ratios. In our study, the C:P and N:P ratios were both lower than the Chinese and global averages (Figure 4), reflecting the lower growth potential of plant communities in the region, especially the lack of availability of P.
Over a relatively short period, the factors of time and parent material have little influence on the formation of natural soil, especially topsoil nutrients [58]. The sampling month had a weak influence on soil C and N contents and the C:N ratios in our study (Figure 4). The reactions of soil C and N contents to environmental changes were essentially synchronous, and variations in C:N ratios during the different growth periods did not manifest (Figure 4). The reason for this is that C and N, as structural components, have relatively fixed ratios in the accumulation and consumption processes [59,60]. The source of soil P is relatively fixed, and its mass fraction is mainly affected by the parent materials. High temperatures and rain accelerate the weathering rate of rock and the leaching of phosphorus [61]; thus, soil P content during the middle growing season was slightly lower (Figure 4). Soil C:N ratio is a crucial parameter for measuring soil quality and can indicate nutrient circulation in the soil [55,58]. In our study, the soil C:N (18.72) was higher than the Chinese (11.90) [55] and global (14.3) [62] averages, indicating that the mineralization capacity of the soil organic matter in the R. pseudoacacia plantation was weak. The soil C:P ratio is an essential direction for judging the release potential of soil P elements, whereby the availability of P decreases with an increase in the soil C:P ratio [63]. The soil C:P (35.19) ratio measured in this study was lower than the Chinese (61.00) [55] and global (186.00) [59] averages, and this C:P value is conducive to the release of more P from forest soil microorganisms during the mineralization process. This means that although the soil P content in the study area is significantly lower than the average in China, the R. pseudoacacia leaves can still maintain a high P content (Table 4). Meanwhile, the soil C:P ratio in the incipient growing season was significantly lower than in the other growing periods, indicating that the availability of soil P during this period was the highest.

4.3. Correlation Analysis of Plants, Litter and Soil C, N, P Stoichiometry

The competition of plant communities for resources is the internal cause for the development and succession of forest ecosystems [14]. We found that there was a significant positive correlation between the leaf nutrients of trees and shrubs, indicating that the competition between trees and shrubs for soil nutrients was weak. The nutrients of herbs were negatively correlated with the nutrients of trees and shrubs, and the correlation of N content was extremely significant. Therefore, the arbor layer may have exerted stress to the N absorption of the understory herbs, and this strong competition for underground resources will cause the R. pseudoacacia plantation ecosystem to be unable to effectively use environmental resources [64]. Thus, appropriate management measures can be implemented to optimize the community structure.
Plants, litter, and soil are the basic components of the nutrient cycle in forest ecosystems, whereby elements such as C, N, and P are transported and transformed among these components [30]. Correlation analyses of the collected data indicate that the correlation of C and N between plants and litter is contrary to that of P (Table 3), indicating that the decomposition and utilization of different nutrients in the litter may not be synchronous. Previous studies have illustrated that the correlation of certain nutrient contents between plants and soil can also indicate that plant growth is limited by this element, especially because leaves are more sensitive to the changes in soil nutrients [10,30]. In this study, the P content between trees and soil and the N content between herbs and soil exhibited a significant positive correlation (Table 3). This indicates that the supply capacity of the soil P content in this region cannot meet the growth demand of R. pseudoacacia, and the understory herbs lack N. Litter releases nutrients into the soil via processes such as leaching, crushing, and decomposition, and we found that the C and N contents were significantly correlated between the litter and soil, while the correlation of litter and soil P contents was not significant (Table 3). The reason for this may be that the P components in the soil not only come from the decomposition of litter but also from the leaching and weathering of rock parent materials [61,65].

5. Conclusions

The C:N:P stoichiometry of the plants, litter, and soil of the R. pseudoacacia plantation on the Loess Plateau had different seasonal patterns. Overall, the influence of seasonal changes on the nutrients of plant tissues, especially on the N and P contents of leaves, was greater than that on the litter and soil. The N and P contents in both the trees and shrub leaves gradually decreased throughout growing seasons, while those in herbs showed an opposite trend. The C:N, C:P, and N:P ratios of leaves on trees had significant differences in different growing seasons, and the N and P utilization efficiencies of trees and shrubs were the lowest in the incipient growing season. The time factor should be considered when using C:N:P stoichiometry to reflect plant functionality traits. Additionally, the P content between trees and soil and the N content between herbs and soil exhibited a significant positive correlation and their growth was restricted by soil P and N, respectively. Therefore, corresponding measures of artificial tending and nutrient management should be implemented in this area. These findings are critical for understanding the nutrient balance in the R. pseudoacacia plantation and contribute to the sustainable management of this species in the Loess Plateau. However, due to differences in the external environment, short-term data may limit our understanding of nutrient regulation mechanisms in such forest ecosystems. Hence, long-term observations should be strengthened in the future to explore the survival and adaptation strategies of artificial forests.

Author Contributions

Y.C. (Yang Cao) and Y.C. (Yunming Chen) conceived and designed the experiments; X.W. and W.X. performed the experiments; C.D. and Y.Q. analyzed the data; Y.C. (Yang Cao) and Y.C. (Yunming Chen) contributed reagents/materials/analysis tools; C.D. wrote the manuscript. All authors have read and agreed to the published version of the manuscript.

Funding

This study was funded by the National Nature Science Foundation of China, grant numbers 41771556 and 41977418, the National Key Research and Development Project of China, grant number 2016YFC0501703, the CAS “Light of West China” Program, grant number XAB2017A02, and the Natural Science Foundation of Shaanxi Province, grant number 2017sbkj-01.

Informed Consent Statement

Not applicable.

Data Availability Statement

The data presented in this study are available on request from the corresponding author. The data are not publicly available due to privacy.

Conflicts of Interest

The authors declare no conflict of interest.

References

  1. Elser, J.J.; Hamilton, A. Stoichiometry and the new biology: The future is now. PLoS Biol. 2007, e181. [Google Scholar] [CrossRef]
  2. Han, W.X.; Fang, J.Y.; Guo, D.L.; Zhang, Y. Leaf nitrogen and phosphorus stoichiometry across 753 terrestrial plant species in China. New Phytol. 2005, 168, 358–377. [Google Scholar] [CrossRef]
  3. Klausmeier, C.A.; Litchman, E.; Daufresne, T.; Levin, S.A. Optimal nitrogen-to-phosphorus stoichiometry of phytoplankton. Nature 2004, 429, 171–174. [Google Scholar] [CrossRef]
  4. Sardans, J.; Peñuelas, J. The role of plants in the effects of global change on nutrient availability and stoichiometry in the Plant-Soil System. Plant Physiol. 2012, 160, 1741–1761. [Google Scholar] [CrossRef] [PubMed] [Green Version]
  5. Li, L.; Liu, B.; Gao, X.P.; Li, X.Y.; Li, C.D. Nitrogen and phosphorus addition differentially affect plant ecological stoichiometry in desert grassland. Sci. Rep. 2019, 9. [Google Scholar] [CrossRef] [PubMed]
  6. McGroddy, M.E.; Daufresne, T.; Hedin, L.O. Scaling of C:N:P stoichiometry in forests worldwide: Implications of terrestrial redfield-type ratios. Ecology 2004, 85, 2390–2401. [Google Scholar] [CrossRef]
  7. Maas-Hebner, K.G.; Emmingham, W.H.; Larson, D.J.; Chan, S.S. Establishment and growth of native hardwood and conifer seedlings underplanted in thinned Douglas-fir stands. For. Ecol. Manag. 2005, 208, 331–345. [Google Scholar] [CrossRef]
  8. Yang, Y.; Liu, B.R.; An, S.S. Ecological stoichiometry in leaves, roots, litters and soil among different plant communities in a desertified region of Northern China. Catena 2018, 166, 328–338. [Google Scholar] [CrossRef]
  9. Berg, B. Litter decomposition and organic matter turnover in northern forest soils. For. Ecol. Manag. 2000, 133, 13–22. [Google Scholar] [CrossRef]
  10. Bai, X.J.; Wang, B.R.; An, S.S.; Zeng, Q.C.; Zhang, H.X. Response of forest species to C:N:P in the plant-litter-soil system and stoichiometric homeostasis of plant tissues during afforestation on the Loess Plateau, China. Catena 2019, 183, 104186. [Google Scholar] [CrossRef]
  11. Manzoni, S.; Jackson, R.B.; Trofymow, J.A.; Porporato, A. The global stoichiometry of litters nitrogen mineralization. Science 2008, 321, 684–686. [Google Scholar] [CrossRef]
  12. Gao, D.X.; Zhang, W.; Ren, C.J.; Dai, Y.Y.; Qiao, W.J.; Chen, Z.X.; Yang, G.H.; Han, X.H. Ecological stoichiometry characteristics of soil and leaves during the recovery process of typical vegetation on the Loess Plateau. Acta Ecol. Sin. 2019, 39, 3622–3630. (In Chinese) [Google Scholar]
  13. Fan, H.B.; Wu, J.P.; Liu, W.F.; Yuan, Y.H.; Hu, L.; Cai, Q.K. Linkages of plant and soil C:N:P stoichiometry and their relationships to forest growth in subtropical plantations. Plant Soil 2015, 392, 127–138. [Google Scholar] [CrossRef]
  14. Führer, E. Forest functions, ecosystem stability and management. For. Ecol. Manag. 2000, 132, 29–38. [Google Scholar] [CrossRef]
  15. Loreau, M.; De Mazancourt, C.; Duffy, E. Biodiversity and ecosystem stability: A synthesis of underlying mechanisms. Ecol. Lett. 2013, 16, 106–115. [Google Scholar] [CrossRef] [PubMed]
  16. Lü, X.; Reed, S.; Hou, S.L.; Hu, Y.Y.; Wei, H.W.; Lü, F.M.; Cui, Q.; Han, X.G. Temporal variability of foliar nutrients: Responses to nitrogen deposition and prescribed fire in a temperate steppe. Biogeochemistry 2017, 133, 295–305. [Google Scholar] [CrossRef]
  17. Zhao, Q.Q.; Bai, J.H.; Liu, Q.; Lu, Q.Q.; Gao, Z.Q.; Wang, J.J. Spatial and seasonal variations of soil carbon and nitrogen content and stock in a Tidal Salt Marsh with Tamarix chinensis, China. Wetlands 2016, 36, 145–152. [Google Scholar] [CrossRef]
  18. Ågren, G.I. Stoichiometry and nutrition of plant growth in natural communities. Annu. Rev. Ecol. Evol. Syst. 2008, 39, 153–170. [Google Scholar] [CrossRef]
  19. Yang, Y.H.; Luo, Y.Q. Carbon:nitrogen stoichiometry in forest ecosystems during stand development. Glob. Ecol. Biogeogr. 2011, 20, 354–361. [Google Scholar] [CrossRef]
  20. Wright, I.J.; Westoby, M. Nutrient concentration, resorption and lifespan: Leaf traits of Australian sclerophyll species. Funct. Ecol. 2003, 17, 11–19. [Google Scholar] [CrossRef] [Green Version]
  21. Grigal, D.F.; Ohmann, L.F.; Brander, R.B. Seasonal dynamics of tall shrubs in northeastern Minnesota: Biomass and nutrient element changes. For. Sci. 1976, 195–208. [Google Scholar] [CrossRef]
  22. Kerkhoff, A.J.; Enquist, B.J.; Elser, J.J.; Fagan, W.F. Plant allometry, stoichiometry and the temperature-dependence of primary productivity. Glob. Ecol. Biogeogr. 2005, 14, 585–598. [Google Scholar] [CrossRef]
  23. Liu, F.D.; Liu, Y.H.; Wang, G.M.; Song, Y.; Liu, Q.; Li, D.S.; Mao, P.L.; Zhang, H. Seasonal Variations of C:N:P stoichiometry and their trade-offs in different organs of Suaeda salsa in Coastal Wetland of Yellow River Delta, China. PLoS ONE 2015, 10, e138169. [Google Scholar] [CrossRef]
  24. Jing, L.; Li, J.P.; Zhang, Y.; Ma, H.Y.; Li, J. Study on dry soil layers under different land-use systerms in the Loess Plateau. Pratacult. Sci. 2018, 35, 1829–1835. (In Chinese) [Google Scholar]
  25. Wu, D.Y.; Jiao, J.Y.; Yu, W.J.; Xu, H.Y.; Chen, Y.X. Respone characteristics of Locust growth, understory vegetation and soil moisture on planting density in northern Shaanxi. Acta Bot. Boreali-Occident. Sin. 2017, 37, 346–355. (In Chinese) [Google Scholar]
  26. Wu, Z.B.; Yang, X.M. Artificial Robinia peseudoacacia growth and soil moisture variation in Loessial Hilly-Gully region. Res. Soil Water Conserv. 2004, 11, 117–120. (In Chinese) [Google Scholar]
  27. Cao, Y.; Chen, Y.M. Coupling of plant and soil C:N:P stoichiometry in black locust (Robinia pseudoacacia) plantations on the Loess Plateau, China. Trees 2017, 31, 1559–1570. [Google Scholar] [CrossRef]
  28. Du, M.; Feng, H.; Zhang, L.; Pei, S.; Tang, X. Variations in carbon, nitrogen and phosphorus stoichiometry during a growth season within a Platycladus orientalis plantation. Pol. J. Environ. Stud. 2020, 29. [Google Scholar] [CrossRef]
  29. Yeomans, J.C.; Bremner, J.M. A rapid and precise method for routine determination of organic carbon in soil. Commun. Soil Sci. Plant Anal. 1988, 19, 1467–1476. [Google Scholar] [CrossRef]
  30. Zhang, G.Q.; Zhang, P.; Peng, S.Z.; Chen, Y.M.; Cao, Y. The coupling of leaf, litter, and soil nutrients in warm temperate forests in northwestern China. Sci. Rep. 2017, 7. [Google Scholar] [CrossRef] [PubMed]
  31. Parkinson, J.A.; Allen, S.E. A wet oxidation procedure suitable for the determination of nitrogen and mineral nutrients in biological material. Commun. Soil Sci. Plant Anal. 2009, 6, 1–11. [Google Scholar] [CrossRef]
  32. Thomas, S.C.; Martin, A.R. Carbon content of tree tissues: A synthesis. Forests 2012, 3, 332–352. [Google Scholar] [CrossRef] [Green Version]
  33. Abbas, M.; Ebeling, A.; Oelmann, Y.; Ptacnik, R.; Roscher, C.; Weigelt, A.; Weisse, W.W.; Wilcke, W.; Hillebrand, H. Biodiversity effects on plant stoichiometry. PLoS ONE 2013, 8, e58179. [Google Scholar] [CrossRef] [PubMed] [Green Version]
  34. Li, H.L.; Crabbe, M.J.C.; Xu, F.L.; Wang, W.L.; Niu, R.L.; Gao, X.; Zhang, P.; Chen, H.K. Seasonal Variations in carbon, nitrogen and phosphorus concentrations and C:N:P stoichiometry in the leaves of differently aged Larix principis-rupprechtii Mayr. Plantations. Forests 2017, 8, 373. [Google Scholar] [CrossRef] [Green Version]
  35. Bai, Y.; Wu, J.G.; ClarK, C.M.; Pan, Q.M.; Zhang, L.X.; Chen, S.P.; Wang, Q.B.; Han, X.Q. Grazing alters ecosystem functioning and C:N:P stoichiometry of grasslands along a regional precipitation gradient. J. Appl. Ecol. 2012, 49, 1204–1215. [Google Scholar] [CrossRef]
  36. Yang, J.J.; Zhang, X.R.; MA, L.S.; Chen, Y.A.; Dang, T.H.; An, S.S. Ecological stoichiometric relationships between components of Robinia pseudoacacia forest in loess plateau. Acta Pedol. Sin. 2014, 51, 133–142. (In Chinese) [Google Scholar]
  37. Ye, Y.S.; Liang, X.Q.; Chen, Y.X.; Li, L.; Ji, Y.J.; Zhu, C.Y. Carbon, Nitrogen and phosphorus accumulation and partitioning, and C:N:P stoichiometry in late-season rice under different water and nitrogen managements. PLoS ONE 2014, 9, e101776. [Google Scholar] [CrossRef] [PubMed]
  38. Wang, Z.N.; Lu, J.Y.; Yang, H.M.; Zhang, X.; Luo, C.L.; Zhao, Y.X. Resorption of nitrogen, phosphorus and potassium from leaves of lucerne stands of different ages. Plant Soil. 2014, 383, 301–312. [Google Scholar] [CrossRef]
  39. Sardans, J.; Rivas-Ubach, A.; Peuelas, J. Factors affecting nutrient concentration and stoichiometry of forest trees in Catalonia (NE Spain). For. Ecol. Manag. 2011, 262, 2024–2034. [Google Scholar] [CrossRef]
  40. Yu, Q.; Wu, H.H.; He, N.P.; Lu, X.T.; Wang, Z.P.; Elser, J.J. Testing the Growth Rate Hypothesis in vascular plants with above- and below-ground biomass. PLoS ONE 2012, 7, e32162. [Google Scholar] [CrossRef] [Green Version]
  41. Guo, H.; Zhuang, W.W.; Li, J. Dynamic analysis of stoichiometric ratios of C, N, and P during different growth periods in four herbaceous plants from Gurbantünggüt Desert. Plant Sci. J. 2019, 37, 356–366. (In Chinese) [Google Scholar]
  42. Santa Regina, I.; Rico, M.; Gallego, M.H.A. Seasonal variation in nutrient concentration in leaves and branches of Quercus pyrenaica. J. Veg. Sci. 1997, 8, 651–654. [Google Scholar] [CrossRef]
  43. Townsend, A.R.; Cleveland, C.C.; Asner, G.P.; Bustamante, M.M. Controls over foliar N:P ratios in tropical rain forests. Ecology 2007, 88, 107–118. [Google Scholar] [CrossRef]
  44. Aerts, R. Nutrient resorption from senescing leaves of perennials: Are there general patterns. J. Ecol. 1996, 84, 597–608. [Google Scholar] [CrossRef]
  45. Liu, D.; Zhang, J.; Biswas, A.; Cao, J.; Qi, X. Seasonal dynamics of leaf stoichiometry of phragmites australis: A case study from Yangguan Wetland, Dunhuang, China. Plants 2020, 9, 1323. [Google Scholar] [CrossRef] [PubMed]
  46. Elser, J.J.; Sterner, R.W.; Gorokhova, E.; Fagan, W.F.; Markow, T.A.; Cotner, J.B.; Harrison, J.F.; Hobbie, S.E.; Odell, G.M.; Weider, L.W. Biological stoichiometry from genes to ecosystems. Ecol. Lett. 2000, 3, 540–550. [Google Scholar] [CrossRef] [Green Version]
  47. Sun, J.N.; Gao, P.; Li, C.; Wang, R.J.; Niu, X.; Wang, B. Ecological stoichiometry characteristics of the leaf-litter-soil continuum of Quercus acutissima Carr. and Pinus densiflora Sieb. in Northern China. Environ. Earth Sci. 2019, 78. [Google Scholar] [CrossRef]
  48. Chen, C.; Wang, G.J.; Zhao, Y.; Zhou, G.X.; Li, L.; Gao, J.Q. Seasonal dynamics and allometric growth relationships of C, N and P stoichiometry in the organs of Cunninghamia lanceolata from Huitong. Acta Ecol. Sin. 2016, 36, 7614–7623. [Google Scholar] [CrossRef] [Green Version]
  49. Forja, J.M.; Blasco, J.; Gómez-Parra, A. Spatial and seasonal variation of in situ benthic fluxes in the bay of Cadiz (South-west Spain). Estuar. Coast. Shelf Sci. 1994, 39, 127–141. [Google Scholar] [CrossRef]
  50. Waive, J.; Larsson, U. Seasonal changes in Baltic Sea seston stoichiometry: The influence of diazotrophic cyanobacteria. Mar. Ecol. Prog. 2010, 13–25. [Google Scholar] [CrossRef]
  51. Li, H.L.; Crabbe, M.J.C.; Xu, F.L.; Wang, W.L.; Ma, L.H.; Niu, R.L.; Gao, X.; Li, X.X.; Zhang, P.; Ma, X.; et al. Seasonal variations in carbon, nitrogen and phosphorus concentrations and C:N:P stoichiometry in different organs of a Larix principis-rupprechtii Mayr. plantation in the Qinling Mountains, China. PLoS ONE 2017, 12, e185163. [Google Scholar] [CrossRef] [PubMed] [Green Version]
  52. Grace, J. Toward models of resource allocation by plants. Plant Resour. Alloc. 1997, 279–291. [Google Scholar] [CrossRef]
  53. Vitousek, P. Nutrient cycling and nutrient use efficiency. Am. Nat. 1982, 119, 553–572. [Google Scholar] [CrossRef]
  54. Koerselman, W.; Meuleman, A.F.M. The vegetation N:P ratio: A new tool to detect the nature of nutrient limitation. J. Appl. Ecol. 1996, 33, 1441–1450. [Google Scholar] [CrossRef]
  55. Tian, H.Q.; Chen, G.S.; Zhang, C.; Melillo, J.M.; Hall, C.A.S. Pattern and variation of C:N:P ratios in China’s soils: A synthesis of observational data. Biogeochemistry 2010, 98, 139–151. [Google Scholar] [CrossRef]
  56. Hatton, P.J.; Castanha, C.; Torn, M.S.; Bird, J.A. Litter type control on soil C and N stabilization dynamics in a temperate forest. Glob. Chang. Biol. 2015, 1358–1367. [Google Scholar] [CrossRef]
  57. Kang, H.; Freeman, C. Soil enzyme analysis for leaf litter decomposition in Global Wetlands. Commun. Soil Sci. Plant Anal. 2009, 40, 3323–3334. [Google Scholar] [CrossRef]
  58. Ren, S.J.; Cao, M.K.; Tao, B.; Li, K.R. The effects of nitrogen limitation on terrestrial ecosystem carbon cycle: A review. Prog. Geogr. 2006, 25, 58–67. (In Chinese) [Google Scholar]
  59. Cleveland, C.C.; Liptzin, D. C:N:P stoichiometry in soil: Is there a “Redfield ratio”for the microbial biomass? Biogeochemistry 2007, 85, 235–252. [Google Scholar] [CrossRef]
  60. Yang, Y.H.; Fang, J.Y.; Guo, D.L.; Ji, C.J.; Ma, W.H. Vertical patterns of soil carbon, nitrogen and carbon: Nitrogen stoichiometry in Tibetan grasslands. Biogeosci. Discuss. 2010, 7, 1–24. [Google Scholar] [CrossRef] [Green Version]
  61. Neufeldt, H.; Da Silva, J.E.D.; Ayarza, M.A.; Zech, W. Land-use effects on phosphorus fractions in Cerrado oxisols. Biol. Fertil. Soils 2000, 31, 30–37. [Google Scholar] [CrossRef]
  62. Post, W.M.; Pastor, J.; Zinke, P.J.; Stangenberger, A.G. Global patterns of soil nitrogen storage. Nature 1985, 317, 613–616. [Google Scholar] [CrossRef]
  63. Hobbie, S.E.; Vitousek, P.M. Nutrient limitation of decomposition in Hawaiian forests. Ecology 2000, 81, 1867–1877. [Google Scholar] [CrossRef]
  64. Wang, Z.; Zheng, F. Impact of vegetation succession on leaf-litter-soil C:N:P stoichiometry and their intrinsic relationship in the Ziwuling Area of China’s Loess Plateau. J. For. Res. 2020. [Google Scholar] [CrossRef]
  65. Walker, T.W.; Adams, A.F.R. Studies on soil organic matter. Soil Sci. 1959, 85, 307–318. [Google Scholar] [CrossRef]
Figure 1. The location at the Zhifanggou station on the Loess Hilly Region.
Forests 12 00214 g001
Figure 2. Seasonal variations of C, N, and P contents and ratios in arbor layer. (a) describes the C content of the tree layer; (b) describes the N content of the tree layer; (c) describes the P content of the tree layer; (d) describes the C:N ratio of the tree layer; (e) describes the C:P ratio of the tree layer; (f) describes the N:P ratio of the tree layer. Different small letters over the bars represent the significant differences among the different growing seasons at p < 0.05, the same as below.
Forests 12 00214 g002
Figure 3. Seasonal variations of the C, N, and P contents and ratios in shrub and herb layers. (a) describes the C content of understory vegetation; (b) describes the N content of understory vegetation; (c) describes the P content of understory vegetation; (d) describes the C:N ratio of understory vegetation; (e) describes the C:P ratio of understory vegetation; (f) describes the N:P ratio of understory vegetation. Different small letters over the bars represent the significant differences among the different growing seasons at p < 0.05.
Forests 12 00214 g003
Figure 4. Seasonal variations of the C, N, and P contents and ratios in the litter and soil. (a) describes the C content of the litter and soil; (b) describes the N content of the litter and soil; (c) describes the P content of the litter and soil; (d) describes the C:N ratio of the litter and soil; (e) describes the C:P ratio of the litter and soil; (f) describes the N:P ratio of the litter and soil. Different small letters over the bars represent the significant differences among the different growing seasons at p < 0.05.
Forests 12 00214 g004
Table 1. Variation characteristics of various components of the Robinia pseudoacacia plantation ecosystem (n = 27).
ComponentCNPC:NC:PN:P
AV/g·kg−1CV/%AV/g·kg−1CV/%AV/g·kg−1CV/%AVCV/%AVCV/%AVCV/%
TL409.02 ± 19.824.8527.61 ± 8.1529.531.52 ± 0.6442.1516.08 ± 4.6428.87326.97 ± 153.0146.819.44 ± 3.4517.74
TB419.47 ± 8.371.9915.18 ± 3.2821.640.93 ± 0.2223.8628.9 ± 6.2221.54481.16 ± 127.4426.4916.75 ± 2.9717.72
TS435.13 ± 10.053.135.28 ± 3.1058.80.38 ± 0.1231.7899.79 ± 34.8234.891248.53 ± 350.3128.0613.71 ± 4.5433.14
TR428.32 ± 13.642.3530.01 ± 4.1113.710.95 ± 0.099.1314.55 ± 2.1414.73455.62 ± 47.2810.3831.79 ± 4.7214.83
SL415.7 ± 18.574.4732.97 ± 5.3116.11.88 ± 0.4724.9712.85 ± 1.6112.53233.2 ± 55.7423.918.01 ± 2.9516.39
SB416.68 ± 12.072.910.76 ± 2.4622.830.84 ± 0.3137.1140.77 ± 9.8024.05589.99 ± 267.4345.3314 ± 3.6225.84
SR393.69 ± 15.824.029.87 ± 2.5325.670.8 ± 0.1822.941.99 ± 8.6620.64519.23 ± 116.3722.4113.07 ± 4.9137.53
HL376.67 ± 31.248.2919.57 ± 3.8319.551.32 ± 0.1813.6819.96 ± 4.2421.25290.74 ± 51.6817.7714.75 ± 1.5610.59
HR347.16 ± 26.827.7315.97 ± 3.3621.051.24 ± 0.2822.7622.64 ± 4.9121.68297.98 ± 91.3630.6613.04 ± 1.4711.27
LI270.96 ± 50.3718.5912.86 ± 2.1516.760.81 ± 0.0910.6321.19 ± 2.7212.84340 ± 79.5023.3815.99 ± 2.7417.14
SO21.31 ± 5.9527.91.13 ± 0.2723.570.58 ± 0.023.8918.72 ± 0.874.6336.64 ± 10.5928.911.94 ± 0.4824.72
AV: Average; CV: Variable coefficient; TL: Tree leaves; TB: Tree branches; TS: Tree stems; TR: Tree roots; SL: Shrub leaves; SB: Shrub branches; SR: Shrub roots; HL: Herb leaves; HR: Herb roots; LI: Litter; SO: Soil.
Table 2. Relationships between the C, N, and P contents of the different plant tissues (n = 27).
PlantsComponentsCNP
TreeLeaves–Branches0.404 *−0.847 **−0.587 **
Leaves-Stems0.532 **−0.613 **−0.183
Leaves-Roots−0.352−0.597 **−0.189
Branches-Stems−0.2980.724 **0.602 **
Branches-Roots−0.1420.557 **0.458 *
Stems-Roots0.0300.0850.421 *
ShrubLeaves-Branch0.893 **−0.728 **−0.835 **
Leaves-Root0.761 **−0.118−0.294
Branches-Roots0.680 **0.1420.439 *
HerbLeaves-Roots−0.1030.684 **0.717 **
* and ** refer to correlation coefficients of p < 0.05 and p < 0.01, respectively.
Table 3. Correlations among the C, N, and P contents and ratios in the plant, litter, and soil (n = 27).
ComponentCNPC:NC:PN:P
TL-SL0.613 **0.919 **0.928 **0.759 **0.806 **0.794 **
TL-AH−0.299−0.494 **−0.24−0.582 **−0.539 **0.279
TL-LI0.44 *0.492 **−0.0920.542 **0.066−0.173
TL-SO−0.523 **−0.3120.785 **0.2210.1820.082
SL-AH0.143−0.345−0.014−0.213−0.2410.202
SL-LI0.2410.21−0.0440.547 **0.3670.208
SL-SO−0.586 **−0.2320.858 **0.05−0.126−0.263
AH-LI−0.334−0.1160.629 **0.0740.377−0.031
AH-SO0.1930.771 **−0.15−0.318−0.3680.572 **
LI-SO−0.547 **−0.554 **−0.0730.09−0.404 *−0.512 **
TL: Tree leaves; SL: Shrub leaves; AH: Above-ground herb; LI: Litter; SO: Soil. * and ** refer to correlation coefficients of p < 0.05 and p < 0.01, respectively.
Table 4. Statistics of the “plant-litter-soil” C, N, and P contents and ratios in this study and previous studies.
ItemAreaC/(g·kg−1)N/(g·kg−1)P/(g·kg−1)C:NC:PN:PDate Source
Tree leavesThe Loess Plateau409.02 ± 19.827.61 ± 8.11.52 ± 0.616.08 ± 4.4326.97 ± 8619.44 ± 3.4This study
China-20.2 ± 8.41.46 ± 1.0--13.83 ± 9.3Han
Global464.0 ± 3.220.6 ± 1.21.99 ± 0.122.5 ± 1.9232.0 ± 72.412.7 ± 10.1Elser
Global461.3 ± 72.220.1 ± 8.71.77 ± 1.123.8 ± 17.3300.9 ± 236.813.8 ± 9.5Reich and Oleksyn
LitterThe Loess Plateau270.96 ± 50.312.86 ± 2.10.81 ± 0.121.19 ± 2.7340.0 ± 79.515.99 ± 2.7This study
China508.16 ± 28.210.85 ± 1.90.46 ± 0.254.1 ± 16.41355.74 ± 80.125.47 ± 2.4Wang
Global467.7 ± 2.710.0 ± 0.10.7 ± 0.052.9 ± 1.31183.0 ± 7019.2 ± 0.5Yuan
Global-10.93 ± 6.50.85 ± 0.7--18.32 ± 11.2Kang
SoilThe Loess Plateau21.31 ± 5.91.13 ± 0.30.58 ± 0.018.72 ± 0.836.64 ± 10.51.94 ± 0.4This study
China11.12 ± 1.61.07 ± 0.12.05 ± 0.711.9 ± 0.260.0 ± 1.15.1 ± 0.1Tian
Global---14.3 ± 0.5186.0 ± 12.913.1 ± 0.8Cleveland
Publisher’s Note: MDPI stays neutral with regard to jurisdictional claims in published maps and institutional affiliations.

