
Modeling and Prediction of Soil Organic Matter Content Based on Visible-Near-Infrared Spectroscopy


Abstract
:1. Introduction
2. Material and Methods
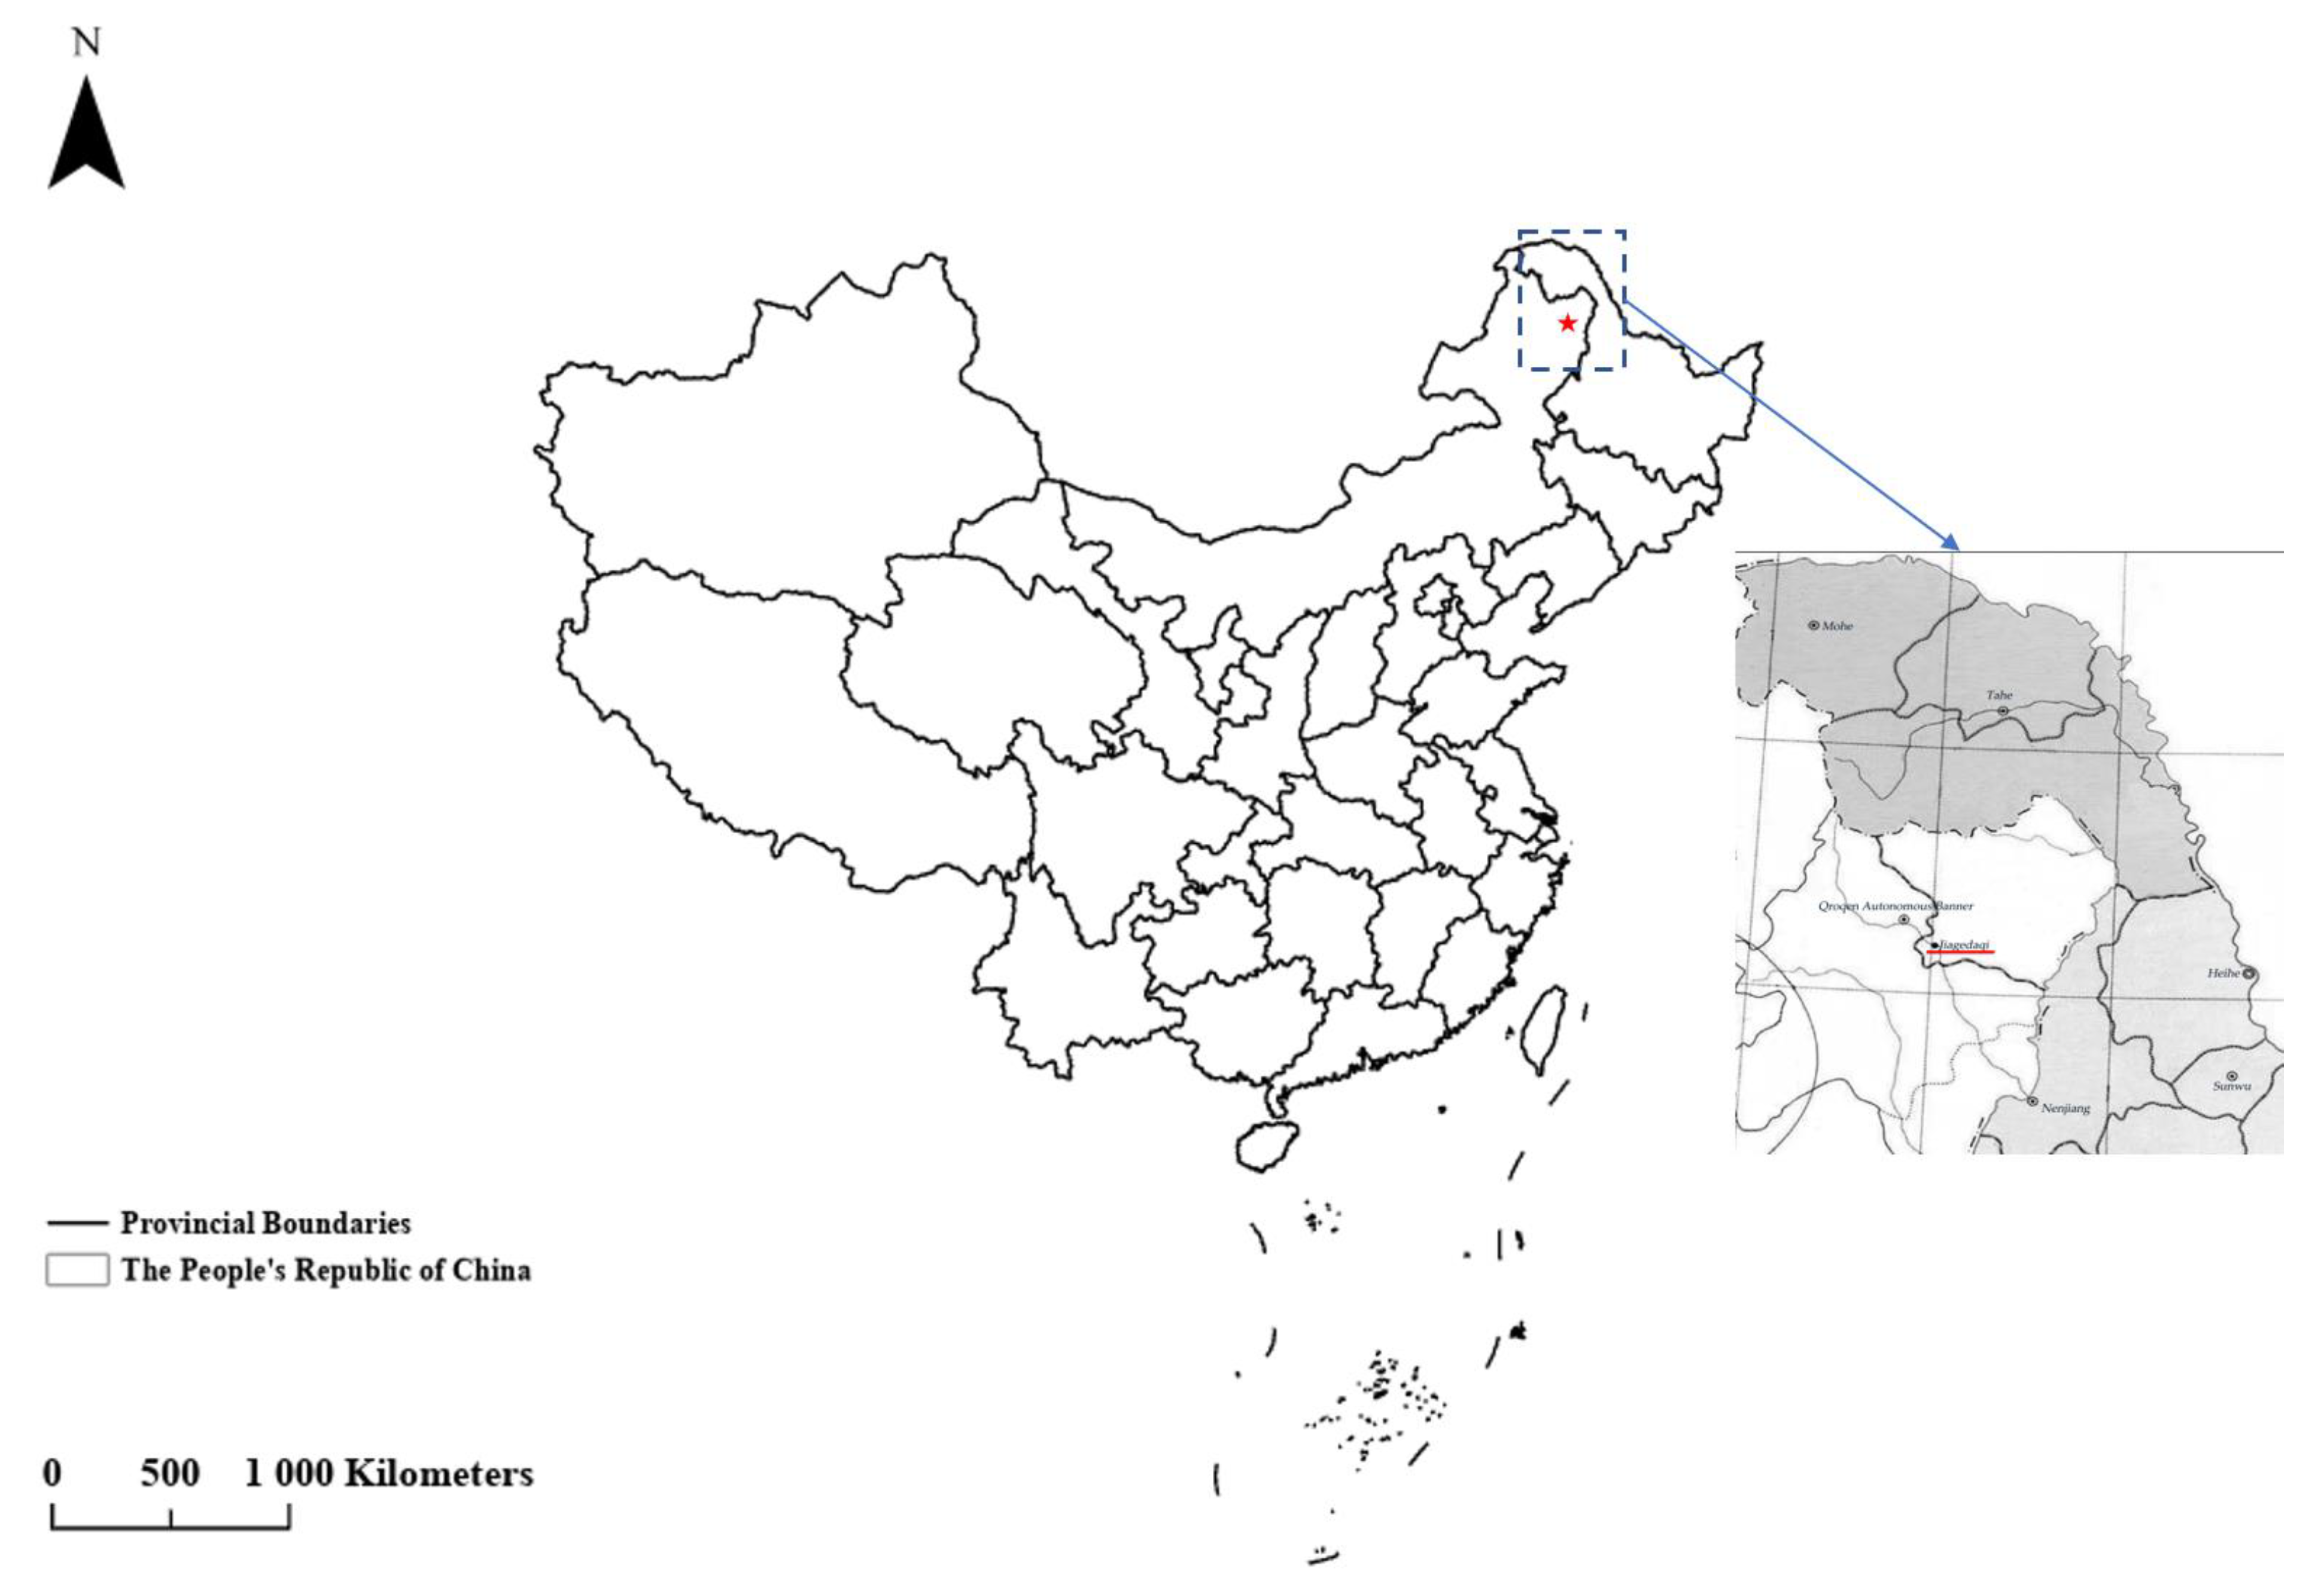
2.1. Soil Sample Collection
2.2. Visible-Near-Infrared Spectra Collection
2.3. Modeling and Optimization
2.3.1. Spectral Preprocessing and Band Optimization
2.3.2. Modeling Methods and Model Evaluation
3. Results
3.1. Partition of Sample Sets
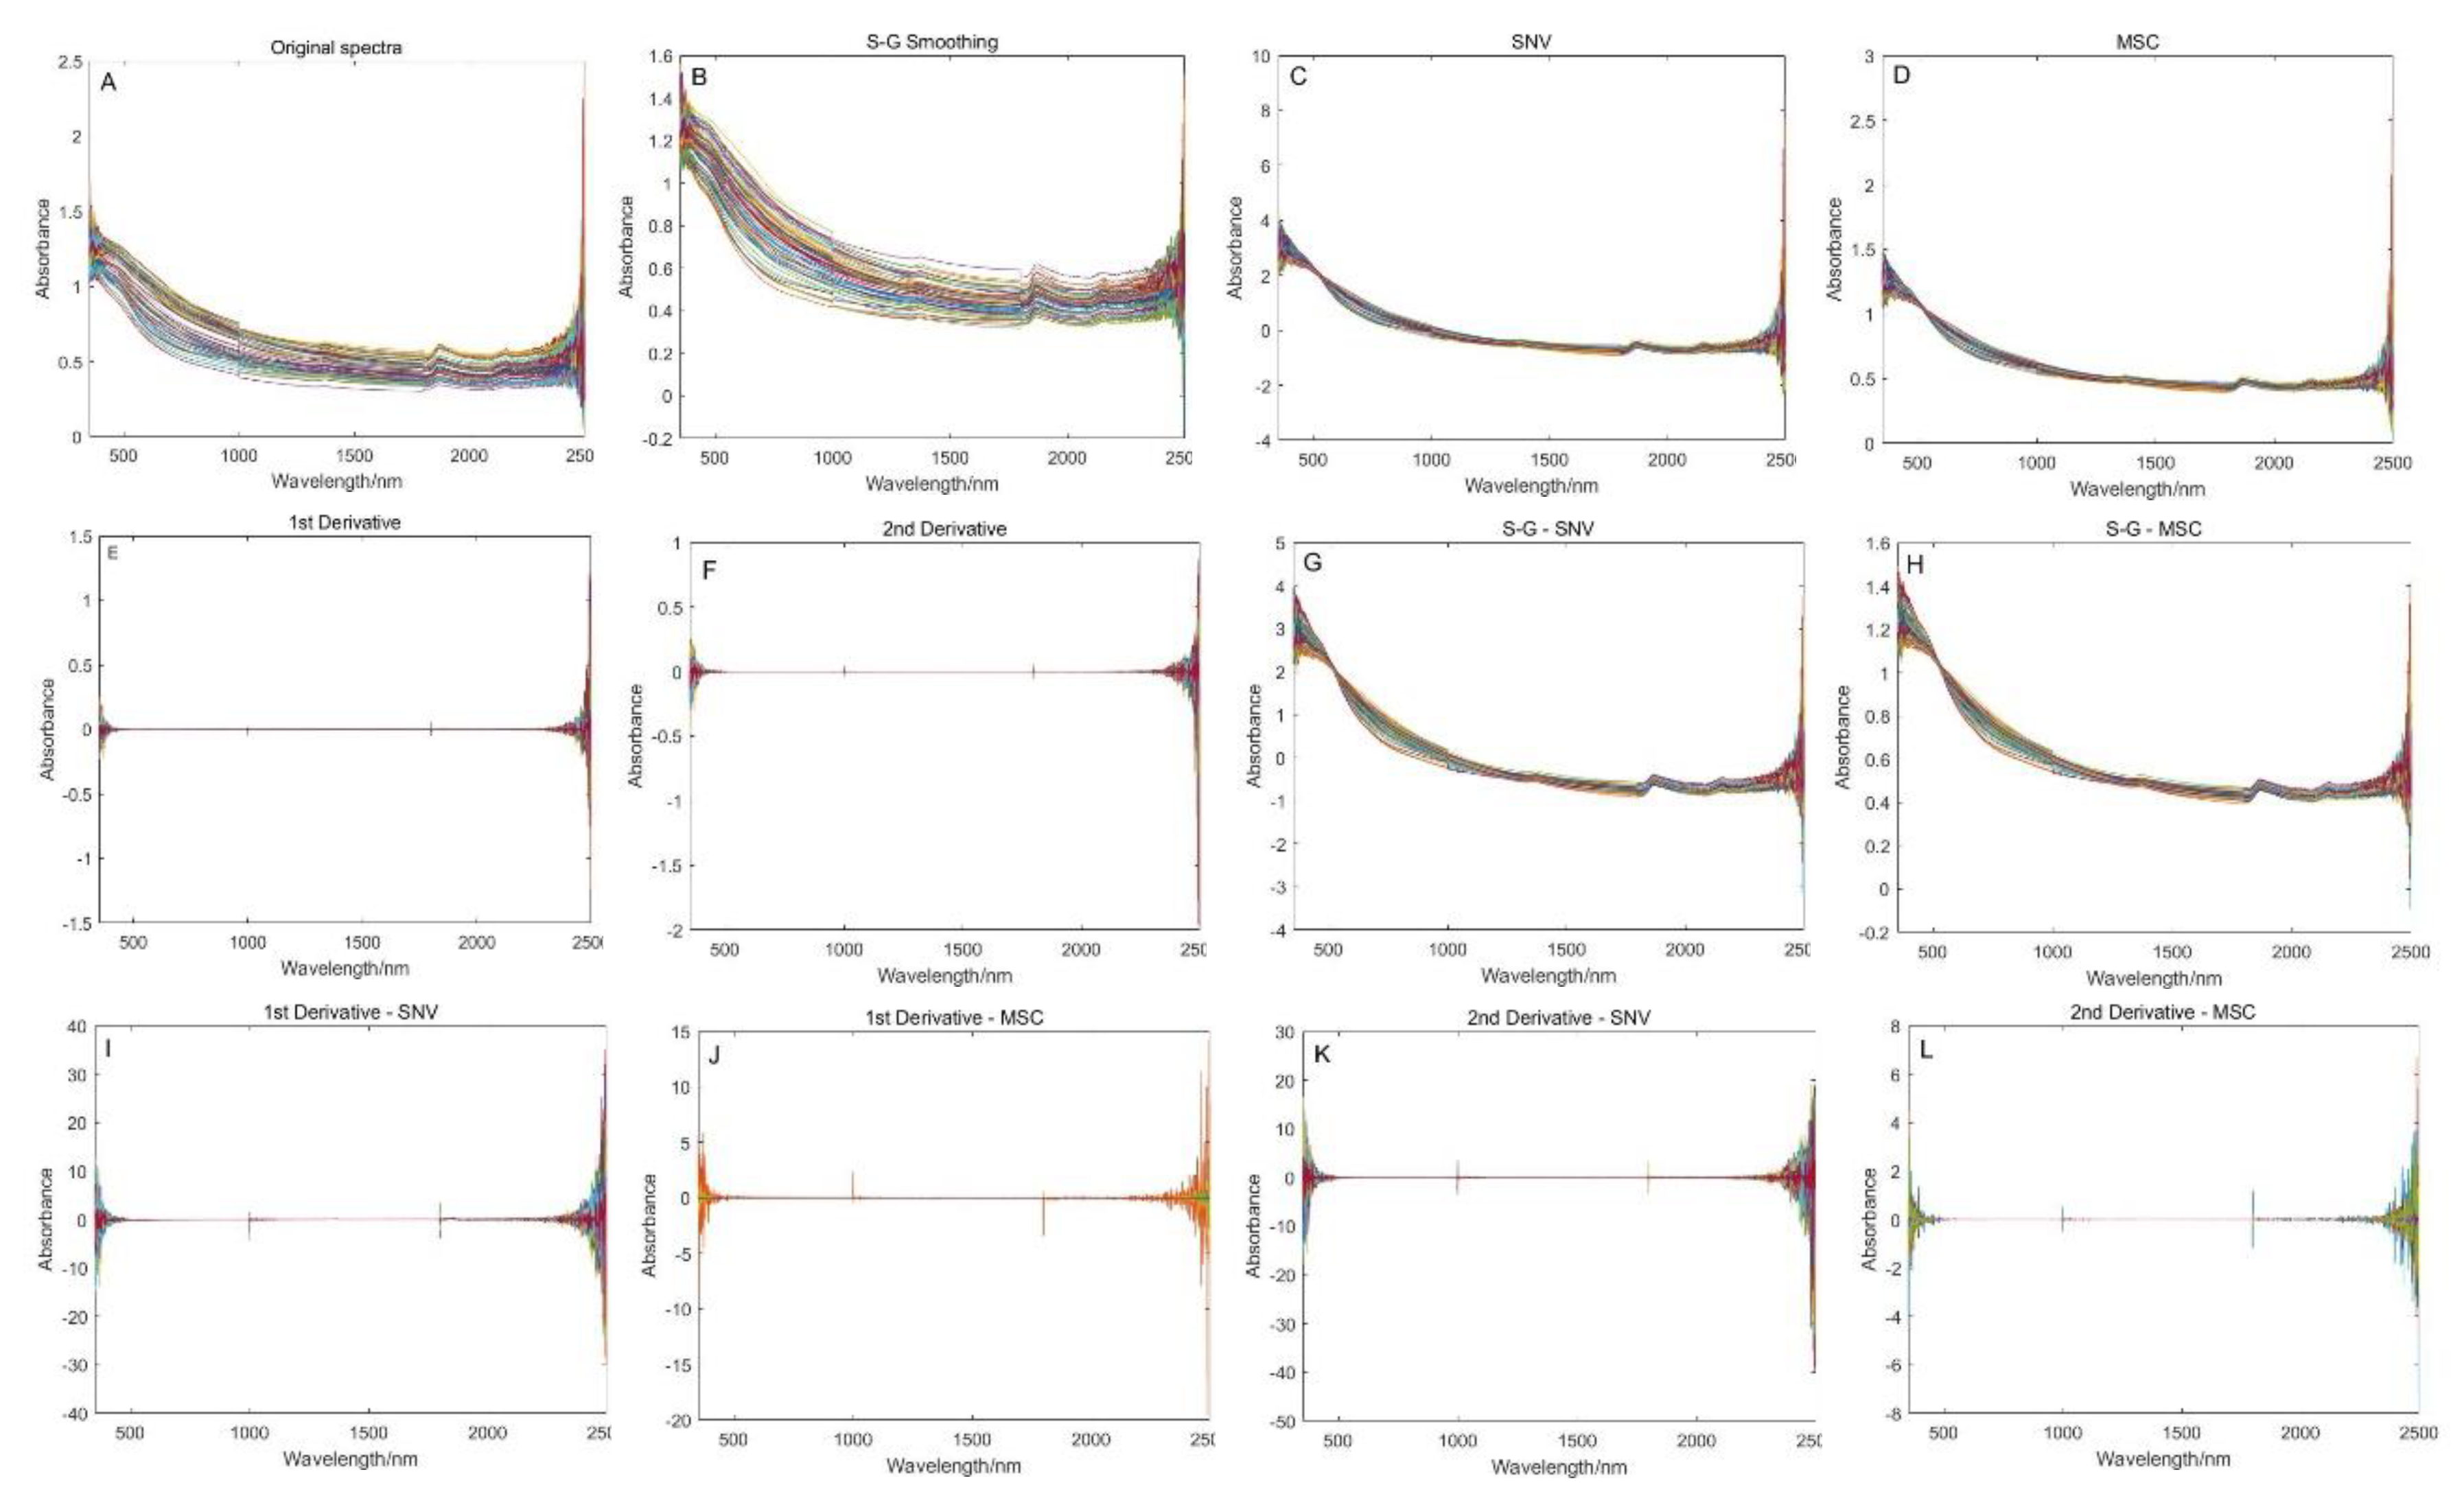
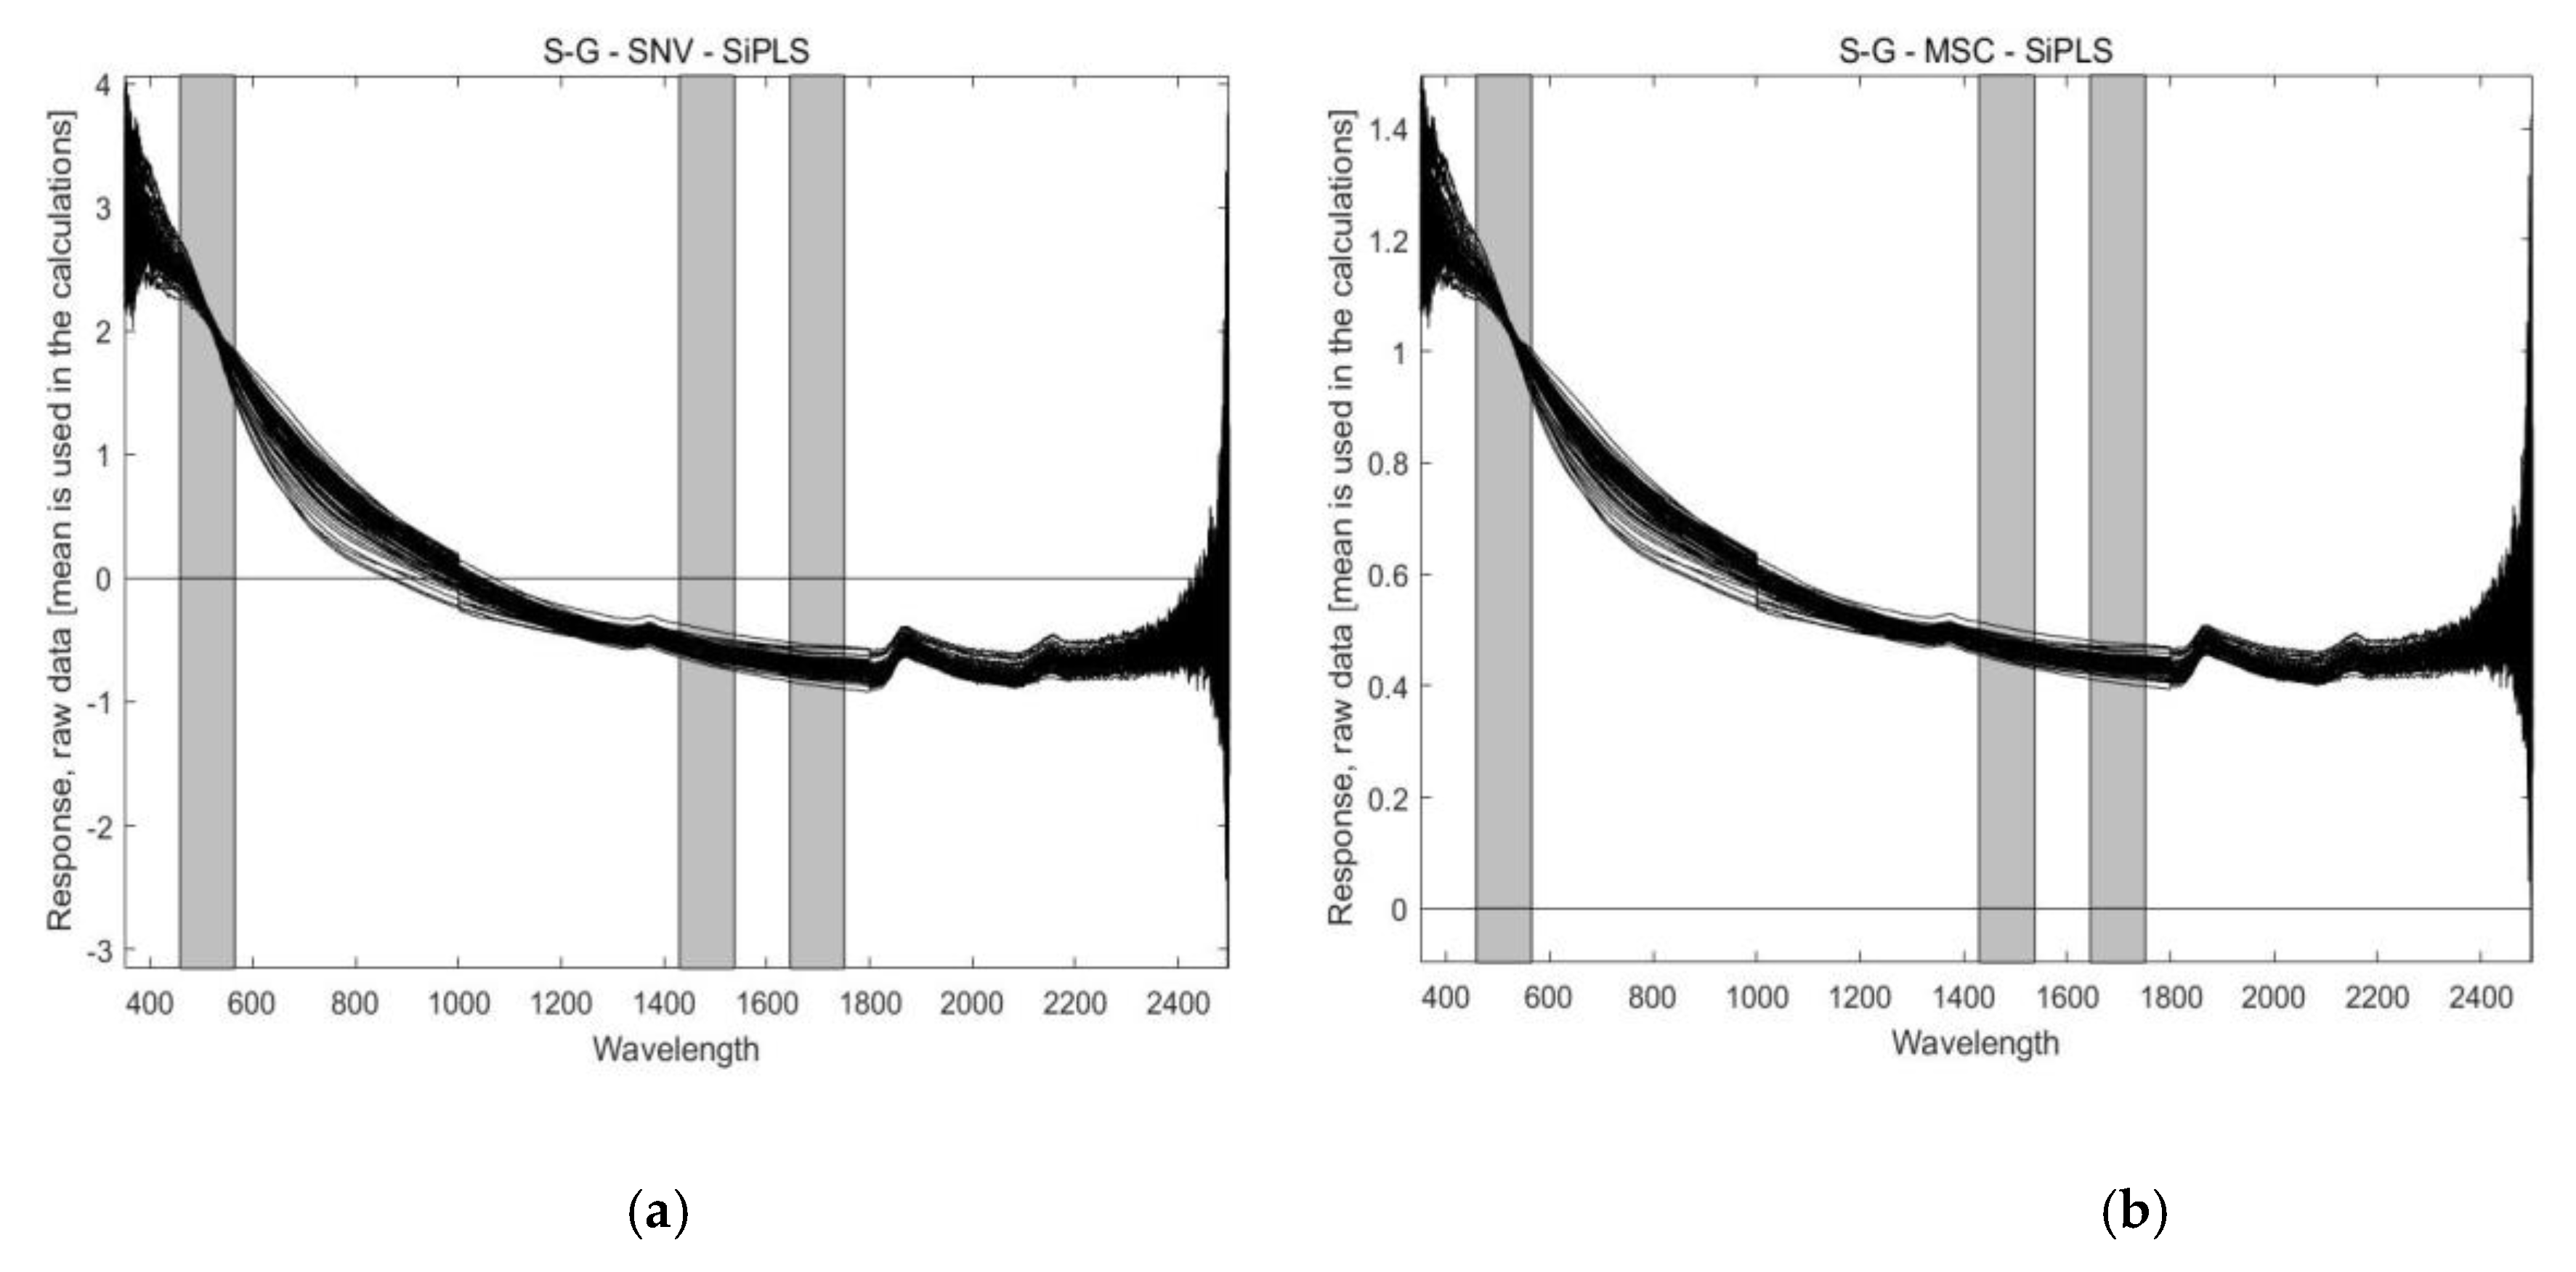
3.2. Spectral Preprocessing
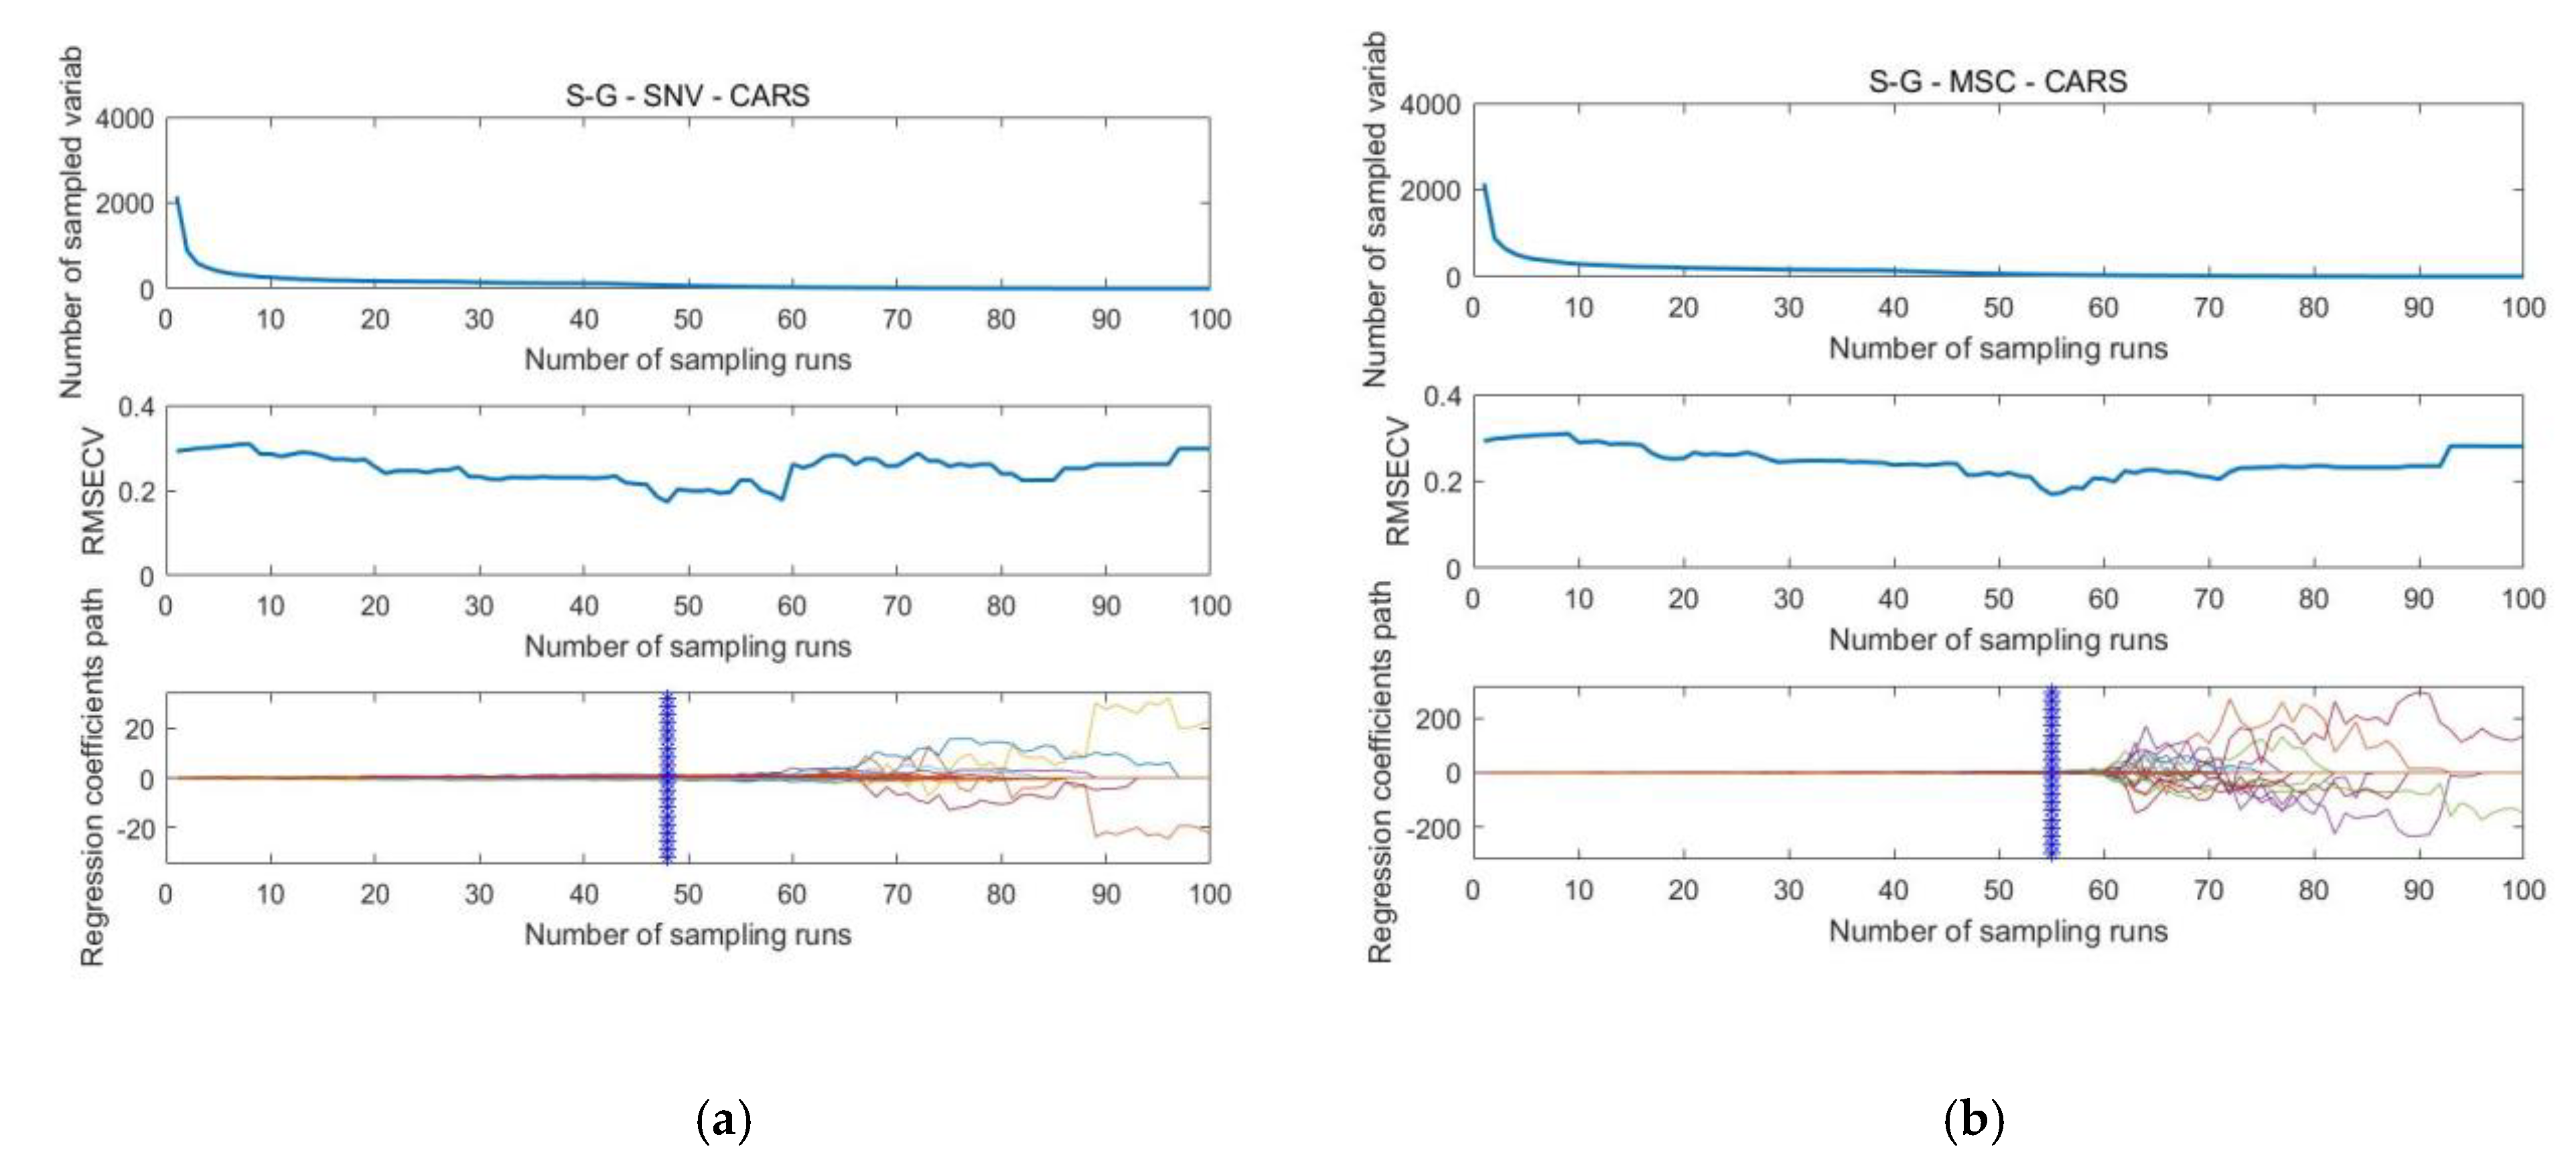
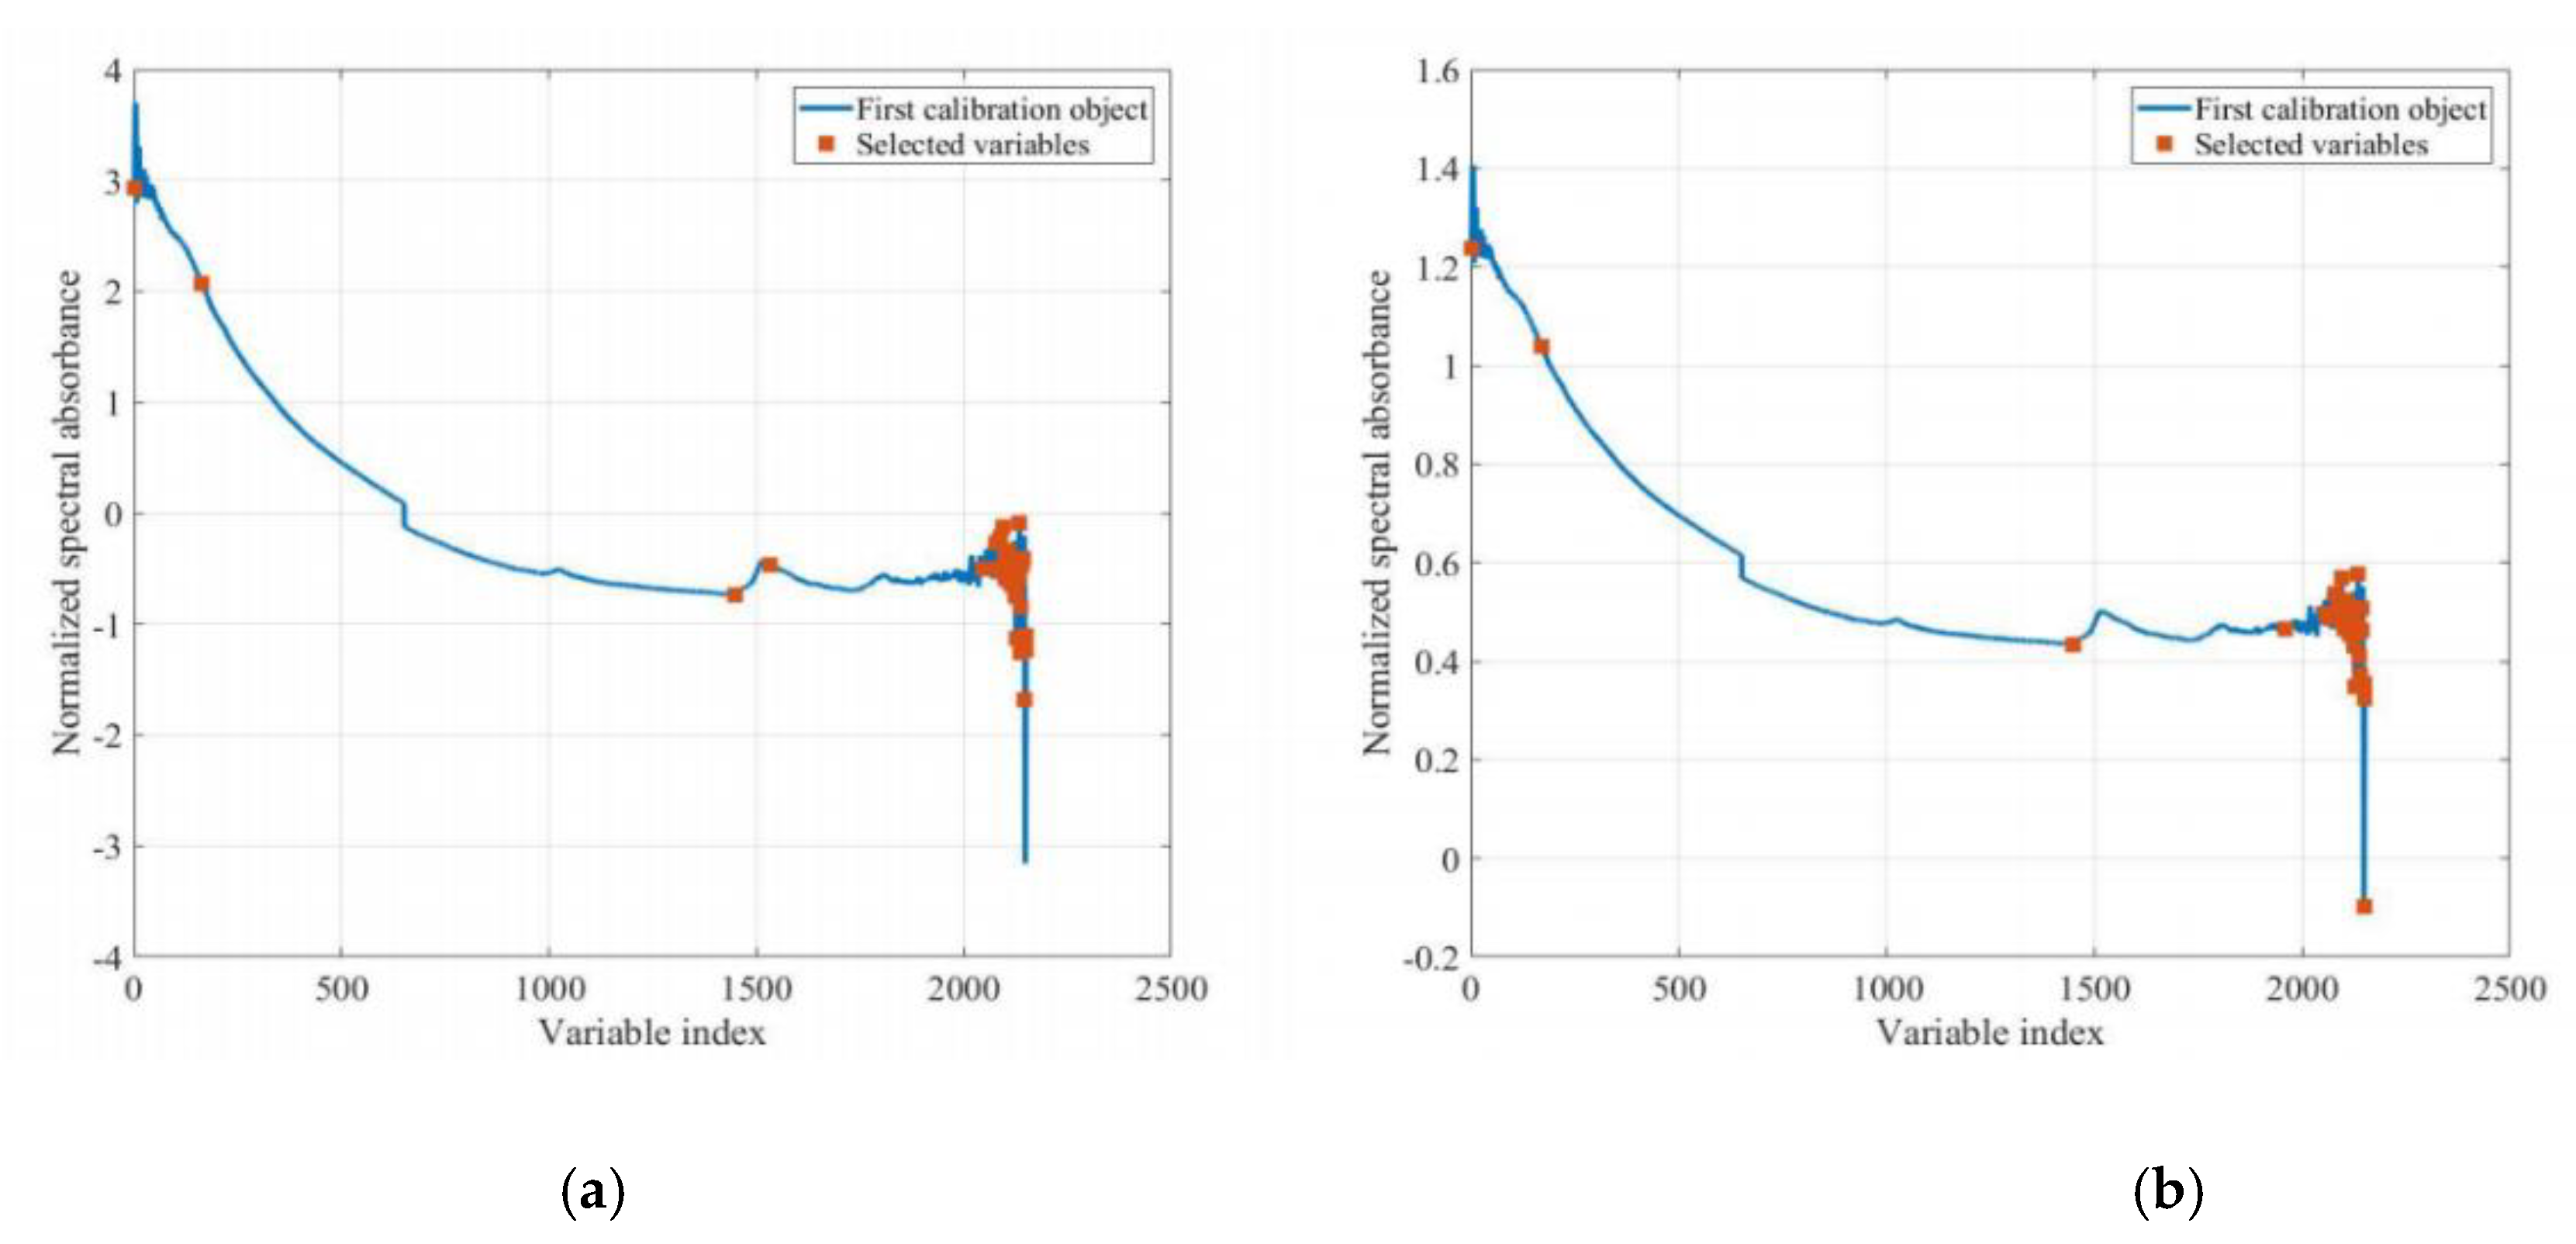
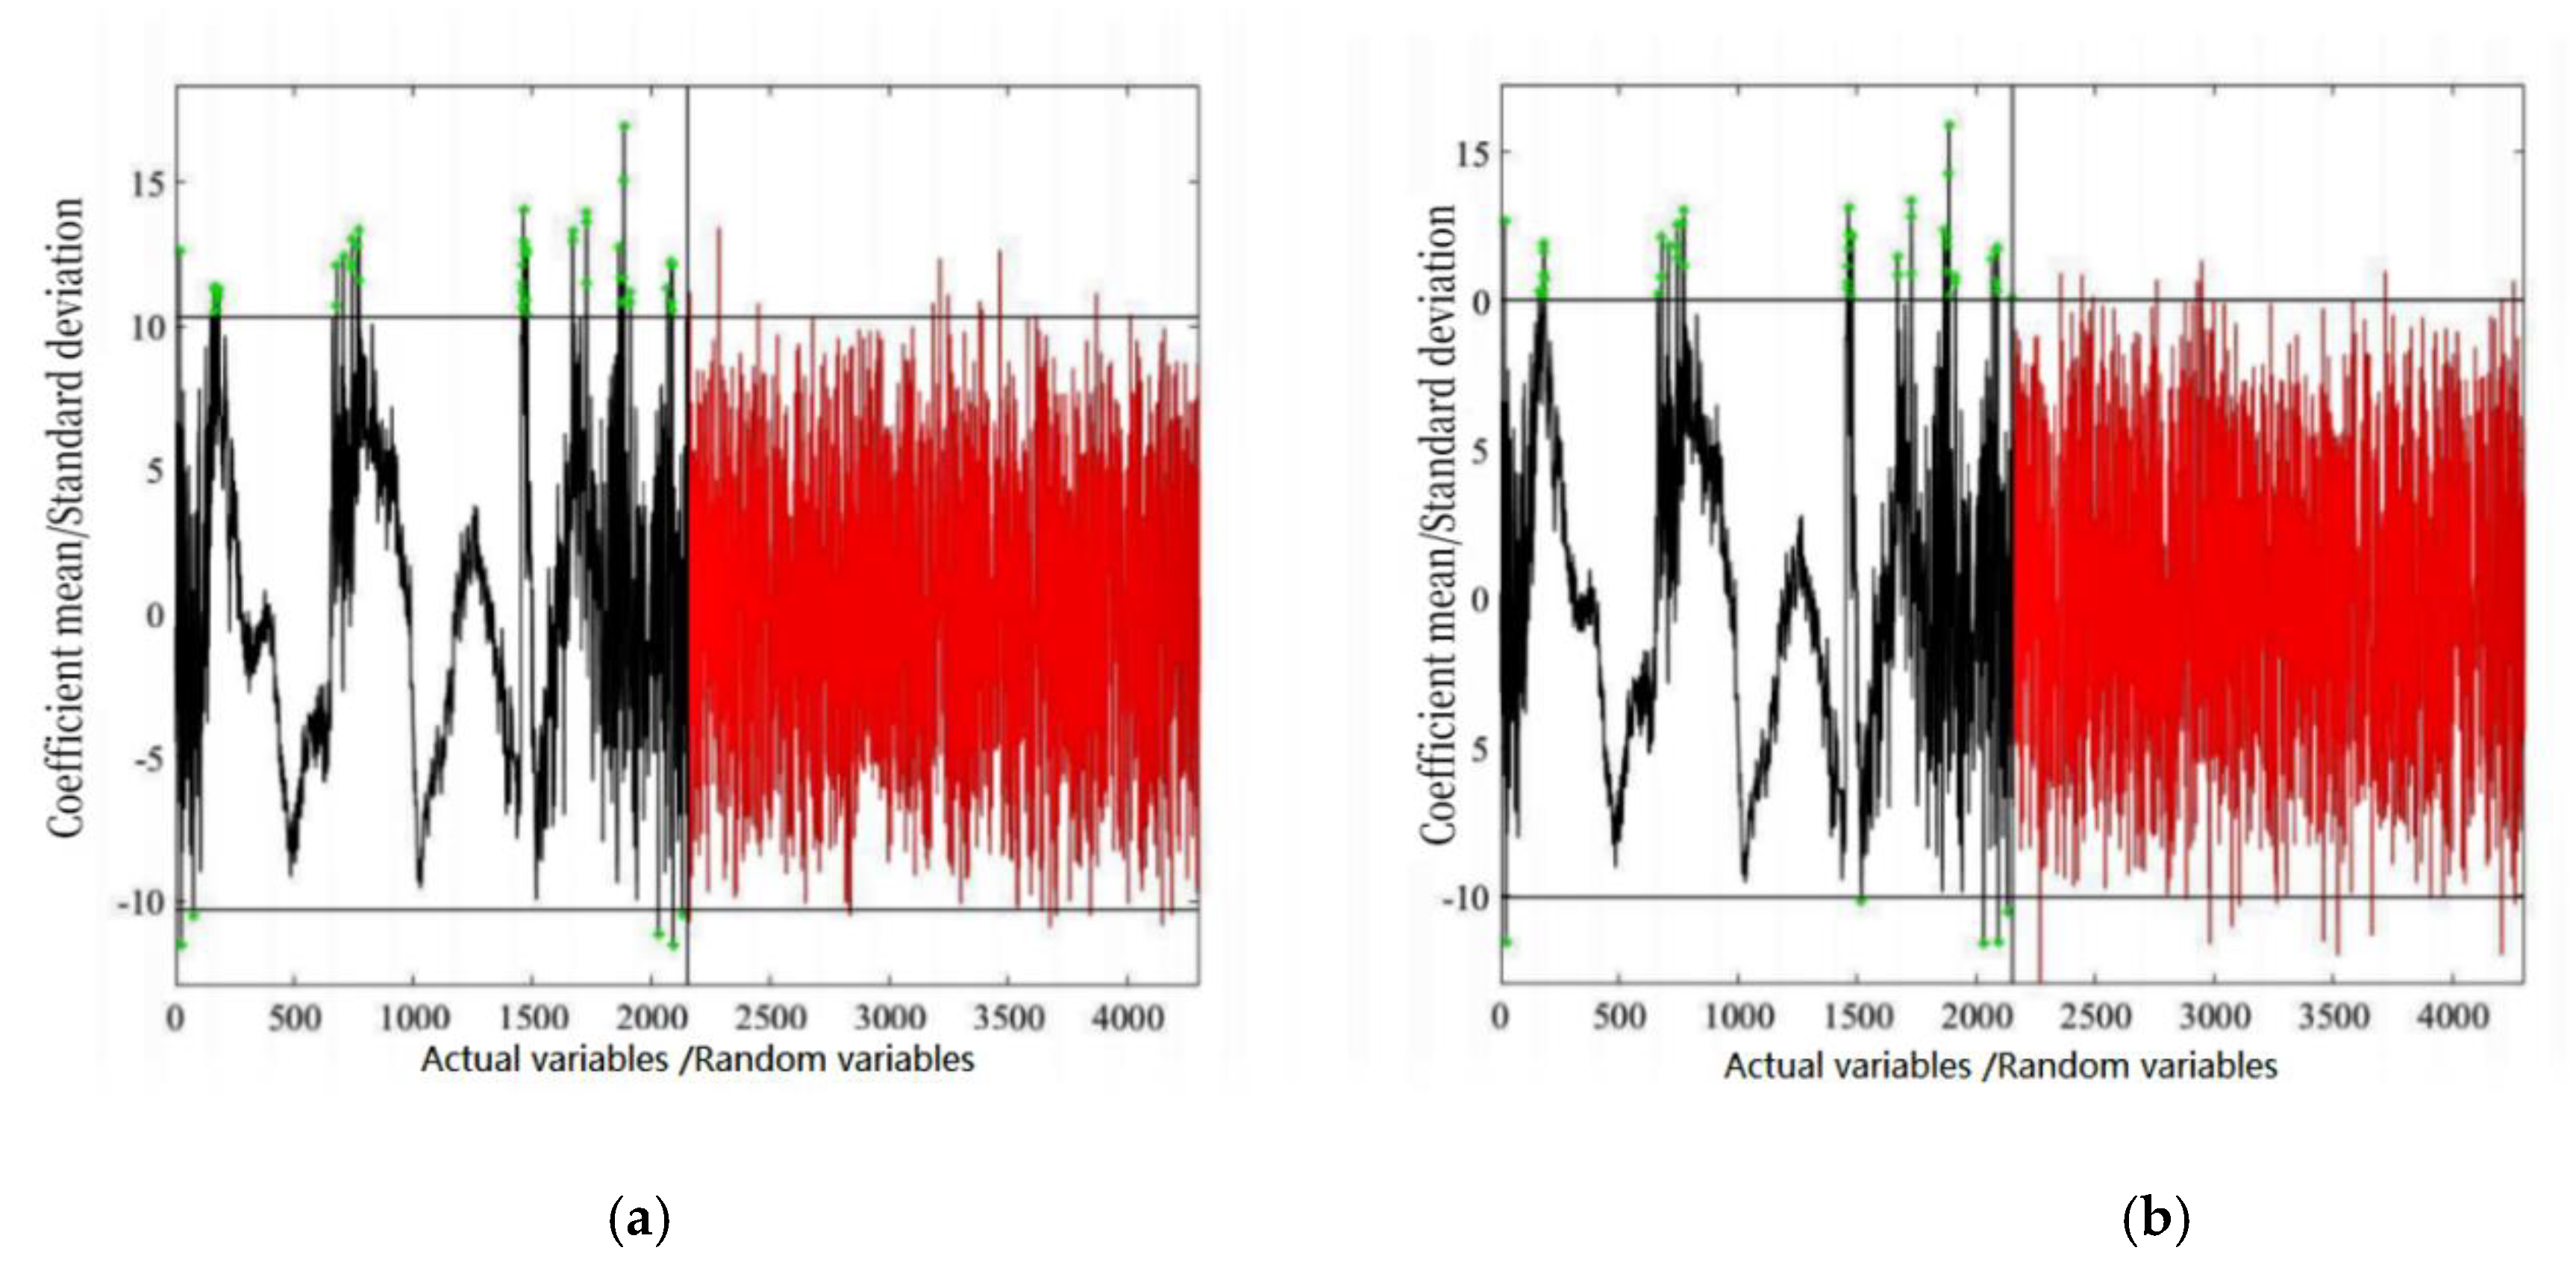
3.3. Wavelength Selection
4. Conclusions and Discussion
Author Contributions
Funding
Conflicts of Interest
References
- Wang, B.; Ren, X.; Hu, W. Assessment of Forest Ecosystem Services Value in China. Sci. Silvae Sin. 2011, 47, 145–153. [Google Scholar] [CrossRef]
- Li, X.-B.; Zhao, Y.-L. Forest Transition, Agricultural Land Marginalization and Ecological Restoration. China Popul. Resour. Environ. 2011, 10, 91–95. [Google Scholar] [CrossRef]
- Schwartzman, S.; Alencar, A.; Zarin, H.; Santos Souza, A.P. Social movements and large-scale tropical forest protection on the Amazon frontier: Conservation from chaos. J. Environ. Dev. 2010, 19, 274–299. [Google Scholar] [CrossRef]
- Bai, Y.; Ouyang, Z.Y.; Zheng, H.; Xu, W.H.; Jiang, B.; Fang, Y. Evaluation of the forest ecosystem services in Haihe River Basin, China. Acta Ecol. Sin. 2011, 31, 2029–2039. [Google Scholar]
- Han, J. Soil quality indicators and evaluation methods. Beijing Agric. 2016, 645, 162–163. [Google Scholar] [CrossRef]
- Han, M.; Dong, X.; Guan, H.; Zhang, Q. Effects of Soil Properties on Ecological Functions in Different Succession Stages of Natural Larix gmelinii Forest in Daxing’ an Mountains. J. Northeast. For. Univ. 2019, 47, 50–54. [Google Scholar] [CrossRef]
- Wang, M.; Chen, H.; Zhang, W.; Wang, K. Soil nutrients and stoichiometric ratios as affected by land use and lithology at county scale in a karst area, southwest China. Sci. Total Environ. 2018, 619, 1299–1307. [Google Scholar] [CrossRef] [PubMed]
- Qu, H.; Dong, X.; Tang, G.; Zhang, T.; Ma, X.; Guan, H. Effects of Replanting Alterations of Betula platyphylla Low-quality Forest on Soil Nutrients in Daxing’ an Mountains. J. Northeast. For. Univ. 2017, 45, 75–80. [Google Scholar] [CrossRef]
- Baldrian, P.; Kolařík, M.; Štursová, M.; Kopecký, J.; Valášková, V.; Větrovský, T.; Žifčáková, L.; Šnajdr, J.; Rídl, J.; Vlček, Č. Active and total microbial communities in forest soil are largely different and highly stratified during decomposition. ISME J. 2012, 6, 248–258. [Google Scholar] [CrossRef] [PubMed] [Green Version]
- Danielson, R.; Visser, S. Effects of forest soil acidification on ectomycorrhizal and vesicular—arbuscular mycorrhizal development. New Phytol. 1989, 112, 41–47. [Google Scholar] [CrossRef]
- Ji, H.; Dong, X. Comprehensive Evaluation of Soil Fertility after Transformation of the Low-Quality Forest in the Daxing’ anling Mountains. Sci. Silvae Sin. 2012, 48, 117–123. [Google Scholar] [CrossRef]
- Kotroczó, Z.; Veres, Z.; Fekete, I.; Krakomperger, Z.; Tóth, J.A.; Lajtha, K.; Tóthmérész, B. Soil enzyme activity in response to long-term organic matter manipulation. Soil Biol. Biochem. 2014, 70, 237–243. [Google Scholar] [CrossRef]
- Meng, Y.; Zhang, Y.; Li, C.; Zhao, J.; Wang, Z.; Wang, C.; Li, Y. Prediction of the Carbon Content of Six Tree Species from Visible-Near-Infrared Spectroscopy. Forests 2021, 12, 1233. [Google Scholar] [CrossRef]
- Li, Y.; Via, B.K.; Cheng, Q.; Zhao, J.; Li, Y. New Pretreatment Methods for Visible–Near-Infrared Calibration Modeling of Air-Dry Density of Ulmus pumila Wood. For. Prod. J. 2019, 69, 188–194. [Google Scholar] [CrossRef]
- Li, Y.; Via, B.K.; Young, T.; Li, Y. Visible-near infrared spectroscopy and chemometric methods for wood density prediction and origin/species identification. Forests 2019, 10, 1078. [Google Scholar] [CrossRef] [Green Version]
- Yuan, Y.; Wang, W.; Chu, X.; Xi, M.J. Selection of Characteristic Wavelengths Using SPA and Qualitative Discrimination of Mildew Degree of Corn Kernels Based on SVM. Spectrosc. Spectr. Anal. 2016, 36, 226–230. [Google Scholar] [CrossRef]
- Silalahi, D.D.; Midi, H.; Arasan, J.; Mustafa, M.S.; Caliman, J.-P. Robust generalized multiplicative scatter correction algorithm on pretreatment of near infrared spectral data. Vib. Spectrosc. 2018, 97, 55–65. [Google Scholar] [CrossRef]
- Zhu, J.; Liu, Y.; Wu, C.; Jin, J.; Lv, H.; Yang, S. Study on near-infrared spectroscopy model of soil organic carbon after biochar addition and its application. Acta Ecol. Sin. 2020, 40, 7430–7440. [Google Scholar] [CrossRef]
- Guo, Z.; Wang, M.; Agyekum, A.A.; Wu, J.; Chen, Q.; Zuo, M.; El-Seedi, H.R.; Tao, F.; Shi, J.; Ouyang, Q. Quantitative detection of apple watercore and soluble solids content by near infrared transmittance spectroscopy. J. Food Eng. 2020, 279, 109955. [Google Scholar] [CrossRef]
- Yang, H.; Jin, F.; Guan, T.; Xu, H.; Hu, X.; Xie, Q. Short-term Effect of Partial Substitution of Inorganic Fertilizer with Organic Fertilizer on Soil Fertility and Fungal Communities in Greenhouse. Acta Agric. Boreali-Occident. Sin. 2021, 30, 422–430. [Google Scholar] [CrossRef]
- Yang, Z.; Xiao, H.; Zhang, L.; Feng, D.; Zhang, F.; Jiang, M.; Sui, Q.; Jia, L. Fast determination of oxide content in cement raw meal using NIR spectroscopy with the SPXY algorithm. Anal. Methods 2019, 11, 3936–3942. [Google Scholar] [CrossRef]
- Chen, Y.; Qi, T.; Huang, Y.; Wan, Y.; Zhao, R.; Yuan, L.; Zhang, C.; Fei, T. Optimization method of calibration dataset for VIS-NIR spectral inversion model of soil organic matter content. Trans. Chin. Soc. Agric. Eng. 2017, 33, 107–114. [Google Scholar] [CrossRef]
- Diwu, P.; Bian, X.; Wang, Z.; Liu, W. Study on the Selection of Spectral Preprocessing Methods. Spectrosc. Spectr. Anal. 2019, 39, 2800–2806. [Google Scholar] [CrossRef]
- Gerretzen, J.; Szymańska, E.; Jansen, J.J.; Bart, J.; van Manen, H.-J.; van den Heuvel, E.R.; Buydens, L.M. Simple and effective way for data preprocessing selection based on design of experiments. Anal. Chem. 2015, 87, 12096–12103. [Google Scholar] [CrossRef] [Green Version]
- Mei, C.; Chen, Y.; Yin, L.; Jiang, H.; Chen, X.; Ding, Y.; Liu, G. Wavelength Selection by siPLS-LASSO for NIR Spectroscopy and Its Application. Spectrosc. Spectr. Anal. 2018, 38, 436–440. [Google Scholar] [CrossRef]
- Gan, L.; Sun, T.; Liu, J.; Liu, M. Double Pulse LIBS Combined with Variable Screening to Detect Procymidone Content. Spectrosc. Spectr. Anal. 2019, 39, 584–588. [Google Scholar] [CrossRef]
- Huo, Y.Q.; Zhang, C.; Li, Y.H.; Zhi, W.T.; Zhang, J. Nondestructive detection for kiwifruit based on the hyperspectral technology and machine learning. J. Chin. Agric. Mech. 2019, 40, 71–77. [Google Scholar] [CrossRef]
- Zhang, Y.; Ren, D.; Han, Y.; Li, J. Air target reference spectrum selection based on characteristic wavelengths extracted by successive projections algorithm. Infrared Laser Eng. 2021, 50, 232–242. [Google Scholar] [CrossRef]
- Huang, P.; Li, Y.; Yu, Q.; Wang, K.; Yin, H.; Hou, D.; Zhang, G. Classification of Organic Contaminants in Water Distribution Systems Developed by SPA and Multi-Classification SVM Using UV-Vis Spectroscopy. Spectrosc. Spectr. Anal. 2020, 40, 2267–2272. [Google Scholar] [CrossRef]
- Sun, T.; Wu, Y.; Liu, X.; Mo, X.; Liu, M. Detection of Chromium Content in Soybean Oil by Laser Induced Breakdown Spectroscopy and UVE Method. Spectrosc. Spectr. Anal. 2016, 36, 3341–3345. [Google Scholar] [CrossRef]
- Miao, X.; Miao, Y.; Gong, H.; Tao, S.; Chen, Y.; Chen, Z. Determination of Moisture Content in Rice by Near Infrared Spectroscopy with Different Partial Least Squares. J. Anal. Sci. 2019, 35, 639–643. [Google Scholar] [CrossRef]
- Yang, H.; Zhu, M. Study of Rapid Detection of Soil Organic Matter Based on Characteristic Wavelength Selection of Visible-near Infrared Spectra. Infrared Laser Eng. 2015, 36, 42–48. [Google Scholar] [CrossRef]
- Jia, M.; Li, W.; Wang, K.; Zhou, C.; Cheng, T.; Tian, Y.; Zhu, Y.; Cao, W.; Yao, X. A newly developed method to extract the optimal hyperspectral feature for monitoring leaf biomass in wheat. Comput. Electron. Agric. 2019, 165, 104942. [Google Scholar] [CrossRef]
- Chen, Y.; Ma, H.; Zhang, Q.; Zhang, S.; Chen, M.; Wu, Y. Comparison of several variable selection methods for quantitative analysis and monitoring of the Yangxinshi tablet process using near-infrared spectroscopy. Infrared Phys. Technol. 2020, 105, 103188. [Google Scholar] [CrossRef]
- Shen, L.; Gao, M.; Yan, J.; Yao, Y. Estimation model of soil organic matter based on SVR and PLSR. China Agric. Inf. 2019, 31, 58–71. [Google Scholar] [CrossRef]
- Di Bucchianico, A. Coefficient of determination (R2). In Encyclopedia of Statistics in Quality and Reliability; Champ, C.W., Shepherd, D.K., Eds.; John Wiley & Sons, Ltd.: Chichester, UK, 2008. [Google Scholar] [CrossRef]
- Hong, Y.; Yu, L.; Zhu, Y.; Li, S.; Guo, L.; Liu, J.; Nie, Y.; Zhou, Y. Using Orthogonal Signal Correction Algorithm Removing the Effects of Soil Moisture on Hyperspectral Reflectance to Estimate Soil Organic Matter. Sci. Agric. Sin. 2017, 50, 3766–3777. [Google Scholar] [CrossRef]
- Zhang, Y.; Zhou, M. Methods for Data Process of Near Infrared Spectroscopy Analysis. Infrared Technol. 2007, 29, 345–348. [Google Scholar] [CrossRef]
- Zhang, H.; Luo, W.; Liu, X.; He, Y. Measurement of Soil Organic Matter with Near Infrared Spectroscopy Combined with Genetic Algorithm and Successive Projection Algorithm. Spectrosc. Spectr. Anal. 2017, 37, 584–587. [Google Scholar] [CrossRef]
- Yang, Z.; Xiao, H.; Zhang, L.; Feng, D.; Zhang, F.; Jiang, M.; Sui, Q.; Jia, L. Fast determination of oxides content in cement raw meal using NIR spectroscopy combined with synergy interval partial least square and different preprocessing methods. Measurement 2020, 149, 106990. [Google Scholar] [CrossRef]
- Chen, Y.; Di, Y.; Tang, X.; Cui, X.; Gao, X.; Cao, J.; Li, S. Combination Weight COD Concentration Prediction Model Based on BiPLS and SiPLS. Spectrosc. Spectr. Anal. 2019, 39, 2176–2181. [Google Scholar] [CrossRef]
- Cheng, B.; Chen, D.; Wu, X. Near Infrared Spectral Wavelength Selection Based on Moving Window-Iterative Genetic Algorithm Method. Chin. J. Anal. Chem. 2006, 34, 123–130. [Google Scholar] [CrossRef]
- Li, P.; Zhou, J.; Jiang, L.; Liu, X.; Du, G. A Variable Selection Approach of Near Infrared Spectra Based on Window Competitive Adaptive Reweighted Sampling Strategy. Spectrosc. Spectr. Anal. 2019, 39, 1428–1432. [Google Scholar] [CrossRef]


| Absolute Water Content (%) | Bulk Density (g/cm3) | Saturated Water Capacity (%) | Capillary Water Capacity (%) | Non-Capillary Porosity (%) | Capillary Porosity (%) | Total Porosity (%) | |
|---|---|---|---|---|---|---|---|
| Average | 31.61 | 0.76 | 80.82 | 59.92 | 15.58 | 44.93 | 60.52 |
| SD | 8.00 | 0.09 | 10.47 | 9.03 | 3.70 | 5.57 | 4.88 |
| Max | 49.53 | 1.03 | 97.54 | 75.95 | 24.58 | 54.08 | 68.54 |
| Min | 7.83 | 0.60 | 62.23 | 43.25 | 8.24 | 31.92 | 49.10 |
| Plot No. | Number of Samples | Maximum (g/kg) | Minimum (g/kg) | Average Value (g/kg) | Standard Deviation (g/kg) |
|---|---|---|---|---|---|
| 1 | 15 | 11.9713 | 8.1776 | 10.294 | 1.1384 |
| 2 | 15 | 11.4979 | 6.8753 | 8.942 | 1.6408 |
| 3 | 15 | 9.1034 | 4.7914 | 6.923 | 1.2043 |
| 4 | 15 | 15.6771 | 5.9419 | 9.319 | 2.6095 |
| 5 | 15 | 13.5342 | 7.4258 | 9.646 | 1.6054 |
| 6 | 15 | 15.9396 | 6.7213 | 12.248 | 3.1646 |
| 7 | 15 | 21.6961 | 7.3095 | 14.7311 | 4.3775 |
| Total | 105 | 21.6961 | 4.7914 | 10.3005 | 3.3790 |
| Sample Grouping | Number of Samples | Minimum (g/kg) | Maximum (g/kg) | Average (g/kg) | Standard Deviation (g/kg) | Variance (g/kg) |
|---|---|---|---|---|---|---|
| Calibration set | 70 | 3.0344 | 21.6956 | 10.9455 | 3.6987 | 1.3678 |
| Validation set | 35 | 5.8685 | 20.8697 | 9.4811 | 3.5534 | 1.2624 |
| Spectral Preprocessing | Calibration Models | Validation Models | ||||
|---|---|---|---|---|---|---|
| nLVs | R2 | RMSEP | nLVs | R2 | RMSEP | |
| Original Spectrum | 5 | 0.7781 | 0.1655 | 2 | 0.4992 | 0.1789 |
| S-G Smoothing | 6 | 0.7968 | 0.1584 | 2 | 0.4284 | 0.1911 |
| SNV | 4 | 0.7640 | 0.1707 | 1 | 0.4142 | 0.1935 |
| MSC | 4 | 0.7620 | 0.1715 | 1 | 0.4131 | 0.1936 |
| 1st Derivative | 1 | 0.2541 | 0.3035 | 6 | 0.9699 | 0.0438 |
| 2nd Derivative | 1 | 0.2332 | 0.3078 | 1 | 0.4781 | 0.1826 |
| S-G-SNV | 6 | 0.8082 | 0.1539 | 1 | 0.3603 | 0.2022 |
| S-G-MSC | 6 | 0.8072 | 0.1543 | 1 | 0.3595 | 0.2023 |
| 1st Derivative -SNV | 1 | 0.3018 | 0.2937 | 1 | 0.4930 | 0.1800 |
| 1st Derivative -MSC | 1 | 0.1268 | 0.3284 | 1 | 0.0069 | 0.2519 |
| 2nd Derivative -SNV | 1 | 0.2580 | 0.3027 | 1 | 0.4603 | 0.1857 |
| 2nd Derivative -MSC | 2 | 0.3227 | 0.2892 | 9 | 0.7670 | 0.1220 |
| Spectral Preprocessing | Number of Combinations | Number of Selected Variables | Percentage of the Original Variables | Intervals | PLS Components | RMSE |
|---|---|---|---|---|---|---|
| S-G-SNV | 2 | 215 | 10.00% | 2, 14 | 6 | 0.2249 |
| 3 | 323 | 15.02% | 2, 11, 13 | 6 | 0.2131 | |
| 4 | 430 | 19.99% | 2, 9, 12, 13 | 6 | 0.2142 | |
| S-G-MSC | 2 | 215 | 10.00% | 2, 14 | 6 | 0.2224 |
| 3 | 323 | 15.02% | 2, 11, 13 | 6 | 0.2120 | |
| 4 | 430 | 19.99% | 2, 9, 12, 13 | 6 | 0.2123 |
| Spectral Preprocessing | Feature Variable Selection Methods | Calibration Models | Validation Models | ||||
|---|---|---|---|---|---|---|---|
| nLVs | R2 | RMSE | nLVs | R2 | RMSE | ||
| S-G-SNV | - | 6 | 0.8082 | 0.1539 | 1 | 0.3603 | 0.2022 |
| CARS | 15 | 0.9520 | 0.0770 | 14 | 0.9120 | 0.0750 | |
| SPA | 22 | 0.7840 | 0.1633 | 22 | 0.8214 | 0.1068 | |
| UVE | 15 | 0.7964 | 0.1586 | 15 | 0.8092 | 0.1104 | |
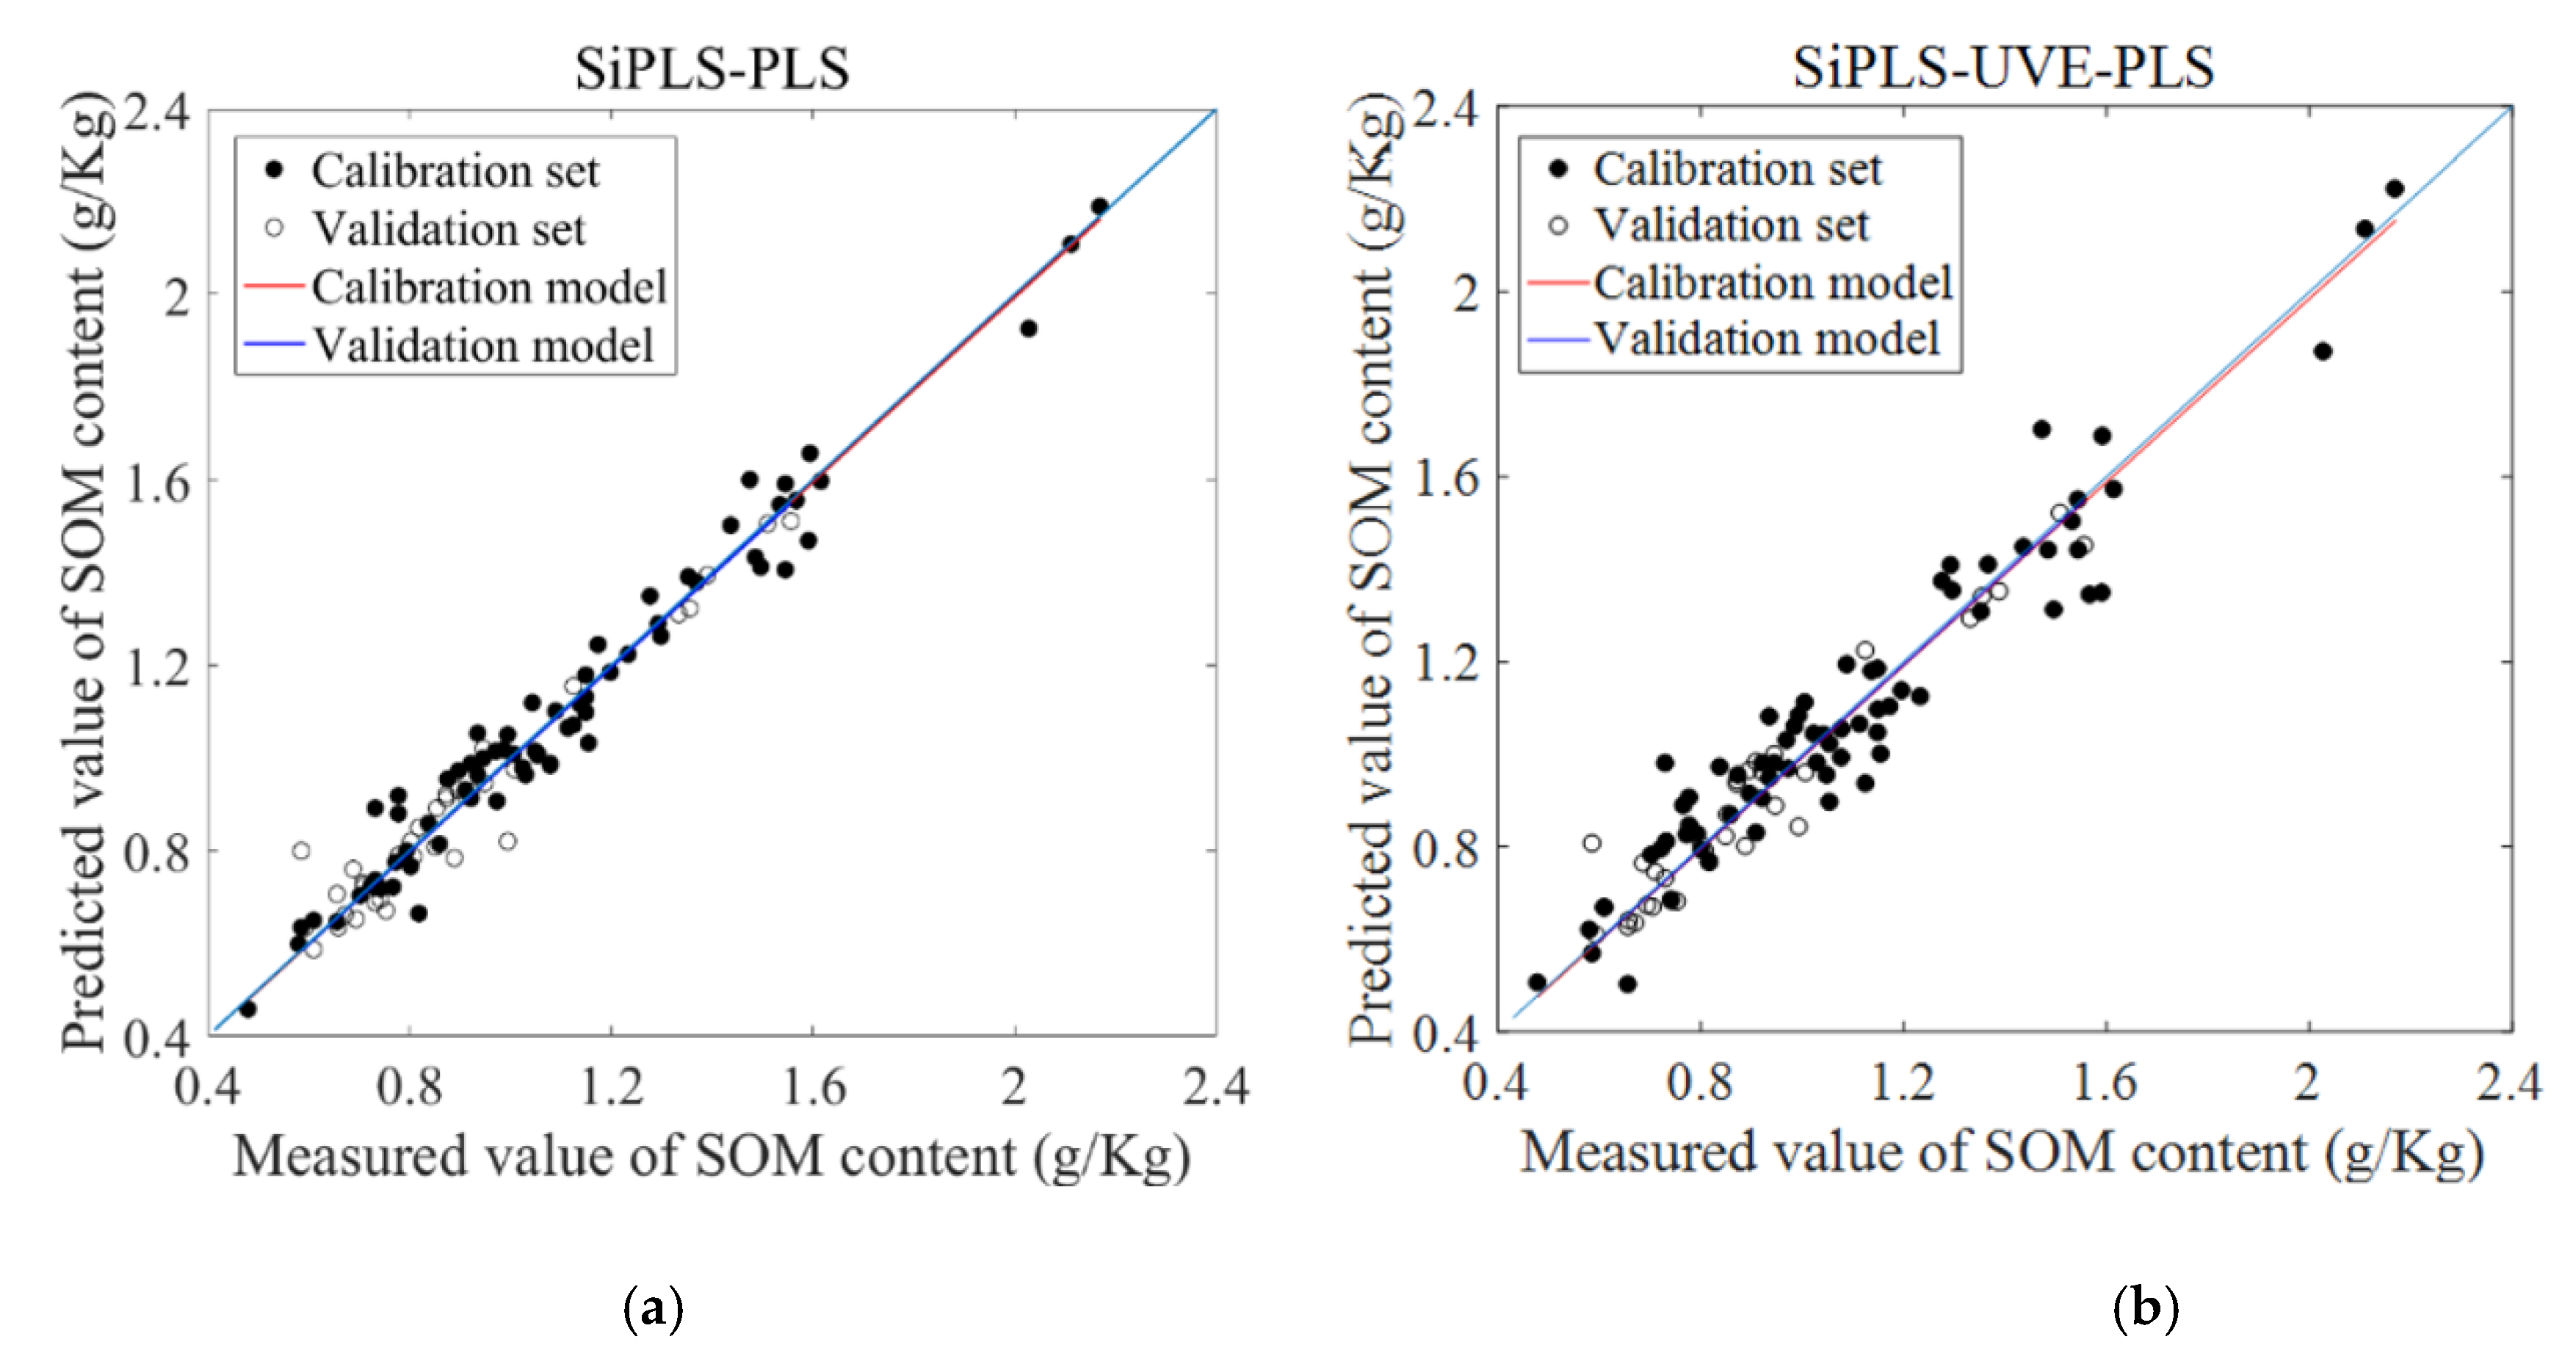
| SiPLS | 20 | 0.9663 | 0.0645 | 20 | 0.9408 | 0.0615 | |
| UVE-CARS | 15 | 0.8344 | 0.1430 | 9 | 0.8503 | 0.0978 | |
| UVE-SPA | 7 | 0.7954 | 0.1590 | 7 | 0.6321 | 0.1533 | |
| SiPLS-UVE | 20 | 0.9221 | 0.0981 | 20 | 0.9270 | 0.0683 | |
| CARS-SPA | 15 | 0.9520 | 0.0770 | 15 | 0.8538 | 0.0967 | |
| SiPLS-CARS | 18 | 0.9391 | 0.0867 | 12 | 0.8401 | 0.1011 | |
| SiPLS-SPA | 23 | 0.8084 | 0.1538 | 30 | 0.8267 | 0.1052 | |
| S-G-MSC | - | 6 | 0.8072 | 0.1543 | 1 | 0.3595 | 0.2023 |
| CARS | 15 | 0.9524 | 0.0767 | 7 | 0.7914 | 0.1155 | |
| SPA | 22 | 0.7896 | 0.1612 | 22 | 0.8588 | 0.0950 | |
| UVE | 14 | 0.8173 | 0.1502 | 14 | 0.7580 | 0.1243 | |
| SiPLS | 20 | 0.9659 | 0.0649 | 20 | 0.9442 | 0.0597 | |
| UVE-CARS | 14 | 0.8735 | 0.1250 | 16 | 0.8990 | 0.0803 | |
| UVE-SPA | 7 | 0.7879 | 0.1619 | 7 | 0.5838 | 0.1631 | |
| SiPLS-UVE | 20 | 0.9081 | 0.1065 | 20 | 0.9117 | 0.0751 | |
| CARS-SPA | 15 | 0.9524 | 0.0767 | 15 | 0.8281 | 0.1048 | |
| SiPLS-CARS | 17 | 0.9250 | 0.0963 | 10 | 0.8509 | 0.0976 | |
| SiPLS-SPA | 23 | 0.8414 | 0.1400 | 30 | 0.8848 | 0.0858 | |
Publisher’s Note: MDPI stays neutral with regard to jurisdictional claims in published maps and institutional affiliations. |
© 2021 by the authors. Licensee MDPI, Basel, Switzerland. This article is an open access article distributed under the terms and conditions of the Creative Commons Attribution (CC BY) license (https://creativecommons.org/licenses/by/4.0/).
Share and Cite
Li, C.; Zhao, J.; Li, Y.; Meng, Y.; Zhang, Z. Modeling and Prediction of Soil Organic Matter Content Based on Visible-Near-Infrared Spectroscopy. Forests 2021, 12, 1809. https://doi.org/10.3390/f12121809
Li C, Zhao J, Li Y, Meng Y, Zhang Z. Modeling and Prediction of Soil Organic Matter Content Based on Visible-Near-Infrared Spectroscopy. Forests. 2021; 12(12):1809. https://doi.org/10.3390/f12121809
Chicago/Turabian StyleLi, Chunxu, Jinghan Zhao, Yaoxiang Li, Yongbin Meng, and Zheyu Zhang. 2021. "Modeling and Prediction of Soil Organic Matter Content Based on Visible-Near-Infrared Spectroscopy" Forests 12, no. 12: 1809. https://doi.org/10.3390/f12121809