
Mountain Pine Beetle Impacts on Health through Lost Forest Air Pollutant Sinks


Abstract
:1. Introduction
2. Materials and Methods
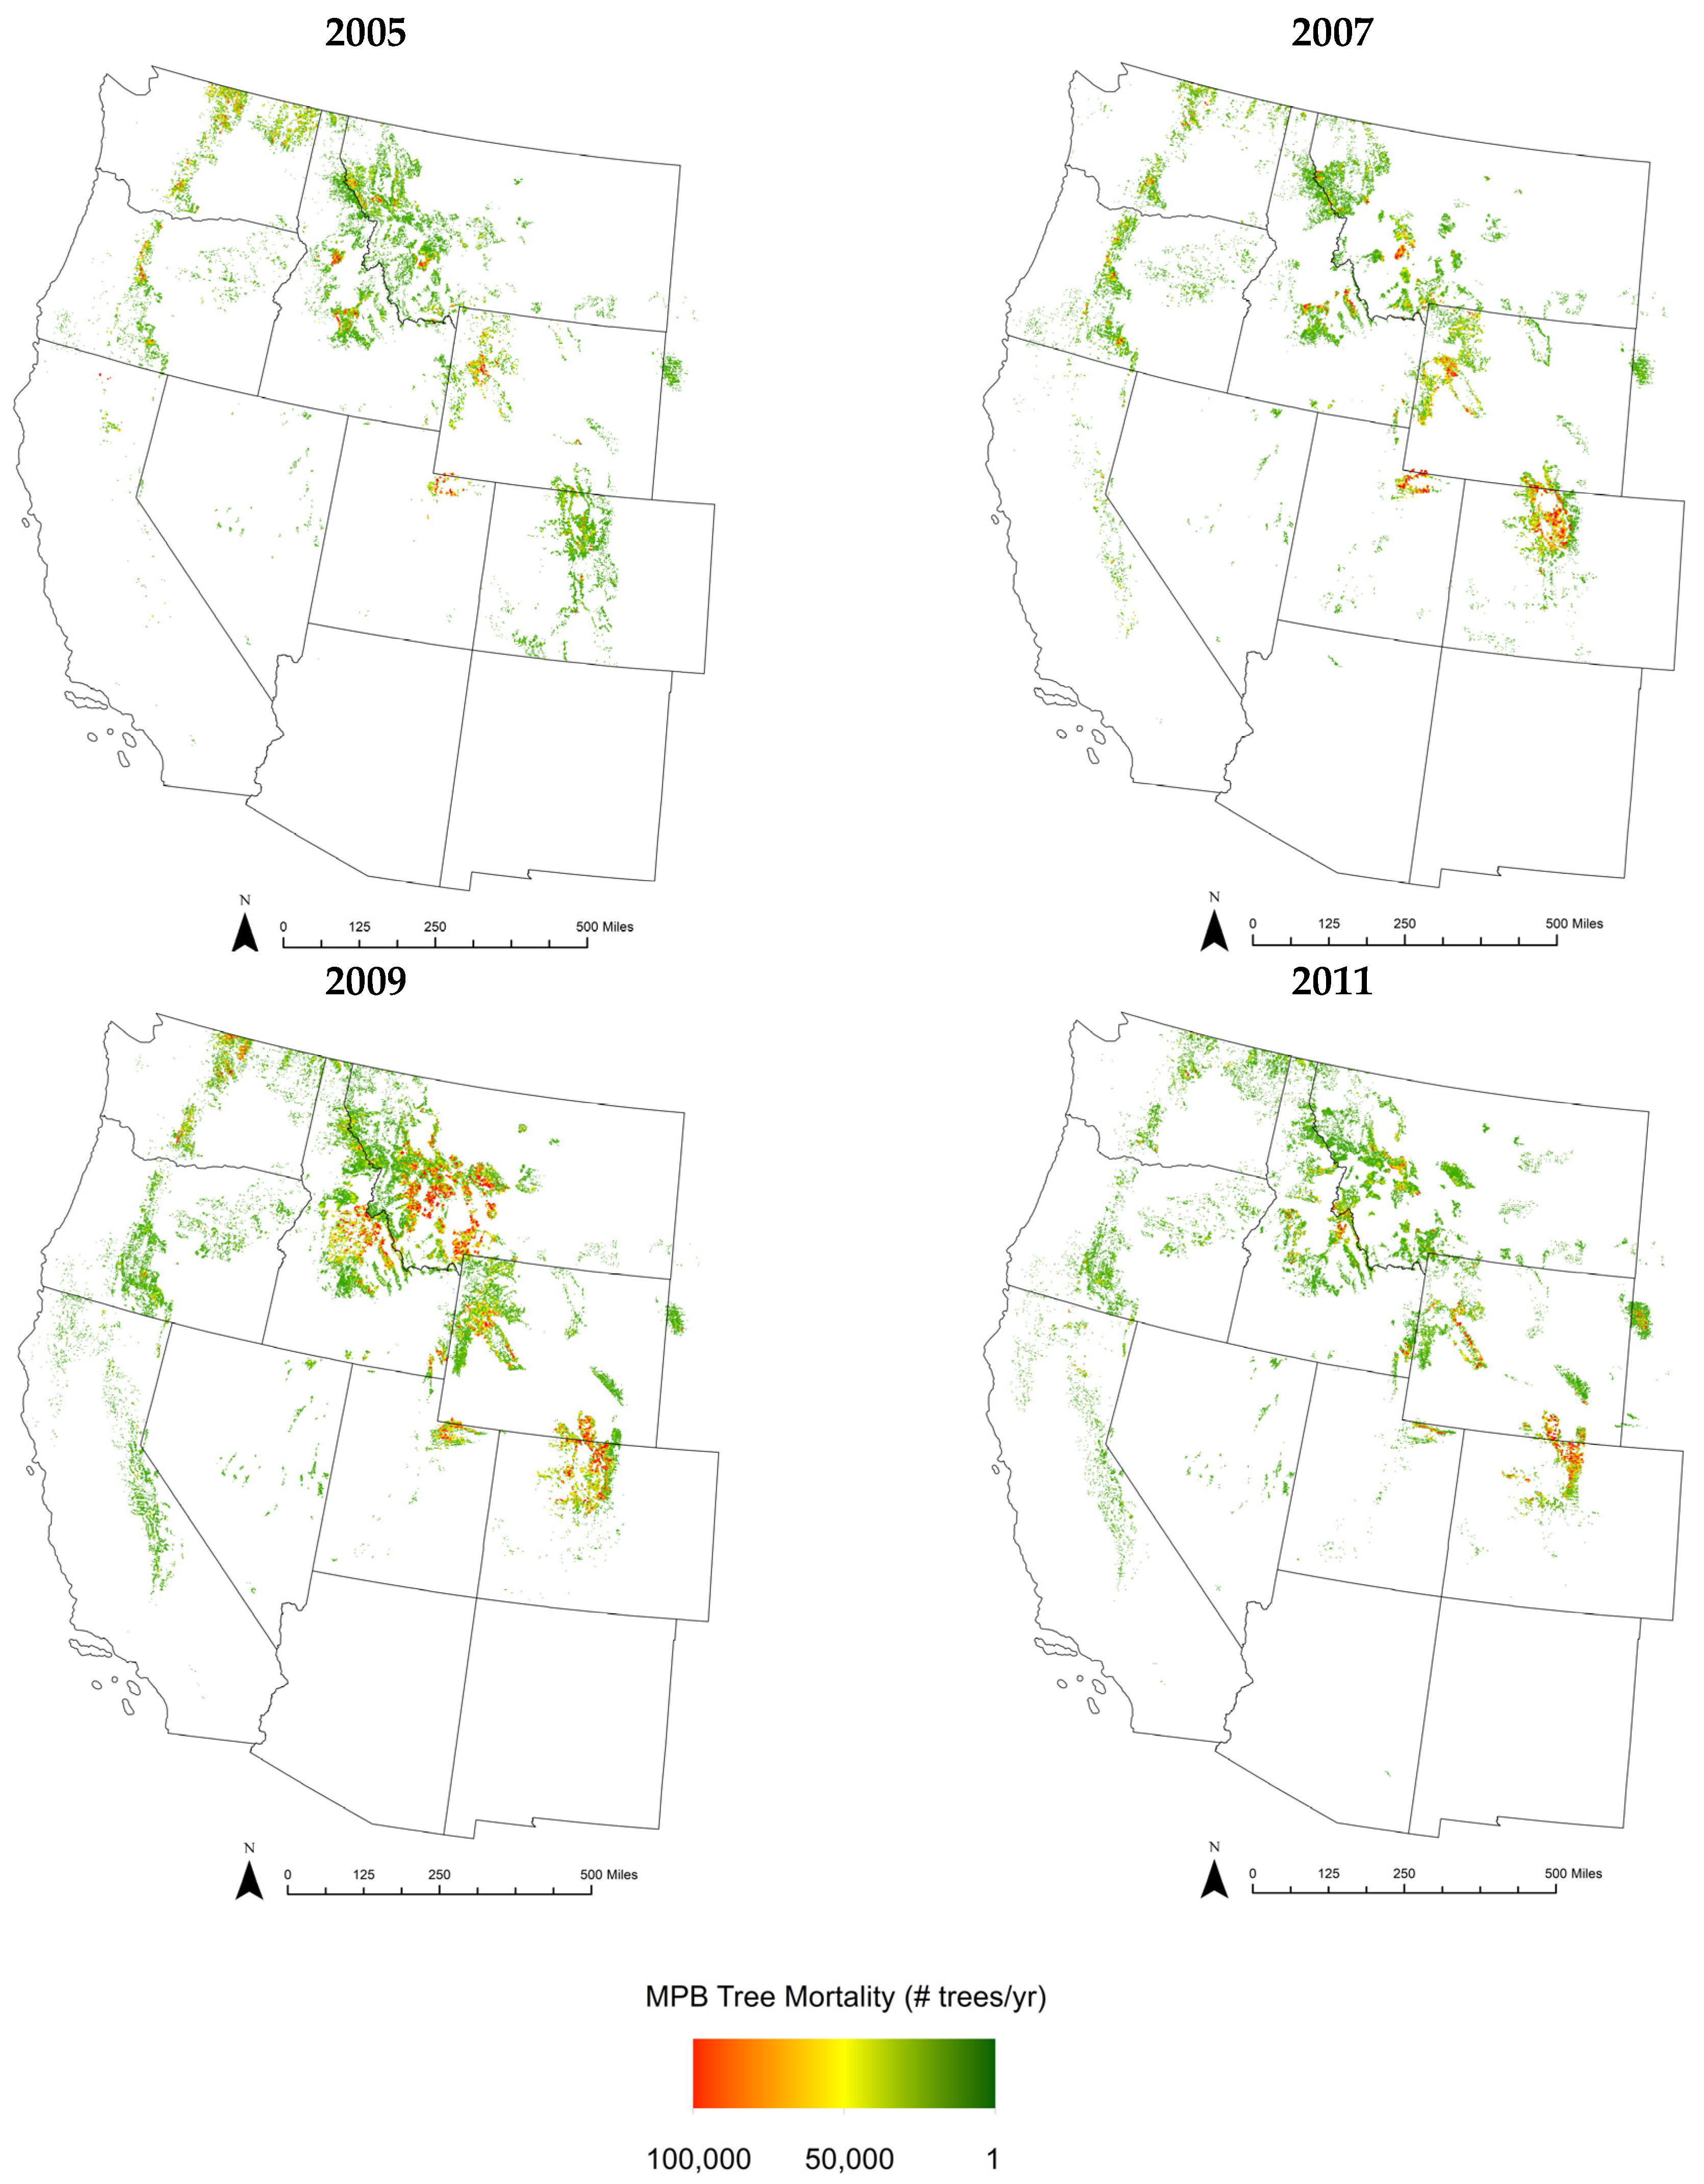
2.1. MPB Disturbance Data
2.2. Using i-Tree Eco to Model Tree Pollution Removal
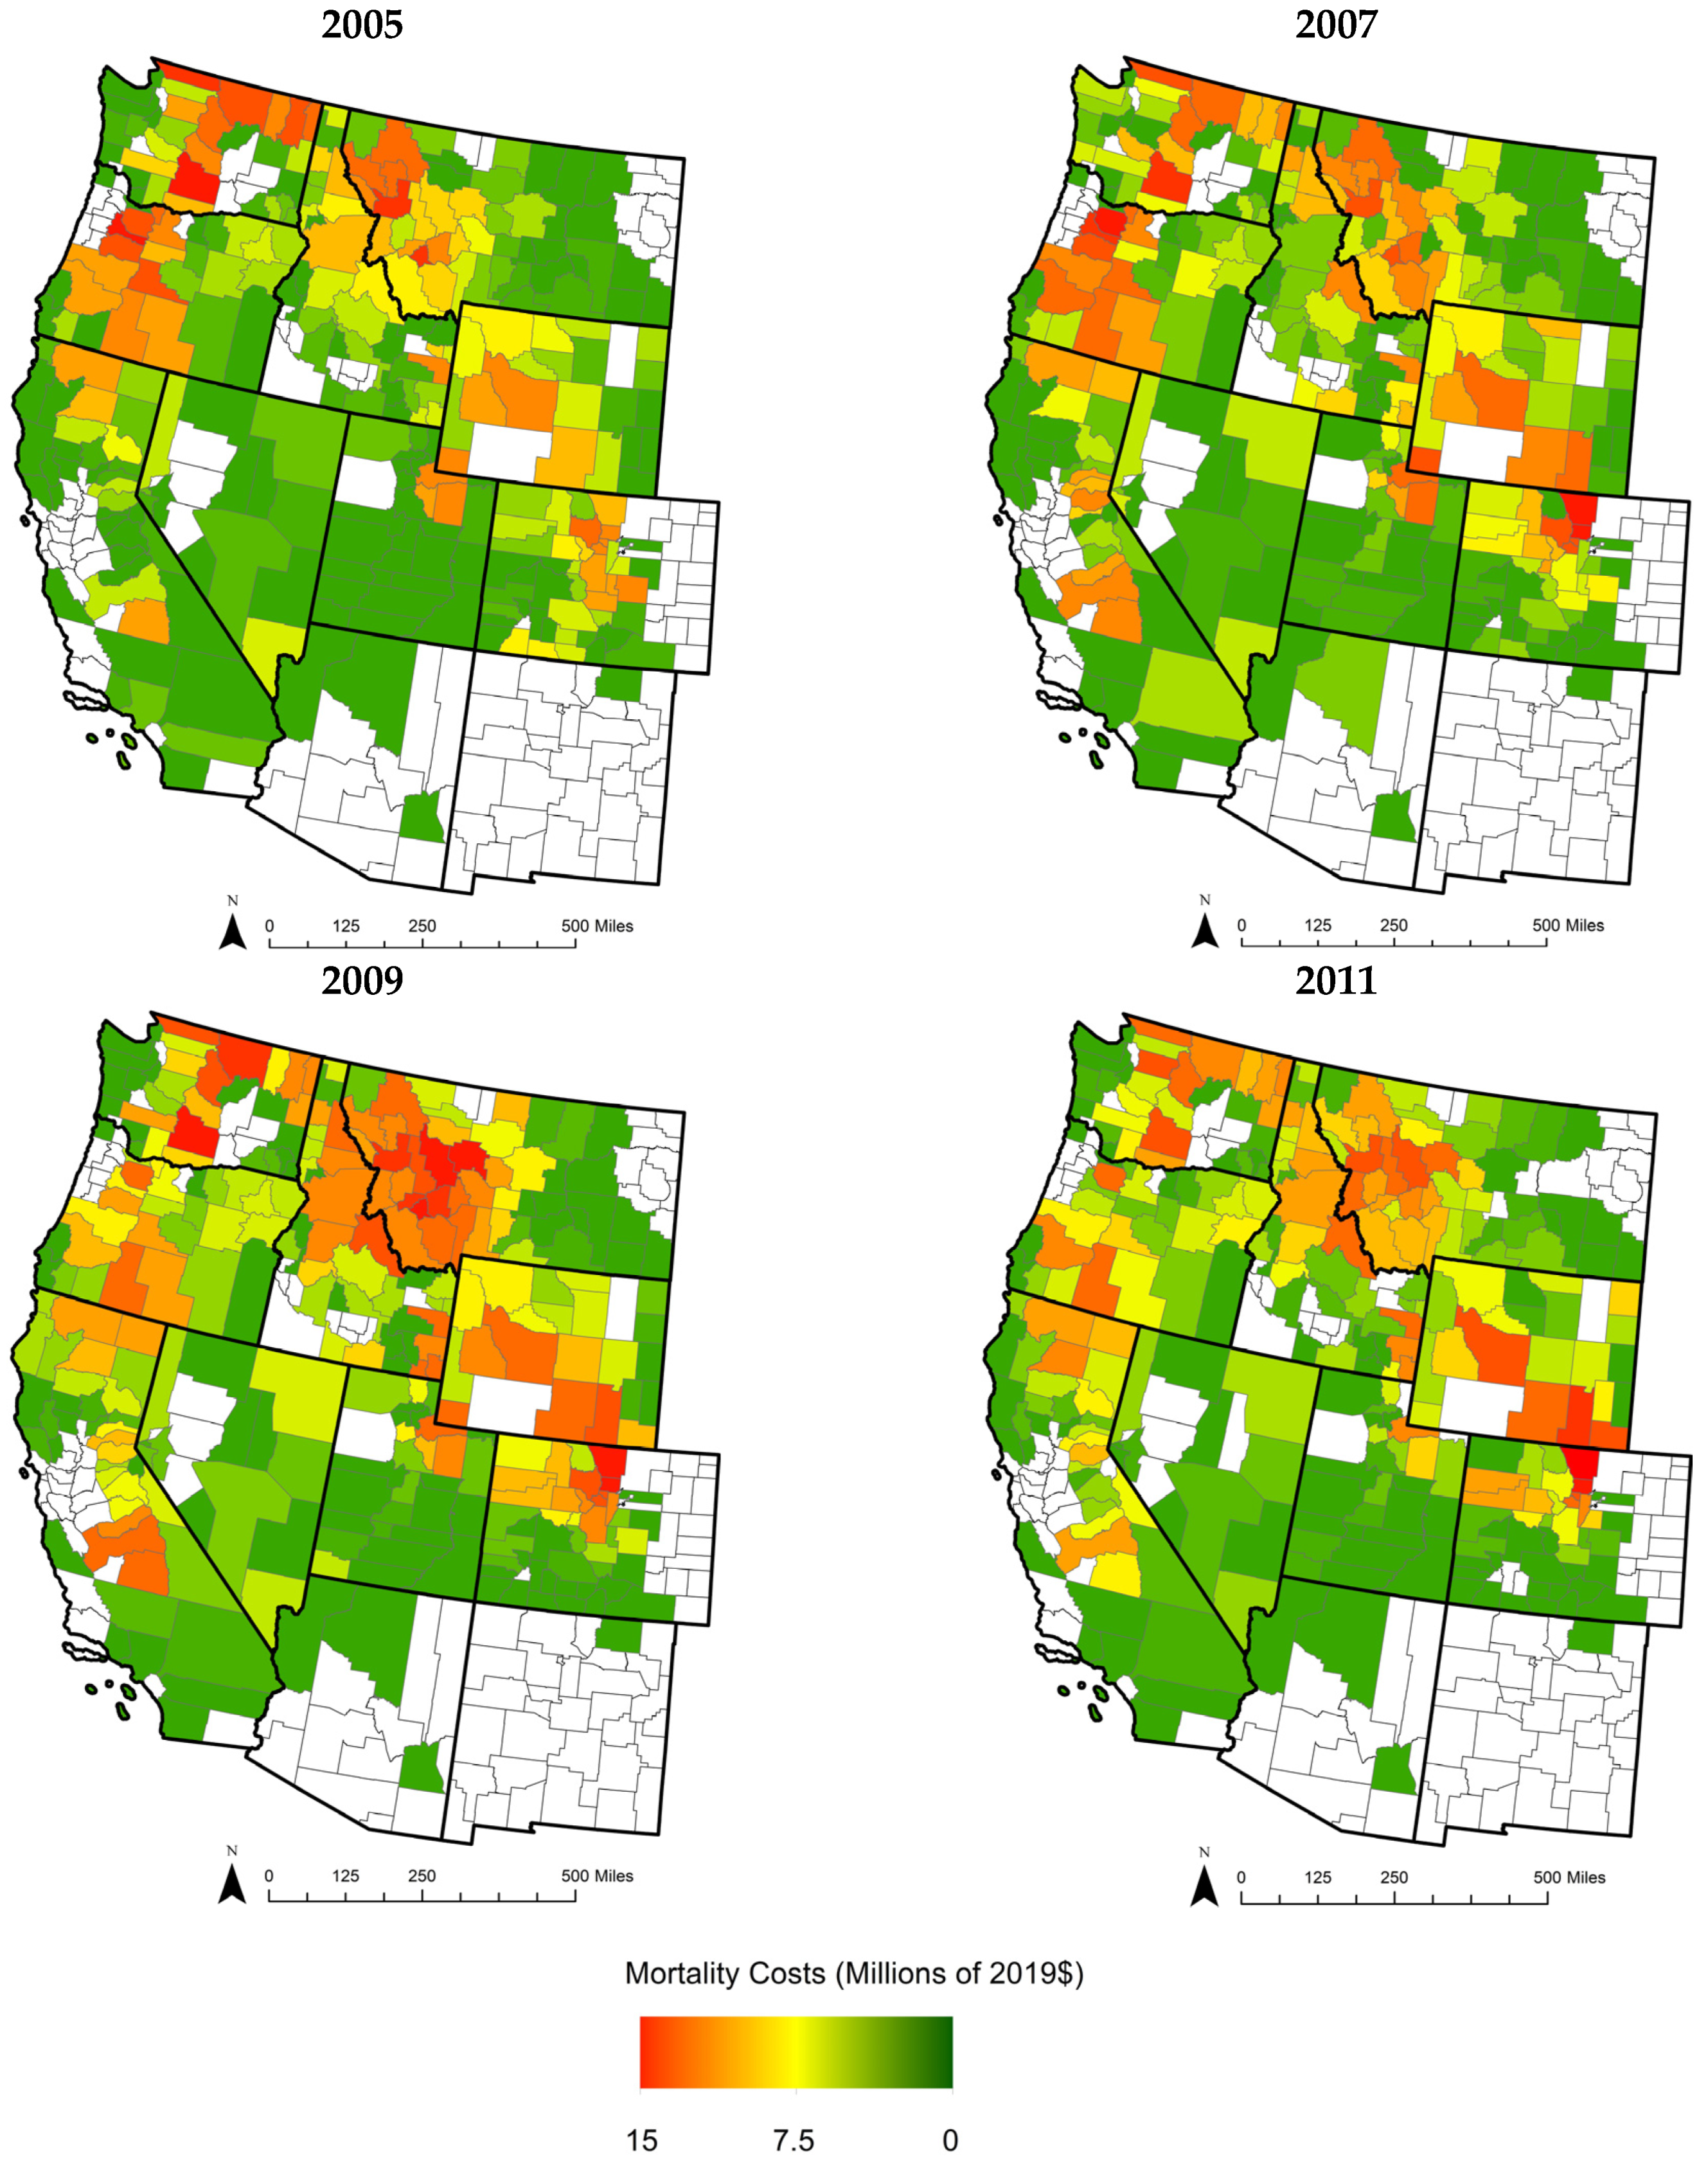
2.3. Health Impact Functions and Economic Valuation
2.4. Summary Statistics and Parameter Values

| Mean | Std. Dev. | Sample Size | |
|---|---|---|---|
| Lodgepole pine (Pinus contorta) mortality | 69,167.3 | 315,355.6 | 2016 |
| Ponderosa pine (Pinus ponderosa) mortality | 27,532.0 | 125,527.3 | 2016 |
| Great Basin bristlecone pine (Pinus longaeva) mortality | 35.49 | 161.8 | 2016 |
| Rocky Mountain bristlecone pine (Pinus aristata) mortality | 535.4 | 2427.5 | 2016 |
| Monterey pine (Pinus radiata) mortality | 0.292 | 1.33 | 2016 |
| Limber pine (Pinus flexilis) mortality | 4697.1 | 21,415.7 | 2016 |
| SouthWestern white pine (Pinus strobiformis) mortality | 4.09 | 18.65 | 2016 |
| Sugar pine (Pinus lambertiana) mortality | 1774.7 | 8091.6 | 2016 |
| Western white pine (Pinus monticola) mortality | 1549.9 | 7066.6 | 2016 |
| Whitebark pine (Pinus albicaulis) mortality | 13,014.7 | 59,338.2 | 2016 |
| Tree mortality, all species | 118,315.6 | 539,438.3 | 2016 |
| Population | 148,307.4 | 652,786.5 | 2016 |
| Baseline mortality rate (per 100,000) | 757.6 | 135.3 | 1949 |
| Baseline ER asthma rate (per 100,000) | 459.4 | 169.4 | 2016 |
| Baseline HA all-respiratory rate (per 100,000) | 2409.3 | 876.4 | 2016 |
| Monitored PM2.5 () | 5.11 | 1.51 | 2016 |
| Monitored O3 (ppm) | 0.071 | 0.009 | 2016 |
| Monitored SO2 (ppb) | 41.07 | 32.98 | 2016 |
| Monitored NO2 (ppb) | 37.68 | 11.74 | 2016 |
| Monitored CO (ppm) | 2.10 | 0.464 | 2016 |
| (mortality, PM2.5) = 0.0005826891 | |||
| (mortality, O3) = 0.000507844 | |||
| (mortality, SO2) = 0.000399202 | |||
| (mortality, NO2) = 0.0074100012 | |||
| (mortality, CO) = 0.0328431136 | |||
| (ER asthma, PM2.5) = 0.005602959 | |||
| (ER asthma, O3) = 0.00397574 | |||
| (ER asthma, SO2) = 0.000049975 | |||
| (ER asthma, NO2) = 0.0019802627 | |||
| (ER asthma, CO) = 0.0099503309 | |||
| (HA all-respiratory, PM2.5) = 0.00207 | |||
| (HA all-respiratory, O3) = 0.007147005 | |||
| (HA all-respiratory, SO2) = 0.0202669672 | |||
| (HA all-respiratory, NO2) = 0.0028013898 | |||
| (HA all-respiratory, CO) = 0.088156972 | |||
| Num. states = 11 | |||
| Num. counties = 2016 |
3. Results
3.1. Lost Air Pollution Removal
3.2. Mortality and Morbidity Impacts and Costs
4. Discussion
Funding
Institutional Review Board Statement
Informed Consent Statement
Data Availability Statement
Conflicts of Interest
Appendix A. MPB Life Cycle Dynamics
Appendix B. MPB Disturbance Data
Appendix C. Mortality and Morbidity Health Costs Per 100 Trees Killed by MPB
| Mortality (All-Cause) | ER Visits (Asthma) | Hospital Admissions (All-Respiratory) | ||
|---|---|---|---|---|
| Trees Killed (Millions) | Costs Per 100 Trees Killed ($) | Costs Per 100 Trees Killed ($) | Costs Per 100 Trees Killed ($) | |
| PM2.5 | ||||
| 2005 | 15.2 | 618 | 0.020 | 0.592 |
| 2006 | 15.1 | 689 | 0.020 | 0.556 |
| 2007 | 20.3 | 547 | 0.025 | 0.571 |
| 2008 | 51.6 | 236 | 0.017 | 0.430 |
| 2009 | 59.4 | 247 | 0.017 | 0.401 |
| 2010 | 41.0 | 327 | 0.022 | 0.510 |
| 2011 | 35.9 | 260 | 0.053 | 1.14 |
| Average | 37.2 | 418 | 0.025 | 0.600 |
| O3 | ||||
| 2005 | 15.2 | 59.9 | 0.001 | 0.125 |
| 2006 | 15.1 | 58.0 | 0.002 | 0.113 |
| 2007 | 20.3 | 72.9 | 0.002 | 0.138 |
| 2008 | 51.6 | 65.5 | 0.002 | 0.114 |
| 2009 | 59.4 | 65.0 | 0.002 | 0.125 |
| 2010 | 41.0 | 82.4 | 0.002 | 0.161 |
| 2011 | 35.9 | 195.3 | 0.006 | 0.396 |
| Average | 37.2 | 85.6 | 0.002 | 0.167 |
| SO2 | ||||
| 2005 | 15.2 | 320 | 0.001 | 1.13 |
| 2006 | 15.1 | 262 | 0.001 | 0.921 |
| 2007 | 20.3 | 208 | 0.001 | 0.966 |
| 2008 | 51.6 | 125 | 0.001 | 0.874 |
| 2009 | 59.4 | 134 | 0.002 | 1.03 |
| 2010 | 41.0 | 160 | 0.002 | 1.19 |
| 2011 | 35.9 | 81.3 | 0.003 | 2.24 |
| Average | 37.2 | 184 | 0.002 | 1.19 |
| NO2 | ||||
| 2005 | 15.2 | 307 | 0.005 | 0.270 |
| 2006 | 15.1 | 403 | 0.006 | 0.278 |
| 2007 | 20.3 | 243 | 0.010 | 0.404 |
| 2008 | 51.6 | 122 | 0.006 | 0.244 |
| 2009 | 59.4 | 110 | 0.005 | 0.261 |
| 2010 | 41.0 | 134 | 0.010 | 0.424 |
| 2011 | 35.9 | 134 | 0.025 | 1.18 |
| Average | 37.2 | 208 | 0.010 | 0.437 |
| CO | ||||
| 2005 | 15.2 | 4.84 | 0.00007 | 0.040 |
| 2006 | 15.1 | 3.94 | 0.00007 | 0.033 |
| 2007 | 20.3 | 3.52 | 0.00010 | 0.025 |
| 2008 | 51.6 | 2.83 | 0.00006 | 0.019 |
| 2009 | 59.4 | 2.51 | 0.00005 | 0.019 |
| 2010 | 41.0 | 2.76 | 0.00007 | 0.022 |
| 2011 | 35.9 | 4.23 | 0.00011 | 0.031 |
| Average | 37.2 | 3.52 | 0.00008 | 0.027 |
Appendix D. Sensitivity Analysis
| Lost PM2.5 Removal (t) | Mortality (All-Cause) Due to Lost PM2.5 | ER Visits (Asthma) Due to Lost PM2.5 | HA (All-Respiratory) Due to Lost PM2.5 | Mortality Costs (Millions $) | ER Visits Costs (Millions $) | HA Costs (Millions $) | |
|---|---|---|---|---|---|---|---|
| 2005 | 1865 | 1.30 | 0.850 | 0.299 | 12.2 | 0.0004 | 0.012 |
| 2006 | 1893 | 1.42 | 0.898 | 0.277 | 13.4 | 0.0004 | 0.011 |
| 2007 | 2112 | 1.54 | 1.40 | 0.387 | 14.5 | 0.0007 | 0.015 |
| 2008 | 5975 | 1.72 | 2.61 | 0.754 | 16.2 | 0.0012 | 0.029 |
| 2009 | 6984 | 2.08 | 2.74 | 0.801 | 19.5 | 0.0013 | 0.032 |
| 2010 | 4791 | 1.74 | 2.55 | 0.692 | 17.4 | 0.0012 | 0.027 |
| 2011 | 4046 | 1.31 | 5.32 | 1.39 | 12.3 | 0.0024 | 0.054 |
| Average | 4300 | 1.59 | 2.34 | 0.657 | 15.1 | 0.0011 | 0.026 |
| Mortality (All-Cause) | ER Visits (Asthma) | Hospital Admissions (All-Respiratory) | |||||
|---|---|---|---|---|---|---|---|
| Trees Killed (Millions) | Cases | Costs (Millions $) | Cases | Costs (Millions $) | Cases | Costs (Millions $) | |
| PM2.5 | |||||||
| 2005 | 207 | 136 | 1277 | 88.9 | 0.041 | 31.2 | 1.22 |
| 2006 | 205 | 149 | 1414 | 94.6 | 0.041 | 29.2 | 1.14 |
| 2007 | 276 | 160 | 1509 | 146 | 0.068 | 40.3 | 1.58 |
| 2008 | 702 | 175 | 1659 | 265 | 0.122 | 76.6 | 3.02 |
| 2009 | 808 | 214 | 1999 | 285 | 0.136 | 82.5 | 3.24 |
| 2010 | 558 | 193 | 1822 | 263 | 0.122 | 72.4 | 2.84 |
| 2011 | 488 | 135 | 1270 | 549 | 0.258 | 143 | 5.58 |
| Average | 463 | 166 | 1564 | 242 | 0.113 | 67.9 | 2.66 |
| O3 | |||||||
| 2005 | 207 | 13.1 | 124 | 6.36 | 0.003 | 6.54 | 0.258 |
| 2006 | 205 | 12.6 | 119 | 7.08 | 0.004 | 5.88 | 0.232 |
| 2007 | 276 | 21.4 | 201 | 12.2 | 0.005 | 9.79 | 0.381 |
| 2008 | 702 | 48.6 | 459 | 26.5 | 0.012 | 20.5 | 0.802 |
| 2009 | 808 | 55.6 | 525 | 32.2 | 0.014 | 25.7 | 1.01 |
| 2010 | 558 | 48.8 | 460 | 28.3 | 0.014 | 22.8 | 0.897 |
| 2011 | 488 | 101.2 | 953 | 64.6 | 0.027 | 49.1 | 1.93 |
| Average | 463 | 43.0 | 406 | 25.3 | 0.011 | 20.0 | 0.787 |
| SO2 | |||||||
| 2005 | 207 | 70.0 | 661 | 5.25 | 0.003 | 59.3 | 2.34 |
| 2006 | 205 | 56.9 | 537 | 4.71 | 0.003 | 48.0 | 1.89 |
| 2007 | 276 | 60.9 | 573 | 7.14 | 0.004 | 67.8 | 2.67 |
| 2008 | 702 | 93.4 | 879 | 17.0 | 0.008 | 156 | 6.13 |
| 2009 | 808 | 115 | 1083 | 24.1 | 0.013 | 212 | 8.32 |
| 2010 | 558 | 94.7 | 892 | 18.5 | 0.010 | 168 | 6.61 |
| 2011 | 488 | 42.0 | 397 | 39.9 | 0.014 | 279 | 10.95 |
| Average | 463 | 76.1 | 717 | 16.7 | 0.008 | 141 | 5.56 |
| NO2 | |||||||
| 2005 | 207 | 67.5 | 635 | 19.3 | 0.010 | 14.1 | 0.557 |
| 2006 | 205 | 87.9 | 828 | 26.2 | 0.012 | 14.4 | 0.571 |
| 2007 | 276 | 71.3 | 671 | 50.0 | 0.028 | 28.6 | 1.12 |
| 2008 | 702 | 90.6 | 853 | 82.7 | 0.041 | 43.7 | 1.71 |
| 2009 | 808 | 94.2 | 889 | 96.7 | 0.042 | 53.7 | 2.11 |
| 2010 | 558 | 79.1 | 748 | 105 | 0.054 | 60.4 | 2.36 |
| 2011 | 488 | 69.2 | 653 | 256 | 0.124 | 147 | 5.74 |
| Average | 463 | 80.0 | 754 | 90.8 | 0.044 | 51.7 | 2.02 |
| CO | |||||||
| 2005 | 207 | 1.06 | 10.0 | 0.394 | 0.0001 | 2.08 | 0.081 |
| 2006 | 205 | 0.86 | 8.09 | 0.354 | 0.0001 | 1.65 | 0.068 |
| 2007 | 276 | 1.03 | 9.72 | 0.435 | 0.0003 | 1.87 | 0.069 |
| 2008 | 702 | 2.10 | 19.9 | 0.843 | 0.0004 | 3.61 | 0.136 |
| 2009 | 808 | 2.16 | 20.3 | 0.911 | 0.0004 | 3.90 | 0.149 |
| 2010 | 558 | 1.62 | 15.4 | 0.707 | 0.0004 | 2.97 | 0.122 |
| 2011 | 488 | 2.18 | 20.7 | 1.07 | 0.0005 | 3.90 | 0.150 |
| Average | 463 | 1.57 | 14.9 | 0.673 | 0.0003 | 2.85 | 0.111 |
| Mortality (All-Cause) | ER Visits (Asthma) | Hospital Admissions (All-Respiratory) | ||||
|---|---|---|---|---|---|---|
| Cases | Costs (Millions $) | Cases | Costs (Millions $) | Cases | Costs (Millions $) | |
| PM2.5 | ||||||
| 2005 | 3.22 | 30.3 | 2.11 | 0.001 | 0.742 | 0.029 |
| 2006 | 3.54 | 33.5 | 2.24 | 0.001 | 0.693 | 0.027 |
| 2007 | 3.81 | 35.1 | 3.45 | 0.002 | 0.954 | 0.037 |
| 2008 | 4.17 | 39.4 | 6.29 | 0.003 | 1.82 | 0.072 |
| 2009 | 5.01 | 47.1 | 6.77 | 0.003 | 1.96 | 0.077 |
| 2010 | 4.55 | 43.2 | 6.24 | 0.003 | 1.72 | 0.067 |
| 2011 | 3.21 | 30.1 | 13.01 | 0.006 | 3.39 | 0.132 |
| Average | 3.93 | 37.0 | 5.73 | 0.003 | 1.61 | 0.063 |
| O3 | ||||||
| 2005 | 0.194 | 1.82 | 0.094 | 0.00004 | 0.096 | 0.004 |
| 2006 | 0.181 | 1.75 | 0.104 | 0.00006 | 0.086 | 0.003 |
| 2007 | 0.314 | 2.94 | 0.180 | 0.00008 | 0.144 | 0.006 |
| 2008 | 0.714 | 6.75 | 0.392 | 0.0002 | 0.301 | 0.012 |
| 2009 | 0.818 | 7.72 | 0.471 | 0.0002 | 0.374 | 0.015 |
| 2010 | 0.704 | 6.76 | 0.416 | 0.0002 | 0.336 | 0.013 |
| 2011 | 1.41 | 14.01 | 0.951 | 0.0004 | 0.722 | 0.028 |
| Average | 0.619 | 5.96 | 0.373 | 0.0002 | 0.294 | 0.012 |
| SO2 | ||||||
| 2005 | 1.56 | 14.7 | 0.117 | 0.00001 | 1.32 | 0.052 |
| 2006 | 1.26 | 11.7 | 0.104 | 0.00001 | 1.07 | 0.042 |
| 2007 | 1.32 | 12.8 | 0.159 | 0.00001 | 1.51 | 0.059 |
| 2008 | 2.09 | 19.5 | 0.378 | 0.0002 | 3.48 | 0.137 |
| 2009 | 2.51 | 24.1 | 0.536 | 0.0003 | 4.72 | 0.185 |
| 2010 | 2.11 | 19.9 | 0.412 | 0.0002 | 3.75 | 0.142 |
| 2011 | 0.936 | 8.84 | 0.890 | 0.0003 | 6.21 | 0.244 |
| Average | 1.68 | 15.9 | 0.371 | 0.0001 | 3.15 | 0.123 |
| NO2 | ||||||
| 2005 | 1.19 | 11.1 | 0.338 | 0.0002 | 0.247 | 0.009 |
| 2006 | 1.52 | 14.5 | 0.459 | 0.0002 | 0.252 | 0.010 |
| 2007 | 1.25 | 11.7 | 0.876 | 0.0005 | 0.510 | 0.019 |
| 2008 | 1.47 | 14.9 | 1.45 | 0.0007 | 0.766 | 0.031 |
| 2009 | 1.62 | 15.5 | 1.69 | 0.0007 | 0.941 | 0.037 |
| 2010 | 1.39 | 13.0 | 1.84 | 0.0009 | 1.06 | 0.041 |
| 2011 | 1.21 | 11.4 | 4.48 | 0.002 | 2.57 | 0.101 |
| Average | 1.38 | 13.2 | 1.59 | 0.0007 | 0.907 | 0.035 |
| CO | ||||||
| 2005 | 0.022 | 0.198 | 0.008 | 0.000003 | 0.041 | 0.002 |
| 2006 | 0.017 | 0.160 | 0.007 | 0.000003 | 0.032 | 0.001 |
| 2007 | 0.020 | 0.192 | 0.009 | 0.000005 | 0.037 | 0.001 |
| 2008 | 0.041 | 0.395 | 0.017 | 0.000008 | 0.072 | 0.003 |
| 2009 | 0.041 | 0.402 | 0.018 | 0.000008 | 0.078 | 0.003 |
| 2010 | 0.032 | 0.305 | 0.014 | 0.000008 | 0.059 | 0.002 |
| 2011 | 0.043 | 0.411 | 0.021 | 0.00001 | 0.077 | 0.003 |
| Average | 0.031 | 0.295 | 0.013 | 0.000006 | 0.057 | 0.002 |
References
- Sambaraju, K.R.; Goodsman, D.W. Mountain pine beetle: An example of a climate-driven eruptive insect impacting conifer forest ecosystems. CAB Rev. 2021, 16, 1–18. [Google Scholar] [CrossRef]
- Negrón, J.F.; Klutsch, J.G. Probability of Infestation and Extent of Mortality Models for Mountain Pine Beetle in Lodgepole Pine Forests in Colorado; USDA Forest Service Res. Note. RN-RMRS-77; Rocky Mountain Research Station: Fort Collins, CO, USA, 2017.
- Soderberg, D.N.; Mock, K.E.; Hofstetter, R.W.; Bentz, B.J. Translocation experiment reveals capacity for mountain pine beetle persistence under climate warming. Ecol. Monogr. 2021, 91, e01437. [Google Scholar] [CrossRef]
- US Forest Service. Major Forest Insect and Disease Conditions in the United States: 2015; FS-1093; USDA Forest Service, Forest Health Protection Office: Washington, DC, USA, 2017. Available online: https://www.fs.fed.us/foresthealth/publications/ConditionsReport_2015.pdf (accessed on 15 November 2021).
- Rosenberger, R.S.; Bell, L.A.; Champ, P.A.; White, E.M. Estimating the economic value of recreation losses in Rocky Mountain National Park due to a mountain pine beetle outbreak. West. Econ. Forum 2013, 12, 31–39. [Google Scholar]
- Price, J.I.; McCollum, D.W.; Berrens, R.P. Insect infestation and residential property values: A hedonic analysis of the mountain pine beetle epidemic. For. Policy Econ. 2010, 12, 415–422. [Google Scholar] [CrossRef]
- Sheppard, S.; Picard, P. Visual-quality impacts of forest pest activity at the landscape level: A synthesis of published knowledge and research needs. Landsc. Urban Plan. 2006, 77, 321–342. [Google Scholar] [CrossRef]
- Holmes, T.; Koch, F. Bark Beetle Epidemics, Life Satisfaction, and Economic Well-Being. Forests 2019, 10, 696. [Google Scholar] [CrossRef] [Green Version]
- Corbett, L.J.; Withey, P.; Lantz, V.A.; Ochuodho, T.O. The economic impact of the mountain pine beetle infestation in British Columbia: Provincial estimates from a CGE analysis. Forestry 2016, 89, 100–105. [Google Scholar] [CrossRef] [Green Version]
- Mazza, G.; Tricarico, E. (Eds.) Invasive Species and Human Health; CABI: Oxfordshire, UK, 2018. [Google Scholar]
- Jones, B.A. Invasive species impacts on human well-being using the life satisfaction index. Ecol. Econ. 2017, 134, 250–257. [Google Scholar] [CrossRef]
- European Environment Agency. The Impacts of Invasive Alien Species in Europe; European Environment Agency: Copenhagen, Denmark, 2012. Available online: https://www.eea.europa.eu/publications/impacts-of-invasive-alien-species (accessed on 15 November 2021).
- McCollum, D.W.; Lundquist, J.E. Bark Beetle Infestation of Western US Forests: A Context for Assessing and Evaluating Impacts. J. For. 2019, 117, 171–177. [Google Scholar] [CrossRef]
- Nowak, D.J.; Crane, D.E.; Stevens, J.C. Air pollution removal by urban trees and shrubs in the United States. Urban For. Urban Green. 2006, 4, 115–123. [Google Scholar] [CrossRef]
- Khaniabadi, Y.O.; Polosa, R.; Chuturkova, R.; Daryanoosh, M.; Goudarzi, G.; Borgini, A.; Tittarelli, A.; Basiri, H.; Armin, H.; Nourmoradi, H.; et al. Human health risk assessment due to ambient PM10 and SO2 by an air quality modeling technique. Process. Saf. Environ. Prot. 2017, 111, 346–354. [Google Scholar] [CrossRef]
- Anenberg, S.C.; Horowitz, L.W.; Tong, D.Q.; West, J.J. An estimate of the global burden of anthropogenic ozone and fine particulate matter on premature human mortality using atmospheric modeling. Environ. Health Perspect. 2010, 118, 1189–1195. [Google Scholar] [CrossRef]
- Chen, T.M.; Kuschner, W.G.; Gokhale, J.; Shofer, S. Outdoor air pollution: Nitrogen dioxide, sulfur dioxide, and carbon monoxide health effects. Am. J. Med. Sci. 2007, 333, 249–256. [Google Scholar] [CrossRef]
- Nowak, D.J.; Hirabayashi, S.; Bodine, A.; Hoehn, R. Modeled PM2.5 removal by trees in ten US cities and associated health effects. Environ. Pollut. 2013, 178, 395–402. [Google Scholar] [CrossRef] [PubMed]
- Nowak, D.J.; Hirabayashi, S.; Bodine, A.; Greenfield, E. Tree and forest effects on air quality and human health in the United States. Environ. Pollut. 2014, 193, 119–129. [Google Scholar] [CrossRef] [PubMed] [Green Version]
- Chen, L.; Liu, C.; Zhang, L.; Zou, R.; Zhang, Z. Variation in tree species ability to capture and retain airborne fine particulate matter (PM2.5). Sci. Rep. 2017, 7, 3206. [Google Scholar] [CrossRef]
- Garg, T. Ecosystems and human health: The local benefits of forest cover in Indonesia. J. Environ. Econ. Manag. 2019, 98, 102271. [Google Scholar] [CrossRef] [Green Version]
- Berazneva, J.; Byker, T.S. Does forest loss increase human disease? Evidence from Nigeria. Am. Econ. Rev. 2017, 107, 516–521. [Google Scholar] [CrossRef] [Green Version]
- Jones, B.A.; McDermott, S.M. Health impacts of invasive species through an altered natural environment: Assessing air pollution sinks as a causal pathway. Environ. Resour. Econ. 2018, 71, 23–43. [Google Scholar] [CrossRef]
- Jones, B.A. Forest-attacking Invasive Species and Infant Health: Evidence from the Invasive Emerald Ash Borer. Ecol. Econ. 2018, 154, 282–293. [Google Scholar] [CrossRef]
- Jones, B.A.; McDermott, S.M.; Chermak, J.M. PLAN or get SLAM’ed: Optimal management of invasive species in the presence of indirect health externalities. J. Environ. Manag. 2016, 180, 538–550. [Google Scholar] [CrossRef] [PubMed]
- Donovan, G.H.; Butry, D.T.; Michael, Y.L.; Prestemon, J.P.; Liebhold, A.M.; Gatziolis, D.; Mao, M.Y. The relationship between trees and human health: Evidence from the spread of the emerald ash borer. Am. J. Prev. Med. 2013, 44, 139–145. [Google Scholar] [CrossRef]
- Niquidet, K.; Stennes, B.; van Kooten, G.C. Bioenergy from mountain pine beetle timber and forest residuals: A cost analysis. Can. J. Agric. Econ. 2012, 60, 195–210. [Google Scholar] [CrossRef]
- Sims, C.; Aadland, D.; Finnoff, D. A dynamic bioeconomic analysis of mountain pine beetle epidemics. J. Econ. Dyn. Control 2010, 34, 2407–2419. [Google Scholar] [CrossRef]
- Fettig, C.J.; Klepzig, K.D.; Billings, R.F.; Munson, A.S.; Nebeker, T.E.; Negrón, J.F.; Nowak, J.T. The effectiveness of vegetation management practices for prevention and control of bark beetle infestations in coniferous forests of the Western and southern United States. For. Ecol. Manag. 2007, 238, 24–53. [Google Scholar] [CrossRef]
- Hartsough, B.R.; Abrams, S.; Barbour, R.J.; Drews, E.S.; McIver, J.D.; Moghaddas, J.J.; Schwilk, D.W.; Stephens, S.L. The economics of alternative fuel reduction treatments in Western United States dry forests: Financial and policy implications from the National Fire and Fire Surrogate Study. For. Policy Econ. 2008, 10, 344–354. [Google Scholar] [CrossRef]
- Nowak, D.J. Understanding i-Tree: Summary of Programs and Methods; US Forest Service: Syracuse, NY, USA, 2019; in press.
- Song, P.; Kim, G.; Mayer, A.; He, R.; Tian, G. Assessing the Ecosystem Services of Various Types of Urban Green Spaces Based on i-Tree Eco. Sustainability 2020, 12, 1630. [Google Scholar] [CrossRef] [Green Version]
- Hirabayashi, S.; Nowak, D.J. Comprehensive national database of tree effects on air quality and human health in the United States. Environ. Pollut. 2016, 215, 48–57. [Google Scholar] [CrossRef] [PubMed]
- Selmi, W.; Weber, C.; Rivière, E.; Blond, N.; Mehdi, L.; Nowak, D. Air pollution removal by trees in public green spaces in Strasbourg city, France. Urban For. Urban Green. 2016, 17, 192–201. [Google Scholar] [CrossRef] [Green Version]
- Earle, C.J. The Gymnosperm Database. 2020. Available online: https://www.conifers.org/index.php (accessed on 15 November 2021).
- US EPA. BenMAP-CE User’s Manual—April 2021; US EPA: Washington, DC, USA, 2021. Available online: https://www.epa.gov/sites/production/files/2015-04/documents/benmap-ce_user_manual_march_2015.pdf (accessed on 15 November 2021).
- US EPA. Guidelines for Preparing Economic Analyses—Chapter 7: Analyzing Benefits; US EPA: Washington, DC, USA, 2010. Available online: https://www.epa.gov/sites/production/files/2017-09/documents/ee-0568-07.pdf (accessed on 15 November 2021).
- Stanford, R.; Mclaughlin, T.; Okamoto, L.J. The cost of asthma in the emergency department and hospital. Am. J. Respir. Crit. Care Med. 1999, 160, 211–215. [Google Scholar] [CrossRef] [PubMed]
- Crowther, T.W.; Glick, H.B.; Covey, K.R.; Bettigole, C.; Maynard, D.S.; Thomas, S.M.; Smith, J.R.; Hintler, G.; Duguid, M.C.; Amatulli, G.; et al. Mapping tree density at a global scale. Nature 2015, 525, 201–205. [Google Scholar] [CrossRef]
- Vanos, J.K.; Hebbern, C.; Cakmak, S. Risk assessment for cardiovascular and respiratory mortality due to air pollution and synoptic meteorology in 10 Canadian cities. Environ. Pollut. 2014, 185, 322–332. [Google Scholar] [CrossRef] [PubMed] [Green Version]
- Jerrett, M.; Burnett, R.T.; Beckerman, B.S.; Turner, M.C.; Krewski, D.; Thurston, G.; Martin, R.; Van Donkelaar, A.; Hughes, E.; Shi, Y.; et al. Spatial analysis of air pollution and mortality in California. Am. J. Respir. Crit. Care Med. 2013, 188, 593–599. [Google Scholar] [CrossRef] [PubMed]
- Krewski, D.; Jerrett, M.; Burnett, R.T.; Ma, R.; Hughes, E.; Shi, Y.; Turner, M.C.; Pope, C.A.; Thurston, G.; Calle, E.E.; et al. Extended Follow-Up and Spatial Analysis of the American Cancer Society Study Linking Particulate Air Pollution and Mortality (No. 140); Health Effects Institute: Boston, MA, USA, 2009. [Google Scholar]
- Zanobetti, A.; Franklin, M.; Koutrakis, P.; Schwartz, J. Fine particulate air pollution and its components in association with cause-specific emergency admissions. Environ. Health 2009, 8, 58. [Google Scholar] [CrossRef] [Green Version]
- Zanobetti, A.; Schwartz, J. Mortality displacement in the association of ozone with mortality: An analysis of 48 cities in the United States. Am. J. Respir. Crit. Care Med. 2008, 177, 184–189. [Google Scholar] [CrossRef]
- Orellano, P.; Quaranta, N.; Reynoso, J.; Balbi, B.; Vasquez, J. Effect of outdoor air pollution on asthma exacerbations in children and adults: Systematic review and multilevel meta-analysis. PLoS ONE 2017, 12, e0174050. [Google Scholar] [CrossRef]
- Mar, T.F.; Koenig, J.Q.; Primomo, J. Associations between asthma emergency visits and particulate matter sources, including diesel emissions from stationary generators in Tacoma, Washington. Inhal. Toxicol. 2010, 22, 445–448. [Google Scholar] [CrossRef]
- Ito, K.; Thurston, G.D.; Silverman, R.A. Characterization of PM2.5, gaseous pollutants, and meteorological interactions in the context of time-series health effects models. J. Expo. Sci. Environ. Epidemiol. 2007, 17, S45–S60. [Google Scholar] [CrossRef] [PubMed] [Green Version]
- Peel, J.L.; Tolbert, P.E.; Klein, M.; Metzger, K.B.; Flanders, W.D.; Todd, K.; Mulholland, J.A.; Ryan, P.B.; Frumkin, H. Ambient air pollution and respiratory emergency department visits. Epidemiology 2005, 16, 164–174. [Google Scholar] [CrossRef]
- Zheng, X.Y.; Ding, H.; Jiang, L.N.; Chen, S.W.; Zheng, J.P.; Qiu, M.; Zhou, Y.; Chen, Q.; Guan, W.J. Association between air pollutants and asthma emergency room visits and hospital admissions in time series studies: A systematic review and meta-analysis. PLoS ONE 2015, 10, e0138146. [Google Scholar] [CrossRef]
- Oftedal, B.; Nafstad, P.; Magnus, P.; Bjørkly, S.; Skrondal, A. Traffic related air pollution and acute hospital admission for respiratory diseases in Drammen, Norway 1995–2000. Eur. J. Epidemiol. 2003, 18, 671–676. [Google Scholar] [CrossRef] [PubMed]
- Schwartz, J. Short term fluctuations in air pollution and hospital admissions of the elderly for respiratory disease. Thorax 1995, 50, 531–538. [Google Scholar] [CrossRef] [Green Version]
- Feldhaar, H.; Otti, O. Pollutants and their interaction with diseases of social Hymenoptera. Insects 2020, 11, 153. [Google Scholar] [CrossRef] [PubMed] [Green Version]
- Phanitchat, T.; Ampawong, S.; Yawootti, A.; Denpetkul, T.; Wadmanee, N.; Sompornrattanaphan, M.; Sivakorn, C. Dose-Dependent Blood-Feeding Activity and Ovarian Alterations to PM2. 5 in Aedes aegypti. Insects 2021, 12, 948. [Google Scholar] [CrossRef]
- Paoletti, E.; Schaub, M.; Matyssek, R.; Wieser, G.; Augustaitis, A.; Bastrup-Birk, A.; Bytnerowicz, A.; Günthardt-Goerg, M.; Müller-Starck, G.; Serengil, Y. Advances of air pollution science: From forest decline to multiple-stress effects on forest ecosystem services. Environ. Pollut. 2010, 158, 1986–1989. [Google Scholar] [CrossRef] [PubMed]
- Negrón, J.F.; Cain, B. Mountain pine beetle in Colorado: A story of changing forests. J. For. 2019, 117, 144–151. [Google Scholar] [CrossRef] [Green Version]
- Bentz, B.J.; Régnière, J.; Fettig, C.J.; Hansen, E.M.; Hayes, J.L.; Hicke, J.A.; Kelsey, R.G.; Negrón, J.F.; Seybold, S.J. Climate change and bark beetles of the Western United States and Canada: Direct and indirect effects. BioScience 2010, 60, 602–613. [Google Scholar] [CrossRef]
- Leatherman, D.A.; Aguayo, I.; Mehall, T.M. Mountain Pine Beetle, Insect Series, Trees & Shrubs; Colorado State University Cooperative Extension: Fort Collins, CO, USA, 2007. [Google Scholar]
- US Forest Service. Forest Insect & Disease Leaflet 2; USDA Forest Service, Pacific Northwest Region: Portland, OR, USA, 2009. Available online: https://www.fs.fed.us/rm/pubs_other/rmrs_2009_gibson_k002.pdf (accessed on 15 November 2021).
- Griffin, J.M.; Simard, M.; Turner, M.G. Salvage harvest effects on advance tree regeneration, soil nitrogen, and fuels following mountain pine beetle outbreak in lodgepole pine. For. Ecol. Manag. 2013, 291, 228–239. [Google Scholar] [CrossRef]
- Wyoming State Forestry Division. 2016 Wyoming State Forestry Division Highlights; Wyoming State Forestry Division: Cheyenne, WY, USA, 2016; Available online: https://www.fs.fed.us/foresthealth/docs/fhh/WY_FHH_2016.pdf (accessed on 15 November 2021).
- Shegelski, V.A.; Campbell, E.O.; Thompson, K.M.; Whitehouse, C.M.; Sperling, F.A. Source and spread dynamics of mountain pine beetle in central Alberta, Canada. Can. Entomol. 2021, 153, 314–326. [Google Scholar] [CrossRef]
- US Forest Service. Digital Aerial SketchMapping (DASM) for Invasive Weeds; USDA Forest Service, Remote Sensing Applications Center: Salt Lake City, UT, USA, 2020. Available online: https://studylib.net/doc/10672985/digital-aerial-sketchmapping--dasm--for-invasive-weeds--i (accessed on 15 November 2021).
- Meddens, A.J.; Hicke, J.A.; Ferguson, C.A. Spatiotemporal patterns of observed bark beetle-caused tree mortality in British Columbia and the Western United States. Ecol. Appl. 2012, 22, 1876–1891. [Google Scholar] [CrossRef]
- Loeffler, D.; Anderson, N. Impacts of the mountain pine beetle on sawmill operations, costs, and product values in Montana. For. Prod. J. 2018, 68, 15–24. [Google Scholar] [CrossRef]
- Brown, M.G.; Black, T.A.; Nesic, Z.; Foord, V.N.; Spittlehouse, D.L.; Fredeen, A.L.; Bowler, R.; Grant, N.J.; Burton, P.J.; Trofymow, J.A.; et al. Evapotranspiration and canopy characteristics of two lodgepole pine stands following mountain pine beetle attack. Hydrol. Process. 2014, 28, 3326–3340. [Google Scholar] [CrossRef]

| PM2.5 | O3 | SO2 | NO2 | CO | ||||||
|---|---|---|---|---|---|---|---|---|---|---|
| Tonnes (t) | t/Lost Tree | Tonnes (t) | t/Lost Tree | Tonnes (t) | t/Lost Tree | Tonnes (t) | t/Lost Tree | Tonnes (t) | t/Lost Tree | |
| 2005 | 14,361 | 0.0009 | 43,457 | 0.003 | 16,476 | 0.001 | 28,257 | 0.002 | 5645 | 0.0005 |
| 2006 | 14,450 | 0.0009 | 49,440 | 0.003 | 17,834 | 0.001 | 28,482 | 0.002 | 7272 | 0.0004 |
| 2007 | 16,374 | 0.0008 | 67,214 | 0.003 | 19,110 | 0.0009 | 34,886 | 0.002 | 6495 | 0.0003 |
| 2008 | 44,592 | 0.0009 | 158,251 | 0.003 | 49,328 | 0.001 | 87,597 | 0.002 | 15,841 | 0.0003 |
| 2009 | 52,507 | 0.0009 | 175,803 | 0.003 | 55,478 | 0.0009 | 105,897 | 0.002 | 20,240 | 0.0003 |
| 2010 | 36,889 | 0.0009 | 119,277 | 0.003 | 38,712 | 0.0009 | 74,112 | 0.002 | 14,164 | 0.0003 |
| 2011 | 30,648 | 0.0009 | 111,125 | 0.003 | 33,885 | 0.0009 | 61,213 | 0.002 | 7202 | 0.0002 |
| Average | 29,974 | 0.0009 | 103,510 | 0.003 | 32,975 | 0.0009 | 60,063 | 0.002 | 10,979 | 0.0003 |
| Mortality (All-Cause) | ER Visits (Asthma) | Hospital Admissions (All-Respiratory) | ||||
|---|---|---|---|---|---|---|
| Cases | Costs (Millions $) | Cases | Costs (Millions $) | Cases | Costs (Millions $) | |
| PM2.5 | ||||||
| 2005 | 9.97 | 93.9 | 6.54 | 0.003 | 2.30 | 0.090 |
| 2006 | 11.0 | 104 | 6.96 | 0.003 | 2.15 | 0.084 |
| 2007 | 11.8 | 111 | 10.7 | 0.005 | 2.96 | 0.116 |
| 2008 | 12.9 | 122 | 19.5 | 0.009 | 5.63 | 0.222 |
| 2009 | 15.7 | 147 | 21.0 | 0.010 | 6.07 | 0.238 |
| 2010 | 14.2 | 134 | 19.4 | 0.009 | 5.33 | 0.209 |
| 2011 | 9.92 | 93.4 | 40.4 | 0.019 | 10.5 | 0.410 |
| Average | 12.2 | 115 | 17.8 | 0.008 | 4.99 | 0.196 |
| O3 | ||||||
| 2005 | 0.967 | 9.10 | 0.468 | 0.0002 | 0.481 | 0.019 |
| 2006 | 0.930 | 8.76 | 0.520 | 0.0003 | 0.432 | 0.017 |
| 2007 | 1.57 | 14.8 | 0.901 | 0.0004 | 0.720 | 0.028 |
| 2008 | 3.58 | 33.8 | 1.95 | 0.0009 | 1.51 | 0.059 |
| 2009 | 4.09 | 38.6 | 2.37 | 0.001 | 1.89 | 0.074 |
| 2010 | 3.59 | 33.8 | 2.08 | 0.001 | 1.68 | 0.066 |
| 2011 | 7.44 | 70.1 | 4.75 | 0.002 | 3.61 | 0.142 |
| Average | 3.17 | 29.9 | 1.86 | 0.0008 | 1.47 | 0.058 |
| SO2 | ||||||
| 2005 | 5.15 | 48.6 | 0.386 | 0.0002 | 4.36 | 0.171 |
| 2006 | 4.19 | 39.5 | 0.346 | 0.0002 | 3.53 | 0.139 |
| 2007 | 4.48 | 42.2 | 0.525 | 0.0003 | 4.99 | 0.196 |
| 2008 | 6.87 | 64.7 | 1.25 | 0.0006 | 11.5 | 0.451 |
| 2009 | 8.45 | 79.6 | 1.77 | 0.0009 | 15.6 | 0.612 |
| 2010 | 6.96 | 65.6 | 1.36 | 0.0007 | 12.4 | 0.486 |
| 2011 | 3.09 | 29.2 | 2.94 | 0.001 | 20.5 | 0.805 |
| Average | 5.60 | 52.8 | 1.23 | 0.0006 | 10.4 | 0.409 |
| NO2 | ||||||
| 2005 | 4.96 | 46.7 | 1.42 | 0.0007 | 1.04 | 0.041 |
| 2006 | 6.46 | 60.9 | 1.93 | 0.0009 | 1.06 | 0.042 |
| 2007 | 5.24 | 49.4 | 3.68 | 0.002 | 2.10 | 0.082 |
| 2008 | 6.66 | 62.7 | 6.08 | 0.003 | 3.22 | 0.126 |
| 2009 | 6.94 | 65.4 | 7.11 | 0.003 | 3.95 | 0.155 |
| 2010 | 5.84 | 55.0 | 7.73 | 0.004 | 4.44 | 0.174 |
| 2011 | 5.09 | 48.0 | 18.8 | 0.009 | 10.8 | 0.422 |
| Average | 5.88 | 55.4 | 6.68 | 0.003 | 3.80 | 0.149 |
| CO | ||||||
| 2005 | 0.078 | 0.735 | 0.029 | 0.00001 | 0.153 | 0.006 |
| 2006 | 0.063 | 0.595 | 0.026 | 0.00001 | 0.122 | 0.005 |
| 2007 | 0.076 | 0.715 | 0.032 | 0.00002 | 0.138 | 0.005 |
| 2008 | 0.155 | 1.46 | 0.062 | 0.00003 | 0.266 | 0.010 |
| 2009 | 0.159 | 1.49 | 0.067 | 0.00003 | 0.287 | 0.011 |
| 2010 | 0.119 | 1.13 | 0.052 | 0.00003 | 0.219 | 0.009 |
| 2011 | 0.161 | 1.52 | 0.079 | 0.00004 | 0.287 | 0.011 |
| Average | 0.116 | 1.09 | 0.050 | 0.00002 | 0.210 | 0.008 |
Publisher’s Note: MDPI stays neutral with regard to jurisdictional claims in published maps and institutional affiliations. |
© 2021 by the author. Licensee MDPI, Basel, Switzerland. This article is an open access article distributed under the terms and conditions of the Creative Commons Attribution (CC BY) license (https://creativecommons.org/licenses/by/4.0/).
Share and Cite
Jones, B.A. Mountain Pine Beetle Impacts on Health through Lost Forest Air Pollutant Sinks. Forests 2021, 12, 1785. https://doi.org/10.3390/f12121785
Jones BA. Mountain Pine Beetle Impacts on Health through Lost Forest Air Pollutant Sinks. Forests. 2021; 12(12):1785. https://doi.org/10.3390/f12121785
Chicago/Turabian StyleJones, Benjamin A. 2021. "Mountain Pine Beetle Impacts on Health through Lost Forest Air Pollutant Sinks" Forests 12, no. 12: 1785. https://doi.org/10.3390/f12121785
APA StyleJones, B. A. (2021). Mountain Pine Beetle Impacts on Health through Lost Forest Air Pollutant Sinks. Forests, 12(12), 1785. https://doi.org/10.3390/f12121785