Article

Numerical Modelling of Moisture Loss during Controlled Drying of Marine Archaeological Wood

by
Gabriel Lipkowitz
1,*,
Karoline Sofie Hennum
2,3,
Eleonora Piva
4 and
Eleanor Schofield
3,*
1
Department of Mechanical Engineering, Stanford University, Stanford, CA 94305, USA
2
Department of Conservation, University of Oslo, Frederiks Gate 3, 0164 Oslo, Norway
3
Mary Rose Trust, 1.10 College Road, HM Naval Base, Portsmouth PO1 3LX, UK
4
School of Civil Engineering & Surveying, University of Portsmouth, Portland Building, Portsmouth PO1 3AH, UK
*
Authors to whom correspondence should be addressed.
Forests 2021, 12(12), 1662; https://doi.org/10.3390/f12121662
Submission received: 26 October 2021 / Revised: 23 November 2021 / Accepted: 24 November 2021 / Published: 30 November 2021
(This article belongs to the Special Issue Historical Wood: Structure, Properties and Conservation)

Abstract

:
If left to dry uncontrollably following excavation, marine archaeological wood suffers significant and irreparable damage. Conservation treatments are required to consolidate degraded wood and to remove residual water. Drying must be controlled to eliminate erratic and heterogeneous water removal. Monitoring and understanding the drying process progression is invaluable information to garner real-time knowledge to correlate with chemical and physical material properties, and to develop future conservation strategies. Here, polyethylene glycol (PEG) consolidated marine archaeological wood was periodically sampled during drying to determine the moisture content as a function of location, time, and sample depth. The heterogeneous nature of the material leads to significant noise across spatial and temporal measurements, making it challenging to elucidate meaningful conclusions from visual observation of the raw data. Therefore, the spatiotemporal data was computationally analysed to produce a representative model of the ship’s drying, illustrated by a dynamic simulation. From this we can quantitatively predict the drying rate, determine the depth-dependence of drying, and estimate the resulting equilibrium moisture content. This is the first time such simulations have been carried out on this material and conservation process, demonstrating the power of applying numerical modelling to further our understanding of complex heritage data.

1. Introduction

Prior to excavation, marine archaeological wood can experience chemical decay, cellulose hydrolysis and bacterial cellulose consumption [1]. Upon excavation, the wood’s capillaries and microcapillaries, both naturally occurring and due to degradation, are saturated with water [2,3,4]. If left to dry uncontrollably without prior consolidation to compensate for lost wood components, it will likely suffer from extensive dimensional changes that can cause severe structural collapse and irreparable damage [3]. To prevent this, marine archaeological wood often requires a carefully designed, and often bespoke, conservation treatment. Of particular concern are wooden shipwrecks, which due to their size and the interconnectivity and reliance of one timber on another for structural integrity, require a considered approach to their conservation. The absence of one, will lead to catastrophic failure.
One of the first waterlogged shipwrecks to undergo conservation was the Viking age Oseberg, which was surface-treated with linseed oil and creosote at the beginning of the 20th century [4]. In April 1962, the Swedish Warship Vasa in Stockholm was the first larger shipwreck to be sprayed with a different chemical, polyethylene glycol (PEG). It has subsequently become a popular consolidation treatment and has been used for conserving the Skuldelev Viking ships in Denmark, the Bremen cog in Germany [5] and Tudor warship Mary Rose [6]. However, the conservation treatment of marine archaeological wood is not complete until it has been dried to remove any residual water, usually by freezing-drying [7], or controlled air-drying [8]. The drying method selected is usually dictated by the item’s size and ability to fit within a freeze dryer as a whole, or the ease of dismantling the structure.
During air-drying, it is essential to carefully monitor the progression of water removal to prevent the wood from drying too quickly. If allowed to happen, this can cause shrinkage, fracture, and collapse. Equally, upon reaching an equilibrium moisture content, and when the drying is considered complete, the monitoring of such structures must continue. Adsorption, and desorption, is a constant concern due to its effect on weight and subsequent impact on the structural stability. This is highlighted by ongoing efforts to monitor and understand structural movement at Vasa [9,10,11], Mary Rose [12] and Bremen Cog [13].
The Mary Rose sank during the Battle of the Solent in 1545, and remained submerged for 437 years, until the remaining starboard side was excavated in 1982 [14]. The Mary Rose comprises species including oak, poplar, and pine. However, the vast majority is oak, and all the samples used in this study were this type of wood. For twelve years following its salvage, the Mary Rose was sprayed with fresh water as a temporary measure, to prevent the shipwreck drying out and to reduce bacterial activity [3]. For ten years thereafter, it was sprayed with PEG-200, until the solution concentration reached 40% w/v, and for the remaining nine years it was sprayed with PEG-2000, until the solution concentration reached 60% w/v. For drying thereafter, common methods such as atmospheric pressure freeze drying and vacuum freeze drying, the latter being used for smaller artefacts, were not possible for the Mary Rose, due to its size and reluctance to disassemble the structure. Therefore, controlled air drying was chosen, with temperature, relative humidity, air velocity and light levels in a sealed enclosure tightly monitored. This ensured that we minimised the possibility of shrinking or cracking and differential drying rates, which would likely result in damage.
In 2013, air-drying of the hull began, following computational fluid dynamics (CFD) modelling of air flow around the hull, and carefully positioned air ducts were placed to deliver the appropriate air, in terms of velocity, relative humidity and temperature. The entire ship was subjected to the same air relative humidity of 54% RH ± 4% and temperature of 18 and 20 ± 1 °C, kept in controlled light levels [12,15]. The entire ship was subjected to this same air relative humidity, temperature, and velocity during drying and even to this day whilst on display.
The drying of the Mary Rose offered an unprecedented opportunity to understand, real-time, the drying process of a large salvaged shipwreck following a consolidation treatment. Determining the moisture content of archaeological wood can be used to assess the degradation levels of marine archaeological wood prior to any consolidation treatment (maximum moisture content, MCM%) or to monitor and determine the drying rates following consolidation treatment (moisture content, MC%) [16]. The MCM% values for a variety of Mary Rose woods are documented in [15]. In the case of the Mary Rose moisture content data was also gathered to monitor the progression of the drying of the hull, post consolidation. While there are many ways to measure moisture content, such as with a resistance meter or by monitoring shrinkage by inserting pins or nails into the surface of the wood [17], a gravimetric method was used. To that end, throughout the drying process from 2013 to 2017 samples were taken periodically at representative locations around the hull, from which moisture content was determined.
The moisture content data were qualitatively analysed [18] as the process progressed, which offered general observations of how the wood was drying. However, this analysis lacked detail in terms of correlating different areas of the ship, different time stamps, and how the drying was progressing into the depth of the timbers. This was due to the heterogeneity of the data, often encountered with complex heritage materials, and the associated noise observed. This meant that whilst the data could be used to look simply at how much water had been removed, it was impossible to recognise trends, and furthermore impossible to correlate the data with other measurable processes which are impacted by the level of moisture present, e.g., chemical changes [19,20] and physical movement [20].
To clarify trends through such noise, many scientific fields make successful use of mathematical modelling. Here, mathematical formulae, often implemented in computational models, were employed to optimally describe the observed data. Functions were selected to fit the data, and thus mitigate the influence of outliers, while at the same time having the smallest deviations from the real-world data. The aim was to produce a predictive quantitative model, taking advantage of the spatially and temporally comprehensive, albeit noisy, moisture content data collected real-time from the Mary Rose. Thus, identifying genuine drying patterns in conserved marine archaeological wood, and allowing a more comprehensive understanding of the drying process itself, which in turn can be correlated with observed chemical and physical changes.

2. Materials and Methods

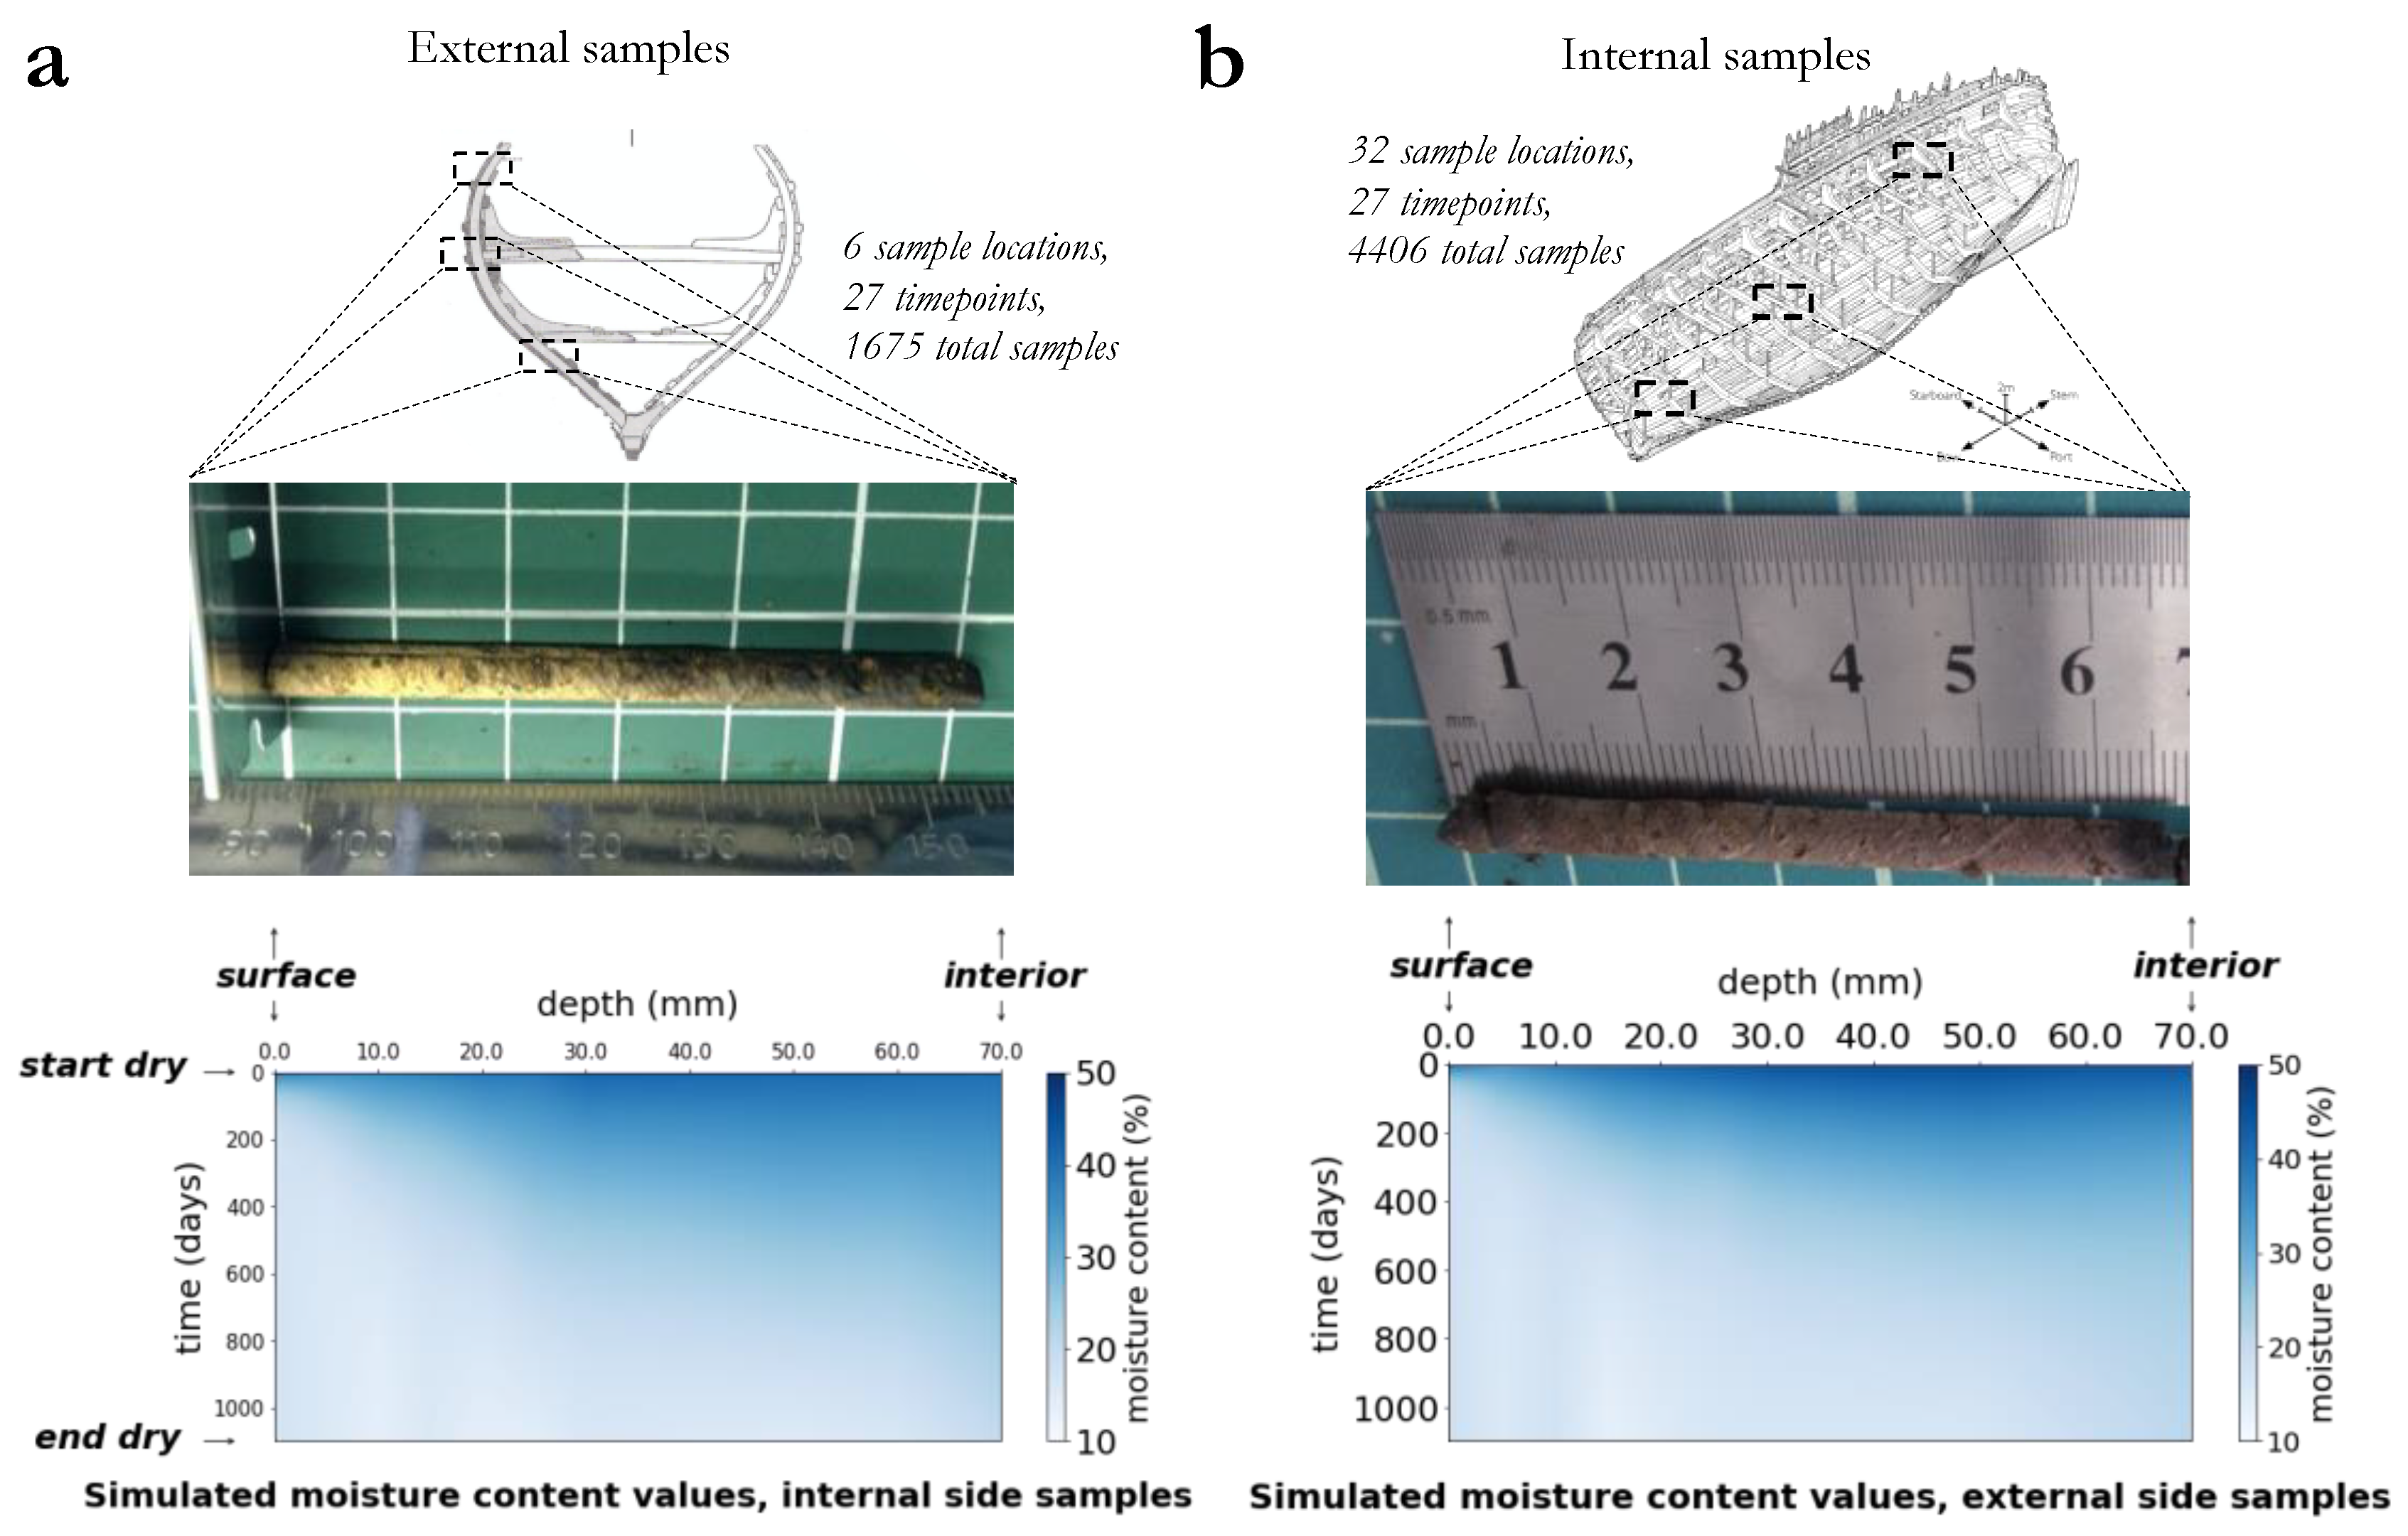
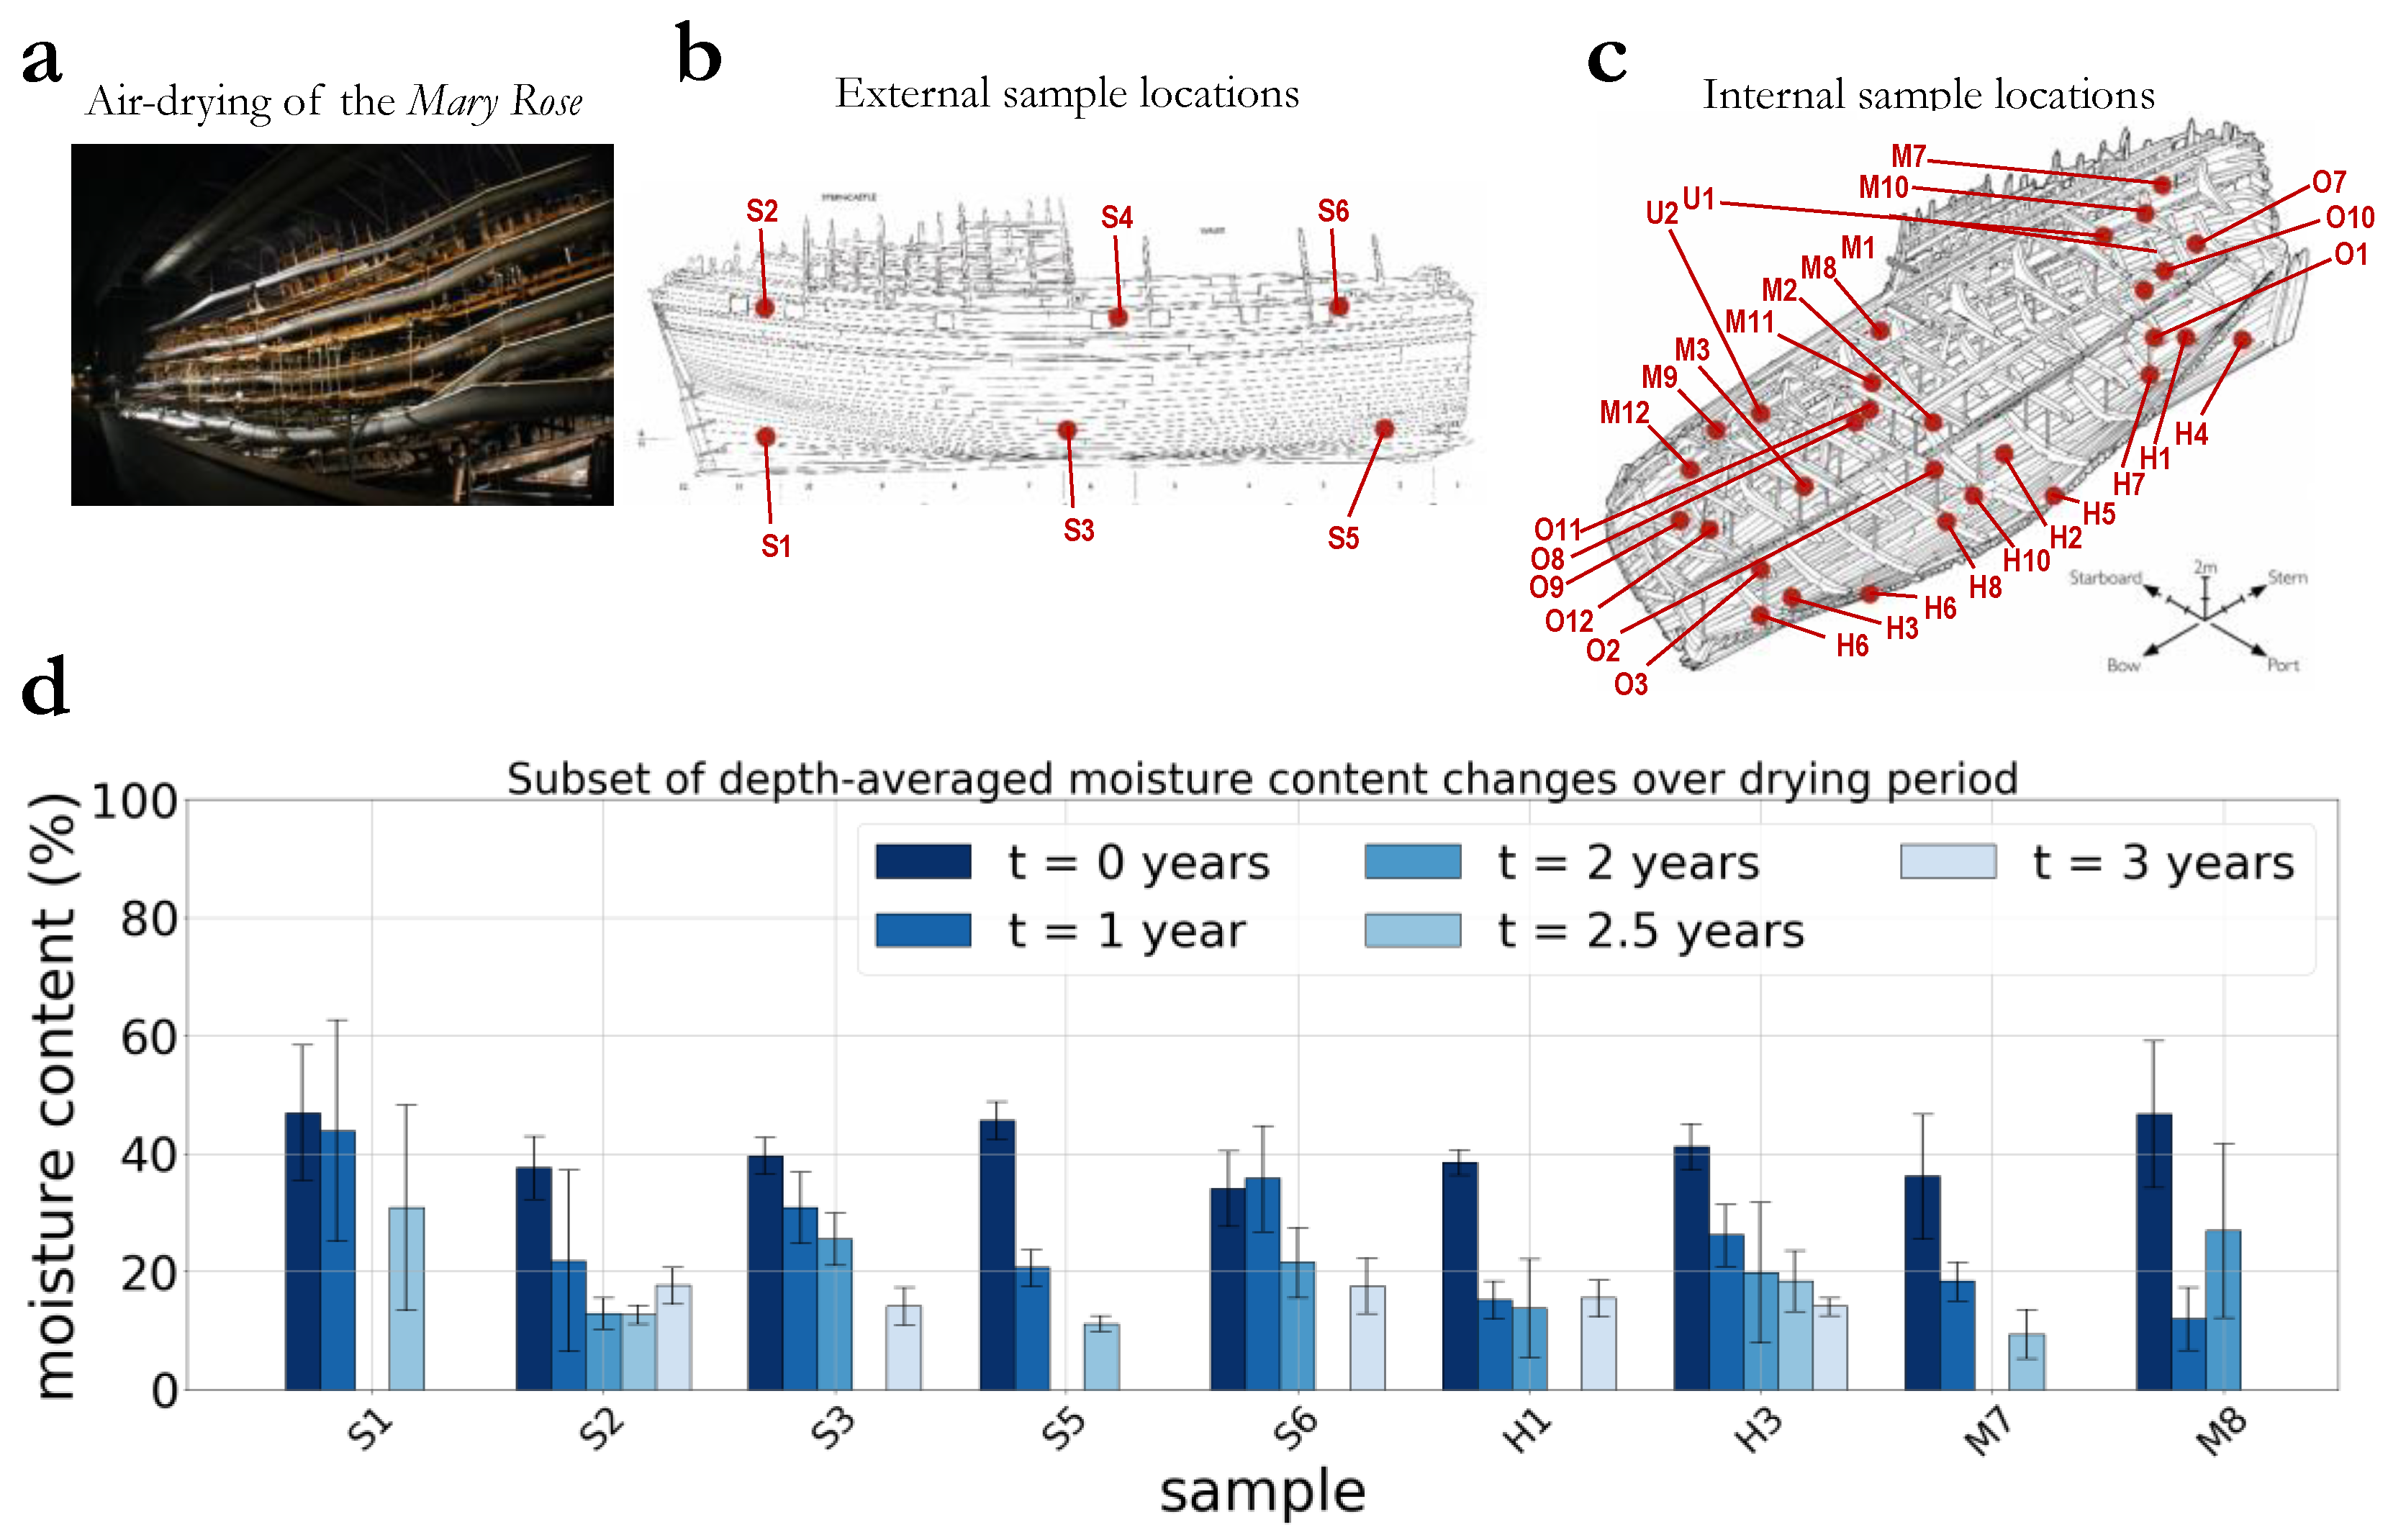
2.1. Observational Measurements

During controlled air-drying of the Mary Rose (Figure 1a), moisture content changes were recorded periodically until 1092 days had passed. This time stamp represented significant moisture loss and an associated difficulty in removing samples from the hull. Core samples were retrieved using an incremental borer from locations chosen to give a representation of the entire hull (Figure 1b,c). Sample codes indicate the level of the ship from which cores were taken, e.g., Hold (H), Orlop (O), Main (M) and Upper (U), which represents the ascending order from the base of the ship. Cores were sectioned every 5 mm up to a depth of 30 and 10 mm thereafter. This process was completed more frequently in the initial changes, in order to capture when the most significant moisture loss was expected to happen. A gravimetric method was used to determine the moisture content [18], using the following formula:
M = m w e t m d r y m d r y × 100
where M is moisture content percent, mwet the mass of the wet sample, and mdry the mass of the oven-dried sample (24 h drying at 100 °C).

2.2. Computational Modelling

Moisture content data from the Mary Rose was numerically analysed using a custom script written in Python, to take advantage of that language’s in-built function libraries for data analysis and plotting (pandas and matplotlib, respectively). To fit the theoretical moisture content model to the observational data collected from both the internal and external samples, an exponential decay function was used:
M d ( t ) = a e b t + c
where Md is moisture content (%) at depth d (mm), t is time (days), and a, b, and c are model-fitted constants. Differentiated with respect to time, this produces the simple ordinary differential equation (ODE) describing the rate of change of drying as:
d M d ( t ) d t = a b e b t
The optimal selection of the parameters a, b, and c was accomplished using the curve fitting capabilities of Python SciPy library, which takes as input the aforementioned inverse exponential with three parameters, along with data, here Mary Rose moisture content measurements, and outputs parameter values, here, a, b, and c, which minimise the sum of the squared residuals between the curve and data for that location in the ship, expressed as:
a d * , b d * , c d * = argmin a , b , c k = 0 n s t = 0 t m a x ( ( a e b t + c ) M d k , t )
where a d * , b d * , and c d * are the optimized parameters for the function describing drying at depth d; ns is the total number of sample measurements for depth d; t is time in days; tmax is the maximum timepoint; and M d k , t is the moisture content value measurement at location k and at time t, for depth d.
To produce a holistic simulation of the drying process (i.e., estimate moisture content values for every day, at all depths from 0 to 70 mm deep in the ship), moisture content values at 0.1 mm depth intervals were inferred by linear interpolation between model estimates at those 5 or 10 mm intervals where measurements were taken, for every day during the drying process.

3. Results and Discussion

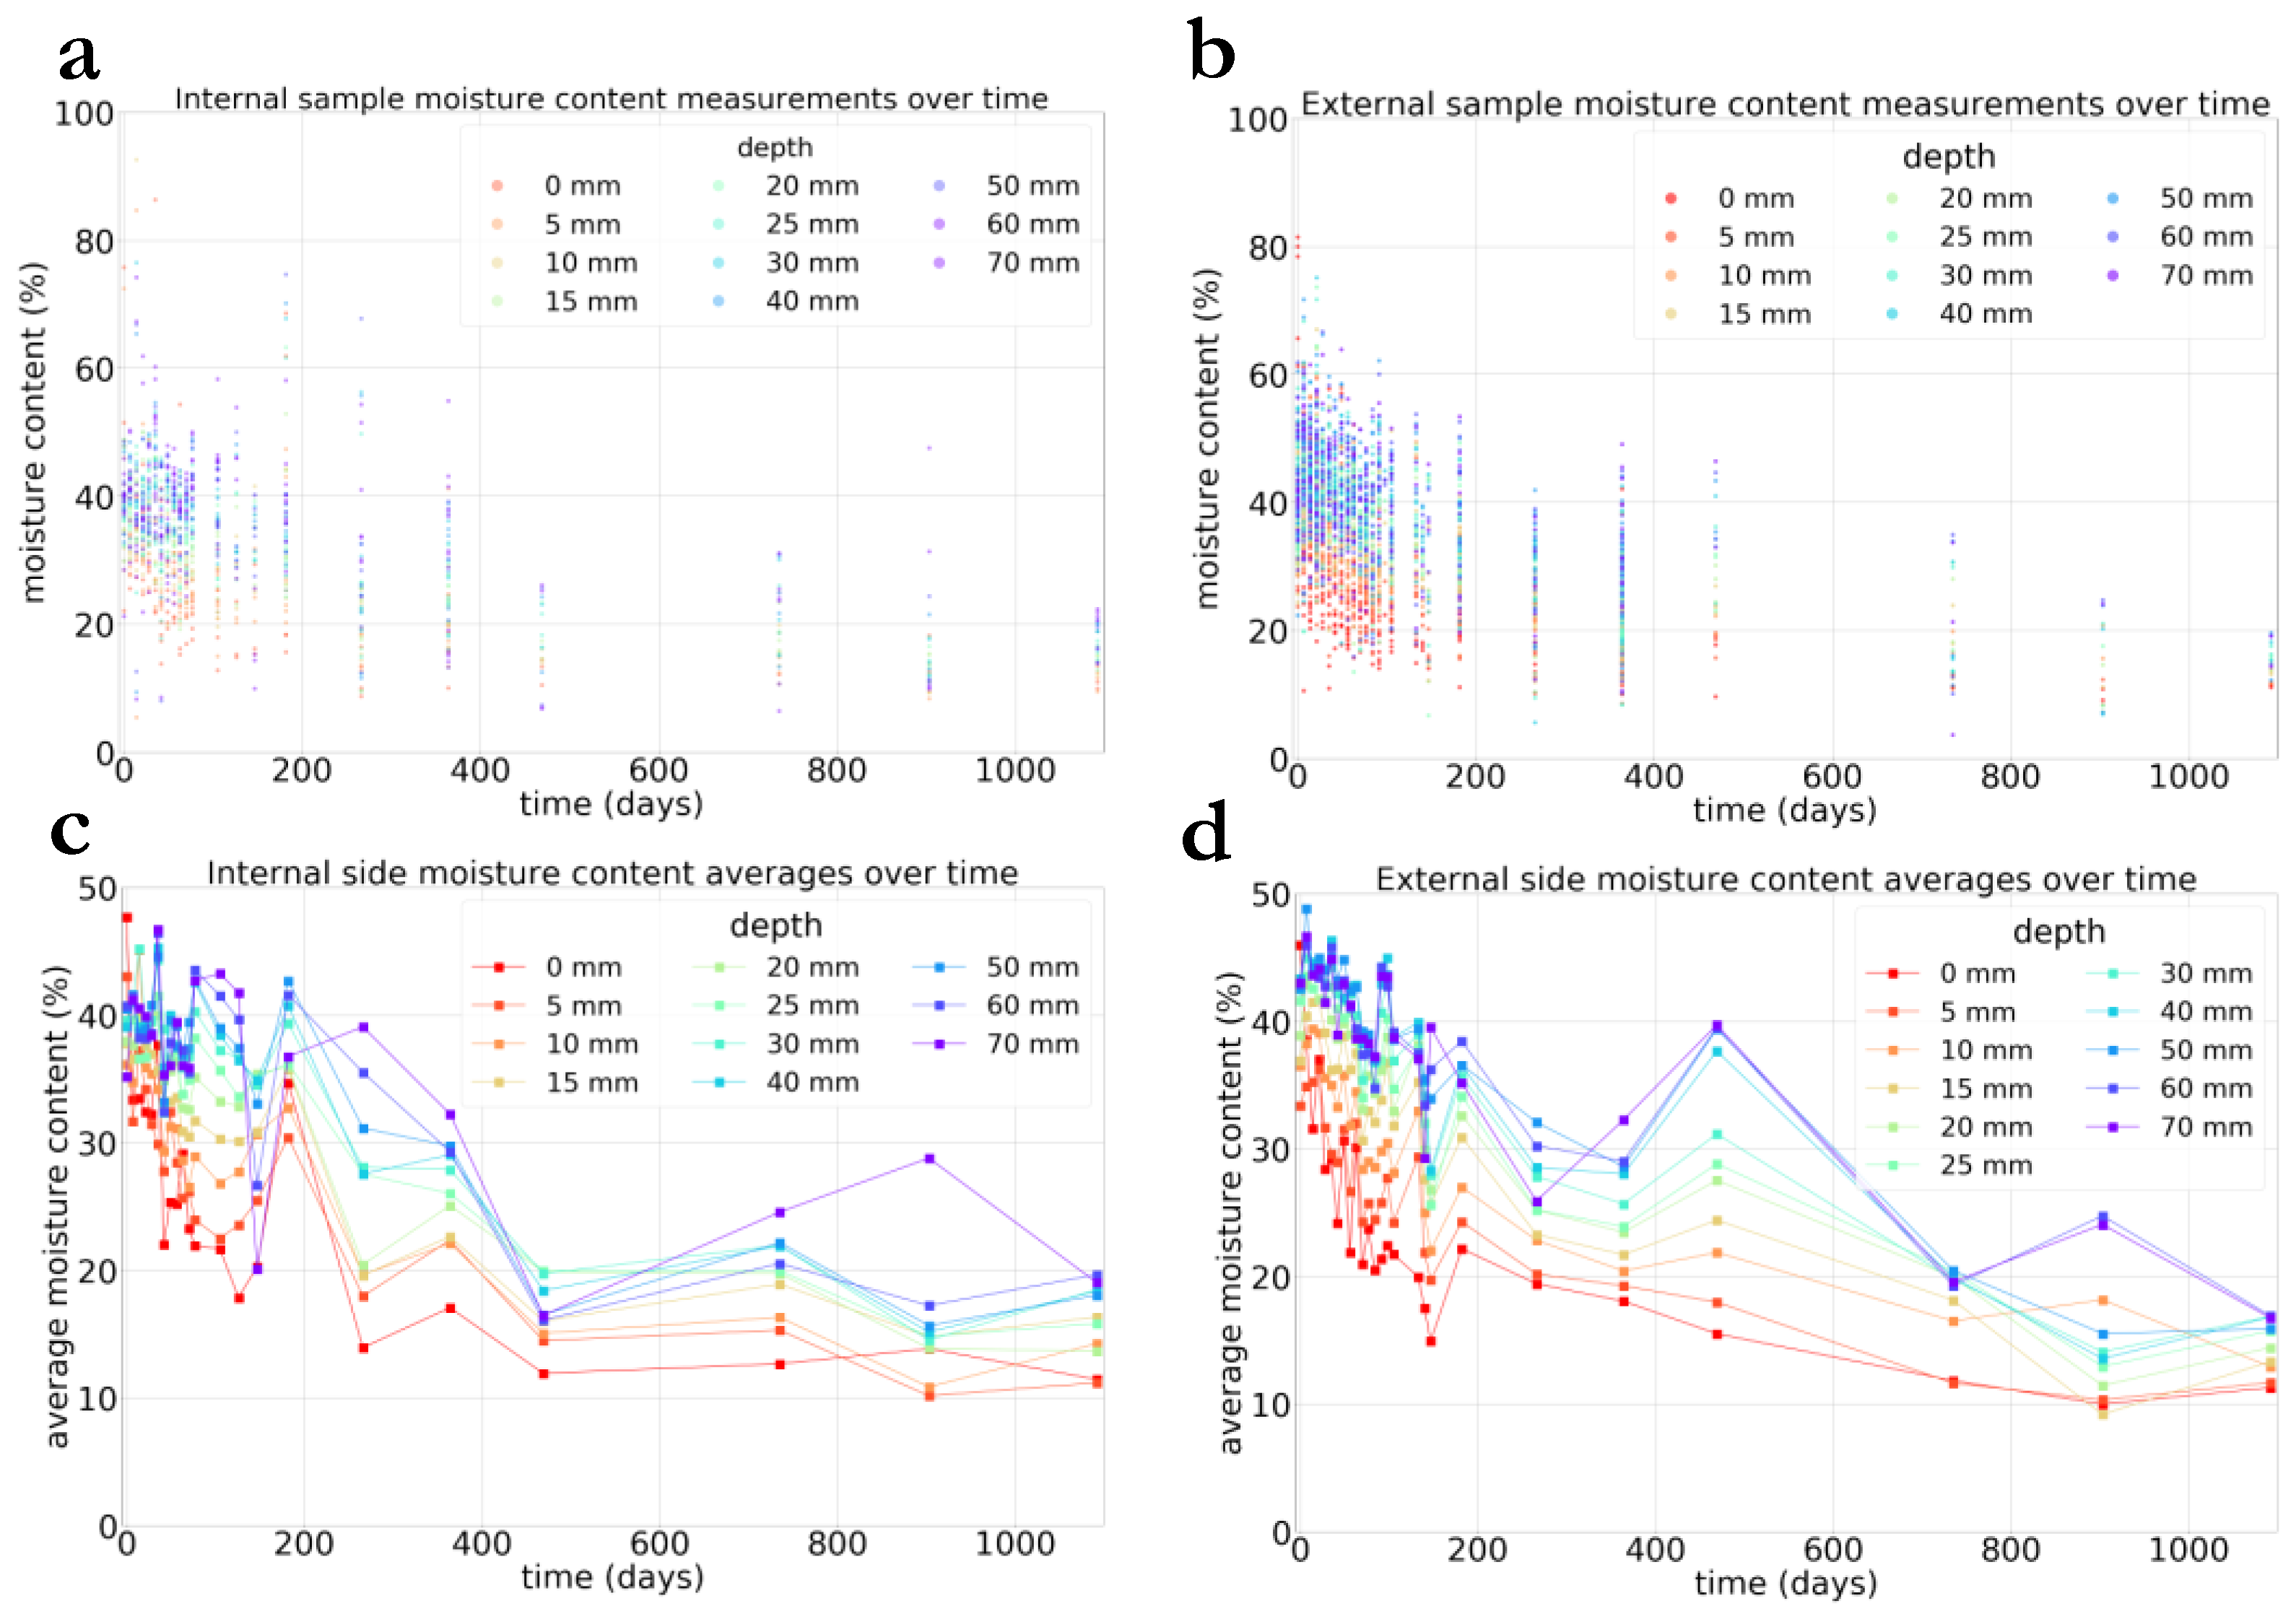
3.1. Raw Data Describing the Drying of the Mary Rose

A summary of the moisture content measurements taken at a representative sample of locations is shown in Figure 1d. The time stamp t = 0 years indicates the starting point of the drying process. Across all sample locations, and over all depths, at the onset of drying the average moisture content ranged between 37% and 52%, with a global average of 41% and a standard deviation of 5%. After 4 years of drying, the average moisture content ranged between 11% and 38% across sample locations, with a global average of 23% (i.e., approximately half that at the beginning of drying) and a standard deviation of 8%. Overall, these demonstrate that significant drying of the ship did indeed occur over the period, and in the set environmental conditions, as expected [21].
These averages, however, mask significant variability in the data. Some samples showed overall markedly lower moisture content levels during the entire drying process. For instance, core samples M7, M8 and M9, retrieved from internal side planks on the main deck, from the stern end, centre, and bow end, respectively, never had a moisture content above 30%. By contrast, the core sample O7, also retrieved from internal side planks but from the orlop deck below, showed significantly higher moisture content values, over 40%, during the drying period. There was not only significant variation in absolute moisture content values; there was also substantial variability in their changes over time. The overall drop of moisture content for depth-averaged samples ranged between 4 and 34%. For instance, core samples H4 and M12 only saw an average drop of moisture content of approximately 4%, whereas core samples S3, S5, H9, O7, and M7 saw a drop of moisture content higher than 25%.
Similar trends, but with similarly high variability, were observed when moisture contents at varying depths were averaged over all sample locations. Here, analysis was limited to depths up to 70 mm, as beyond that point the wood was visually observed to be of a qualitatively different, and better, preservation state. The raw data (Figure 2a,b) do suggest differences in the drying process by depth, with shallower samples appearing to dry more quickly than deeper ones. In Figure 2c,d, averages from the same raw data suggest the depth-dependence of drying; once again, though, there is great variability. As one example, at day 135 of drying MC% appears to drop precipitously across sample locations, followed by an equally rapid recovery by the next timepoint.
It is important to note that this variability in the raw data is not necessarily surprising, for a number of reasons. Fresh wood itself is a highly heterogeneous material, varying significantly throughout its structure depending on factors such as the degree of cell wall decomposition [22]. Adding to this natural variation is the heterogeneity of degradation in marine archaeological wood before treatment, with the outer wooden layers of the hull less well-preserved than the drier inner layers. Previous studies determined the basic density of the inner parts of the Mary Rose wood to be 0.67 g/cm3 (using the formula R = Wdry/Vwat, where Wdry is the weight of sample after oven drying, and Vwar is the volume of waterlogged sample) which is comparable to values obtained for fresh wood. However, when looking at the degradation across a sample, moisture content was shown to vary drastically indicating a range of degradation, with a preserved inner core and degraded outer area [23]. Any subsequent variation in their conservation treatment could also have introduced further variability. As the Mary Rose had to be sprayed with PEG, rather than immersed in PEG baths, penetration will have differed throughout the wood structure, where different orientations of timbers are exposed. It is also expected that the higher grade PEG is concentrated closer to the surfaces than in the inner layers [15]. Finally, the potentially non-negligible weight of PEG itself, likely distributed heterogeneously throughout the samples, could have exacerbated the widespread in the raw data, given moisture content measurements were obtained using a gravimetric approach as described above. All these factors, and others, contribute to the observed spread in the moisture content measurements, and corroborate findings at Vasa, where drying patterns were found to be dependent on the temperature, relative humidity and the nature of the PEG impregnation [24].
While to a certain degree unavoidable, this variation does make determining drying rates and predicting the kinetics of drying from just the raw data difficult, if not impossible. For instance, the seemingly simple question of how quickly the waterlogged archaeological wood dried would be answered differently depending upon which sample in the dataset is considered; one starboard sample, S1, suggests that barely any drying occurs in the first year, whereas a different starboard sample, S5, indicates that >50% drying occurred in that time. One common, simple way of seeing trends through noisy data is through averaging, but as the above analysis makes clear, even multiple different averaging techniques do not yield reliable or useful trends.

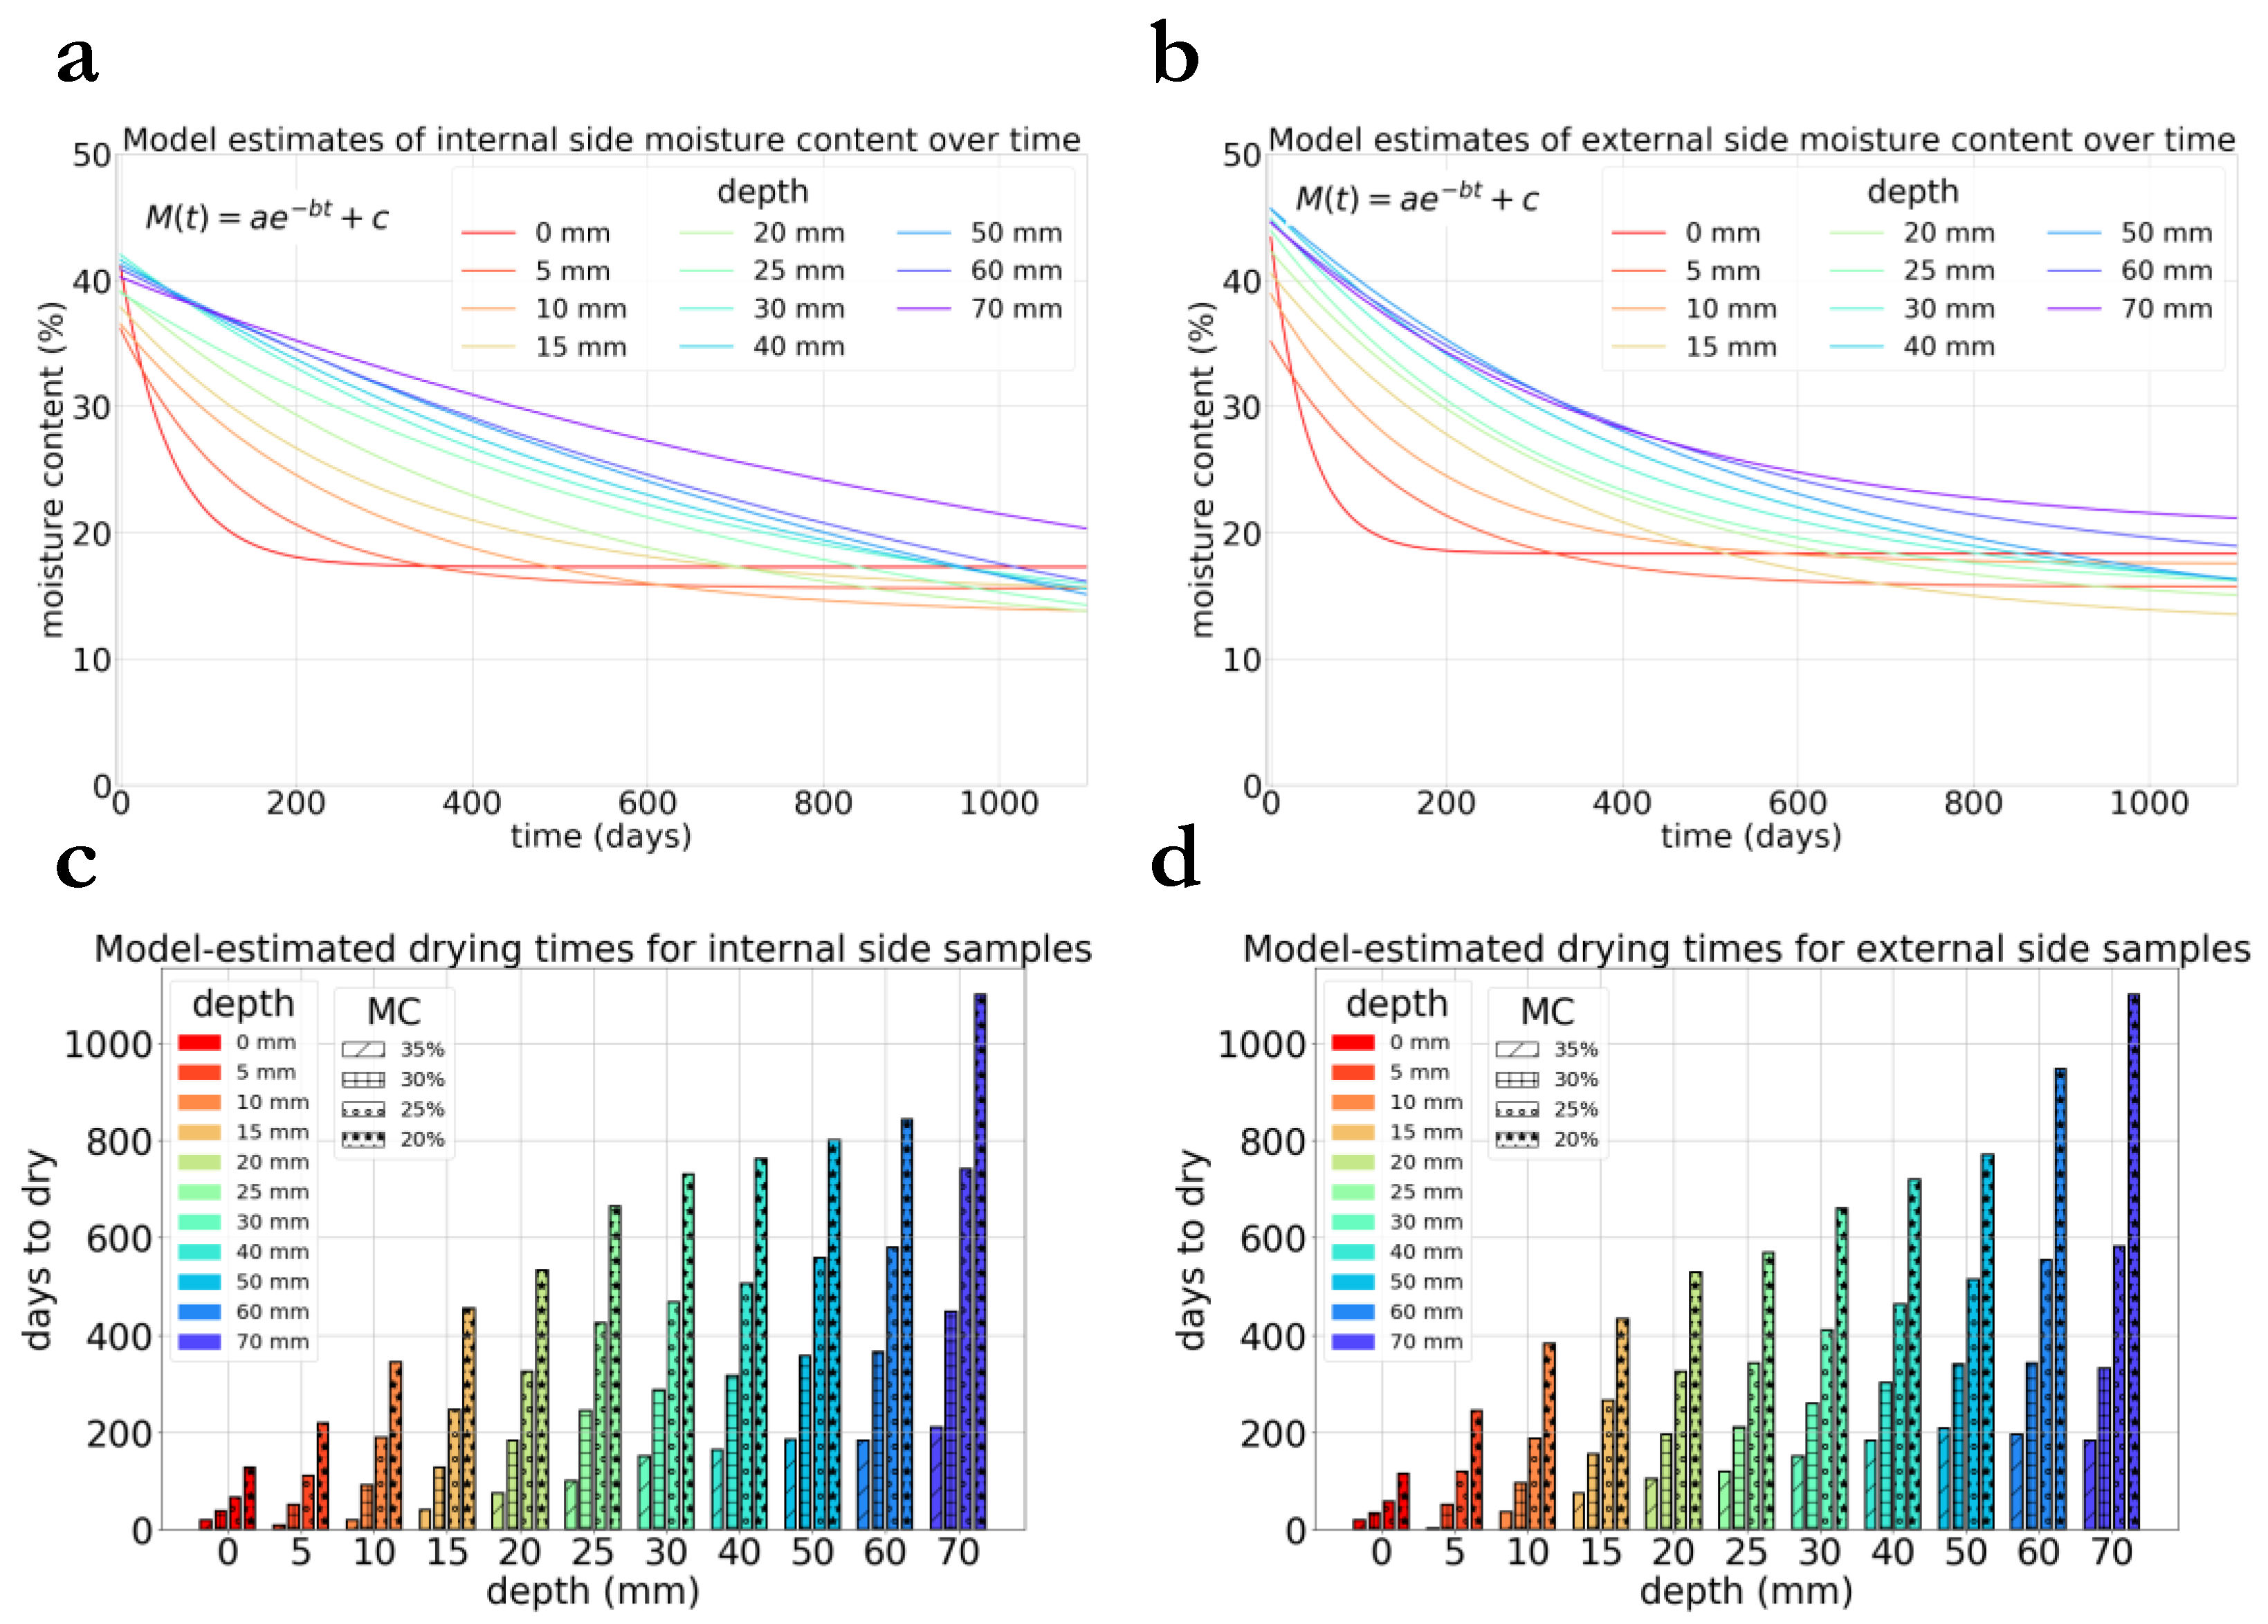
3.2. Numerical Modelling of the Drying of the Mary Rose

To overcome this analytical hurdle, a computational model was implemented to predict wood drying kinetics. The results of the numerical modelling are shown in Figure 3a,b. Despite the significant noise present in the raw data described above, this modelling successfully yielded mathematical functions that revealed a clear and consistent trend: for each sample depth, an inverse exponential drying rate over time. Such a drying curve is not unexpected for marine archaeological wood; indeed, small (1 cm3) specimens of PEG consolidated Mary Rose wood which were air dried to determine the optimal drying conditions for the hull structure, were found to display similar exponential decay [15]. Notably in the present study, however, in situ data on the drying process was collected not only for surface samples, but for deeper ones too, differences between which this modelling revealed with great clarity. Surface samples consistently displayed the sharpest exponential decay in moisture content, and earliest on, whereas deeper samples display much shallower decays, and later on. Notably, this trend was remarkably consistent; every incremental increase in sample depths brought an incrementally slower drying time.
The most intuitive explanation for the more rapid drying of surface samples is their higher degree of atmospheric exposure; indeed, these results accord well with recent reports that kinetically studied the drying of marine archaeological wood using sorption isotherms, which revealed extremely rapid evaporation and geometric distortion even at high environmental relative humidity levels [25]. Others have noted that under high humidity, marine archaeological wood can leach PEG from the surface [15], which may also help explain these differential drying rates compared with the interior. Another potential explanation may stem from the spatially inhomogeneous distribution of different molecular weight PEG in the waterlogged wood. It has been observed that in such a 2-step treatment, lower molecular weight PEG impregnates firmly in the better-preserved interior, whereas higher molecular weight PEG remains limited to the more degraded outer surfaces [26]. As this is the case for the Mary Rose, with the interiors more stably impregnated by PEG-200 than the exterior surfaces, this could also exacerbate the differences in drying time. In short, the more rapid drying of the Mary Rose surface samples is not entirely unexpected, taking into account the fundamental chemical investigations of similar samples carried out previously.
These depth-dependent drying trends clarified by the model were quantified as drying time estimates in Figure 3c,d, which were obtained directly from the curves in Figure 3a,b. These quantitatively describe how much more quickly our model predicts that samples closer to the surface dry compared with deeper samples. A sample 50 mm deep, for instance, is predicted to dry to half its original moisture content (to ~20%), in about two years. Surface samples, on the other hand, are predicted to take less than half a year to dry to that level. In general, these drying times exceeded those found for small Mary Rose samples in the aforementioned study; in that instance 1 cm3 samples treated with PEG 200/1500 took on the order of 10 days to dry to a new moisture content of half its original point, whereas surface samples obtained in situ in this study required on the order of 100 days to do so, and deeper samples even longer. This is not surprising though, and in fact may be expected, due to scale differences: whereas the previous study examined samples with a depth of 1 cm, this in situ study considers those with 10 cm depths.
To further clarify these moisture content trends suggested by the modelling in Figure 3, a dynamic, temporal simulation was produced estimating how the moisture content of the Mary Rose changed at all depths, and at all times. These model estimates were based on those measured moisture content values at select depths and timepoints, as shown in Figure 2a,b, and the mathematical and computational details of how this simulation was achieved are described in the Supplementary Materials. The results of this further modelling are described statically in Figure 4, while the simulation can be viewed dynamically as Supplementary Figure S1 and Video S1.
At the start of drying, the model predicts that all samples have roughly the same moisture content, as expected, of around 40%; in the simulation space, this is indicated by dark blue at all depths for the initial timepoint. The first samples to dry (reflected by simulation space colour lightening) are the shallowest, and the region of most rapid drying can be seen to migrate through the wood depth at a rate of approximately 75 nanometres per day, or about 30 millimetres per year. In the simulation space, this is the slope of the line describing the boundary where the change in moisture content in the sample is steepest; physically, this can be interpreted as the estimated water particle velocity in the waterlogged archaeological wood during the drying process. Eventually, between two and three years after drying starts, the model predicts that a rough new equilibrium is reached, with consistently lower moisture content values throughout the wood samples.
Three major lessons can be learned from this study’s analysis of the moisture content changes undergone in the Mary Rose throughout its air-drying following PEG treatment. First, this study presents the first quantitative verification of the two-step PEG treatment approach for marine archaeological wood. In the past, it has been theorised that by first immersing marine archaeological wood in a low molecular weight PEG (MW = 200), and then in a higher molecular weight PEG (MW = 2000), all sections of the wood are successfully impregnated; thus, moisture loss should occur evenly without major structural damage. The observational results presented here, understood with the aid of novel computational modelling approaches, provide perhaps the first empirical validation of this mechanistic theory, further suggesting it as a standard conservation treatment for marine archaeological wood.
A second lesson from the study is that this drying process with such consolidants can in fact be accurately predicted. This has been a notoriously difficult process to predict, using even the most advanced experimental techniques. Some recent studies have attempted to predict the spatial diffusion of polymer consolidants like PEG in waterlogged archaeological wood using methods such as in situ Raman spectroscopy, but these have struggled to identify consistent patterns, perhaps not surprisingly given the aforementioned heterogeneity of the material [27]. This study suggests, however, that with the use of computational modelling, it may not be strictly necessary to do so to reveal consistent drying trends over time. PEG may be distributed stochastically throughout the wood structure, but this study’s empirically validated models still show that drying in the aggregate follows a predictable course.
The trajectory this course of drying takes is a final important lesson from the study. Namely, while the predictions it makes—that moisture loss occurs first, and most rapidly, at the surface, with drying of the deeper layers occurring later, and more slowly—may seem intuitive, it is important to emphasise that this mechanism need not necessarily be the case. After all, many alternative drying scenarios for marine archaeological wood may take place; for instance, only drying of the surface could have occurred, or drying could have occurred simultaneously for all depths. Only with the data and modelling presented in this study can these alternative scenarios be disproven, and it be shown that the entire wood sample dries, and in a diffusive manner at that. Additionally, it is only with this information that we can start to correlate the drying process to other observed changes in the wood. For instance, the evolution of sulphur deposits as a function of drying time and depth into the wood have been observed alongside quantifying the resulting wood degradation, via a combination of synchrotron-based (XANES and XRF imaging) and analytical techniques (FTIR and XRF elemental line scans) [28]. Further, chemical and physical data exists that can now be systematically analysed against these new, clear findings on the moisture removal from the wood, to give a clear oversight of the current status of the wood and ship structure as a whole.

4. Conclusions

This study presents moisture content data collected from a wide range of locations on the Mary Rose over three years of its controlled drying, and a computational model, built from those data, to describe the drying of consolidated marine archaeological wood generally. In doing so, it helps to explain the notoriously difficult drying behaviour of consolidated and dried marine archaeological wood, a heterogeneous material where sharp transitions exist between preserved and degraded areas in the timber. The Mary Rose was no exception; while its timber was impregnated with PEG to help stabilise the wood, there were high variations in moisture content in the wood, which affected the drying rates. As such, it would have been very difficult, if not impossible, to predict how quickly different regions and depths of marine archaeological wood will dry, without data, and modelling. This study, the first empirical and computational analysis of its kind, addresses that difficulty by using longitudinal data over multiple depths and locations. The numerical model was verified against real world moisture content data, and good agreement was found between the two. This provides knowledge on the material state at select time intervals, which now can be correlated to other associated datasets such as physical movement and chemical changes, thereby developing a deeper understanding of this unique piece of cultural heritage. Only by gathering and correlating all this data can the status be understood, and appropriate strategies be developed to safeguard it for years to come.

Supplementary Materials

The following are available online at https://www.mdpi.com/article/10.3390/f12121662/s1, Table S1, Location of all core samples. Figure S1, Dynamic drying simulation. Video S1, Moisture Content over time for depths 0–90 mm.

Author Contributions

Conceptualization, E.S. and G.L.; methodology, E.S., G.L., E.P. and K.S.H.; formal analysis, G.L. and E.S.; investigation, E.S., G.L., E.P., K.S.H.; data curation, E.S., G.L. and K.S.H.; writing—original draft preparation, E.S., G.L. and K.S.H.; writing—review and editing, E.S., G.L. and K.S.H.; supervision, E.S. All authors have read and agreed to the published version of the manuscript.

Funding

This research received no external funding.

Institutional Review Board Statement

Not applicable.

Informed Consent Statement

Not applicable.

Data Availability Statement

Not applicable.

Acknowledgments

The authors thank the Mary Rose Trust conservation and maintenance teams for collecting samples from the hull for analysis. The authors would like to thank David Begg, Nikos Nanos and Susan Braovac for their input to this study and useful discussions. Eleonora Piva thanks the Mary Rose Trust for funding at the University of Portsmouth. Karoline Sofie Hennum thanks Erasmus+ for sponsoring her placement with the Mary Rose Trust. Gabriel Lipkowitz thanks the US/UK Fulbright Commission for supporting his studies at Imperial College London.

Conflicts of Interest

The authors declare no conflict of interest.

References

  1. Caple, C. Conservation Skills–Judgement, Method and Decision Making; Routledge: Abingdon, UK, 2000. [Google Scholar]
  2. Grattan, D.W. Waterlogged Wood. In Conservation of Marine Archaeological Objects; Pearson, C., Ed.; Butterworths Heinemann: Oxford, UK, 1987. [Google Scholar]
  3. Florian, M.E. Scope and History of Archaeological Wood. In Archaeological Wood–Properties, Chemistry and Preservation; Advances in Chemistry Series; American Chemical Society: Washington, DC, USA, 1990; Volume 225. [Google Scholar]
  4. Rosenqvist, A.M. The Stabilizing of Wood Found in the Viking Ship of Oseberg: Part I. Stud. Conserv. 1959, 4, 13–22. [Google Scholar] [CrossRef]
  5. Hoffmann, P. To Be and to Continue Being a Cog: The Conservation of the Bremen Cog of 1380. Int. J. Naut. Archaeol. 2001, 30, 129–140. [Google Scholar] [CrossRef]
  6. Jones, M.A. For Future Generations: Conservation of a Tudor Maritime Collection; Mary Rose Trust: Portsmouth, UK, 2011; ISBN 1-78570-155-X. [Google Scholar]
  7. Ambrose, W.R. Application of Freeze-Drying to Archaeological Wood. In Archaeological Wood–Properties, Chemistry and Preservation; Advances in Chemistry Series; Rowell, R.M., Barbou, R.J., Eds.; American Chemical Society: Washington, DC, USA, 1990; Volume 225. [Google Scholar]
  8. Håfors, B. Conservation of the Swedish Warship Vasa from 1628; The Vasa Museum: Stockholm, Sweden, 2000. [Google Scholar]
  9. Vorobyev, A.; Almkvist, G.; van Dijk, N.P.; Gamstedt, E.K. Relations of Density, Polyethylene Glycol Treatment and Moisture Content with Stiffness Properties of Vasa Oak Samples. Holzforschung 2017, 71, 327–335. [Google Scholar] [CrossRef]
  10. Vorobyev, A.; van Dijk, N.P.; Kristofer Gamstedt, E. Orthotropic Creep in Polyethylene Glycol Impregnated Archaeological Oak from the Vasa Ship: Results of Creep Experiments in a Museum-like Climate. Mech. Time-Depend. Mater. 2019, 23, 35–52. [Google Scholar] [CrossRef] [Green Version]
  11. van Dijk, N.P.; Gamstedt, E.K.; Bjurhager, I. Monitoring Archaeological Wooden Structures: Non-Contact Measurement Systems and Interpretation as Average Strain Fields. J. Cult. Herit. 2016, 17, 102–113. [Google Scholar] [CrossRef]
  12. Schofield, E.J.; McConnachie, G.; Jones, M. Air Drying of the Mary Rose Hull; ICOM-CC: Paris, France, 2013. [Google Scholar]
  13. Hoffmann, P. On the Long-Term Visco-Elastic Behaviour of Polyethylene Glycol (PEG) Impregnated Archaeological Oak Wood. Holzforschung 2010, 64, 725–728. [Google Scholar] [CrossRef]
  14. Marsden, P. Understanding the Mary Rose. In Mary Rose: Your Noblest Shippe. Anatomy of a Tudor Warship; Mary Rose Trust: Portsmouth, UK, 2009; Volume 2, ISBN 0-9544029-2-8. [Google Scholar]
  15. McConnachie, G. Air Drying Behaviour of Waterlogged Archaeological Woods from the Tudor Warship Mary Rose. Ph.D. Thesis, University of Portsmouth, Portsmouth, UK, 2005. [Google Scholar]
  16. Macchioni, N.; Pecoraro, E.; Pizzo, B. The Measurement of Maximum Water Content (MWC) on Waterlogged Archaeological Wood: A Comparison between Three Different Methodologies. J. Cult. Herit. 2018, 30, 51–56. [Google Scholar] [CrossRef]
  17. Håfors, B.; Persson, U. Monitoring Changes in Water Content of the Vasa Wood with a Resistance Meter. In Proceedings of the 6th ICOM Group on Wet Organic Archaeological Materials Conference, York, UK, 9–13 September 1996; Schiffahrtsmuseum: Bremerhaven, Germany, 1997; pp. 35–45. [Google Scholar]
  18. Piva, E. Conservation of a Tudor Warship: Investigating the Timbers of the Mary Rose; Mary Rose Trust: Portsmouth, UK, 2017. [Google Scholar]
  19. Schofield, E.J. Illuminating the Past: X-ray Analysis of Our Cultural Heritage. Nat. Rev. Mater. 2018, 3, 285–287. [Google Scholar] [CrossRef]
  20. Piva, E. Structural Conservation of the Tudor Warship Mary Rose. Ph.D. Thesis, University of Portsmouth, Portsmouth, UK, 2017. [Google Scholar]
  21. Hocker, E.; Almkvist, G.; Sahlstedt, M. The Vasa Experience with Polyethylene Glycol: A Conservator’s Perspective. J. Cult. Herit. 2012, 13, S175–S182. [Google Scholar] [CrossRef]
  22. Babiński, L.; Izdebska-Mucha, D.; Waliszewska, B. Evaluation of the State of Preservation of Waterlogged Archaeological Wood Based on Its Physical Properties: Basic Density vs. Wood Substance Density. J. Archaeol. Sci. 2014, 46, 372–383. [Google Scholar] [CrossRef] [Green Version]
  23. McConnachie, G. A Re-Evaluation of the Use of Maximum Moisture Content Data for Assessing the Condition of Waterlogged Archaeological Wood. e-Preserv. Sci. 2008, 5, 29–35. [Google Scholar]
  24. Håfors, B. The Drying Pattern of the Outer Planking of the Wasa Hull. In Proceedings of the 2nd ICOM Waterlogged Wood Working Group Conference, Grenoble, France, 28–31 August 1984; Centre d’Étude et de Traitement des Bois Gorgés d’Eau: Grenoble, France, 1984; pp. 313–326. [Google Scholar]
  25. Klügl, J.; Di Pietro, G. The Interaction of Water with Archaeological and Ethnographic Birch Bark and Its Effects on Swelling, Shrinkage and Deformations. Herit. Sci. 2021, 9, 3. [Google Scholar] [CrossRef]
  26. Walsh, Z.; Janeček, E.-R.; Jones, M.; Scherman, O.A. Natural Polymers as Alternative Consolidants for the Preservation of Waterlogged Archaeological Wood. Stud. Conserv. 2017, 62, 173–183. [Google Scholar] [CrossRef] [Green Version]
  27. Henrik-Klemens, Å.; Abrahamsson, K.; Björdal, C.; Walsh, A. An In Situ Raman Spectroscopic Method for Quantification of Polyethylene Glycol (PEG) in Waterlogged Archaeological Wood. Holzforschung 2020, 74, 1043–1051. [Google Scholar] [CrossRef] [Green Version]
  28. Aluri, E.R.; Reynaud, C.; Bardas, H.; Piva, E.; Cibin, G.; Mosselmans, J.F.W.; Chadwick, A.V.; Schofield, E.J. The Formation of Chemical Degraders during the Conservation of a Wooden Tudor Shipwreck. ChemPlusChem 2020, 85, 1632–1638. [Google Scholar] [CrossRef] [PubMed]
Figure 1. Overview of the treatment and drying of the Mary Rose. (a) The Mary Rose during controlled air-drying ©Mary Rose Trust. (b,c) Core sampling locations, from both the external side (b) and internal side of the hull (c), with nomenclature defined in Supplementary Table S1. (d) Moisture contents for 9 locations, averaged over all depths from 0 to 220 mm, at the onset of drying and subsequent yearly intervals. Error bars denote ± 1 standard deviation from the mean.
Forests 12 01662 g001
Figure 2. Depth resolved moisture content data for external and internal sides of the hull during drying. (a,b) Raw moisture content data for wood samples at depths of 0–70 mm, taken at 27 distinct timepoints over 1092 days; warmer colours indicate shallower depths, and cooler colours deeper depths. (c,d) Averages from the above raw data, with a similar colour scheme as in (a,b).
Forests 12 01662 g002
Figure 3. Modelling of Mary Rose moisture content data. (a,b) Exponential decay curves fitted to the data in Figure 2, describing the change in moisture content at varying depths (colour-coded as in Figure 2), over time, for (a) internal, and (b) external samples. (c,d) Estimates, derived from the curves in (a,b), of the time for samples at varying depths to dry to four moisture contents: 35%, 30%, 25%, and 20%. Here, colour again indicates depths, while hatching indicates the level of drying for the given estimate.
Forests 12 01662 g003
Figure 4. Spatiotemporal model description of the Mary Rose drying process. (a,b) At top and in middle, images describing which parts of the ship the model describes. Below, model results are shown for these external and internal samples, respectively. Depth is indicated on the horizontal axis (with shallower depths to the left), time on the vertical axis (with t = 0 days on top), and moisture content for a particular depth and time is described by the colour bar, with whiter colours describing drier conditions. Model results are produced at a resolution of every 0.1 mm from 0 to 70 mm, and for every day from 0 to 1092 days.
Forests 12 01662 g004
Publisher’s Note: MDPI stays neutral with regard to jurisdictional claims in published maps and institutional affiliations.

