Article

Weather–Growth Responses Show Differing Adaptability of Scots Pine Provenances in the South-Eastern Parts of Baltic Sea Region

1
Latvian State Forest Research Institute ‘Silava’, 111 Rigas Str., LV-2169 Salaspils, Latvia
2
Thünen Institute of Forest Genetics, Eberswalder Chaussee 3a, D-15377 Waldsieversdorf, Germany
*
Author to whom correspondence should be addressed.
Forests 2021, 12(12), 1641; https://doi.org/10.3390/f12121641
Submission received: 14 October 2021 / Revised: 15 November 2021 / Accepted: 24 November 2021 / Published: 26 November 2021

Abstract

:
Local adaptation and plasticity of growth play important roles in the adaptability of trees to changing conditions. Under accelerating climatic changes, the adaptive capacity of metapopulations can be exceeded, implying a necessity for assisted gene flow to sustain the productivity of forests. Such management is knowledge intensive, and information on the responsiveness of metapopulations (provenances) across the climatic gradient can aid more comprehensive projections of their performance. The plasticity of growth responses to weather conditions of five provenances of Scots pine with differing field performance across the climatic gradient of the south-eastern Baltic Sea region was assessed using dendrochronological methods and generalized additive models. Weather conditions related to water availability in summer, as well as during dormancy, were the main regional drivers of an increment in the provenances. The provenances differed by the plasticity of responses according to field performance, indicating adaptation in terms of growth sensitivity and uneven adaptability. The weather–growth responses of the top-performing provenances to summer weather were more plastic, providing advantages under a changing climate. Accordingly, regional sensitivity and plasticity of growth responses could be used for the screening of genotypes best suited for the projected climates. In addition, the estimated growth responses encourage supplementation of the local breeding populations with the top-performing provenances originating from sites with the projected climates.

1. Introduction

Substantial changes in forest composition are projected in Eastern and Northern Europe by the end of the 21st century [1,2] due to warming, the increasing heterogeneity of the precipitation regime [3,4,5], and other weather extremes [2]. This highlights the necessity for adaptive management to mitigate ecological and economic consequences [6,7,8]. Assisted migration/gene flow in combination with breeding have been identified as highly effective for the coupling of ecological demands of forest reproductive material with the projected climates [7,9,10,11,12]. Such an approach requires comprehensive information on biotic and abiotic factors influencing tree growth [6,7,8,13]. The ongoing changes in tree growth in Eastern and Northern Europe [1,2,14], though, are exemplifying differences in the adaptability of genotypes [10,15,16].
To cope with a wide spectrum of environmental conditions [10,17,18,19], trees have evolved considerable phenotypical plasticity [15,16,20,21]. Nevertheless, metapopulations of wide-distribution species adapt to local/regional conditions restricting plasticity to optimize performance/survival [15,16,18,22,23,24]. For traits of survival/reproductive significance, genetic adaptation occurs, resulting in the heritability of phenotypes [16,20,22,25]. Furthermore, genetic adaptations can persist under intensive gene flow [15,20], which might also cause natural adaptation to lag behind the accelerating environmental changes [10], implying provenance–specific environmental optima and plasticity [11,20,24,26,27]. Accordingly, phenotypical plasticity and genetic adaptation indicate the adaptability of genotypes [15,16,21].
Provenance trials have been historically established to screen the performance of genotypes under common conditions [17,24,28], and parallel traits are sufficient for the evaluation of assisted gene transfer/migration [11,15,28,29]. Provenance trials are revisited for assessment of the adaptability of metapopulations [17,24,28,30], screening performance, and the sensitivity of genotypes under extended ecological gradient(s) [15,17,28,29]. Such information is crucial for breeding programs [7,13], aiding the development of more tolerant genotypes [10,28].
A retrospective analysis of increment is efficient for the assessment of the sensitivity of genotypes to weather fluctuations [11,19,31,32] and their conformity with climates [18,25,33]. Under shifting environments, such an approach appears more informative than a comparison of allometric variables, which represent cumulative responses to past conditions [7,28,31]. Tree-ring width (TRW) and its derivatives (e.g., relative additional increment, etc.) are widely used for such an analysis due to their convenience of sampling and measurements [19,26,32,34]. Accordingly, sensitivity of growth (TRW) has been related to the productivity of genotypes [19,27,31,35,36], although xylogenesis is a continuous process [37,38], and TRW represents the effects of conditions during and prior to growth [26,34].
Ecological responses across environmental gradients are usually bell-shaped [39,40]. Close-to-linear responses can be observed under a limited part of a gradient [26,41,42,43], often implying their biasness [39]. Trees experience a wide spectrum of environmental (e.g., meteorological) conditions, which can have disproportional effects [26,40,42,44]. Accordingly, assessments of nonlinear responses across spatiotemporal climatic gradient(s) are essential for growth projections under a shifting climate [18,23,34,42]. This allows screening of the main regional climatic drivers of growth [14,18,23], which, though, might be moderated by local adaptation(s) [15,16,25,26].
Scots pine (Pinus sylvestris L.) is a stress-tolerant [45], wide-distributed and economically important species [46]; hence, efforts are made to improve its sustainability [11,47]. The species is genetically diverse [48], yet its populations show varying degrees of local adaptation [16,24,34,49]. Scots pine is ecologically plastic [46] and can be considered more resilient to climatic changes than other temperate conifers [1,3]. However, it is also sensitive to water shortages [3,26,34,50], and its abundance is projected to decrease in the eastern Baltic region [1,2] due to increasing water stress [3,4,5] and competition [21,51]. Regional (eastern Baltic) responses of Scots pine to water-deficit-related conditions are nonlinear [26], implying disproportional effects of climatic changes [43]. Nevertheless, there is high potential for assisted gene flow to anticipate the shifts in climatic gradient [10,11,12,15,29] and improve the tolerance of trees [8,9,52]. Genetic adaptations in terms of weather–growth sensitivity has been suggested for the south-eastern Baltic metapopulations [27,35], supporting the potential for breeding for climatic tolerance [25,47,53].
The aim of the study was to assess the plasticity of responses of provenances of Scots pine originating from the south-eastern Baltic Sea region differing by productivity to weather fluctuations under the regional climatic gradient. Provenances with differing productivity were selected to screen relationships between their climatic sensitivity and field performance. We hypothesized growth responses to be nonlinear and their shape to differ by field performance of the provenances. We also assumed more productive provenances to have responses with wider optimum intervals, hence, to be more tolerant to weather fluctuations, suggesting higher sustainability under a shifting climate.

2. Materials and Methods

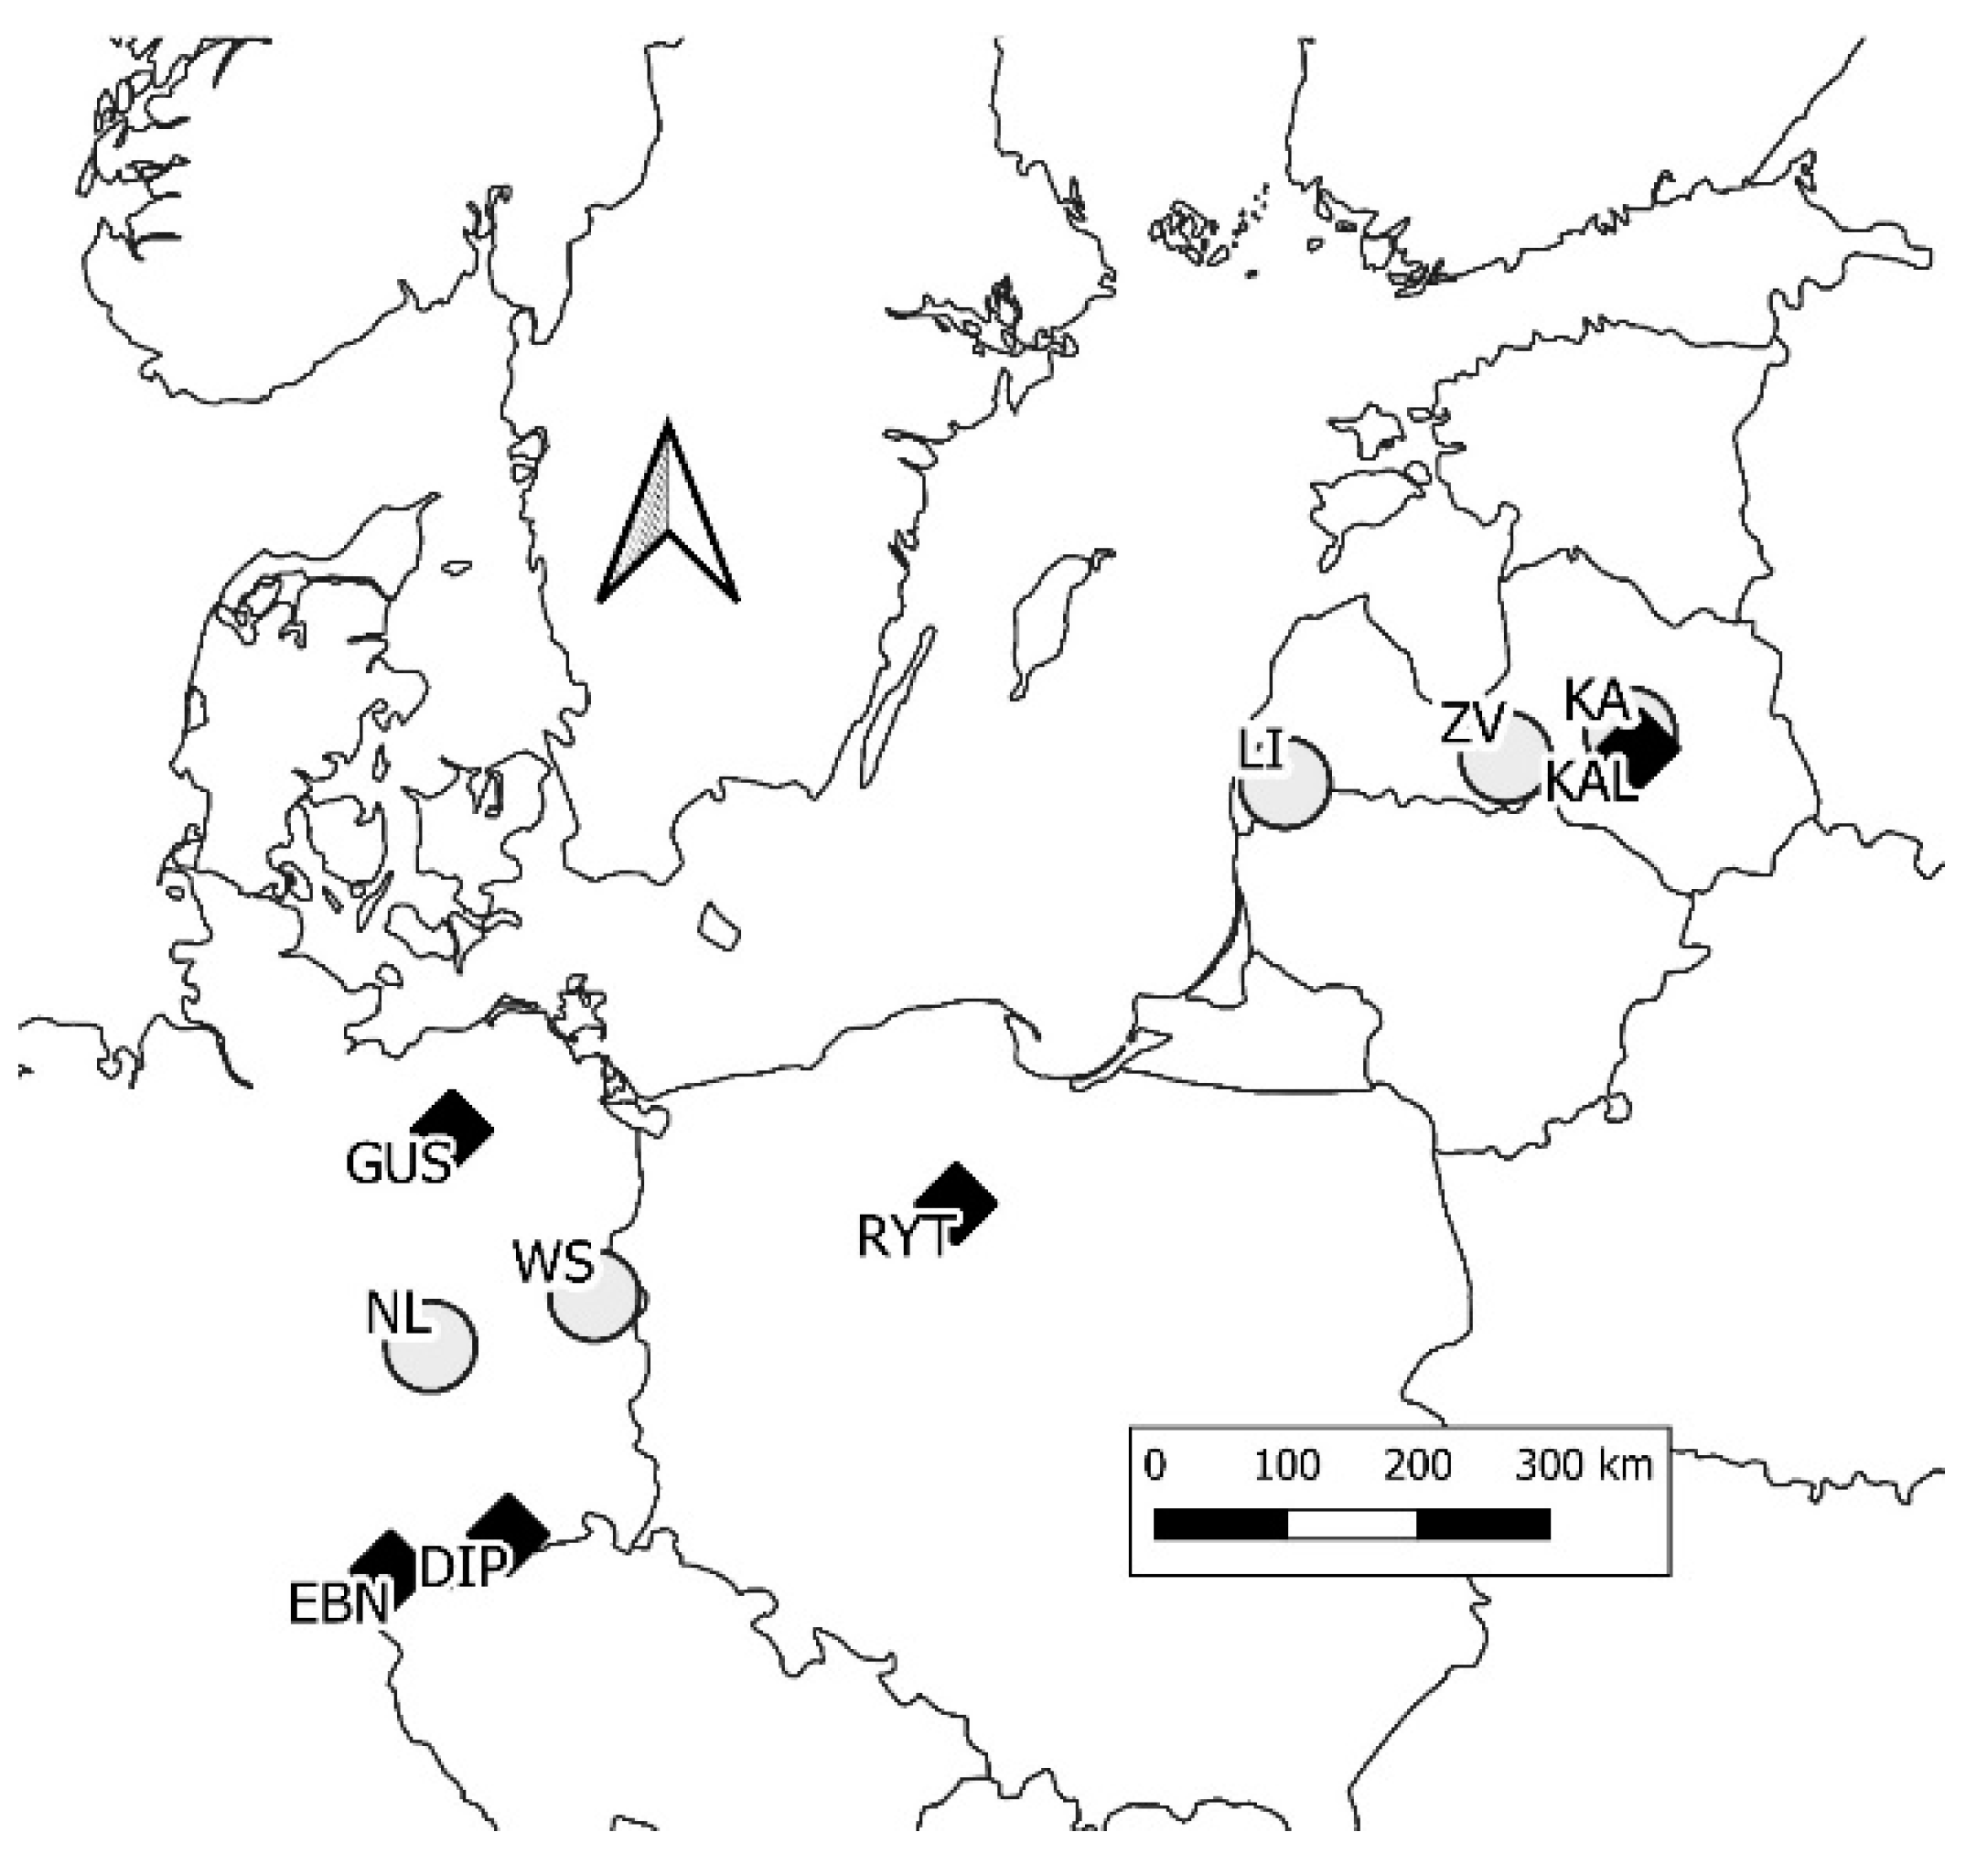
2.1. Trials, Provenances, and Measurements

An international provenance experiment established under the collaboration of the German Democratic Republic and the USSR in 1975 for assessment of performance of Scots pine metapopulations from Eastern Europe and the USSR [54] was studied. The seed material for the experiment was collected in 36 open-pollinated stands (20–25 plus trees per stand) distributed in 50–57° N and 11–27° E (Baltics, Ukraine, Belarus, Poland, and Germany) [54,55]. Such region currently comprises climates projected for the Baltic States (Latvia) by the end of the 21st century [1,56]. Five parallel trials (Figure 1) growing under lowland (≤220 m above sea level) conditions near Liepaja (LI), Zvirgzde (ZV), Kalsnava (KA), Waldsieversdorf (WS), and Nedlitz (NL) on freely drained oligotrophic mineral (sandy or silty) podzols (LI, ZV, and KA) or mesotrophic sandy brown soil (WS and NL) with a flat topography (Table 1) were sampled. Thus, the trials represented regional climatic gradient and projected amplitude of its shift by the end of the 21st century [1,56].
The climate at the trials can be characterized as temperate moist continental (Dfb; [57]), yet with explicit coastal features, as preconditioned by the dominating westerlies and proximity of the Baltic and North Seas. The trials differed by continentality due to varying distance from sea. During the period 1988–2017, January and July were the coldest and the warmest months, respectively (Table 1; Supplementary Material, Figure S1). In the trials in Latvia, the mean annual temperature ranged 6.4–7.5 °C, decreasing with growing distance from the sea; mean summer (May–September) temperature was higher in ZV trial. The annual precipitation sum was higher in the coastal (LI) compared to ZV and KA trials. Summer precipitation, which comprised approximately half of the annual, was similar among the trials.
In northern Germany, the mean annual temperature was higher, yet the difference among the trials was smaller compared to Latvia (Figure S1, Table 1). The annual precipitations sums were approximately 20% lower compared to trials in Latvia; the highest monthly precipitation occurred in the summer months. The vegetation period, when the mean diurnal temperature > 5 °C, was approximately 3–4 weeks longer compared to Latvia. The climatic changes are expressed as warming during the dormancy period, extension of vegetation period (by approximately 10 days during the past 50 years), and increasing heterogeneity of summer precipitation regime [56,58]. In Germany, a negative trend for summer precipitation has been estimated [56].
The trials were established by planting one-year-old bare-rooted seedlings raised in local nurseries on forest land. The studied trails contained common set of provenances. In trials in Latvia, provenances were represented by six to eight randomly distributed blocks of 5 × 7 trees planted with 1 × 2 m spacing (5000 trees ha−1). At the age of 21 years, the trials were systematically thinned (from bottom) removing two thirds of the trees, resulting in stand density of ca. 1800 trees ha−1 [55]. In each trial in Germany, provenances were represented by four randomly distributed blocks of 100 (5 × 20) trees planted with the initial spacing of 0.5 × 2 m (10,000 trees ha−1). The WS trial has undergone three thinnings (last in the winter of 2013/2014), reducing stand density to ca. 1400 trees ha−1. The NL trial was thinned once directly prior to sampling, reducing stand density from ca. 4200 to ca. 1300 trees ha−1.
To assess effect of local (genetic) adaptation on plasticity of metapopulations of Scots pine in terms of growth responses to regional weather drivers and productivity [14,15,20,26,27,35], five provenances were selected based on their field performance (two top-, two low-performing provenances, and one with intermediate performance). The selection was based on field performance of provenances (according to tree height and survival) in trials in Latvia according to an inventory conducted in 2016. Metapopulations Güstrow (GUS) and Rytel (RYT), which originated from lowland sites (Figure 1) with warmer and drier climate compared to trials in Latvia (Table 2; Supplementary Material, Figures S1 and S2), were selected for representation of the top-performing provenances (Supplementary Material, Table S1). Metapopulations Eibenstock (EBN) and Dippoldiswalde (DIP), which originated from the Orr mountains (Table 2) where mean annual temperature was similar but precipitation higher compared to Latvia (Table 1; Supplementary Material, Figures S1 and S2), were selected as the low-performing provenances (Supplementary Material, Table S1). Such selection represents provenances subjected to decreasing ecological transfer differences [7,11,12] in the Baltics (Latvia). To assess adaptability of native metapopulations [52,59] (from Latvia’s perspective), Kalsnava (KAL) provenance representing lowland conditions in Latvia (Table 2), which showed intermediate field performance (Supplementary Material, Table S1) but superior stem quality [55], was selected. The performance of the provenances was consistent across the trials in Latvia [55], although coastal LI trial was more productive (Supplementary Material, Table S1). The selected provenances showed comparable rankings also in the trials in Germany [52,54].
In each trial, 9–16 trees per provenance were sampled (Supplementary Material, Table S2). One to three visually healthy non-leaning (to avoid reaction wood) dominant trees per block were cored at the breast height using a 5 mm increment corer. Two increment cores from randomly oriented opposite sides of stem were extracted. Samples were collected in the autumn of 2017 (Latvia) and spring of 2021 (Germany). In a laboratory, cores were fixed on wooden mounts, and their surface was levelled using the WSL core microtome [60]. A LINTAB6 measurement table (RinnTech, Heidelberg, Germany) was used to manually measure TRW. All measurements were carried out by the same person; the accuracy of measurements was 0.01 mm.

2.2. Data Analysis

The quality of TRW measurements was ensured by graphical and statistical crossdating [61]. The high-frequency variation of TRW datasets was described by the mean interseries correlation (r-bar), first order autocorrelation (AC1), mean sensitivity (SENS), signal-to-noise ratio (SNR), and the expressed population signal (EPS; [62]). These metrics were calculated based on detrended (by a cubic spline with the wavelength of 25 years and 50% cut-off frequency) time series of trees. To assess local weather–growth relationships, a residual chronology of TRW was developed for each provenance within each trial. The time series of trees were double detrended by the modified negative exponential curve and by a flexible cubic spline with the wavelength of 25 years and 50% cut-off frequency, prewhitened by the first order autoregressive model (′ar1′), and averaged by the biweight robust mean [63,64]. Such detrending was performed to minimize effects of local conditions.
Considering that each trial represents limited part of the regional climatic gradient [18,23,26,39], bootstrapped Pearson correlation analysis (nonparametric percentile interval bootstrapping with 1000 iterations; [65]) was used to assess local linear relationships between the residual chronologies and meteorological variables during the common period of 1985–2017. Such common period was selected to reduce noise associated with juvenile wood and to ensure sufficient replication of measurements (sample depth). Mean monthly temperature, precipitation sums, and standardized precipitation-evapotranspiration indices calculated with the respect to preceding three months (SPEI; [66]), arranged into the time windows from June of the year preceding growth (previous June) to October in the year of tree-ring formation, were used as the meteorological variables. Gridded climatic data (CRU TS) were obtained [67].
Generalized additive mixed models [68] were used to assess plasticity of growth responses of the provenances across the regional (south-eastern Baltic) spatiotemporal climatic gradient represented by the trials (Table 1, Figure S1). Such models are proven efficient for the analysis of spatiotemporally heterogeneric ecological data representing environmental gradient(s) [18,26,41,42]. A model was constructed for each provenance for the common period. The models were based on the detrended and prewhitened TRW time series of individual trees, as produced for calculation of the residual chronologies (before averaging). For cross-verification (ensuring absence of overfit) of the refined models, ca. 10% of trees per provenance/trial were randomly excluded from calibration. The index values of the detrended series, which represent the annual relative additional increment, were used as the response variable.
Arbitrary combinations of weather variables (based on correlation analyses and presuming conformity with the biological realism) were tested as predictors; model selection was based on the Akaike Information Criterion. The predictors were tested as a complex, i.e., commonly for the studied provenances. Collinear predictors were omitted according to the variance inflation factor. To account for the influence of local conditions and temporal dependencies of responses, year and tree nested within repetition and trial were used as the random effects [69,70], and general first order autocorrelation term was included. The models were fit using the restricted maximum likelihood approach. Smoothening parameters were estimated by the generalized cross-validation procedure, which avoids overfit. Regression spline with shrinkage was used to smooth the results. Due to limited regional climatic gradient, the basis dimension for smoothing splines was restricted to three, implying responses with up to two inflection points to avoid overfit. Model residuals were checked for normality and homogeneity by diagnostic plots. Data analysis was conducted in R v. 4.1.1 [71] using libraries “dplR” [64], “car” [72], and “mgcv” [68].

3. Results

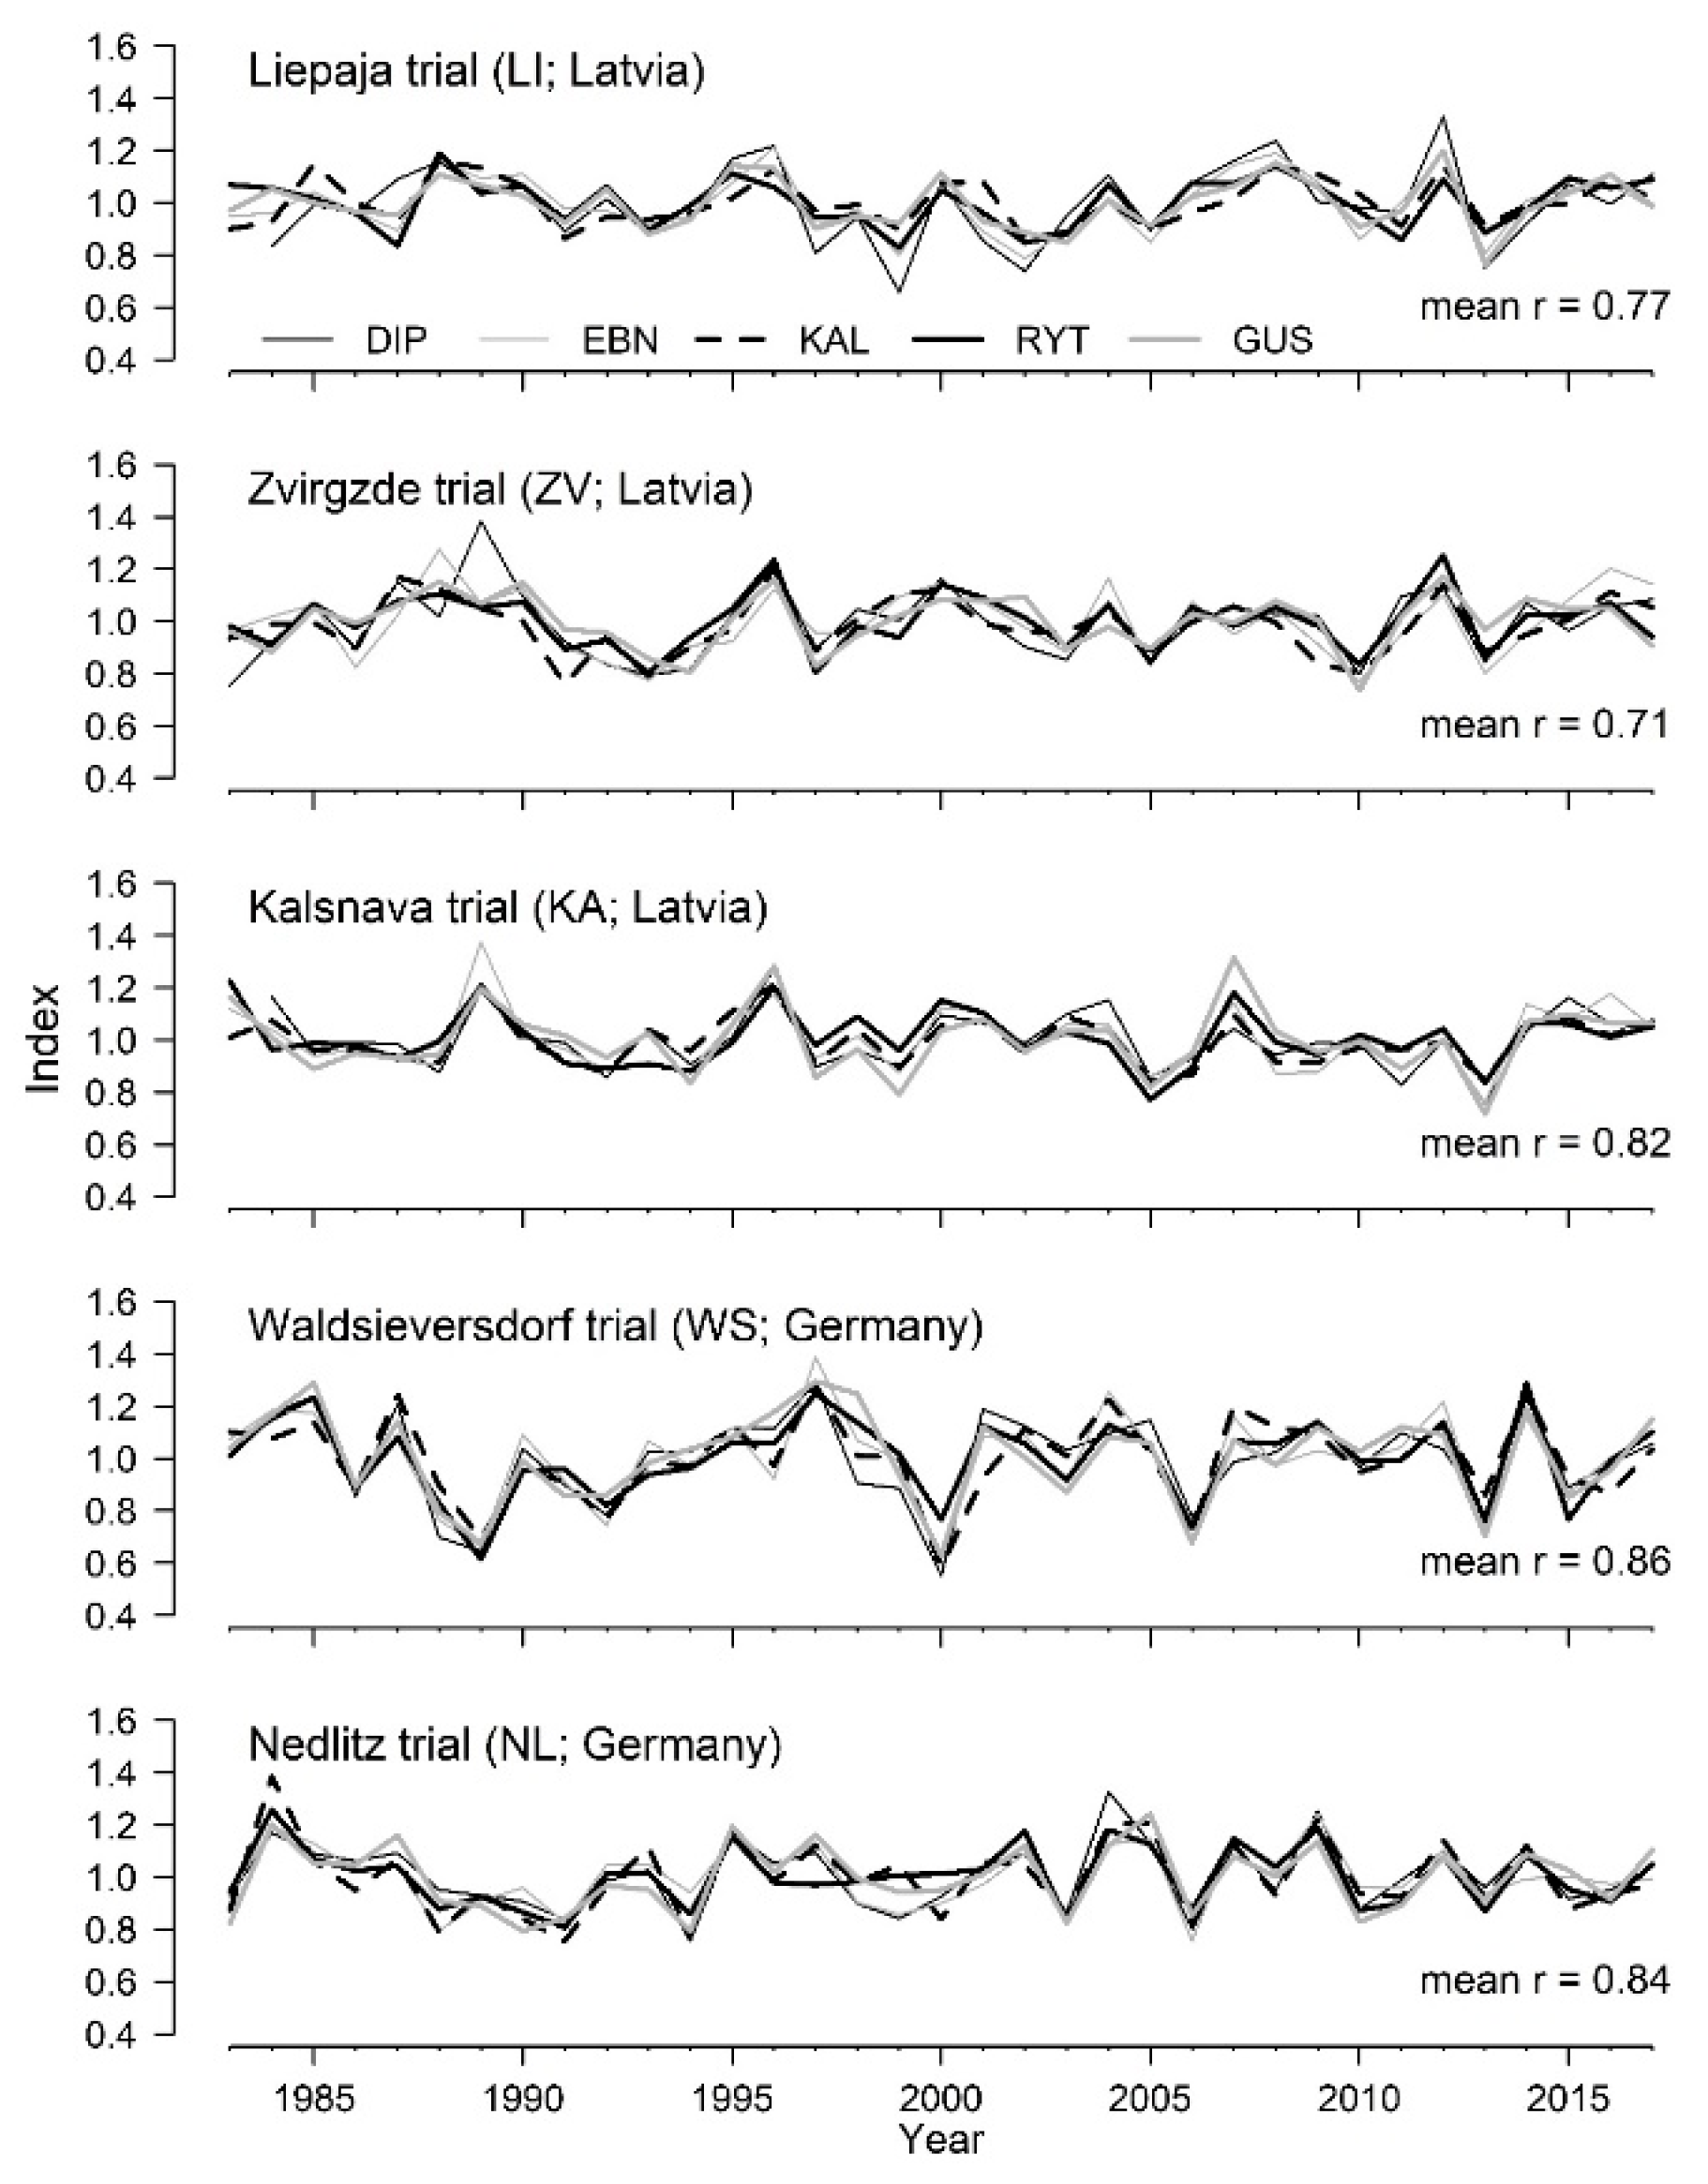
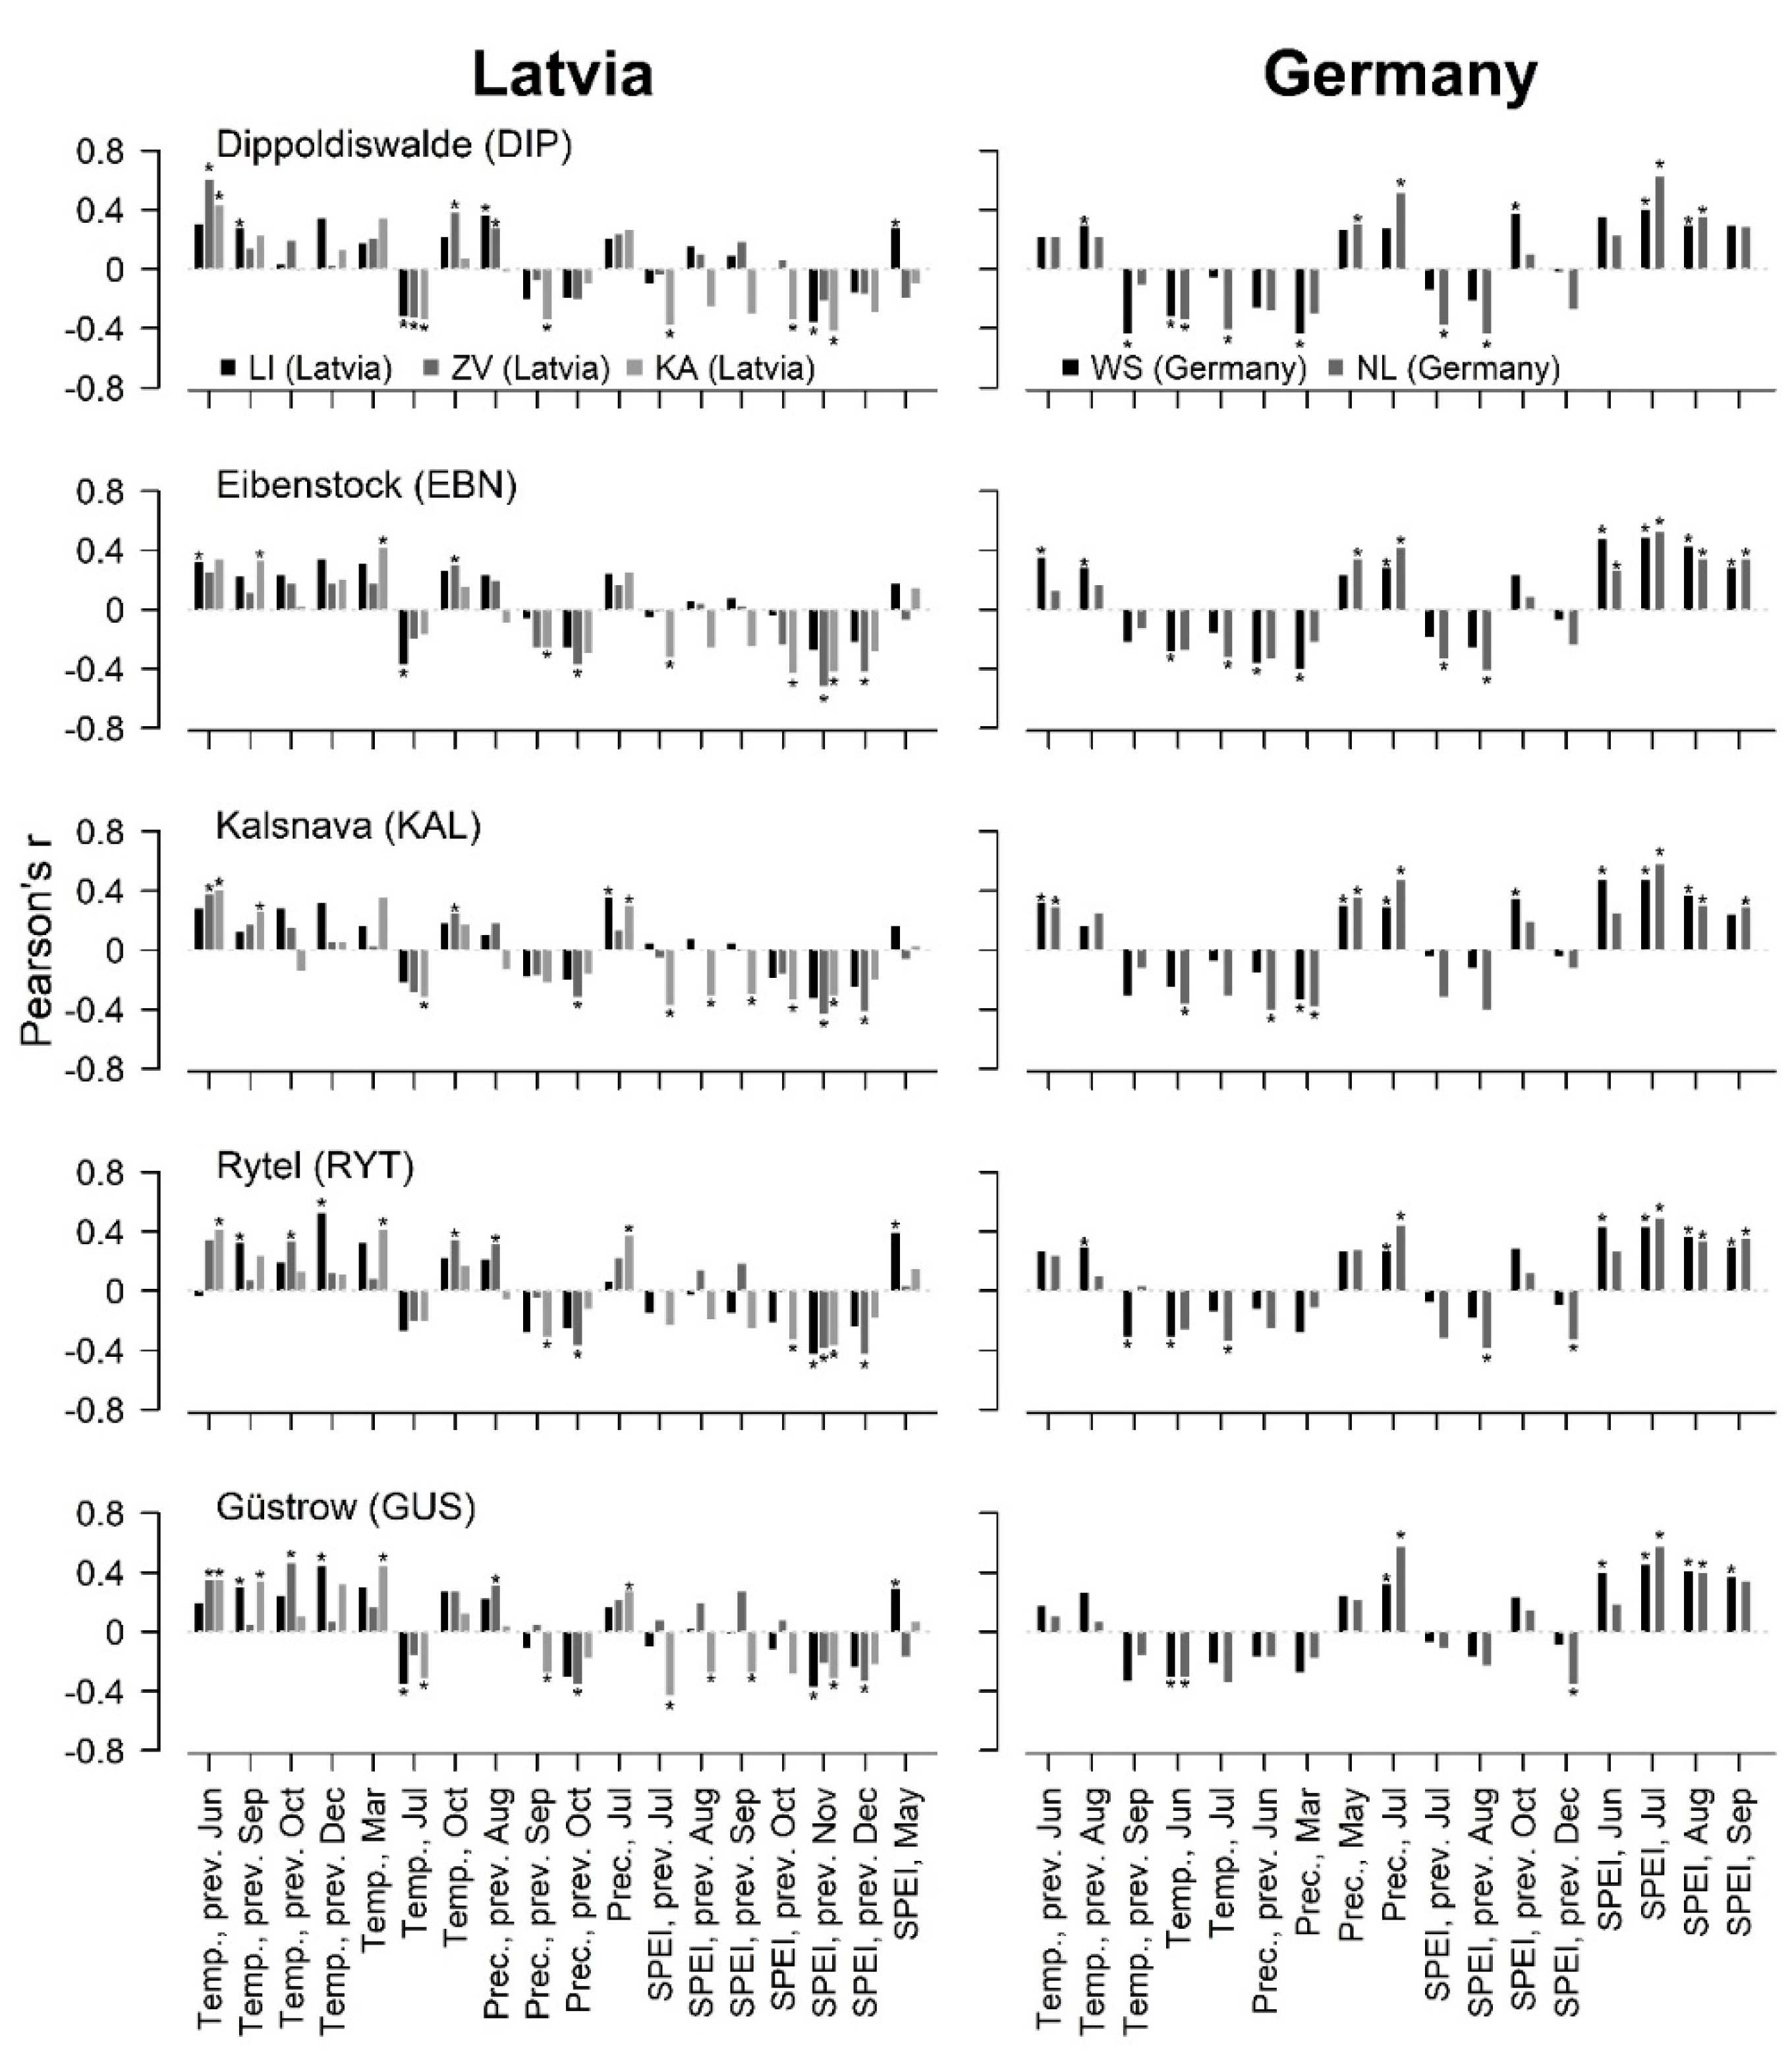
3.1. Local Linear Weather–Growth Relationships

Most of the measured time series of TRW (9–16 trees per provenance per trial; ≥86% of the measured) showed good agreement, were successfully crossdated, and ensured sufficient replication during the common period (Supplementary Material, Figure S3). Wider TRW was measured in the coastal LI trial compared to others, implying generally comparable productivity. The studied datasets (provenances/trial) contained a common environmental signal, as EPS exceeded 0.85 (cf. [62]; Table 3). The strength of the common environmental forcing of the increment did not show explicit geographic tendencies; the mean r-bar ranged from 0.35 to 0.49 in NL and WS trials, while SNR ranged from ca. 8.55 to 16.21 in LI and WS trials, respectively. Nevertheless, AC1 and GINI were higher in trials in Latvia compared to Germany (ca. 0.77 vs. 0.51 and ca. 0.26 vs. 0.22, respectively) and SENS showed the opposite. Across the studied trials, the provenances showed comparable r-bar and AC1 (ca. 0.40 and 0.67, respectively; Table 3). Nevertheless, the low-performing DIP and EBN provenances appeared more sensitive to environmental fluctuations, showing higher GINI and SENS, though lower SNR.
The developed chronologies (Figure 2) showed regional and local specifics and the similarity in growth patterns decreased with distance. Nevertheless, within each trial, provenance-specific variations, particularly differences in index values (rather than synchrony of chronologies), indicated differing sensitivity to the principal drivers of growth. A higher correlation among the chronologies was observed within compared with between the trials (0.71 ≤ r ≤ 0.86 vs. 0.16 ≤ r ≤ 0.23, respectively). The chronologies correlated significantly with 27 (eight common) of the 54 meteorological variables tested; meteorological variables significant in Latvia and Germany were generally comparable (Figure 3). These variables were related to the thermal and moisture regime in late summer and the dormant period preceding the growth, as well as in the current vegetation period. The strength of the correlations was generally similar, ranging from −0.52 to 0.60 and from −0.44 to 0.60 (absolute means of 0.35 and 0.36) in trials in Latvia and Germany, respectively, indicating intermediate local individual effects of meteorological variables. However, the strength of correlations differed by trials, implying local specifics in growth sensitivity.
Among the meteorological variables showing common correlations with chronologies in Latvia and Germany, July precipitation and temperature in the previous June showed positive effects, while temperature in July and SPEI in the previous July, August, and December showed negative effects (Figure 3). The correlations with temperature in the previous September were contrasting. Correlations with temperature during the dormancy period (December and March) and precipitation in the previous vegetation period (August–October), as well as SPEI in May were specific to trials in Latvia. In Germany, provenances showed correlations with precipitation in March and May, June–September’s SPEI, and temperatures in June and the previous August.
The strength of correlations with most of the significant meteorological variables differed by provenance, indicating local adaptations (Figure 3). In the trials in Latvia, the differences among the provenances were related to temperatures in the December and March, to which the top-performing provenances were more sensitive, particularly in LI and KA trials. The low-performing provenances (DIP and EBN), as well as RYT, appeared less sensitive to summer precipitation both in the current and preceding years. Correlation with SPEI in May was significant for DIP, RYT, and GUS under coastal conditions (LI trial). Stronger (and significant) correlations with SPEI in the previous November and December were observed for EBN, KAL, and RYT.
Under the drier and warmer climate in trials in Germany (Table 1), July precipitation and SPEI showed the strongest correlations with TRW, particularly for the low-performing provenances (Figure 3). The top-performing provenances showed non-significant correlations with precipitation in March and May but were sensitive to SPEI in the previous December (in NL trial). In turn, the low-performing provenances, specifically, showed correlations with SPEI in the previous July and August. Correlations with temperature in July and the previous August differed among the provenances, irrespective of their productivity (significant for DIP, EBN, and RYT). In turn, DIP and GUS showed weaker correlations with September’s temperature and SPEI.

3.2. Regional Nonlinear Responses

The plasticity of responses to the main regional weather drivers of relative radial additional increments in the studied provenances were estimated by the generalized mixed additive models. The responses estimated across the regional spatiotemporal gradient (timespan of 33 years and length of the geographic gradient of 900 km; Figure 1) indicated climate-dependent sensitivity of TRW to weather conditions (Figure 4). The refined models were strictly significant (p-value < 0.001) and indicated a complex of nine meteorological variables as the main regional drivers of radial increment (Table 4). In most cases, the meteorological variables included in the refined models were significant (p-value < 0.01); however, their effects differed by provenances considerably (1.69 ≤ F-value ≤ 38.78), indicating specific sensitivity. The estimated effective degree of freedom reached 1.96, implying response curves with up to one inflection point (linear or quadratic).
Among the random effects, tree and trial were estimated with the most random variance (Table 4), indicating individual and local growth specifics. The variance of repetition was low, implying homogeneous growing conditions within a trial. Variance related to the year of tree-ring formation indicated slightly higher temporal instability of responses for DIP and GUS. The adjusted marginal R2 values of the models were intermediate (cf. [18]) ranging from 0.21 to 0.30 for KAL and GUS, respectively, and indicated the lack of overfit; while conditional R2 exceeded 0.85. The cross-validation of the models based on data excluded from calibration confirmed the lack of overfit, showing comparable errors.
The estimated regional drivers of radial increment (Table 4) were similar to meteorological variables identified by the local weather–growth relationships (Figure 3). Regarding the top-performing provenance (RYT and GUS), the strongest effects (highest F-values) were estimated for SPEI in May and July (Table 4). Temperature and SPEI in May had the strongest effect on KAL. The low-performing provenances were most affected by temperature in the previous June, as well as precipitation in the previous August (DIP), and May’s temperature (EBN). The majority of the response curves were nonlinear (quadratic; Figure 4), confirming the dependence of weather–growth relationships on the intensity of variables.
The studied provenances differed by plasticity of weather–growth responses, as shown by the flatness of response curves (Figure 4). The most explicit differences among the provenances were observed for responses to variables determining the moisture regime, particularly temperature in July and the previous June, as well as SPEI in May, June, and July. The response curves to July’s temperature (Figure 4D) showed a clear negative effect, particularly on the low-performing DIP across the gradient. For other provenances, particularly GUS, the negative effect was caused by July’s temperature exceeding ca. 19 °C. All but DIP showed a generally positive response to May’s SPEI across its gradient, though a flatter curve (at SPEI > 0.5) was estimated for EBN and RYT (Figure 4G); DIP showed an optimum (−0.5 < SPEI < 2.0), which gained a positive increment.
The responses to June’s SPEI differed according to the productivity of provenances (Figure 4H). The top-performing RYT and GUS were irresponsive to SPEI < 0 while producing a positive additional increment; however, excessive moisture (SPEI > 0.5) resulted in a negative additional increment. The response of KAL indicated a short interval of optimum with no negative additional increment; the low-performing provenances were irresponsive (Table 4). The responses to July’s SPEI highlighted differences in the provenances’ sensitivity to water shortage (SPEI < −0.5; Figure 4I). The sensitivity to July’s SPEI was proportional to field performance with more productive provenances being more sensitive, thus contrasting with the hypothesis.
The low-performing provenances were particularly sensitive to legacy effects of temperature in the previous June, showing steep linear responses across the gradient (Figure 4A). The responses of the top-performing provenances were flatter, but intensified when temperature exceeded ca. 16 °C, particularly for KAL. The responses to precipitation in the previous December showed a generally negative tendency when monthly precipitation ranged from 10 to 60 mm/month (Figure 4F); DIP showed a local minimum at ca. 50–90 mm/month, while EBN was irresponsive (Table 4). Although the response curves to March’s temperature were practically identical (Figure 4B), the effect was not significant for DIP and KAL (Table 4), implying differing sensitivity. Precipitation in the previous August (particularly its abundance) had a positive effect on the additional increment, especially for DIP (Figure 4E). The studied provenances were similarly sensitive to May’s temperature with responses indicating an optimum of ca. 11–14 °C, although warmer temperatures reduced growth (Figure 4C).

4. Discussion

4.1. Plasticity of Growth Responses

The geographic differences in correlations (Figure 3) and the regional response curves of the studied provenances (Figure 4) highlighted the plasticity of weather–growth responses [18,41,42], as observed for native populations within the region [14,26]. Such responses imply a modulating effect of climate on growth sensitivity [23,34,73,74], projecting disproportional effects of climatic changes [40,42,44]. This subjects trees to novel conditions [10,23,74] amplifying the effects of local adaptation [15,25,73] and challenging the adaptability of metapopulations. The nonlinearity of growth responses also relate to spatiotemporal non-stationarity of the local linear weather–growth relationships [39,41,75], as local climates shift along the regional gradient [26,40,44,56]. Hence, the estimated response curves (Figure 4) indicate the presence of stationary, yet nonlinear regional weather–growth relationships [26,39], revealing varying adaptability of metapopulations [11,24,27,52,59]. Accordingly, the assessment of weather–growth relationships at a regional scale aids more reliable growth projections [14,18,23,32,39].
The differences in growth sensitivity (Figure 3 and Figure 4) suggest genetic adaptation of metapopulations to local climates, indicating uneven phenotypic plasticity [11,17,24,27,35] and adaptability to environmental changes [20,30]. The genetic adaptation of traits crucial for survival and reproduction can persist under high gene flow [15,20], supporting the evolutionary relevance of weather–growth relationships [19,32,51]. Accordingly, Scots pine provenances are shown to differ by their tolerance to meteorological conditions and their extremes [11,24,27,35,44]. This suggests the potential for improvements via targeted supplementation of breeding populations [25,47,52,53]. The estimated local adaptation might also be linked to the relatively high genetic diversity of populations of Scots pine [48,49]. However, the regional within-population genetic diversity [48], has likely resulted in the individuality of growth (indicated by the prevailing random variance of trees; Table 4).
The genotype–environment (provenance-by-trial) interaction was characterized by the second highest variance component related to the trial (Table 4), indicating the adaptability of genotypes [13,25] and explaining local specifics of weather–growth responses [20,31]. Such effects might also be related to specific interactions of meteorological, as well as edaphic conditions [27,76]. Accordingly, genotype–environment interactions can moderate the effects of meteorological conditions [18,23], explaining the intermediate performance of models (Table 4). The year of tree-ring formation was, though, estimated with low variance (Table 4), implying temporally stationary weather–growth relationships [39,42]. Still, a somewhat higher variance of year indicated a higher complexity of weather–growth relationships [69] for the low-performing DIP (Table 4), suggesting a stronger influence of micro-site conditions [18,23]. Considering the south-eastern Baltic (southern Poland and Northern Germany) origin for most of the provenances’ (Figure 1; Table 2) higher diversity of weather–growth correlations (Figure 3), this might imply the “marginality” of conditions for the north-transferred genotypes in Latvia.
The regional weather–growth responses generally differed according to the field performance of the provenances (Figure 4), supporting the linkage between sensitivity and productivity [11,19,27,31,35,44,52]. Although the differences in responses among provenances were mostly small (Figure 4), they can result in substantial ecological effects in the long-term [43,51,77,78]. In contrast to the hypothesis, the top-performing provenances were more sensitive to some of the regional weather drivers of growth (Figure 4). This suggests the ability to rapidly adjust growth-tolerance trade-offs to be highly advantageous under a rapidly changing climate [35,77,79,80], facilitating resilience to ascending stresses [52,59,81,82]. On the other hand, an increased allocation of resources to stress tolerance reduces growth [77,80] and competitiveness [21,51], supporting the projected northward retreat of conifers in the eastern Baltic region [1].

4.2. Regional Weather Drivers of Radial Growth

Meteorological conditions affecting increments in the studied provenances (Table 4, Figure 4) and native populations within the region [14,26] were similar. However, the provenances differed by the timing of their responsiveness (Figure 3 and Figure 4) due to local adaptation [11,15,17,20,21,29,38]. The provenances were prevailingly sensitive to the summer moisture regime (Figure 3 and Figure 4), supporting the intensification of drought effects on nemoral and hemiboreal forests [4,5,14,34,73]. This raises the management of the moisture regime as an issue for adaptive, climate-smart management within the region [4,8,69]. The identified regional weather drivers, though, had a weaker effect on KAL (lower R2; Table 4), probably due to the differing climatype [14,49].
The estimated weather–growth responses (Figure 3 and Figure 4) indicated direct and legacy effects of meteorological conditions [26,34,37], highlighting the complex climatic influence on the control of increments [14,26,34]. The responses to temperature in May and July, as well as May–July’s SPEI (Figure 4C,D,G–I) indicated the direct effect of thermal and moisture conditions on xylogenesis [37,38,83,84]. The generally positive responses to May and July’s SPEI (Figure 4G,I) portrayed the limiting effect of water shortage [3,4,5,38,84], to which the top-performing provenances were more sensitive, likely due to the higher plasticity of xylogenesis [27,52] and lower wood density [24,33,35].
Under a temperate climate, June is the time when most of the earlywood is formed [38] based on current assimilates [83,85,86]. Accordingly, decreased assimilation under rainy conditions might explain the negative responses to June’s SPEI > 0.5 (Figure 4H), although the low-performing provenances (DIP and EBN) were less sensitive to June and July’s SPEI (Table 4, Figure 4H,I), likely due to their higher wood density [24,33,35,38] and/or more conservative survival strategy common for slower growing genotypes [24,77,79,80,83]. The responses to May’s SPEI were steeper under drought conditions (SPEI < 0.0; [66]), indicating the sensitivity of xylogenesis to early drought [38,79,85,87]. Still, the DIP responded negatively to May’s SPEI > 1.0, probably due to decreased assimilation on rainy days [88].
The responses to summer temperature shaped an arc (Figure 4C,D), suggesting a trade-off between the rate of assimilation and water deficiency [75,84]. These arcs, however, were asymmetric, implying the disproportional negative effects of increasing temperature [40,41,42]. The responses to July’s temperature differed by provenance (Figure 4D), indicating varying temperature preferences [10,37,52,59]. The low-performing DIP, which originated from a higher elevation (Table 2), appeared particularly sensitive; the top-performing RYT showed a flatter response, suggesting better adaptation to heat stress [4,36]. The studied provenances showed similar responses to May’s temperature (Figure 4C), implying the common limitation of early growth [38,84].
Conditions during the dormancy period and previous summer showed significant legacy effects (Table 4, Figure 3 and Figure 4B,E), as observed for native populations [14,26]. The positive responses to temperature in the previous June (Figure 4A) might be explained by the formation of additional nutrient reserves [89] under warmer and drier conditions [88], which facilitate growth in the following season [69,86,89]. Such an effect was stronger for the low-performing provenances (Table 4), implying a greater dependence on nutrient reserves due to their more conservative growth strategy [9,11,24,79]. The top-performing provenances were less sensitive (showed flatter slopes) to conditions in the previous June (Figure 4A,H), likely due to their higher plasticity of growth [27,35,77].
Conditions at the end of the growing season, when terminal buds are formed, affect the ratio between vegetative and generative growth initials [90]; hence, the growth–reproduction trade-offs [91]. Considering sensitivity to water shortage (Figure 3 and Figure 4), the positive responses to precipitation in the previous August (Figure 4E) might be related to formation of the vegetative initials and, hence, facilitated growth [91]. This effect was stronger for the low-performing DIP, probably due to their more conservative growth strategy [24,35]. Considering their origin from a higher elevation with a harsher climate (Table 2), the low-performing provenances were less sensitive to conditions during the dormancy period (Table 4). The positive effect of March’s temperature (Figure 4; Table 4) might be explained by soil freeze and its impact on root dynamics and water relations in the following growing season [92], to which fast-growing provenances are more sensitive [24,33]. The negative responses to December’s precipitation (Table 4, Figure 4F), might be explained by soil moisture excess, which could have negative legacy effects on xylogenesis [35,93] or on fine root dynamics, hence, water relations in the following spring [92].
Under accelerating climate change and intensifying droughts [4,5], the observed responses of the provenances to regional weather drivers (Table 4, Figure 4) support the genetic adaptation of metapopulations to local climates [15,17,29]. This implies the possibility of improving the ecological plasticity of forest reproductive material in terms of growth sensitivity by targeted supplementation of breeding populations [7,25,47] to improve the climatic tolerance of northern genotypes [3] with the application of a semi-conservative management strategy.

5. Conclusions

The studied south-eastern Baltic provenances of Scots pine differed by their plasticity of responses to regional weather drivers of increment, implying the specific sensitivity of growth. The observed responses indicate the uneven adaptive significance of sensitivity to metrological conditions throughout the year, with the conditions related to water availability during the formation of the tree-ring playing the main role under a temperate climate, although, the top-performing provenances showed higher sensitivity to these conditions, implying the advantages of more plastic growth regulation under a rapidly changing climate. Accordingly, the sensitivity and plasticity of increment can be a valuable trait facilitating the selection and breeding of trees better adapted to the future climates. Moreover, the obtained results encourage supplementation of the local breeding populations with the top-performing provenances originating from regions with projected climatic conditions.

Supplementary Materials

The following are available online at https://www.mdpi.com/article/10.3390/f12121641/s1, Figure S1: Mean monthly temperature (line) and precipitation sums (bars) at the studied trials during 1997–2017; Figure S2: Mean monthly temperature (lines) and precipitation sums (bars) at the origin of the studied provenances during 1931–1960; Figure S3: Sample depth (replication) of the crossdated datasets of tree-ring width of the studied provenance of Scots pine according to trial; Table S1: Number of surviving trees, overall survival, mean tree height (H), stem diameter at breast height (DBH), standing volume (M), and ranking (according to tree height) of the studied provenances of Scots pine in three trials in hemiboreal zone in Latvia; Table S2: Number of Scots pine trees cored according to provenances and trials.

Author Contributions

Conceptualization, R.M. and Ā.J.; methodology, R.M. and V.S.; software, E.B. and P.Z.; validation, R.M., E.B. and V.S.; formal analysis, D.J. and S.D.; investigation, D.J., S.D. and P.Z.; resources, Ā.J.; data curation, D.J.; writing—original draft preparation, R.M. and P.Z.; writing—review and editing, Ā.J., V.S. and E.B.; visualization, R.M. and P.Z.; supervision, R.M. and Ā.J.; project administration, R.M.; funding acquisition, R.M. and Ā.J. All authors have read and agreed to the published version of the manuscript.

Funding

The study was funded by the Latvian Council of Science (grant number: lzp-2020/2-0416). Sampling and measurements were partially supported by the framework of post-doc studies in Latvia funded by the European Regional Development Fund (project number: 1.1.1.2.VIAA/1/16/108).

Institutional Review Board Statement

Not applicable.

Informed Consent Statement

Not applicable.

Data Availability Statement

Data sharing not applicable.

Acknowledgments

We would like to acknowledge the technical staff who helped with sampling and lab-work. We also thank Renāte Saleniece, who proofread the manuscript.

Conflicts of Interest

The authors declare no conflict of interests.

References

  1. Buras, A.; Menzel, A. Projecting Tree Species Composition Changes of European Forests for 2061–2090 Under RCP 4.5 and RCP 8.5 Scenarios. Front. Plant Sci. 2019, 9, 1986. [Google Scholar] [CrossRef] [Green Version]
  2. Morin, X.; Fahse, L.; Jactel, H.; Scherer-Lorenzen, M.; García-Valdés, R.; Bugmann, H. Long-term response of forest productivity to climate change is mostly driven by change in tree species composition. Sci. Rep. 2018, 8, 1–12. [Google Scholar] [CrossRef] [Green Version]
  3. Isaac-Renton, M.; Montwé, D.; Hamann, A.; Spiecker, H.; Cherubini, P.; Treydte, K. Northern forest tree populations are physiologically maladapted to drought. Nat. Commun. 2018, 9, 1–9. [Google Scholar] [CrossRef] [PubMed] [Green Version]
  4. Allen, C.D.; Breshears, D.D.; McDowell, N.G. On underestimation of global vulnerability to tree mortality and forest die-off from hotter drought in the Anthropocene. Ecosphere 2015, 6, 1–55. [Google Scholar] [CrossRef]
  5. Choat, B.; Jansen, S.; Brodribb, T.J.; Cochard, H.; Delzon, S.; Bhaskar, R.; Bucci, S.J.; Feild, T.S.; Gleason, S.M.; Hacke, U.G.; et al. Global convergence in the vulnerability of forests to drought. Nature 2012, 491, 752–755. [Google Scholar] [CrossRef] [PubMed] [Green Version]
  6. Verkerk, P.J.; Costanza, R.; Hetemäki, L.; Kubiszewski, I.; Leskinen, P.; Nabuurs, G.J.; Potočnik, J.; Palahí, M. Climate-Smart Forestry: The missing link. For. Policy Econ. 2020, 115, 102164. [Google Scholar] [CrossRef]
  7. Breed, M.F.; Harrison, P.A.; Bischoff, A.; Durruty, P.; Gellie, N.J.C.; Gonzales, E.K.; Havens, K.; Karmann, M.; Kilkenny, F.F.; Krauss, S.L.; et al. Priority actions to improve provenance decision-making. Bioscience 2018, 68, 510–516. [Google Scholar] [CrossRef]
  8. Nabuurs, G.-J.; Verkerk, P.J.; Schelhaas, M.-J.; Ramón González Olabarria, J.; Trasobares, A.; Cienciala, E. Climate-Smart Forestry: Mitigation impacts in three European regions. In From Science to Policy 6; European Forest Institute: Joensuu, Finland, 2018; p. 32. [Google Scholar]
  9. Breed, M.F.; Stead, M.G.; Ottewell, K.M.; Gardner, M.G.; Lowe, A.J. Which provenance and where? Seed sourcing strategies for revegetation in a changing environment. Conserv. Genet. 2013, 14, 1–10. [Google Scholar] [CrossRef]
  10. Aitken, S.N.; Bemmels, J.B. Time to get moving: Assisted gene flow of forest trees. Evol. Appl. 2016, 9, 271–290. [Google Scholar] [CrossRef]
  11. Berlin, M.; Persson, T.; Jansson, G.; Haapanen, M.; Ruotsalainen, S.; Bärring, L.; Gull, B.A. Scots pine transfer effect models for growth and survival in Sweden and Finland. Silva Fenn. 2016, 50, 1562. [Google Scholar] [CrossRef] [Green Version]
  12. Schreiber, S.G.; Ding, C.; Hamann, A.; Hacke, U.G.; Thomas, B.R.; Brouard, J.S. Frost hardiness vs. growth performance in trembling aspen: An experimental test of assisted migration. J. Appl. Ecol. 2013, 50, 939–949. [Google Scholar] [CrossRef] [Green Version]
  13. MacLachlan, I.R.; Wang, T.; Hamann, A.; Smets, P.; Aitken, S.N. Selective breeding of lodgepole pine increases growth and maintains climatic adaptation. For. Ecol. Manag. 2017, 391, 404–416. [Google Scholar] [CrossRef]
  14. Harvey, J.E.; Smiljanić, M.; Scharnweber, T.; Buras, A.; Cedro, A.; Cruz-García, R.; Drobyshev, I.; Janecka, K.; Jansons, Ā.; Kaczka, R.; et al. Tree growth influenced by warming winter climate and summer moisture availability in northern temperate forests. Glob. Chang. Biol. 2020, 26, 2505–2518. [Google Scholar] [CrossRef] [PubMed]
  15. Chauvin, T.; Cochard, H.; Segura, V.; Rozenberg, P. Native-source climate determines the Douglas-fir potential of adaptation to drought. For. Ecol. Manag. 2019, 444, 9–20. [Google Scholar] [CrossRef]
  16. Alakärppä, E.; Salo, H.M.; Valledor, L.; Cañal, M.J.; Häggman, H.; Vuosku, J. Natural variation of DNA methylation and gene expression may determine local adaptations of Scots pine populations. J. Exp. Bot. 2018, 69, 5293–5305. [Google Scholar] [CrossRef]
  17. Nabais, C.; Hansen, J.K.; David-Schwartz, R.; Klisz, M.; López, R.; Rozenberg, P. The effect of climate on wood density: What provenance trials tell us? For. Ecol. Manag. 2018, 408, 148–156. [Google Scholar] [CrossRef]
  18. Cavin, L.; Jump, A.S. Highest drought sensitivity and lowest resistance to growth suppression are found in the range core of the tree Fagus sylvatica L. not the equatorial range edge. Glob. Chang. Biol. 2017, 23, 362–379. [Google Scholar] [CrossRef] [PubMed] [Green Version]
  19. Xu, K.; Wang, X.; Liang, P.; An, H.; Sun, H.; Han, W.; Li, Q. Tree-ring widths are good proxies of annual variation in forest productivity in temperate forests. Sci. Rep. 2017, 7, 1–8. [Google Scholar] [CrossRef] [Green Version]
  20. Moran, E.; Lauder, J.; Musser, C.; Stathos, A.; Shu, M. The genetics of drought tolerance in conifers. New Phytol. 2017, 216, 1034–1048. [Google Scholar] [CrossRef] [PubMed] [Green Version]
  21. Valladares, F.; Matesanz, S.; Guilhaumon, F.; Araújo, M.B.; Balaguer, L.; Benito-Garzón, M.; Cornwell, W.; Gianoli, E.; Kleunen, M.; Naya, D.E.; et al. The effects of phenotypic plasticity and local adaptation on forecasts of species range shifts under climate change. Ecol. Lett. 2014, 17, 1351–1364. [Google Scholar] [CrossRef] [Green Version]
  22. Li, X.; Blackman, C.J.; Choat, B.; Duursma, R.A.; Rymer, P.D.; Medlyn, B.E.; Tissue, D.T. Tree hydraulic traits are coordinated and strongly linked to climate-of-origin across a rainfall gradient. Plant. Cell Environ. 2018, 41, 646–660. [Google Scholar] [CrossRef] [PubMed]
  23. Restaino, C.M.; Peterson, D.L.; Littell, J. Increased water deficit decreases Douglas fir growth throughout western US forests. Proc. Natl. Acad. Sci. USA 2016, 113, 9557–9562. [Google Scholar] [CrossRef] [PubMed] [Green Version]
  24. Martín, J.A.; Esteban, L.G.; de Palacios, P.; Fernández, F.G. Variation in wood anatomical traits of Pinus sylvestris L. between Spanish regions of provenance. Trees-Struct. Funct. 2010, 24, 1017–1028. [Google Scholar] [CrossRef]
  25. Li, Y.; Suontama, M.; Burdon, R.D.; Dungey, H.S. Genotype by environment interactions in forest tree breeding: Review of methodology and perspectives on research and application. Tree Genet. Genomes 2017, 13, 1–18. [Google Scholar] [CrossRef] [Green Version]
  26. Matisons, R.; Elferts, D.; Krišāns, O.; Schneck, V.; Gärtner, H.; Bast, A.; Wojda, T.; Kowalczyk, J.; Jansons, Ā. Non-linear regional weather-growth relationships indicate limited adaptability of the eastern Baltic Scots pine. For. Ecol. Manag. 2021, 479, 118600. [Google Scholar] [CrossRef]
  27. Matisons, R.; Jansone, D.; Elferts, D.; Adamovičs, A.; Schneck, V.; Jansons, Ā. Plasticity of response of tree-ring width of Scots pine provenances to weather extremes in Latvia. Dendrochronologia 2019, 54, 1–10. [Google Scholar] [CrossRef]
  28. Leites, L.P.; Rehfeldt, G.E.; Robinson, A.P.; Crookston, N.L.; Jaquish, B. Possibilities and limitations of using historic provenance tests to infer forest species growth responses to climate change. Nat. Resour. Model. 2012, 25, 409–433. [Google Scholar] [CrossRef]
  29. Chakraborty, D.; Wang, T.; Andre, K.; Konnert, M.; Lexer, M.J.; Matulla, C.; Schueler, S. Selecting populations for non-analogous climate conditions using universal response functions: The case of Douglas-fir in Central Europe. PLoS ONE 2015, 10, e0136357. [Google Scholar] [CrossRef]
  30. de Villemereuil, P.; Gaggiotti, O.E.; Mouterde, M.; Till-Bottraud, I. Common garden experiments in the genomic era: New perspectives and opportunities. Heredity 2016, 116, 249–254. [Google Scholar] [CrossRef] [PubMed] [Green Version]
  31. Housset, J.M.; Nadeau, S.; Isabel, N.; Depardieu, C.; Duchesne, I.; Lenz, P.; Girardin, M.P. Tree rings provide a new class of phenotypes for genetic associations that foster insights into adaptation of conifers to climate change. New Phytol. 2018, 218, 630–645. [Google Scholar] [CrossRef] [Green Version]
  32. Zhang, Z.; Babst, F.; Bellassen, V.; Frank, D.; Launois, T.; Tan, K.; Ciais, P.; Poulter, B. Converging Climate Sensitivities of European Forests Between Observed Radial Tree Growth and Vegetation Models. Ecosystems 2018, 21, 410–425. [Google Scholar] [CrossRef] [Green Version]
  33. Rosner, S.; Světlík, J.; Andreassen, K.; Børja, I.; Dalsgaard, L.; Evans, R.; Karlsson, B.; Tollefsrud, M.M.; Solberg, S. Wood density as a screening trait for drought sensitivity in Norway spruce. Can. J. For. Res. 2013, 44, 154–161. [Google Scholar] [CrossRef]
  34. Henttonen, H.M.; Mäkinen, H.; Heiskanen, J.; Peltoniemi, M.; Laurén, A.; Hordo, M. Response of radial increment variation of Scots pine to temperature, precipitation and soil water content along a latitudinal gradient across Finland and Estonia. Agric. For. Meteorol. 2014, 198–199, 294–308. [Google Scholar] [CrossRef]
  35. Matisons, R.; Krišāns, O.; Kārkliņa, A.; Adamovičs, A.; Jansons, Ā.; Gärtner, H. Plasticity and climatic sensitivity of wood anatomy contribute to performance of eastern Baltic provenances of Scots pine. For. Ecol. Manag. 2019, 452, 117568. [Google Scholar] [CrossRef]
  36. Heer, K.; Behringer, D.; Piermattei, A.; Bässler, C.; Brandl, R.; Fady, B.; Jehl, H.; Liepelt, S.; Lorch, S.; Piotti, A.; et al. Linking dendroecology and association genetics in natural populations: Stress responses archived in tree rings associate with SNP genotypes in silver fir (Abies alba Mill.). Mol. Ecol. 2018, 27, 1428–1438. [Google Scholar] [CrossRef]
  37. Cuny, H.E.; Fonti, P.; Rathgeber, C.B.K.; Arx, G.; Peters, R.L.; Frank, D.C. Couplings in cell differentiation kinetics mitigate air temperature influence on conifer wood anatomy. Plant. Cell Environ. 2019, 42, 1222–1232. [Google Scholar] [CrossRef] [PubMed]
  38. Jyske, T.; Mäkinen, H.; Kalliokoski, T.; Nöjd, P. Intra-annual tracheid production of Norway spruce and Scots pine across a latitudinal gradient in Finland. Agric. For. Meteorol. 2014, 194, 241–254. [Google Scholar] [CrossRef]
  39. Wilmking, M.; Maaten-Theunissen, M.; Maaten, E.; Scharnweber, T.; Buras, A.; Biermann, C.; Gurskaya, M.; Hallinger, M.; Lange, J.; Shetti, R.; et al. Global assessment of relationships between climate and tree growth. Glob. Chang. Biol. 2020, 26, 3212–3220. [Google Scholar] [CrossRef] [Green Version]
  40. Billings, S.A.; Glaser, S.M.; Boone, A.S.; Stephen, F.M. Nonlinear tree growth dynamics predict resilience to disturbance. Ecosphere 2015, 6, art242. [Google Scholar] [CrossRef] [Green Version]
  41. Hofgaard, A.; Ols, C.; Drobyshev, I.; Kirchhefer, A.J.; Sandberg, S.; Söderström, L. Non-stationary response of tree growth to climate trends along the arctic margin. Ecosystems 2019, 22, 434–451. [Google Scholar] [CrossRef] [Green Version]
  42. Lloyd, A.H.; Duffy, P.A.; Mann, D.H. Nonlinear responses of white spruce growth to climate variability in interior Alaska. Can. J. For. Res. 2013, 43, 331–343. [Google Scholar] [CrossRef]
  43. Way, D.A.; Oren, R. Differential responses to changes in growth temperature between trees from different functional groups and biomes: A review and synthesis of data. Tree Physiol. 2010, 30, 669–688. [Google Scholar] [CrossRef] [PubMed] [Green Version]
  44. Matías, L.; Linares, J.C.; Sánchez-Miranda, Á.; Jump, A.S. Contrasting growth forecasts across the geographical range of Scots pine due to altitudinal and latitudinal differences in climatic sensitivity. Glob. Chang. Biol. 2017, 23, 4106–4116. [Google Scholar] [CrossRef]
  45. Brzeziecki, B.; Kienast, F. Classifying the life-history strategies of trees on the basis of the Grimian model. For. Ecol. Manag. 1994, 69, 167–187. [Google Scholar] [CrossRef]
  46. Hytteborn, H.; Maslov, A.; Nazimova, D.; Rysin, L.P. Boreal forests of Eurasia. In Coniferous Forests, Ecosystems of the World; Elsevier: Amsterdam, The Netherlands, 2005; pp. 23–99. [Google Scholar]
  47. Jansson, G.; Hansen, J.K.; Haapanen, M.; Kvaalen, H.; Steffenrem, A. The genetic and economic gains from forest tree breeding programmes in Scandinavia and Finland. Scand. J. For. Res. 2017, 32, 273–286. [Google Scholar] [CrossRef]
  48. Dering, M.; Kosiński, P.; Wyka, T.P.; Pers-Kamczyc, E.; Boratyński, A.; Boratyńska, K.; Reich, P.B.; Romo, A.; Zadworny, M.; Żytkowiak, R.; et al. Tertiary remnants and Holocene colonizers: Genetic structure and phylogeography of Scots pine reveal higher genetic diversity in young boreal than in relict Mediterranean populations and a dual colonization of Fennoscandia. Divers. Distrib. 2017, 23, 540–555. [Google Scholar] [CrossRef] [Green Version]
  49. Giertych, M.; Mátyás, C. Genetics of Scots Pine; Elsevier: Amsterdam, The Netherlands, 1991; Volume 3, ISBN 9781483291635. [Google Scholar]
  50. Martínez-Vilalta, J.; Sala, A.; Piñol, J. The hydraulic architecture of Pinaceae—A review. Plant Ecol. 2004, 171, 3–13. [Google Scholar] [CrossRef]
  51. Loehle, C. Height growth rate tradeoffs determine northern and southern range limits for trees. J. Biogeogr. 1998, 25, 735–742. [Google Scholar] [CrossRef]
  52. Taeger, S.; Zang, C.; Liesebach, M.; Schneck, V.; Menzel, A. Impact of climate and drought events on the growth of Scots pine (Pinus sylvestris L.) provenances. For. Ecol. Manag. 2013, 307, 30–42. [Google Scholar] [CrossRef]
  53. Grattapaglia, D.; Silva-Junior, O.B.; Resende, R.T.; Cappa, E.P.; Müller, B.S.; Tan, B.; Isik, F.; Ratcliffe, B.; El-Kassaby, Y.A. Quantitative genetics and genomics converge to accelerate forest tree breeding. Front. Plant Sci. 2018, 9, 1693. [Google Scholar] [CrossRef] [PubMed]
  54. Kohlstock, N.; Schneck, H. Scots pine breeding (Pinus sylvestris L.) at Waldsieversdorf and its impact on pine management in the north eastern German lowland. Silvae Genet. 1992, 41, 174–180. [Google Scholar]
  55. Jansons, Ā.; Baumanis, I. Growth dynamics of scots pine geographical provenances in Latvia. Balt. For. 2005, 11, 29–37. [Google Scholar]
  56. Hartmann, D.L.; Klein Tank, A.M.G.; Rusticucci, M.; Alexander, L.V.; Brönnimann, S.; Charabi, Y.A.R.; Dentener, F.J.; Dlugokencky, E.J.; Easterling, D.R.; Kaplan, A.; et al. Observations: Atmosphere and surface. In Climate Change 2013 the Physical Science Basis: Working Group I Contribution to the Fifth Assessment Report of the Intergovernmental Panel on Climate Change; Cambridge University Press: Cambridge, UK, 2013; Volume 9781107057999, pp. 159–254. ISBN 9781107415324. [Google Scholar]
  57. Peel, M.C.; Finlayson, B.L.; McMahon, T.A. Updated world map of the Köppen-Geiger climate classification. Hydrol. Earth Syst. Sci. 2007, 11, 1633–1644. [Google Scholar] [CrossRef] [Green Version]
  58. Avotniece, Z.; Klavins, M.; Rodinovs, V. Changes of extreme climate events in Latvia. Environ. Clim. Technol. 2012, 9, 4–11. [Google Scholar] [CrossRef] [Green Version]
  59. Taeger, S.; Sparks, T.H.; Menzel, A. Effects of temperature and drought manipulations on seedlings of Scots pine provenances. Plant Biol. 2015, 17, 361–372. [Google Scholar] [CrossRef] [PubMed]
  60. Gärtner, H.; Nievergelt, D. The core-microtome: A new tool for surface preparation on cores and time series analysis of varying cell parameters. Dendrochronologia 2010, 28, 85–92. [Google Scholar] [CrossRef]
  61. Holmes, R. Computer-assisted quality control in tree-ring dating and measurement. Tree-Ring Bull. 1983, 43, 69–78. [Google Scholar]
  62. Wigley, T.M.L.; Briffa, K.R.; Jones, P.D. On the average value of correlated time series with applications in dendroclimatology and hydrometeorology. J. Clim. Appl. Meteorol. 1984, 23, 201–213. [Google Scholar] [CrossRef]
  63. Cook, E.R. The decomposition of tree-ring series for environmental studies. Tree Ring Bull. 1987, 47, 37–59. [Google Scholar]
  64. Bunn, A.G. A dendrochronology program library in R (dplR). Dendrochronologia 2008, 26, 115–124. [Google Scholar] [CrossRef]
  65. Zang, C.; Biondi, F. Dendroclimatic calibration in R: The bootRes package for response and correlation function analysis. Dendrochronologia 2013, 31, 68–74. [Google Scholar] [CrossRef]
  66. Vicente-Serrano, S.M.; Beguería, S.; López-Moreno, J.I. A multiscalar drought index sensitive to global warming: The standardized precipitation evapotranspiration index. J. Clim. 2010, 23, 1696–1718. [Google Scholar] [CrossRef] [Green Version]
  67. Harris, I.; Osborn, T.J.; Jones, P.; Lister, D. Version 4 of the CRU TS monthly high-resolution gridded multivariate climate dataset. Sci. Data 2020, 7, 1–18. [Google Scholar] [CrossRef] [Green Version]
  68. Wood, S.N. Fast stable restricted maximum likelihood and marginal likelihood estimation of semiparametric generalized linear models. J. R. Stat. Soc. Ser. B (Stat. Methodol.) 2011, 73, 3–36. [Google Scholar] [CrossRef] [Green Version]
  69. von Arx, G.; Arzac, A.; Fonti, P.; Frank, D.; Zweifel, R.; Rigling, A.; Galiano, L.; Gessler, A.; Olano, J.M. Responses of sapwood ray parenchyma and non-structural carbohydrates of Pinus sylvestris to drought and long-term irrigation. Funct. Ecol. 2017, 31, 1371–1382. [Google Scholar] [CrossRef] [Green Version]
  70. Olsson, T.; Ericsson, T. Genetic parameter estimates of growth and survival of Pinus sylvestris with mixed model multiple-trait restricted maximum likelihood analysis. Scand. J. For. Res. 2002, 17, 103–110. [Google Scholar] [CrossRef]
  71. R Core Team R: A Language and Environment for Statistical Computing. R Foundation for Statistical Computing, Vienna, Austria. Available online: http://www.r-project.org/ (accessed on 5 December 2019).
  72. Fox, J.; Weisberg, S. An R Companion to Applied Regression, Second ed. Available online: https://socialsciences.mcmaster.ca/jfox/Books/Companion/ (accessed on 12 March 2021).
  73. Ohse, B.; Ohse, B.; Jansen, F.; Wilmking, M. Do limiting factors at Alaskan treelines shift with climatic regimes? Environ. Res. Lett. 2012, 7, 015505. [Google Scholar] [CrossRef]
  74. Carrer, M.; Urbinati, C. Long-term change in the sensitivity of tree-ring growth to climate forcing in Larix decidua. New Phytol. 2006, 170, 861–872. [Google Scholar] [CrossRef] [PubMed]
  75. Carrer, M.; Nola, P.; Motta, R.; Urbinati, C. Contrasting tree-ring growth to climate responses of Abies alba toward the southern limit of its distribution area. Oikos 2010, 119, 1515–1525. [Google Scholar] [CrossRef]
  76. Merlin, M.; Perot, T.; Perret, S.; Korboulewsky, N.; Vallet, P. Effects of stand composition and tree size on resistance and resilience to drought in sessile oak and Scots pine. For. Ecol. Manag. 2015, 339, 22–33. [Google Scholar] [CrossRef] [Green Version]
  77. Vázquez-González, C.; Sampedro, L.; Rozas, V.; Zas, R. Climate drives intraspecific differentiation in the expression of growth-defence trade-offs in a long-lived pine species. Sci. Rep. 2020, 10, 1–10. [Google Scholar] [CrossRef]
  78. Glasner, E.; Weiss, B. Sensitive dependence on initial conditions. Nonlinearity 1993, 6, 1067. [Google Scholar] [CrossRef] [Green Version]
  79. Cuny, H.E.; Rathgeber, C.B.K.; Lebourgeois, F.; Fortin, M.; Fournier, M. Life strategies in intra-annual dynamics of wood formation: Example of three conifer species in a temperate forest in north-east France. Tree Physiol. 2012, 32, 612–625. [Google Scholar] [CrossRef] [Green Version]
  80. Herms, D.A.; Mattson, W.J. The dilemma of plants: To grow or defend. Q. Rev. Biol. 1992, 67, 283–335. [Google Scholar] [CrossRef] [Green Version]
  81. Lloret, F.; Keeling, E.G.; Sala, A. Components of tree resilience: Effects of successive low-growth episodes in old ponderosa pine forests. Oikos 2011, 120, 1909–1920. [Google Scholar] [CrossRef]
  82. Bréda, N.; Huc, R.; Granier, A.; Dreyer, E. Temperate forest trees and stands under severe drought: A review of ecophysiological responses, adaptation processes and long-term consequences. Ann. For. Sci. 2006, 63, 625–644. [Google Scholar] [CrossRef] [Green Version]
  83. Castagneri, D.; Fonti, P.; von Arx, G.; Carrer, M. How does climate influence xylem morphogenesis over the growing season? Insights from long-term intra-ring anatomy in Picea abies. Ann. Bot. 2017, 119, mcw274. [Google Scholar] [CrossRef] [PubMed] [Green Version]
  84. Yang, X.; Tang, J.; Mustard, J.F.; Lee, J.-E.; Rossini, M.; Joiner, J.; Munger, J.W.; Kornfeld, A.; Richardson, A.D. Solar-induced chlorophyll fluorescence that correlates with canopy photosynthesis on diurnal and seasonal scales in a temperate deciduous forest. Geophys. Res. Lett. 2015, 42, 2977–2987. [Google Scholar] [CrossRef]
  85. Rathgeber, C.B.K.; Cuny, H.E.; Fonti, P. Biological basis of tree-ring formation: A crash course. Front. Plant Sci. 2016, 7, 734. [Google Scholar] [CrossRef] [Green Version]
  86. Hansen, J.; Beck, E. Seasonal changes in the utilization and turnover of assimilation products in 8-year-old Scots pine (Pinus sylvestris L.) trees. Trees 1994, 8, 172–182. [Google Scholar] [CrossRef]
  87. Popkova, M.I.; Vaganov, E.A.; Shishov, V.V.; Babushkina, E.A.; Rossi, S.; Fonti, M.V.; Fonti, P. Modeled tracheidograms disclose drought influence on Pinus sylvestris tree-rings structure from siberian forest-steppe. Front. Plant Sci. 2018, 9, 1144. [Google Scholar] [CrossRef]
  88. Strand, M.; Löfvenius, M.O.; Bergsten, U.; Lundmark, T.; Rosvall, O. Height growth of planted conifer seedlings in relation to solar radiation and position in Scots pine shelterwood. Forest Ecol. Manag. 2006, 224, 258–265. [Google Scholar] [CrossRef]
  89. Fonti, M.V.; Vaganov, E.A.; Wirth, C.; Shashkin, A.V.; Astrakhantseva, N.V.; Schulze, E.-D. Age-Effect on Intra-Annual δ13C-Variability within Scots Pine Tree-Rings from Central Siberia. Forests 2018, 9, 364. [Google Scholar] [CrossRef] [Green Version]
  90. Lanner, R.M. Patterns of shoot development in Pinus and their relationship to growth potential. In Tree Physiology and Yield Improvement; Cannell, M.G.R., Last, F.T., Eds.; Academic Press: London, UK, 1976; pp. 223–243. [Google Scholar]
  91. Hacket-Pain, A.J.; Ascoli, D.; Vacchiano, G.; Biondi, F.; Cavin, L.; Conedera, M.; Drobyshev, I.; Liñán, I.D.; Friend, A.D.; Grabner, M.; et al. Climatically controlled reproduction drives interannual growth variability in a temperate tree species. Ecol. Lett. 2018, 21, 1833–1844. [Google Scholar] [CrossRef] [PubMed] [Green Version]
  92. Tierney, G.L.; Fahey, T.J.; Groffman, P.M.; Hardy, J.P.; Fitzhugh, R.D.; Driscoll, C.T. Soil freezing alters fine root dynamics in a northern hardwood forest. Biogeochemistry 2001, 56, 175–190. [Google Scholar] [CrossRef]
  93. Martin-Benito, D.; Beeckman, H.; Cañellas, I. Influence of drought on tree rings and tracheid features of Pinus nigra and Pinus sylvestris in a mesic Mediterranean forest. Eur. J. For. Res. 2012, 132, 33–45. [Google Scholar] [CrossRef]
Figure 1. Location of the studied trials (circles) and origins of the studied provenances (squares) of Scots pine.
Forests 12 01641 g001
Figure 2. Residual chronologies of tree-ring width of the studied provenances of Scots pine according to trial. The mean interseries correlation between the chronologies by trial are indicated in the panels (mean r).
Forests 12 01641 g002
Figure 3. Bootstrapped Pearson correlation coefficients between the time series of annual relative radial additional increment (represented by the residual chronologies) of the studied south-eastern Baltic provenance of Scots pine and local (by trial) meteorological variables: mean monthly temperature (Temp.), precipitation (Prec.), and standardized precipitation-evapotranspiration index (SPEI) for the period 1985–2017. Only the variables showing significant correlations with increment (at α = 0.05) are shown; the significant correlations are highlighted by asterisks. The results are summarized by country for clarity. Prev. indicates conditions in the year preceding formation of tree-ring.
Forests 12 01641 g003
Figure 4. Estimated response splines of relative annual additional radial increment (represented by the residual chronologies) of the studied south-eastern Baltic provenance of Scots pine to meteorological variables: monthly mean temperature (Temp.), precipitation (Prec.), and standardized precipitation-evapotranspiration index (SPEI) for the year of tree-ring formation as well as previous (prev.) year across the south-eastern Baltic climatic gradient during the period 1985–2017. Confidence intervals of the response splines omitted for clarity. The legend corresponds to all panels. For provenance codes see Table 2.
Forests 12 01641 g004
Table 1. Location (in decimal degrees) and general climatic description (mean temperature and precipitation sums for the period 1988–2017) of the studied parallel provenance trials of Scots pine.
LIZVKAWSNL
VicinityLiepaja (Latvia)Zvirgzde (Latvia)Kalsnava (Latvia)Waldsieversdorf (Germany)Nedlitz (Germany)
Latitude, °N56.4556.6556.852.5352.02
Longitude, °E21.6324.3725.9314.0512.33
Elevation, m a.s.l.155022060115
Annual temperature7.5 ± 0.67.2 ± 0.76.4 ± 0.79.2 ± 0.79.6 ± 0.6
May–September temperature15.0 ± 0.715.2 ± 0.814.8 ± 0.816.2 ± 0.716.6 ± 0.07
January temperature −1.9 ± 2.4−3 ± 2.6−4.2 ± 2.70.1 ± 2.50.4 ± 2.4
July temperature17.8 ± 1.618.2 ± 1.617.9 ± 1.618.7 ± 1.619.3 ± 1.7
Annual precipitation sum789 ± 91659 ± 75689 ± 81568 ± 80662 ± 73
May–September precipitation sum353 ± 71333 ± 63349 ± 66290 ± 66294 ± 59
Table 2. Location (in decimal degrees) and general climatic description (mean temperature and precipitation sums for the period 1946–1975) of the origin of the studied provenances (from southern Poland, Northern Germany, and Latvia) of Scots pine.
Dippoldiswalde (DIP)Eibenstock (EBN)Kalsnava (KAL)Güstrow (GUS)Rytel (RYT)
Latitude, °N50.8250.4556.753.7553.67
Longitude, °E13.8712.4325.912.2518.02
Elevation, m a.s.l.59071019025130
Annual temperature, °C6.66.06.387.9
Temperature May–September, °C13.112.514.614.815
Temperature Jan, °C−2.5−3.1−4.3−0.9−1.4
Temperature Jul, °C15.314.818.016.817.2
Annual precipitation, mm 809993650586597
Precipitation May–September, mm405501340303301
Table 3. Statistics of the crossdated datasets of tree-ring width time series of the studied south-eastern Baltic provenances of Scots pine (from southern Poland, Northern Germany, and Latvia) by the trials for the period 1985–2017. N—number of crossdated trees, TRW—mean tree-ring width (±standard deviation), r-bar—mean interseries correlation, GINI—Gini coefficients, AC1—first order autocorrelation, SENS –mean sensitivity, SNR—signal-to-noise ratio, and EPS—expressed population signal.
TrialProvenanceNTRWr-barGINIAC1SENSSNREPS
LIDIP122.58 ± 1.570.440.340.790.2411.360.92
LIEBN112.87 ± 1.320.360.250.800.207.690.88
LIGUS113.30 ± 1.620.360.270.780.197.650.88
LIKAL123.07 ± 1.450.330.250.780.197.280.88
LIRYT123.38 ± 1.740.370.270.820.198.780.90
ZVDIP92.00 ± 1.060.430.300.770.239.040.90
ZVEBN92.11 ± 1.190.410.310.790.238.390.89
ZVGUS102.45 ± 1.110.410.240.800.198.580.90
ZVKAL102.25 ± 1.010.410.250.770.219.140.90
ZVRYT102.86 ± 1.250.380.230.680.227.840.89
KADIP102.02 ± 0.940.340.270.770.236.760.87
KAEBN132.02 ± 1.020.390.280.780.2410.260.91
KAGUS122.37 ± 0.970.420.230.740.2210.880.92
KAKAL142.36 ± 0.900.370.220.700.219.870.91
KARYT122.77 ± 1.000.440.200.750.1911.500.92
NLDIP122.21 ± 0.980.300.230.580.266.190.86
NLEBN132.09 ± 0.840.350.210.600.248.480.90
NLGUS132.33 ± 0.890.370.200.590.259.240.90
NLKAL132.07 ± 0.740.370.190.460.279.550.90
NLRYT152.55 ± 0.750.370.160.450.2310.600.91
WSDIP132.18 ± 1.220.460.270.520.3013.430.93
WSEBN122.22 ± 1.100.440.250.480.3111.530.92
WSGUS152.35 ± 1.040.550.220.520.2721.880.96
WSKAL122.27 ± 1.040.530.240.490.3016.760.94
WSRYT162.36 ± 0.910.480.200.450.2617.450.95
Table 4. The effective degrees of freedom, strength (F-values shown in brackets) and significance of the fixed effects (meteorological variables), variances of random effects, and overall statistics of models of weather–growth relationships for the studied south-eastern Baltic provenance of Scots pine. The presented meteorological variables are monthly mean temperature (Temp.), precipitation (Prec.), and standardized precipitation-evapotranspiration index (SPEI) for the year of tree-ring formation as well as previous (prev.) year for the period 1985–2017. Significance codes, p-values: * < 0.05, ** < 0.01, *** < 0.001. For provenance codes see Table 2.
DIPEBNKALRYTGUS
Fixed effects, effective degree of freedom and F-value
Temp. prev. June1.00 (30.6) ***1.00 (31.2) ***1.76 (10.46) ***1.78 (7.5) ***1.00 (10.45) **
Temp. March1.57 (3.1)1.00 (5.06) *1.00 (3.57)1.47 (4.78) *1.00 (7.28) **
Temp. May1.89 (9.29) **1.94 (14.28) ***1.94 (17.44) ***1.93 (11.23) ***1.96 (20.94) ***
Temp. July1.35 (10.02) ***1.91 (8.34) ***1.62 (5.30) **1.89 (10.03) **1.96 (16.08) ***
Prec. prev. August1.27 (20.56) ***1.63 (8.45) **1.00 (10.41) **1.80 (13.59) ***1.00 (18.89) ***
Prec. prev. December1.92 (7.34) **1.11 (1.32)1.85 (9.49) **1.62 (6.37) *1.89 (8.02) **
SPEI. May1.90 (12.64) ***1.28 (9.36) **1.00 (15.16) ***1.66 (38.78) ***1.00 (29.02) ***
SPEI. June1.69 (1.69)1.87 (3.38)1.92 (6.99) **1.93 (12.99) ***1.94 (19.08) ***
SPEI. July1.51 (8.09) *1.00 (13.5) ***1.00 (10.39) **1.00 (31.23) ***1.66 (21.33) ***
Random effects, variance
Year2.03 × 10−31.00 × 10−63.24 × 10−41.21 × 10−46.25 × 10−4
Trial7.94 × 10−31.02 × 10−28.10 × 10−37.06 × 10−37.92 × 10−3
Replication1.00 × 10−61.00 × 10−61.00 × 10−61.00 × 10−61.00 × 10−6
Tree3.39 × 10−22.92 × 10−23.88 × 10−22.13 × 10−22.31 × 10−2
Residual3.60 × 10−51.21 × 10−42.50 × 10−54.90 × 10−54.00 × 10−6
Model performance
Adjusted R2 0.280.240.210.280.30
RMSE0.210.190.210.170.18
RMSE (verification)0.190.180.180.170.18
Publisher’s Note: MDPI stays neutral with regard to jurisdictional claims in published maps and institutional affiliations.

