
The Effects of Natural and Economic Factors on the Financial Performance of Forest Management Units: The Example of Forest Districts of the State Forests National Forest Holding from Eastern Poland


Abstract
1. Introduction
- (1)
- Analysis of the financial performance of forest districts based on data from the years 2015–2019 and their comparison with those for 2005–2009;
- (2)
- Analysis of relationships between synthetic financial indicators and selected natural and economic factors;
- (3)
- A comparison of synthetic financial indicators based on different methodological models and the verification of their usefulness for assessing the financial performance of forest districts.
2. Materials and Methods
2.1. Characteristics of the Financial Management of the State Forests National Forest Holding and the Subject Matter of the Study
2.2. Data
2.3. Classification Criteria and Categories of Forest Districts
- —area of the i-th group of forest sites;
- —degree of fertility of the i-th group of forest sites;
- U—the percentage share of stands with a given degree of stand-site compatibility;
- p—area of stands with a given degree of stand-site compatibility;
- P—total area of stands in the forest district;
2.4. Ratio Analysis as a Tool for Evaluating the Financial Performance of Forest Districts
2.5. Evaluation of the Financial Performance of Forest Districts Using Synthetic Financial Indicators
- (1)
- Synthetic indicator 1—built according to the State Forests’ Universal Model, excluding Forest Fund transfers from financial records;
- (2)
- Synthetic indicator 2—built according to the Universal Model, including Forest Fund transfers in financial records;
- (3)
- Synthetic indicator 3—built according to the model proposed by A. Buraczewski and F. Wysocki [73], excluding Forest Fund transfers from financial records.
- matrix rows (n = 1 … N) represent forest districts;
- matrix columns (k = 1 … K) represent financial indicators calculated for the forest districts.
- zi—value of the synthetic indicator,
- zik—value of the normalized variable.
2.6. Data Analysis Methods
3. Results
3.1. Forest District Classification according to Natural and Economic Criteria
3.2. The Financial Performance of Forest Districts as Measured by Indicators
3.3. Relationships between Natural Factors and the Synthetic Indicators
3.3.1. Forest Site Types
3.3.2. Forest Site Fertility
3.3.3. Compatibility between Stand Species Composition and Forest Site Type
3.3.4. Tree Species Composition
3.4. Relationships between Economic Factors and the Synthetic Indicators
3.4.1. Felling System
3.4.2. Timber Harvest Intensity
3.4.3. Fragmentation of Forest Complexes
3.4.4. Management Difficulty Level
3.5. The Financial Performance of Forest Districts Evaluated by the Synthetic Indicators
4. Discussion
5. Conclusions
Author Contributions
Funding
Acknowledgments
Conflicts of Interest
Appendix A

| Category/ N-Number of Forest Districts | I (n = 20) | II (n = 20) | III (n = 24) | IV (n = 9) | V (n = 9) | Object (n = 82) |
|---|---|---|---|---|---|---|
| FST [%] | ||||||
| FCF | 33.19 | 12.95 | 3.03 | 0.62 | 0.00 | 12.99 |
| MCF | 4.29 | 0.66 | 0.41 | 0.00 | 0.00 | 1.43 |
| FMCF | 26.68 | 34.96 | 14.30 | 1.07 | 0.00 | 19.74 |
| MMCF | 9.77 | 4.89 | 2.21 | 0.32 | 0.00 | 4.47 |
| FMBF | 7.05 | 23.17 | 28.77 | 2.84 | 0.00 | 15.87 |
| MMBF | 4.30 | 3.86 | 4.78 | 0.24 | 0.00 | 3.46 |
| BMBF | 2.57 | 2.54 | 2.08 | 0.00 | 0.00 | 1.89 |
| FBF | 2.27 | 9.09 | 30.97 | 1.85 | 0.16 | 11.74 |
| MBF | 0.87 | 1.77 | 5.06 | 0.16 | 0.02 | 2.11 |
| ASF | 3.10 | 3.10 | 3.51 | 0.30 | 0.00 | 2.60 |
| AASF | 1.04 | 1.63 | 2.15 | 0.11 | 0.01 | 1.29 |
| FUBF | 1.26 | 0.00 | 1.09 | 72.72 | 7.62 | 8.22 |
| FMontBF | 0.00 | 0.00 | 0.00 | 14.51 | 88.87 | 11.56 |
| Category | Range of the Value of the Forest Site Fertility Index | Average Value for the Category | |
|---|---|---|---|
| Values from | Values to | ||
| I Very poor (n = 14) | 2.171 | 2.946 | 2.635 |
| II Poor (n = 27) | 3.022 | 3.620 | 3.300 |
| III Fertile (n = 21) | 3.681 | 4.256 | 3.986 |
| IV Very fertile (n = 20) | 4.523 | 4.974 | 4.857 |
| Total (n = 82) | 2.171 | 4.974 | 3.694 |
| Category | Number of Forest Districts | The Range of Indicator Values in the Category | Average Index Value in the Category | |
|---|---|---|---|---|
| Values from | Values to | |||
| Incompatible | 22 | −0.13 | 0.89 | 0.58 |
| Partially compatible | 28 | 0.94 | 1.41 | 1.23 |
| Compatible | 32 | 1.44 | 1.94 | 1.62 |
| Total | 82 | −0.13 | 1.94 | 1.14 |
| Category | Number of Forest Districts | Volume Share [%] | ||||
|---|---|---|---|---|---|---|
| Pine | Spruce | Fir | Oak | Beech | ||
| I (Pine) | 50 | 85.5 | 6.4 | 1.1 | 5.2 | 1.7 |
| II (Oak-pine) | 9 | 63.8 | 4.0 | 0.0 | 29.5 | 2.7 |
| III (Pine-spruce) | 7 | 24.1 | 66.6 | 0.0 | 9.3 | 0.0 |
| IV (Fir-beech) | 16 | 17.2 | 3.6 | 35.2 | 2.2 | 41.9 |
| Total | 82 | 62.3 | 12.1 | 8.3 | 7.0 | 10.3 |
| Category | Number of Forest Districts | Felling System [%] | |
|---|---|---|---|
| Clear Cutting | Mixed (Selective) | ||
| I (Clear cutting) | 26 | 74.82 | 25.18 |
| II (Mixed) | 21 | 45.13 | 54.87 |
| III (Selective cutting) | 35 | 4.71 | 95.29 |
| Total | 82 | 38.22 | 61.78 |
| Category | Number of Forest Districts | Timber Harvesting Intensity [m3/ha] | Average Timber Harvest for the Category | |
|---|---|---|---|---|
| Minimum | Maximum | |||
| Medium | 16 | 1.28 | 3.38 | 2.81 |
| High | 36 | 3.42 | 4.59 | 3.99 |
| Very high | 30 | 4.69 | 6.20 | 5.22 |
| Total | 82 | 1.28 | 6.20 | 4.01 |
| Category | Number of Forest Districts | Range of Values of Land Selection in a Forest District | Average | |
|---|---|---|---|---|
| Values from | Values to | |||
| I High | 41 | 1.05 | 3.96 | 2.55 |
| II Medium | 29 | 4.49 | 8.76 | 6.18 |
| III Low | 12 | 9.29 | 19.79 | 11.95 |
| Total | 82 | 1.05 | 19.79 | 6.89 |
| Category of Forest District | Number of Forest Districts | The Range of Economic Difficulty for the Category | Average | |
|---|---|---|---|---|
| Minimum | Maximum | |||
| I “Very easy” | 6 | 15.231 | 17.820 | 16.593 |
| II “Easy” | 26 | 18.934 | 22.298 | 20.715 |
| III “Difficult” | 37 | 22.424 | 25.984 | 23.956 |
| IV “Very difficult” | 13 | 26.611 | 31.846 | 28.704 |
| Total | 82 | 15.231 | 31.846 | 22.492 |
References
- Kangas, J.; Leskinen, P.; Pukkala, T. Integrating timber price scenario modeling with tactical management planning of private forestry at forest holding level. Silva Fenn. 2000, 34, 399–409. [Google Scholar] [CrossRef][Green Version]
- Yousefpour, R.; Jacobsen, J.B.; Thorsen, B.J.; Meilby, H.; Hanewinkel, M.; Oehler, K. A review of decision-making approaches to handle uncertainty and risk in adaptive forest management under climate change. Ann. For. Sci. 2012, 69, 1–15. [Google Scholar] [CrossRef]
- Hanewinkel, M.; Cullmann, D.; Schelhaas, M.J. Climate change may cause severe loss in the economic value of European forest land. Nat. Clim. Chang. 2013, 3, 203–207. [Google Scholar] [CrossRef]
- Maksymets, O.; Lönnstedt, L. Trends in Markets for Forest-Based Products and Consequences for Selected Countries. Open J. For. 2015, 5, 697–710. [Google Scholar] [CrossRef]
- Brecka, A.F.J.; Shahi, C.; Chen, H.Y.H. Climate change impacts on boreal forest timber supply. For. Policy Econ. 2018, 92, 11–21. [Google Scholar] [CrossRef]
- Kao, C.J. Measuring the efficiency of forest districts with multiple working circles. J. Oper. Res. Soc. 1998, 49, 583–590. [Google Scholar] [CrossRef]
- Młynarski, W.; Prędki, A. Metoda DEA w badaniu efektywności nadleśnictw. Sylwan 2017, 161, 1018–1025. [Google Scholar]
- Siry, J.P.; Newman, D.H. A Stochastic Production Frontier Analysis of Polish State Forests. For. Sci. 2001, 47, 526–533. [Google Scholar]
- Xiong, L.; Wang, F.; Cheng, B.; Yu, C. Identifying factors influencing the forestry production efficiency in Northwest China. Resour. Conserv. Recycl. 2018, 130, 12–19. [Google Scholar] [CrossRef]
- Młynarski, W.; Prędki, A.; Kaliszewski, A. Efficiency and factors influencing it in forest districts in southern Poland: Application of Data Envelopment Analysis. For. Policy Econ. 2021, 130, 102530. [Google Scholar] [CrossRef]
- Costa, M.P.; Schoeneboom, J.C.; Oliveira, S.A.; Viñas, R.S.; de Medeiros, G.A. A socio-eco-efficiency analysis of integrated and non-integrated crop-livestock-forestry systems in the Brazilian Cerrado based on LCA. J. Clean. Prod. 2018, 171, 1460–1471. [Google Scholar] [CrossRef]
- Pezdevšek Malovrh, Š.; Paletto, A.; Posavec, S.; Dobšinská, Z.; Đorđević, I.; Marić, B.; Avdibegović, M.; Kitchoukov, E.; Stijović, A.; Trajkov, P.; et al. Evaluation of the Operational Environment Factors of Nature Conservation Policy Implementation: Cases of Selected EU and Non-EU Countries. Forests 2019, 10, 1099. [Google Scholar] [CrossRef]
- Chen, S.; Yao, S. Evaluation of Forestry Ecological Efficiency: A Spatiotemporal Empirical Study Based on China’s Provinces. Forests 2021, 12, 142. [Google Scholar] [CrossRef]
- Brockerhoff, E.G.; Barbaro, L.; Castagneyrol, B.; Forrester, D.I.; Gardiner, B.; González-Olabarria, J.R.; Lyver, P.O.; Meurisse, N.; Oxbrough, A.; Taki, H.; et al. Forest biodiversity, ecosystem functioning and the provision of ecosystem services. Biodivers Conserv. 2017, 26, 3005–3035. [Google Scholar] [CrossRef]
- Lundmark, R.; Lundgren, T.; Olofsson, E.; Zhou, W. Meeting Challenges in Forestry: Improving Performance and Competitiveness. Forests 2021, 12, 208. [Google Scholar] [CrossRef]
- Maesano, M.; Ottaviano, M.; Lidestav, G.; Lasserre, B.; Matteucci, G.; Scarascia Mugnozza, G.; Marchetti, M. Forest certification map of Europe. iFor.—Biogeosci. For. 2018, 11, 526–533. [Google Scholar] [CrossRef]
- Schou, E.; Thorsen, B.J.; Jacobsen, J.B. Regeneration decisions in forestry under climate change related uncertainties and risks: Effects of three different aspects of uncertainty. For. Policy Econ. 2015, 50, 11–19. [Google Scholar] [CrossRef]
- Andersson, E.; Keskitalo, E.C.H. Adaptation to climate change? Why business-as-usual remains the logical choice in Swedish forestry. Glob. Environ. Chang. 2018, 48, 76–85. [Google Scholar] [CrossRef]
- Neykov, N.; Krišťáková, S.; Hajdúchová, I.; Sedliačiková, M.; Antov, P.; Giertliová, B. Economic Efficiency of Forest Enterprises—Empirical Study Based on Data Envelopment Analysis. Forests 2021, 12, 462. [Google Scholar] [CrossRef]
- Kuźma, M. Financial management of State Forests National Forest Holding in relation to challenges of sustainable development of forestry. Optimum 2018, 94, 87–95. [Google Scholar] [CrossRef]
- Buraczewski, A.; Jarosz, K. Podstawości i Gospodarki Finansowej w Lasach Państwowych; Wydawnictwo Akademii Rolniczej im. Augusta Cieszkowskiego: Poznań, Poland, 2005; ISBN 8371603770. [Google Scholar]
- Li, Y.; Zhang, D. Industrial Timberland Ownership and Financial Performance of US Forest Products Companies. For. Sci. 2014, 60, 569–578. [Google Scholar] [CrossRef]
- Adamowicz, K.; Szczypa, P. Możliwości wykorzystania rachunkowości zarządczej w Lasach Państwowych. Pr. Nauk. Uniw. Ekon. We Wrocławiu 2014, 344, 13–24. [Google Scholar] [CrossRef]
- Pagde, A.; Kim, Y.; Daugherty, P.J. What Makes Community Forest Management Successful: A Meta-Study from Community Forests throughout the World. Soc. Nat. Resour. 2006, 19, 33–52. [Google Scholar] [CrossRef]
- Susaeta, A.; Adams, D.C.; Carter, D.R.; Gonzalez-Benecke, C.; Dwivedi, P. Technical, allocative, and total profit efficiency of loblolly pine forests under changing climatic conditions. For. Policy Econ. 2016, 72, 106–114. [Google Scholar] [CrossRef]
- Liubachyna, A.; Bubbico, A.; Secco, L.; Pettenella, D. Management Goals and Performance: Clustering State Forest Management Organizations in Europe with Multivariate Statistics. Forests 2017, 8, 504. [Google Scholar] [CrossRef]
- Adamowicz, K.; Gostołek, R.; Jaszczak, R.; Szczypa, P.; Szramka, H. Ocena wpływu wybranych zabiegów hodowlanych i typów siedliskowych lasu na koszt pozyskania surowca drzewnego w czyszczeniach i trzebieżach. Sylwan 2016, 160, 993–1001. [Google Scholar]
- Kocel, J.; Kwiecień, R.; Mionskowski, M.; Garbacz, M. Metoda standaryzacji kosztów administracyjnych nadleśnictw z wykorzystaniem stopnia trudności gospodarowania. Sylwan 2017, 161, 226–237. [Google Scholar]
- Kocel, J.A.; Kwiecien, R. Metodyczne podstawy określania wskaźnika stopnia trudności gospodarowania leśnictw Lasów Państwowych. Sylwan 2012, 156, 118–127. [Google Scholar]
- Petrov, A.P.; Morkovina, S.S. Model of economic organization of the Russian forestry. In IOP Conference Series: Earth and Environmental Science; IOP Publishing: Voronezh, Russian Federation, 2019; Volume 226, p. 12041. [Google Scholar] [CrossRef]
- Butler, B.J.; Leatherberry, E.C. America’s family forest owners. J. For. 2004, 102, 4–9. [Google Scholar]
- Hatcher, J.; Straka, T.; Greene, J. The Size of Forest Holding/Parcelization Problem in Forestry: A Literature Review. Resources 2013, 2, 39–57. [Google Scholar] [CrossRef]
- Knoke, T. Mixed forests and finance—Methodological approaches. Ecol. Econ. 2008, 65, 590–601. [Google Scholar] [CrossRef]
- Rämö, J.; Tahvonen, O. Economics of harvesting uneven-aged forest stands in Fennoscandia. Scand. J. For. Res. 2014, 29, 777–792. [Google Scholar] [CrossRef]
- Rämö, J.; Tahvonen, O. Economics of harvesting boreal uneven-aged mixed-species forests. Can. J. For. Res. 2015, 45, 1102–1112. [Google Scholar] [CrossRef]
- Tahvonen, O. Economics of rotation and thinning revisited: The optimality of clearcuts versus continuous cover forestry. For. Policy Econ. 2016, 62, 88–94. [Google Scholar] [CrossRef]
- Davies, S.; Bathgate, S.; Petr, M.; Gale, A.; Patenaude, G.; Perks, M. Drought risk to timber production-A risk versus return comparison of commercial conifer species in Scotland. For. Policy Econ. 2020, 117, 102189. [Google Scholar] [CrossRef]
- Polyakov, M.; Wear, D.; Huggett, R. Harvest Choice and Timber Supply Models for Forest Forecasting. For. Sci. 2010, 56, 344–355. [Google Scholar]
- Soman, H.; Kizha, A.R.; Muñoz Delgado, B.; Kenefic, L.S.; Kanoti, K. Production economics: Comparing hybrid tree-length with whole-tree harvesting methods. For. Int. J. For. Res. 2020, 93, 389–400. [Google Scholar] [CrossRef]
- Callaghan, D.; Khanal, P.; Straka, T.; Hagan, D. Influence of Forestry Practices Cost on Financial Performance of Forestry Investments. Resources 2019, 8, 28. [Google Scholar] [CrossRef]
- Garbusewicz, W. Analiza Finansowa Przedsiebiorstwa: Teoria i Zastosowanie; Polskie Wydawnictwo Ekonomiczne: Warszawa, Poland, 2014; ISBN 978-83-208-2086-7. [Google Scholar]
- Bednarski, L. Analiza Finansowa w Przedsiębiorstwie; PWE: Warszawa, Poland, 2007; ISBN 83-208-1659-9. [Google Scholar]
- Toscani, P.; Sekot, W. Forest Accountancy Data Networks—A European Approach of Empirical Research, Its Achievements, and Potentials in Regard to Sustainable Multiple Use Forestry. Forests 2018, 9, 220. [Google Scholar] [CrossRef]
- Dög, M.; Wildberg, J.; Möhring, B. Analysis of a long-term Forest Accountancy Network to Support Management and Controlling. Open Agric. 2018, 3, 155–162. [Google Scholar] [CrossRef]
- Lysik, K. Wpływ Warunków Przyrodniczych i Wybranych Czynników Ekonomicznych na Sytuację Finansową Nadleśnictw w RDLP Katowice, Kraków i Krosno. Ph.D. Thesis, Akademia Rolnicza w Krakowie, Kraków, Poland, 2005. [Google Scholar]
- Sierpińska, M.; Wędzki, D. Zarządzanie Płynnością Finansową w Przedsiębiorstwie; PWN: Warszawa, Poland, 2010; ISBN 9788301151362. [Google Scholar]
- Pomykalska, B.; Pomykalski, P. Analiza Finansowa Przedsiębiorstwa; PWN: Warszawa, Poland, 2007; ISBN 9788301148713. [Google Scholar]
- Jachna, T.; Sierpińska, M. Ocena Przedsiębiorstwa Według Standardów Światowych; PWN: Warszawa, Poland, 2004; ISBN 9788301149871. [Google Scholar]
- Płotkowski, L. Kluczowe problemy współczesnego leśnictwa. Sylwan 2004, 148, 22–36. [Google Scholar]
- Kupcak, V. Elementary financial analysis of the Forests of the Czech Republic, state enterprise. J. For. Sci. 2005, 51, 127–140. [Google Scholar] [CrossRef]
- Ankudo-Jankowska, A.; Glura, J. Assessing the usefulness of accounting measures for examining profitability of the State Forests’ National Forest Holding. For. Res. Pap. 2016, 77, 158–165. [Google Scholar] [CrossRef][Green Version]
- Zamula, I.; Tanasiieva, M.; Travin, V.; Nitsenko, V.; Balezentis, T.; Streimikiene, D. Assessment of the Profitability of Environmental Activities in Forestry. Sustainability 2020, 12, 2998. [Google Scholar] [CrossRef]
- Czarnecki, J.; Glura, J.; Ankudo-Jankowska, A. Costs of forest district and statutory duties. Acta Sci. Pol.—Silvarum Colendarum Ratio Ind. Lignaria 2016, 15, 215–221. [Google Scholar] [CrossRef]
- Bogler, B.; Kerstens, K.; Moesen, W.; Vanneste, J. A non-parametric Free Disposal Hull (FDH) approach to technical efficiency: An illustration of radial and graph efficiency measures and some sensitivity results. Swiss J. Econ. Stat. 1994, 130, 647–667. [Google Scholar]
- Kao, C. Efficiency measurement for parallel production systems. Eur. J. Oper. Res. 2009, 196, 1107–1112. [Google Scholar] [CrossRef]
- Yang, B.; Zhang, Y.; Zhang, H.; Zhang, R.; Xu, B. Factor-specific Malmquist productivity index based on common weights DEA. Oper. Res. Int. J. 2016, 16, 51–70. [Google Scholar] [CrossRef]
- Ustawa z 28 Września 1991 r. o Lasach. Dziennik Ustaw Nr 101: 444, Poland. Parliamentary Act. Available online: https://isap.sejm.gov.pl/isap.nsf/DocDetails.xsp?id=WDU19911010444 (accessed on 9 November 2021).
- Rozporządzenie Rady Ministrów z 6 Grudnia 1994 r. w Sprawie Szczegółowych Zasad Gospodarki Finansowej w Państwowym Gospodarstwie Leśnym Lasy Państwowe. Dziennik Ustaw Nr 134: 692, Poland. Parliamentary Act. Available online: http://isap.sejm.gov.pl/isap.nsf/DocDetails.xsp?id=WDU19941340692 (accessed on 9 November 2021).
- Zarządzenie nr 78 Dyrektora Generalnego Lasów Państwowych z Dnia 17 Grudnia 2020 r. Zmieniające Zarządzenie nr 76 Dyrektora Generalnego Lasów Państwowych z Dnia 10 Grudnia 2019 r. w Sprawie Wprowadzenia Jednolitego Tekstu Zasad (Polityki) Rachunkowości Państwowego Gospodarstwa Leśnego Lasy Państwowe i Planu Kont z Komentarzem Państwowego Gospodarstwa Leśnego Lasy Państwowe (Znak: EG.0210.4.2019). Legal Act, Poland. Available online: https://sip.lex.pl/akty-prawne/dzienniki-resortowe/zmiana-zarzadzenia-nr-76-dyrektora-generalnego-lasow-panstwowych-z-35845579 (accessed on 9 November 2021).
- Ustawa z 29 Września 1994 r. o Rachunkowości, 2013, p. 330 i 613 z Późn. zm. Dziennik Ustaw Nr 121: 591, Poland. Parliamentary Act. Available online: sap.sejm.gov.pl/isap.nsf/DocDetails.xsp?id=wdu19941210591 (accessed on 9 November 2021).
- Piekutin, J.; Gruchała, A. Miejsce i rola funduszu leśnego w systemie finansowym Lasów Państwowych. Sylwan 2006, 2, 37–45. [Google Scholar]
- Adamowicz, K.; Dyrcz, A.; Szczypa, P.; Zyroń, A.; Michalski, K.; Szramka, H. Wpływ funduszu leśnego na wartość poszczególnych pozycji bilansu finansowego gospodarstwa leśnego. Acta Sci. Pol. Silvarum Colendarum Ratio Ind. Lignaria 2017, 16, 157–164. [Google Scholar]
- Piekutin, J. Analiza funkcjonowania funduszu leśnego w systemie finansowym Lasów Państwowych na przykładzie Regionalnej Dyrekcji Lasów Państwowych w Radomiu. Sylwan 2006, 6, 3–18. [Google Scholar]
- GUS. Leśnictwo; GUS: Warszawa, Poland, 2016. [Google Scholar]
- GUS. Leśnictwo; GUS: Warszawa, Poland, 2020. [Google Scholar]
- Kocel, J.; Kwiecień, R.; Młynarski, W.; Mionskowski, M. Wskaźnik stopnia trudności gospodarowani aleśnictw Lasów Państwowych. Sylwan 2012, 156, 403–413. [Google Scholar]
- Kocel, J.; Kwiecień, R. Metoda określania syntetycznego wskaźnika efektów gospodarowania zasobami przyrodniczymi, ludzkimi i ekonomicznymi nadleśnictw. For. Res. Pap. 2010, 71, 91–104. [Google Scholar] [CrossRef][Green Version]
- Bansal, A. Improved K-mean Clustering Algorithm for Prediction Analysis using Classification Technique in Data Mining. Int. J. Comput. Appl. 2017, 157, 35–40. [Google Scholar] [CrossRef]
- Głaz, J.; Dawidziuk, J. Wytyczne do Sporządzania Aneksu Ekonomicznego do Planu Urządzenia Lasu; Maszynopis: Warszawa, Poland, 2009. [Google Scholar]
- Soana, M.G.; Barbieri, L.; Lippi, A.; Rossi, S. The Effect of Multiple Large Shareholders on Banks’ Profitability and Risk. Sustainability 2021, 13, 1888. [Google Scholar] [CrossRef]
- Kunca, A.; Zúbrik, M.; Galko, J.; Vakula, J.; Leontovyc, R.; Konôpka, B.; Nikolov, C.; Gubka, A.; Longauerová, V.; Malová, M.; et al. Salvage felling in the Slovak forests in the period 2004–2013. Lesn. Cas. 2015, 61, 188–195. [Google Scholar] [CrossRef]
- Zaleska, M. Ocena Ekonomiczno Finansowa Przedsiębiorstwa Przez Analityka Bankowego; SGH: Warszawa, Poland, 2005; ISBN 83-7378-004-1. [Google Scholar]
- Buraczewski, A.; Wysocki, F. Ocena sytuacji finansowej nadleśnictw za pomocą syntetycznego miernika rozwoju. Sylwan 2000, 1, 43–52. [Google Scholar]
- Kukuła, K. Metoda Unitaryzacji Zerowanej; Wydawnictwo Naukowe PWN: Warszawa, Poland, 2005; ISBN 83-01-13097-0. [Google Scholar]
- R Core Team. R: A Language and Environment for Statistical Computing; R Foundation for Statistical Computing: Vienna, Austria, 2021; Available online: https://www.R-project.org/ (accessed on 1 August 2021).
- Tyran, M.R. Wskaźniki Finansowe; OE: Kraków, Poland, 2005; ISBN 8389355329. [Google Scholar]
- Szymkiewicz, B. Tablice Zasobności i Przyrostu Drzewostanów Ważniejszych Gatunków Drzew Leśnych, Zesta−Wione na Podstawie Tablic Niemieckich, Radzieckich i Polskich; PWRiL: Warszawa, Poland, 1971. [Google Scholar]
- Wildberg, J.; Möhring, B. Empirical analysis of the economic effect of tree species diversity based on the results of a forest accountancy data network. For. Policy Econ. 2019, 109, 101982. [Google Scholar] [CrossRef]
- Brang, P.; Spathef, P.; Larsen, J.B.; Svoboda, M. Suitability of close-to-nature silviculture for adapting temperate European forests to climate change. Forestry 2014, 87, 492–503. [Google Scholar] [CrossRef]
- Hildebrandt, P.; Knoke, T. Investment decisions under uncertainty—A methodological review on forest science studies. For. Policy Econ. 2011, 13, 1–15. [Google Scholar] [CrossRef]
- Schulte, A.A.; Rickenbach, M.; Marrick, L.C. Ecological and economic benefits of cross-boundary coordination among private forest landowners. Landsc. Ecol. 2008, 23, 481–496. [Google Scholar] [CrossRef]
- Albert, M.; Hansen, J.; Nagel, J.; Schmidt, M.; Spellmann, H. Assessing risks and uncertainties in forest dynamics under different management scenarios and climate change. For. Ecosyst. 2015, 2, 14. [Google Scholar] [CrossRef]
- Pukkala, T. Effect of species composition on ecosystem services in European boreal forest. J. For. Res. 2018, 29, 261–272. [Google Scholar] [CrossRef]
- Janeczko, K. Ekonomiczne Konsekwencje Realizacji Pozaprodukcyjnych Funkcji Lasu na Przykładzie Leśnego Kompleksu Promocyjnego Puszcza Białowieska. Ph.D. Thesis, SGGW, Warszawa, Poland, 2004. [Google Scholar]
- Friedrich, S.; Paul, C.; Brandl, S.; Biber, P.; Messerer, K.; Knoke, T. Economic impact of growth effects in mixed stands of Norway spruce and European beech—A simulation based study. For. Policy Econ. 2019, 104, 65–80. [Google Scholar] [CrossRef]
- Knoke, T.; Ammer, C.; Stimm, B.; Mosandl, R. Admixing broadleaved to coniferous tree species: Areviewon yield, ecological stability and economics. Eur. J. For. Res. 2008, 127, 89–101. [Google Scholar] [CrossRef]
- Hanewinkel, M.; Frutig, F.; Lemm, R. Economic performance of uneven-aged forests analysed with annuities. Forestry 2014, 87, 49–60. [Google Scholar] [CrossRef]
- Knoke, T.; Kindu, M.; Jarisch, I.; Gosling, E.; Friedrich, S.; Bödeker, K.; Paul, C. How considering multiple criteria, uncertainty scenarios and biological interactions may influence the optimal silvicultural strategy for a mixed forest. For. Policy Econ. 2020, 118, 102239. [Google Scholar] [CrossRef]
- Knoke, T.; Stimm, B.; Ammer, C.; Moog, M. Mixed forests reconsidered: A forest economics contribution on an ecological concept. For. Ecol. Manag. 2005, 213, 102–116. [Google Scholar] [CrossRef]
- Hanewinkel, M. Comparative economicinvestigations of even-aged anduneven-aged silvicultural systems: Acritical analysis of different methods. Forestry 2002, 75, 473–481. [Google Scholar] [CrossRef]
- O’Hara, K.L.; Ramage, B.S. The stand: Revisiting a central concept in forestry. J. For. 2013, 111, 335–340. [Google Scholar] [CrossRef]
- McCool, S.F.; Benson, R.E.; Ashor, J.L. How the public perceives the visual effects of timber harvesting: An evaluation of interest group preferences. Environ. Manag. 1986, 10, 385–391. [Google Scholar] [CrossRef]
- Parmer, A.M.; Gan, J.; Kolison, S. Assessment of the Economic Efficiency and Environmental Impact of Major Timber Harvesting Systems in Alabama. 1999. Available online: https://www.researchgate.net/publication/255626403_Assessment_of_the_Economic_Efficiency_and_Environmental_Impact_of_Major_Timber_Harvesting_Systems_in_Alabama (accessed on 1 August 2021).
- Cubbage, F.W. Timber Harvesting. Forest Resource Economics and Policy Research; Routledge: New York, NY, USA, 1989; ISBN 9780429043055. [Google Scholar]
- Aalmo, G.O.; Kerstens, P.J.; Belbo, H.; Bogetoft, P.; Talbot, B.; Strange, N. Efficiency drivers in harvesting operations in mixed Boreal stands: A Norwegian case study. Int. J. For. Eng. 2020, 32, 74–86. [Google Scholar] [CrossRef]
- Zając, S. Niektóre problemy ekonomiczne gospodarki leśnej w aspekcie reprywatyzacji lasów. Sylwan 1998, 142, 5–16. [Google Scholar]
- Greene, J.L.; Blatner, K.A. Identifying woodland owner characteristics associated with timber. management. For. Sci. 1986, 32, 135–146. [Google Scholar]
- Munn, I.A.; Barlow, S.A.; Evans, D.L.; Cleaves, D. Urbanization’s impact on timber harvesting in the south central United States. J. Environ. Manag. 2002, 64, 65–76. [Google Scholar] [CrossRef] [PubMed]
- Kittredge, D.B. The cooperation of private forest owners on scales larger than one individual property: International examples and potential application in the United States. For. Pol. Econ. 2005, 7, 671–688. [Google Scholar] [CrossRef]


| Universal Model (Used by the SFNFH) | C | Buraczewski and Wysocki’s Model (2000) | C |
|---|---|---|---|
| N | N | ||
| N | N | ||
| N | S | ||
| S | S | ||
| Average collection period (ACP) | D | D | |
| D | D | ||
| D | S | ||
| S | S | ||
| S |
| Financial Indicator | Period | ||
|---|---|---|---|
| 2015–2019 (n = 82) | 2005–2009 (n = 82) | ||
| Current ratio | mean ± SD | 2.04 ± 1.03 | 2.15 ± 0.47 |
| median | 1.89 | 2.05 | |
| quartiles | 1.67–2.16 | 1.61–2.5 | |
| Quick ratio | mean ± SD | 1.88 ± 0.95 | 2.26 ± 2.44 |
| median | 1.74 | 1.96 | |
| quartiles | 1.54–1.99 | 1.55–2.31 | |
| Cash ratio | mean ± SD | 1.47 ± 0.9 | 1.44 ± 0.45 |
| median | 1.31 | 1.37 | |
| quartiles | 1.09–1.6 | 1.10–1.71 | |
| [%] | mean ± SD | 101.24 ± 10.92 | 120.93 ± 13.61 |
| median | 101.43 | 118.79 | |
| quartiles | 94.33–107.3 | 113.47–127.19 | |
| Average collection period [days] | mean ± SD | 22.68 ± 27.52 | 13.21 ± 5.66 |
| median | 14.11 | 13.03 | |
| quartiles | 10.22–24.92 | 9.02–17.41 | |
| [days] | mean ± SD | 13.15 ± 11.74 | 23.17 ± 116.68 |
| median | 10.2 | 13.14 | |
| quartiles | 8.34–13.64 | 9.1–22.02 | |
| [days] | mean ± SD | 25.05 ± 52.69 | 35.15 ± 218.14 |
| median | 14.15 | 26.5 | |
| quartiles | 11–19.73 | 17.02–36.3 | |
| ROS excl. forest fund [%] | mean ± SD | −5.18 ± 37.89 | −4.02 ± 14.62 |
| median | −0.06 | 0.06 | |
| quartiles | −0.52–6 | −11.33–5.23 | |
| ROA excl. forest fund/(ROA) [%] | mean ± SD | 1.12 ± 10.19 (4.88 ± 3.34) | −1.22 ± 12.82 (2.83 ± 2.73) |
| median | −0.03 (3.99) | 0.5 (2.54) | |
| quartiles | −0.28–6.25 (2.34–6.91) | −9.46–6.53 (0.84–4.64) | |
| ROE excl. forest fund/(ROE) [%] | mean ± SD | −3.36 ± 17.73 (4.98 ± 2.79) | −1.28 ± 17.64 (3.75 ± 3.53) |
| median | −3.61 (4.38) | 0.88 (3.27) | |
| quartiles | −12.45–7.86 (2.98–6.93) | −12.02–7.9 (1.12–6.19) | |
| Debt ratio [%] | mean ± SD | 27.47 ± 5.78 | 14.01 ± 2.21 |
| median | 26.92 | 14.72 | |
| quartiles | 23.9–30.76 | 13.92–16.18 | |
| Debt to equity ratio [%] | mean ± SD | 38.41 ± 11.34 | 20.33 ± 3.8 |
| median | 36 | 18.6 | |
| quartiles | 31–44.16 | 17.05–22.7 | |
| Financial result excl. forest fund [PLN/ha/year] | mean ± SD | −54.63 ± 239.03 | −11.17 ± 96.88 |
| median | −43.43 | 3.97 | |
| quartiles | −129.65–73.16 | −50.26–28.73 | |
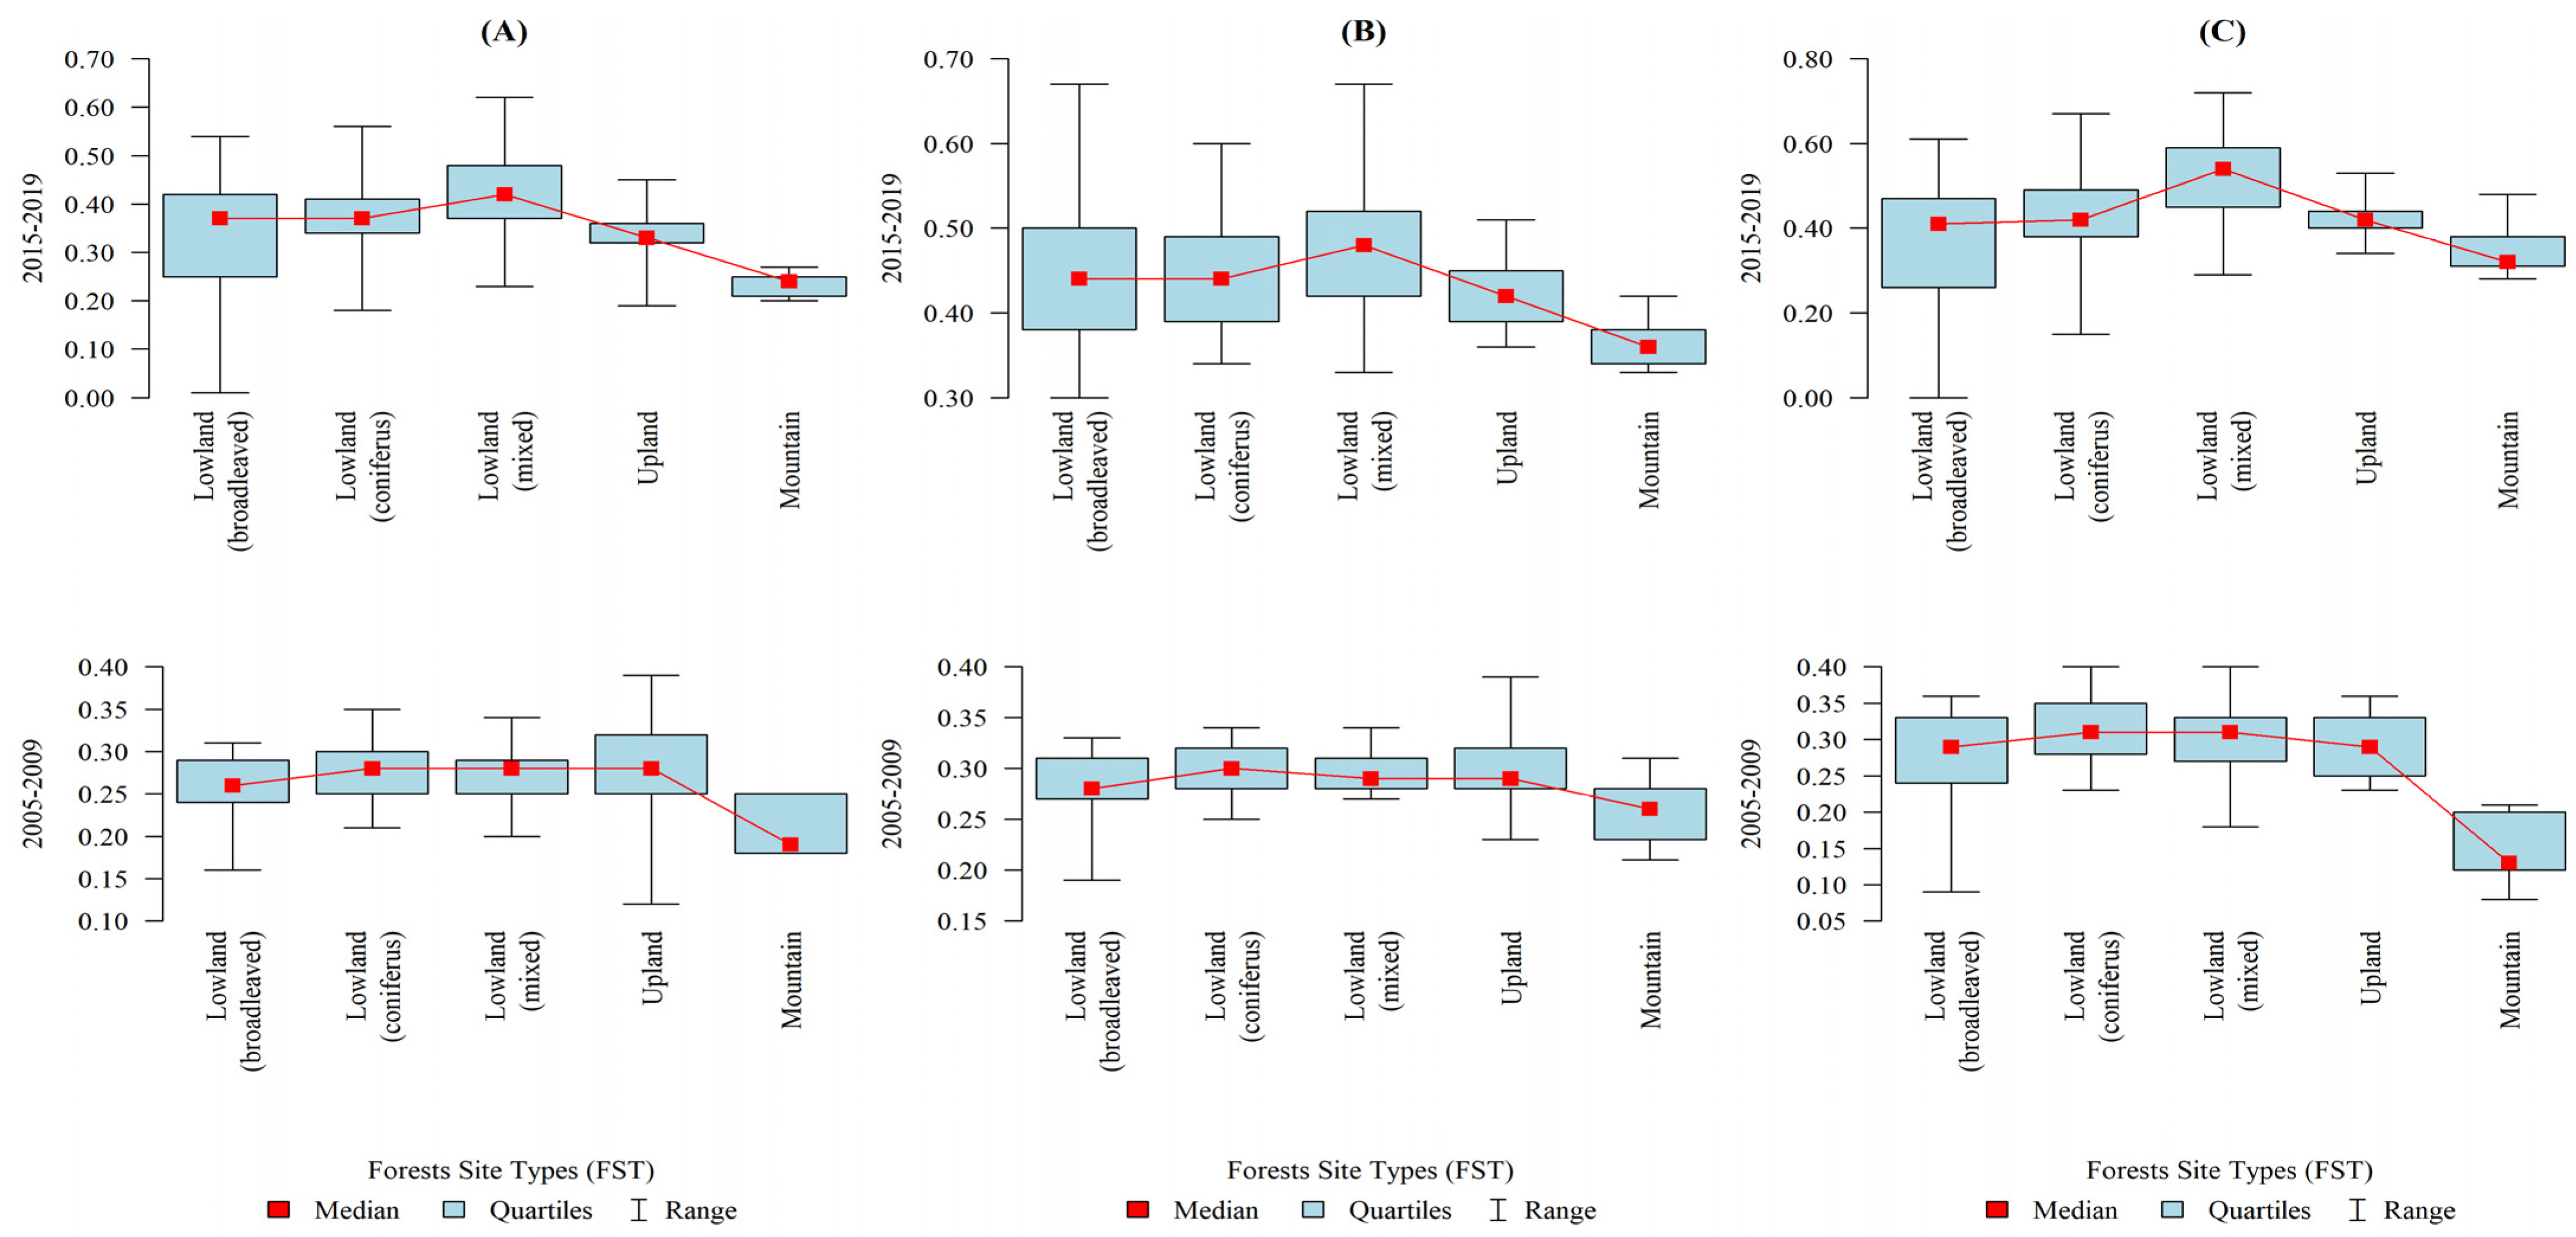
| Parameter | Forest Site Type | p | |||||
|---|---|---|---|---|---|---|---|
| Lowland Broadleaved—A (n = 24) | Lowland Coniferous—B (n = 20) | Lowland Mixed—C (n = 20) | Upland—D (n = 9) | Montane—E (n = 9) | |||
| Synthetic indicator 1 (2015–2019) | mean ± SD | 0.33 ± 0.14 | 0.38 ± 0.1 | 0.42 ± 0.1 | 0.33 ± 0.07 | 0.23 ± 0.03 | p = 0.001 * |
| median | 0.37 | 0.37 | 0.42 | 0.33 | 0.24 | ||
| quartiles | 0.25–0.42 | 0.34–0.41 | 0.37–0.48 | 0.32–0.36 | 0.21–0.25 | C > A,D,E B,A > E | |
| Synthetic indicator 2 (2015–2019) | mean ± SD | 0.45 ± 0.09 | 0.44 ± 0.07 | 0.48 ± 0.08 | 0.42 ± 0.05 | 0.36 ± 0.03 | p = 0.002 * |
| median | 0.44 | 0.44 | 0.48 | 0.42 | 0.36 | ||
| quartiles | 0.38–0.5 | 0.39–0.49 | 0.42–0.52 | 0.39–0.45 | 0.34–0.38 | C,A,B,D > E | |
| Synthetic indicator 3 (2015–2019) | mean ± SD | 0.25 ± 0.48 | 0.43 ± 0.12 | 0.52 ± 0.12 | 0.42 ± 0.06 | 0.35 ± 0.06 | p = 0.002 * |
| median | 0.41 | 0.42 | 0.54 | 0.42 | 0.32 | ||
| quartiles | 0.26–0.47 | 0.38–0.49 | 0.45–0.59 | 0.4–0.44 | 0.31–0.38 | C > B,D,E,A | |
| Synthetic indicator 1 (2005–2009) | mean ± SD | 0.26 ± 0.04 | 0.28 ± 0.03 | 0.27 ± 0.04 | 0.28 ± 0.08 | 0.21 ± 0.03 | p = 0.003 * |
| median | 0.26 | 0.28 | 0.28 | 0.28 | 0.19 | ||
| quartiles | 0.24–0.29 | 0.25–0.3 | 0.25–0.29 | 0.25–0.32 | 0.18–0.25 | B,D,C,A > E | |
| Synthetic indicator 2 (2005–2009) | mean ± SD | 0.28 ± 0.03 | 0.3 ± 0.02 | 0.3 ± 0.02 | 0.3 ± 0.05 | 0.26 ± 0.03 | p = 0.026 * |
| median | 0.28 | 0.3 | 0.29 | 0.29 | 0.26 | ||
| quartiles | 0.27–0.31 | 0.28–0.32 | 0.28–0.31 | 0.28–0.32 | 0.23–0.28 | B,C > E | |
| Synthetic indicator 3 (2005–2009) | mean ± SD | 0.28 ± 0.07 | 0.31 ± 0.05 | 0.3 ± 0.06 | 0.29 ± 0.04 | 0.15 ± 0.05 | p < 0.001 * |
| median | 0.29 | 0.31 | 0.31 | 0.29 | 0.13 | ||
| quartiles | 0.24–0.33 | 0.28–0.35 | 0.27–0.33 | 0.25–0.33 | 0.12–0.2 | B,C,D,A > E | |
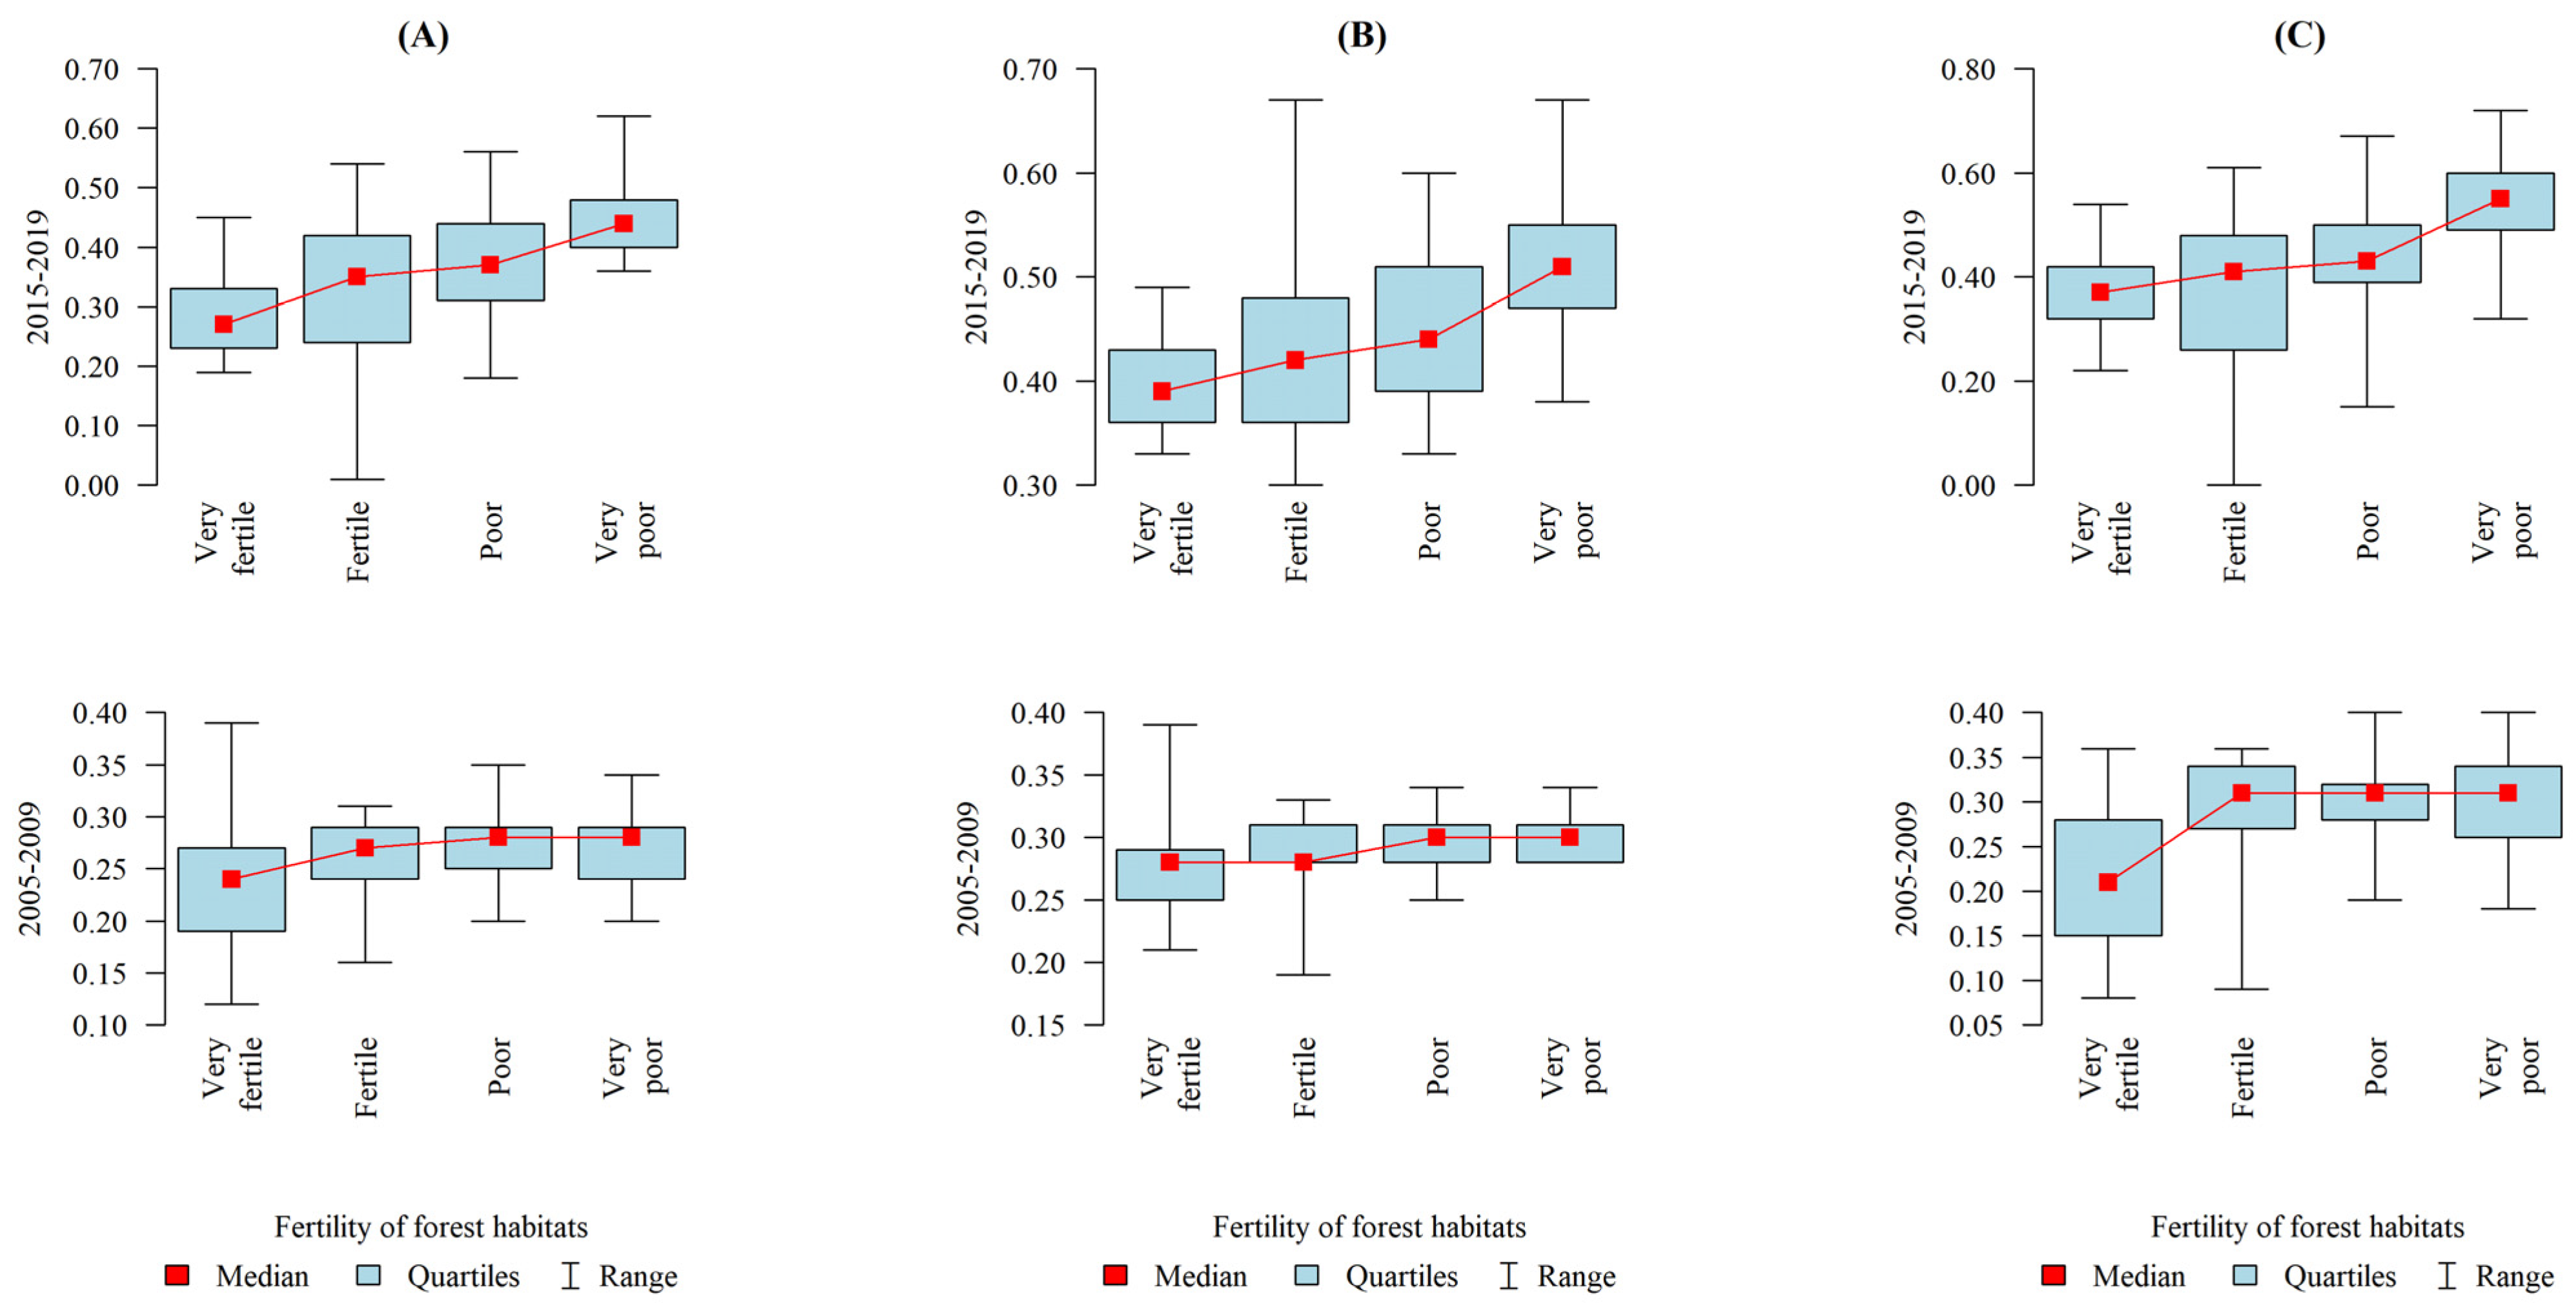
| Parameter | Forest Site Fertility | p | ||||
|---|---|---|---|---|---|---|
| Very High—A (n = 20) | High—B (n = 21) | Low—C (n = 27) | Very Low—D (n = 14) | |||
| Synthetic indicator 1 (2015–2019) | mean ± SD | 0.28 ± 0.07 | 0.33 ± 0.14 | 0.38 ± 0.1 | 0.45 ± 0.07 | p < 0.001 * |
| median | 0.27 | 0.35 | 0.37 | 0.44 | ||
| quartiles | 0.23–0.33 | 0.24–0.42 | 0.31–0.44 | 0.4–0.48 | D > C,B,A C > A | |
| Synthetic indicator 2 (2015–2019) | mean ± SD | 0.4 ± 0.05 | 0.43 ± 0.09 | 0.45 ± 0.08 | 0.51 ± 0.07 | p < 0.001 * |
| median | 0.39 | 0.42 | 0.44 | 0.51 | ||
| quartiles | 0.36–0.43 | 0.36–0.48 | 0.39–0.51 | 0.47–0.55 | D > C,B,A C > A | |
| Synthetic indicator 3 (2015–2019) | mean ± SD | 0.38 ± 0.08 | 0.24 ± 0.52 | 0.44 ± 0.12 | 0.54 ± 0.1 | p < 0.001 * |
| median | 0.37 | 0.41 | 0.43 | 0.55 | ||
| quartiles | 0.32–0.42 | 0.26–0.48 | 0.39–0.5 | 0.49–0.6 | D > C > A,B | |
| Synthetic indicator 1 (2005–2009) | mean ± SD | 0.24 ± 0.06 | 0.26 ± 0.04 | 0.27 ± 0.03 | 0.27 ± 0.04 | p = 0.07 |
| median | 0.24 | 0.27 | 0.28 | 0.28 | ||
| quartiles | 0.19–0.27 | 0.24–0.29 | 0.25–0.29 | 0.24–0.29 | ||
| Synthetic indicator 2 (2005–2009) | mean ± SD | 0.28 ± 0.04 | 0.29 ± 0.03 | 0.3 ± 0.02 | 0.3 ± 0.02 | p = 0.071 |
| median | 0.28 | 0.28 | 0.3 | 0.3 | ||
| quartiles | 0.25–0.29 | 0.28–0.31 | 0.28–0.31 | 0.28–0.31 | ||
| Synthetic indicator 3 (2005–2009) | mean ± SD | 0.22 ± 0.08 | 0.29 ± 0.07 | 0.31 ± 0.05 | 0.3 ± 0.07 | p = 0.002 * |
| median | 0.21 | 0.31 | 0.31 | 0.31 | ||
| quartiles | 0.15–0.28 | 0.27–0.34 | 0.28–0.32 | 0.26–0.34 | C,D,B > A | |
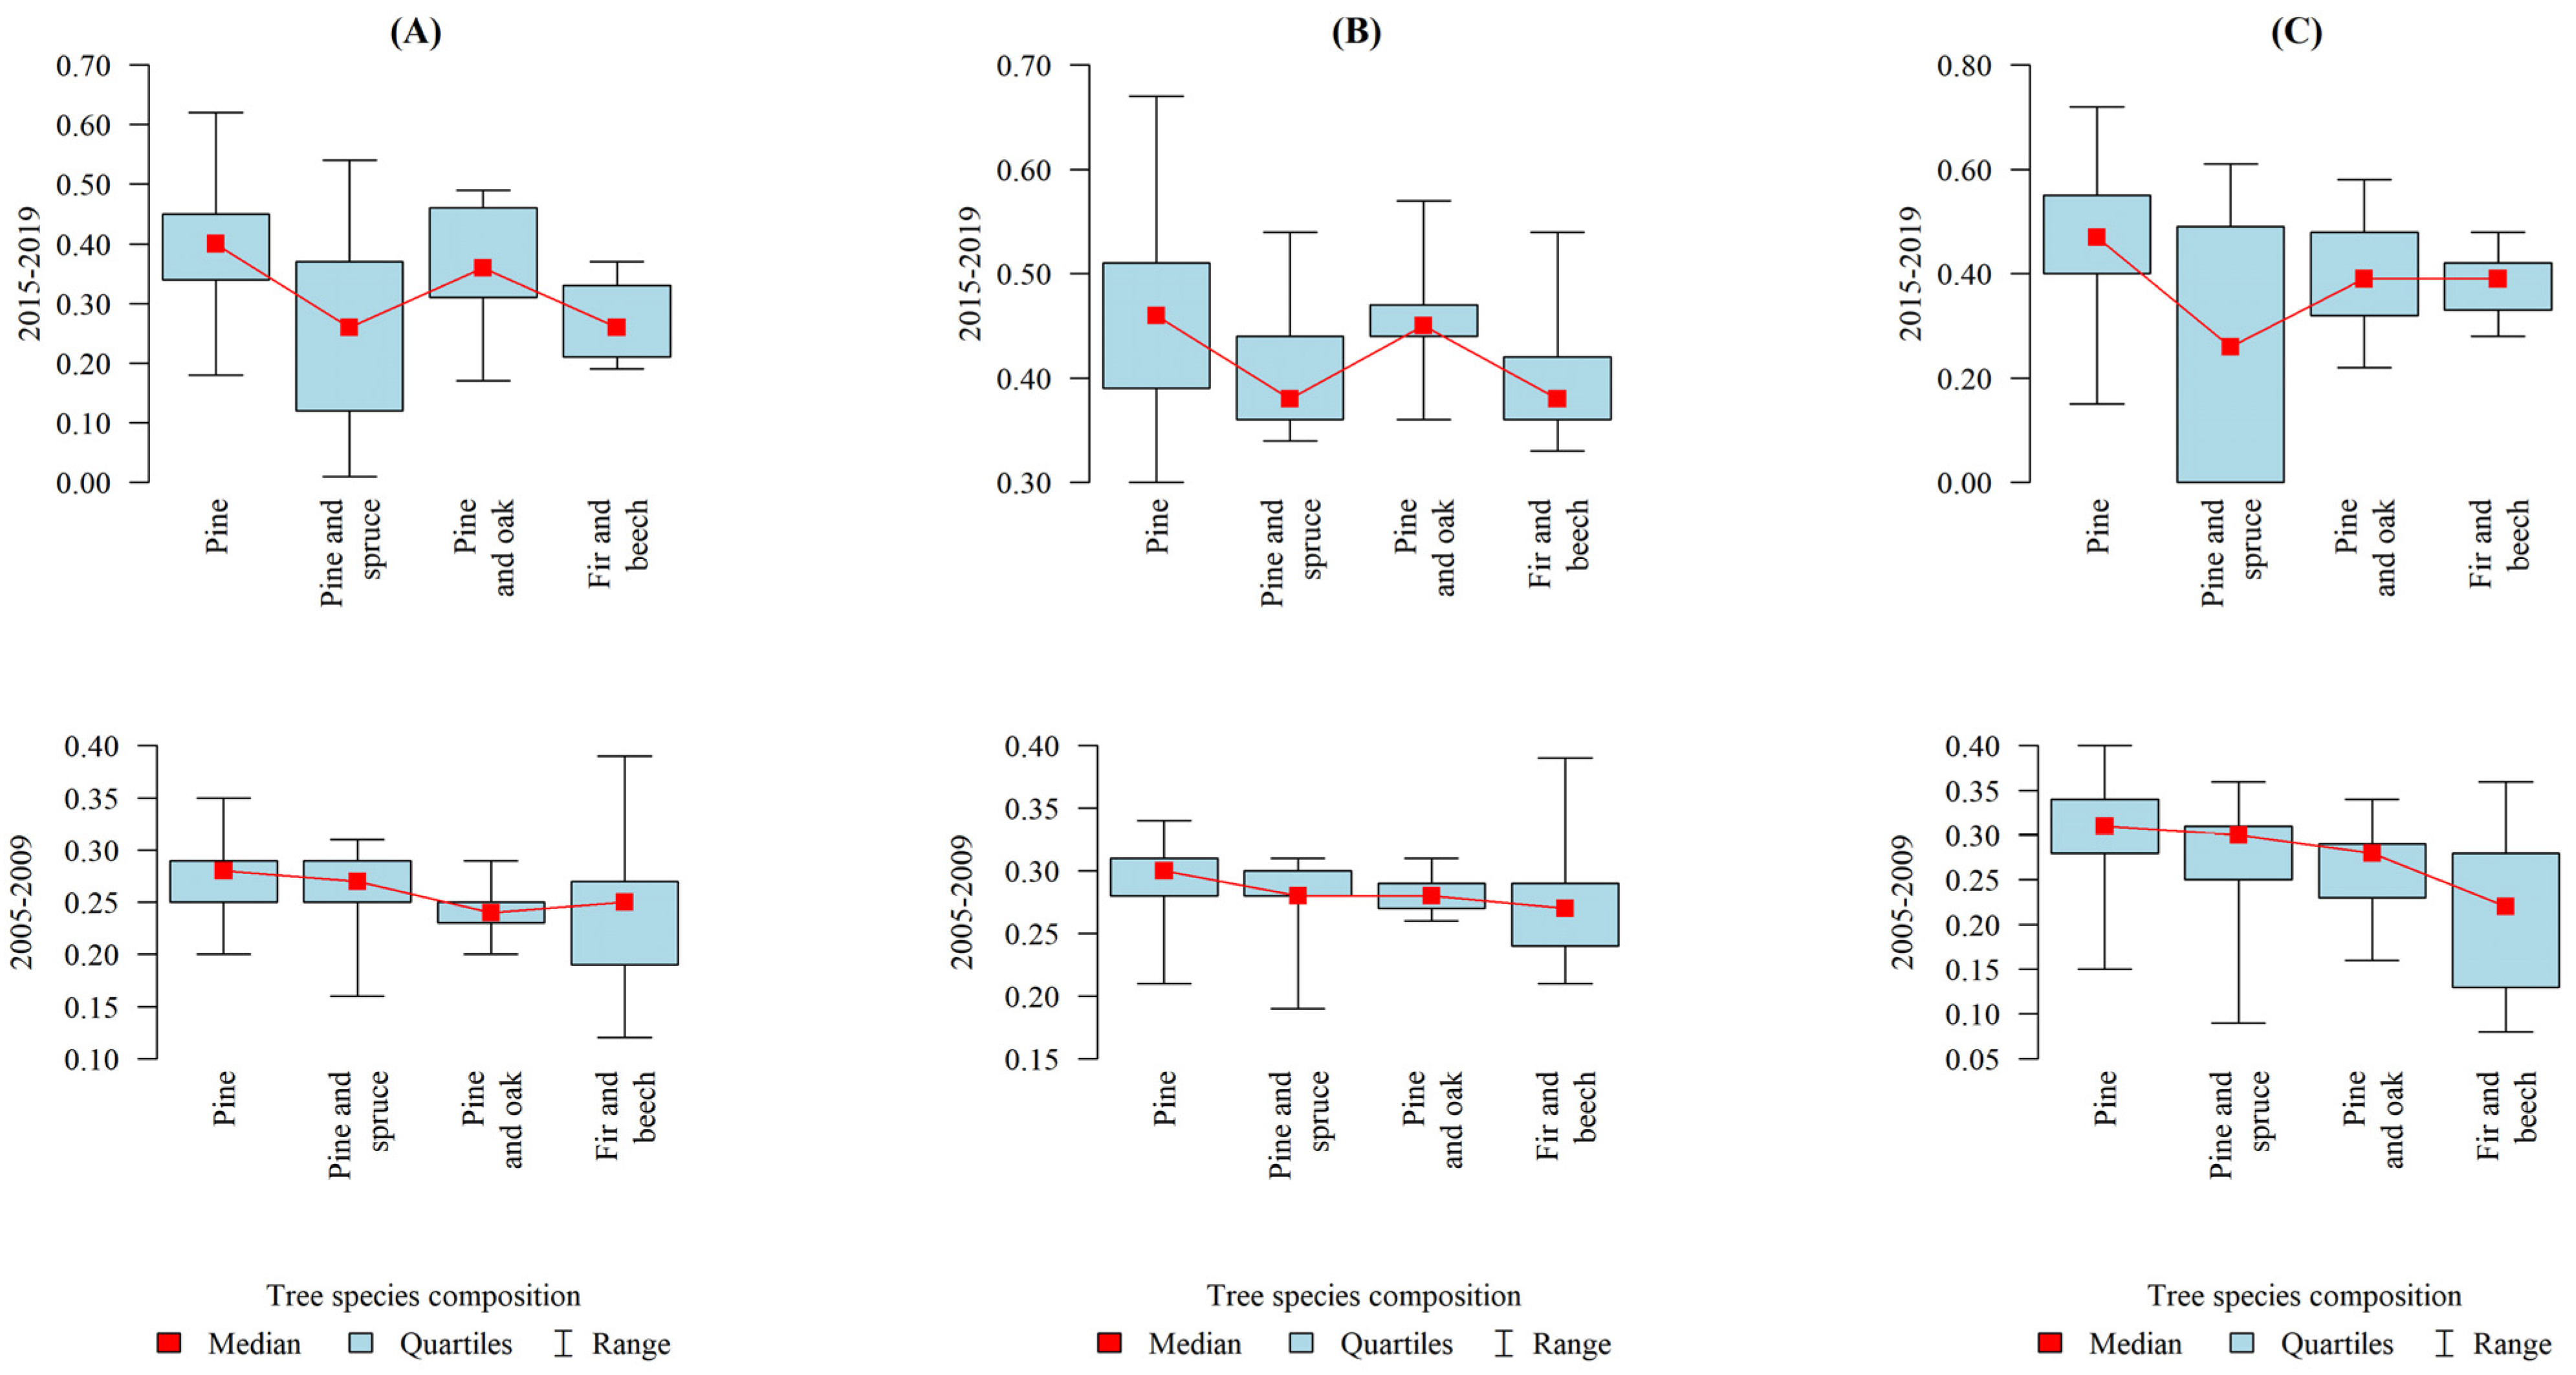
| Parameter | Tree Species Composition | p | ||||
|---|---|---|---|---|---|---|
| Pine—A (n = 50) | Pine and Spruce—B (n = 7) | Pine and Oak—C (n = 9) | Fir and Beech—D (n = 16) | |||
| Synthetic indicator 1 (2015–2019) | mean ± SD | 0.39 ± 0.1 | 0.25 ± 0.19 | 0.36 ± 0.11 | 0.27 ± 0.06 | p = 0.001 * |
| median | 0.4 | 0.26 | 0.36 | 0.26 | ||
| quartiles | 0.34–0.45 | 0.12–0.37 | 0.31–0.46 | 0.21–0.33 | A > D,B | |
| Synthetic indicator 2 (2015–2019) | mean ± SD | 0.46 ± 0.08 | 0.41 ± 0.08 | 0.46 ± 0.06 | 0.39 ± 0.05 | p = 0.005 * |
| median | 0.46 | 0.38 | 0.45 | 0.38 | ||
| quartiles | 0.39–0.51 | 0.36–0.44 | 0.44–0.47 | 0.36–0.42 | A,C > D | |
| Synthetic indicator 3 (2015–2019) | mean ± SD | 0.46 ± 0.12 | −0.13 ± 0.8 | 0.4 ± 0.13 | 0.38 ± 0.06 | p = 0.02 * |
| median | 0.47 | 0.26 | 0.39 | 0.39 | ||
| quartiles | 0.4–0.55 | −0.66–0.49 | 0.32–0.48 | 0.33–0.42 | A > D,B | |
| Synthetic indicator 1 (2005–2009) | mean ± SD | 0.27 ± 0.03 | 0.26 ± 0.05 | 0.24 ± 0.03 | 0.24 ± 0.07 | p = 0.021 * |
| median | 0.28 | 0.27 | 0.24 | 0.25 | ||
| quartiles | 0.25–0.29 | 0.25–0.29 | 0.23–0.25 | 0.19–0.27 | A > D,C | |
| Synthetic indicator 2 (2005–2009) | mean ± SD | 0.3 ± 0.02 | 0.28 ± 0.04 | 0.28 ± 0.02 | 0.27 ± 0.05 | p = 0.01 * |
| median | 0.3 | 0.28 | 0.28 | 0.27 | ||
| quartiles | 0.28–0.31 | 0.28–0.3 | 0.27–0.29 | 0.24–0.29 | A > C,B,D | |
| Synthetic indicator 3 (2005–2009) | mean ± SD | 0.3 ± 0.06 | 0.27 ± 0.09 | 0.26 ± 0.06 | 0.22 ± 0.08 | p = 0.002 * |
| median | 0.31 | 0.3 | 0.28 | 0.22 | ||
| quartiles | 0.28–0.34 | 0.25–0.31 | 0.23–0.29 | 0.13–0.28 | A > C,D | |
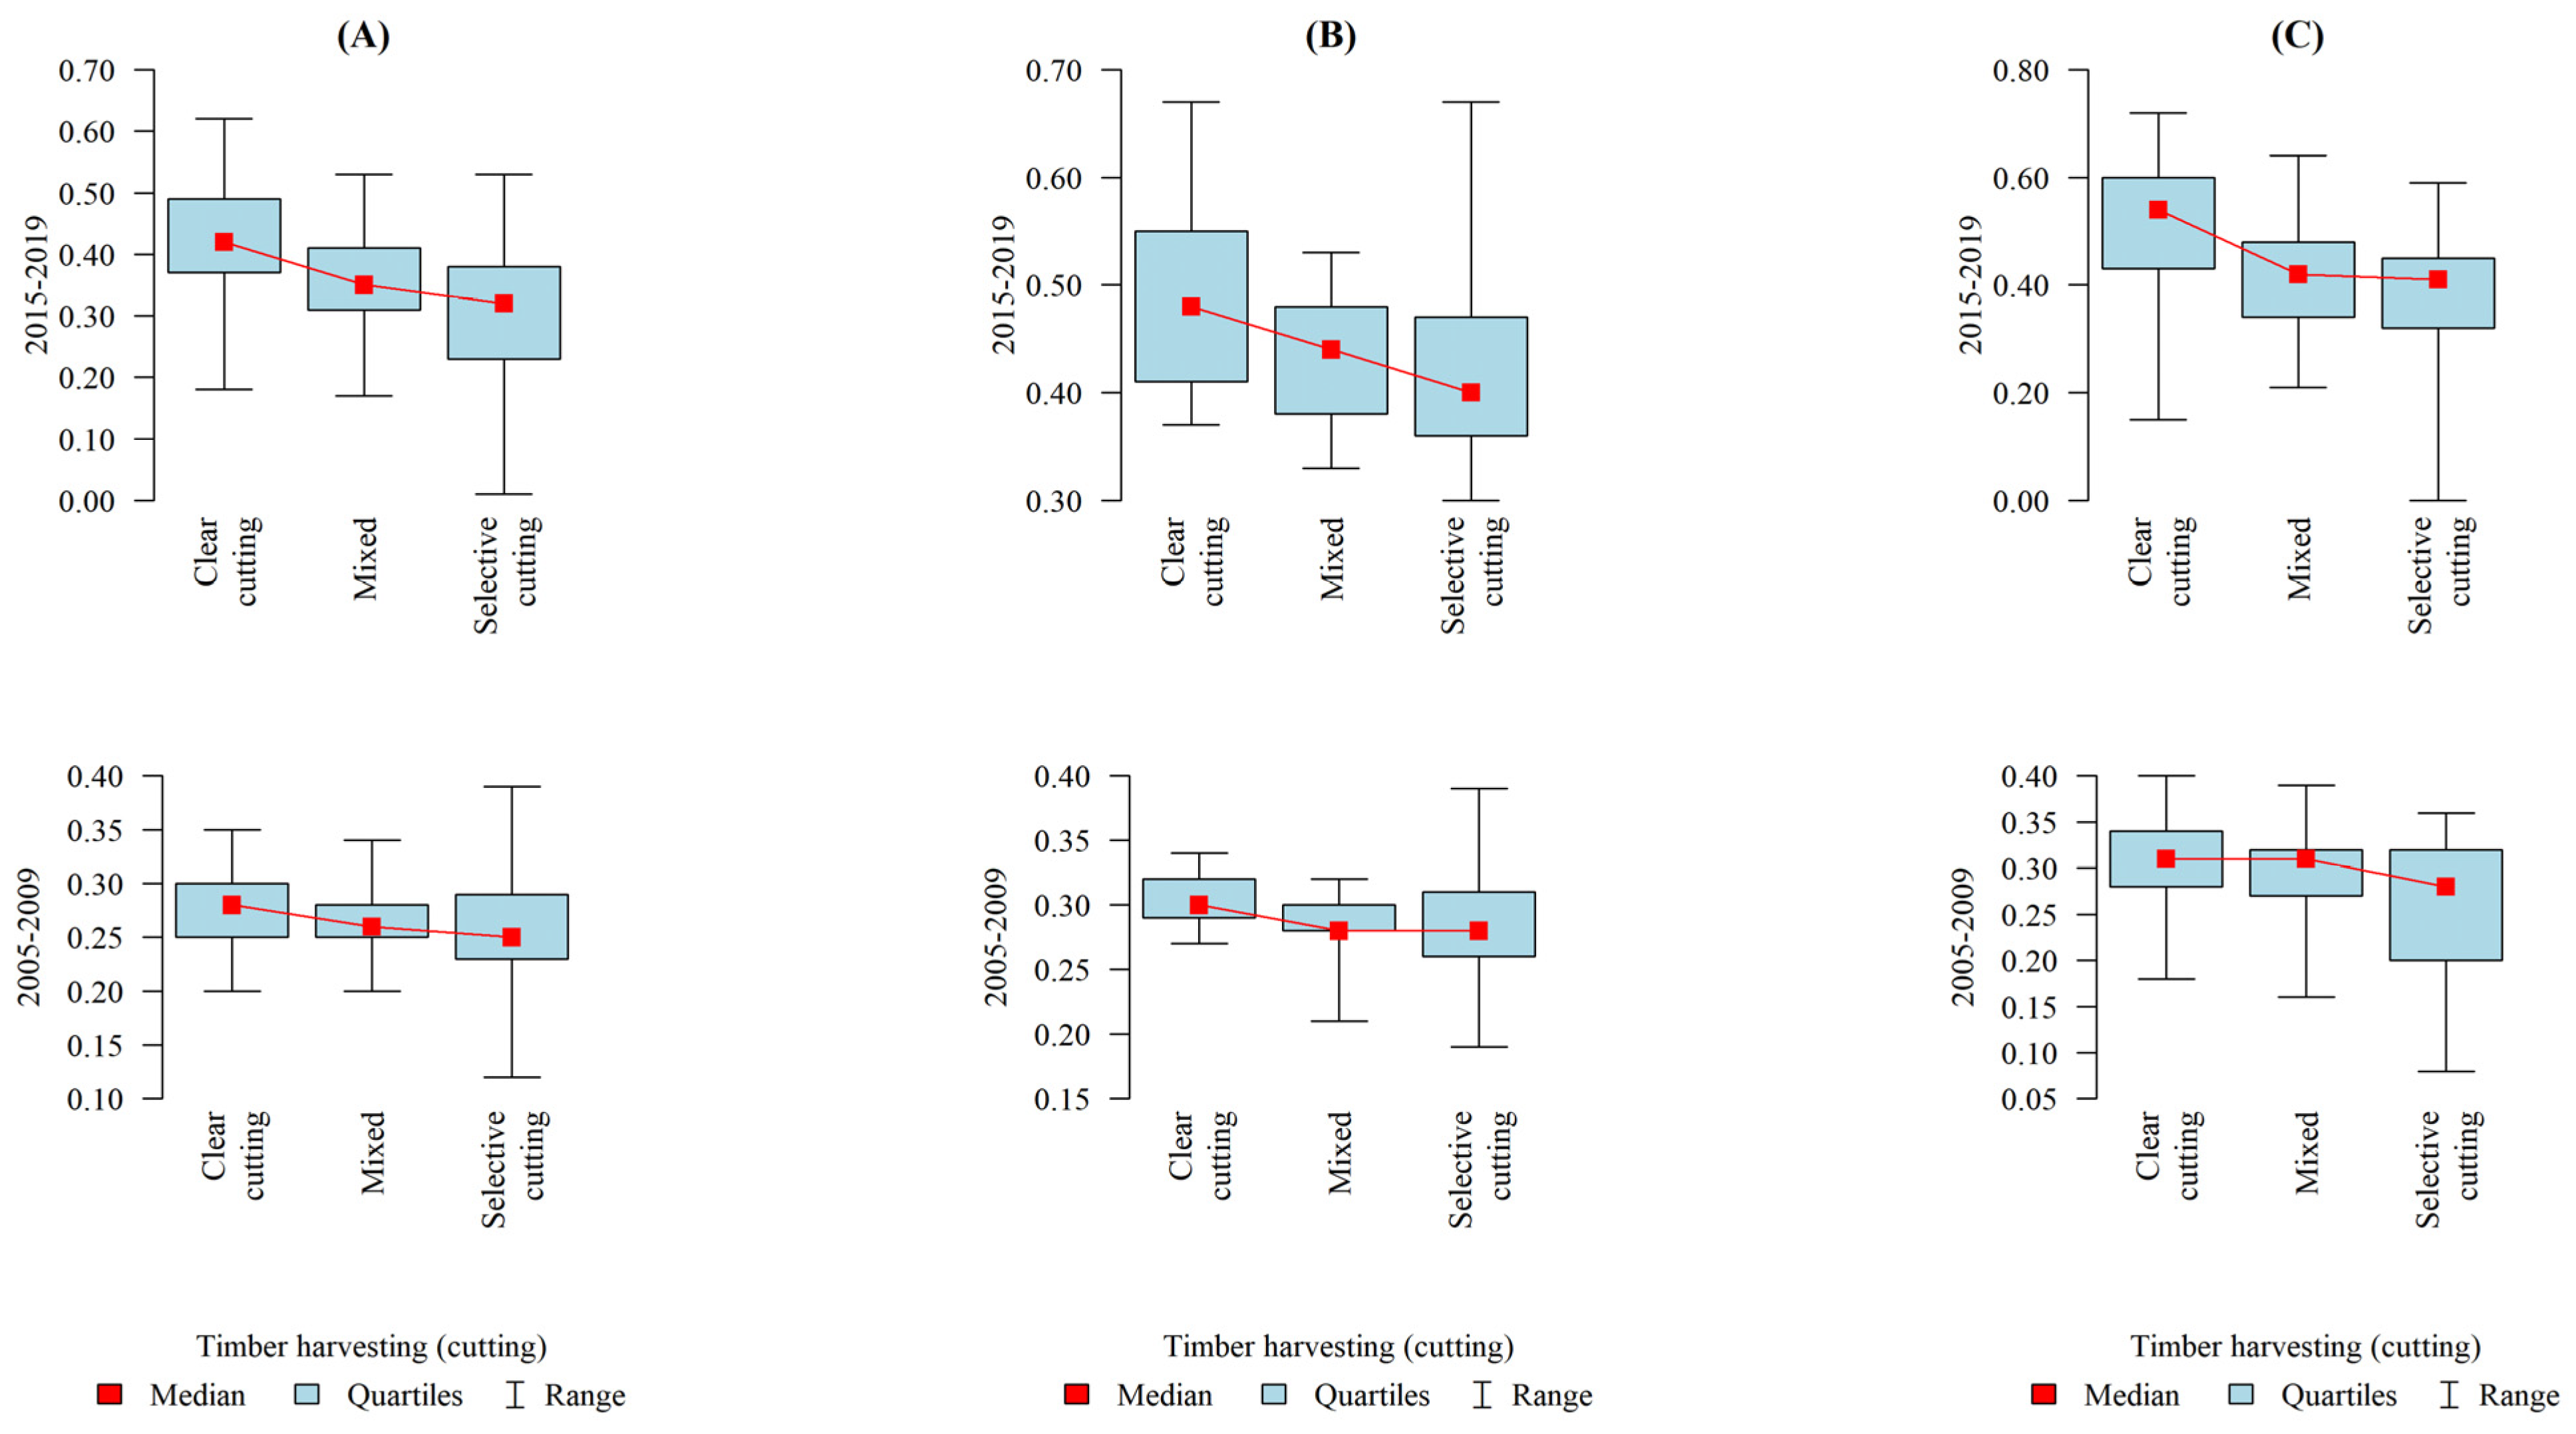
| Parameter | Stand Regeneration/Felling System | p | |||
|---|---|---|---|---|---|
| Clearcutting—A (n = 26) | Mixed—B (n = 21) | Selective Cutting—C (n = 35) | |||
| Synthetic indicator 1 (2015–2019) | mean ± SD | 0.42 ± 0.11 | 0.35 ± 0.09 | 0.3 ± 0.12 | p = 0.001 * |
| median | 0.42 | 0.35 | 0.32 | ||
| quartiles | 0.37–0.49 | 0.31–0.41 | 0.23–0.38 | A > B,C | |
| Synthetic indicator 2 (2015–2019) | mean ± SD | 0.48 ± 0.08 | 0.43 ± 0.06 | 0.43 ± 0.09 | p = 0.012 * |
| median | 0.48 | 0.44 | 0.4 | ||
| quartiles | 0.41–0.55 | 0.38–0.48 | 0.36–0.47 | A > B,C | |
| Synthetic indicator 3 (2015–2019) | mean ± SD | 0.5 ± 0.14 | 0.42 ± 0.11 | 0.29 ± 0.4 | p = 0.001 * |
| median | 0.54 | 0.42 | 0.41 | ||
| quartiles | 0.43–0.6 | 0.34–0.48 | 0.32–0.45 | A > B,C | |
| Synthetic indicator 1 (2005–2009) | mean ± SD | 0.27 ± 0.04 | 0.26 ± 0.03 | 0.25 ± 0.05 | p = 0.201 |
| median | 0.28 | 0.26 | 0.25 | ||
| quartiles | 0.25–0.3 | 0.25–0.28 | 0.23–0.29 | ||
| Synthetic indicator 2 (2005–2009) | mean ± SD | 0.3 ± 0.02 | 0.28 ± 0.03 | 0.28 ± 0.04 | p = 0.013 * |
| median | 0.3 | 0.28 | 0.28 | ||
| quartiles | 0.29–0.32 | 0.28–0.3 | 0.26–0.31 | A > B,C | |
| Synthetic indicator 3 (2005–2009) | mean ± SD | 0.3 ± 0.06 | 0.29 ± 0.05 | 0.25 ± 0.08 | p = 0.046 * |
| median | 0.31 | 0.31 | 0.28 | ||
| quartiles | 0.28–0.34 | 0.27–0.32 | 0.2–0.32 | A > C | |
| Parameter | Timber Harvesting Intensity | p | |||
|---|---|---|---|---|---|
| Very High—A (n = 30) | High—B (n = 36) | Medium—C (n = 16) | |||
| Synthetic indicator 1 (2005–2009) | mean ± SD | 0.29 ± 0.04 | 0.25 ± 0.05 | 0.25 ± 0.04 | p = 0.003 * |
| median | 0.28 | 0.25 | 0.26 | ||
| quartiles | 0.26–0.31 | 0.22–0.28 | 0.23–0.28 | A > C,B | |
| Synthetic indicator 2 (2005–2009) | mean ± SD | 0.3 ± 0.03 | 0.28 ± 0.03 | 0.28 ± 0.03 | p = 0.001 * |
| median | 0.31 | 0.28 | 0.28 | ||
| quartiles | 0.29–0.32 | 0.26–0.3 | 0.28–0.31 | A > C,B | |
| Synthetic indicator 3 (2005–2009) | mean ± SD | 0.31 ± 0.06 | 0.26 ± 0.07 | 0.26 ± 0.08 | p = 0.002 * |
| median | 0.31 | 0.27 | 0.29 | ||
| quartiles | 0.28–0.35 | 0.21–0.31 | 0.21–0.33 | A > C,B | |
| Parameter | Fragmentation of Forest Complexes | p | |||
|---|---|---|---|---|---|
| High—A (n = 12) | Medium—B (n = 29) | Low—C (n = 41) | |||
| Synthetic indicator 1 (2015–2019) | mean ± SD | 0.36 ± 0.11 | 0.37 ± 0.1 | 0.34 ± 0.13 | p = 0.517 |
| median | 0.34 | 0.37 | 0.33 | ||
| quartiles | 0.31–0.43 | 0.33–0.45 | 0.25–0.42 | ||
| Synthetic indicator 2 (2015–2019) | mean ± SD | 0.48 ± 0.09 | 0.46 ± 0.07 | 0.42 ± 0.08 | p = 0.021 * |
| median | 0.45 | 0.46 | 0.4 | ||
| quartiles | 0.42–0.57 | 0.39–0.51 | 0.36–0.47 | A,B > C | |
| Synthetic indicator 3 (2015–2019) | mean ± SD | 0.38 ± 0.11 | 0.44 ± 0.11 | 0.36 ± 0.4 | p = 0.442 |
| median | 0.42 | 0.43 | 0.44 | ||
| quartiles | 0.32–0.45 | 0.39–0.53 | 0.32–0.54 | ||
| Parameter | Management Difficulty Level | p | ||||
|---|---|---|---|---|---|---|
| “Very Difficult”—A (n = 13) | “Difficult”—B (n = 37) | “Easy”—C (n = 26) | “Very Easy”—D (n = 6) | |||
| Synthetic indicator 1 (2015–2019) | mean ± SD | 0.29 ± 0.12 | 0.37 ± 0.12 | 0.38 ± 0.1 | 0.34 ± 0.02 | p = 0.063 |
| median | 0.24 | 0.38 | 0.38 | 0.34 | ||
| quartiles | 0.21–0.3 | 0.32–0.45 | 0.33–0.42 | 0.33–0.35 | ||
| Synthetic indicator 2 (2015–2019) | mean ± SD | 0.39 ± 0.06 | 0.46 ± 0.09 | 0.45 ± 0.07 | 0.45 ± 0.07 | p = 0.031 * |
| median | 0.38 | 0.44 | 0.45 | 0.44 | ||
| quartiles | 0.34–0.42 | 0.4–0.54 | 0.39–0.5 | 0.39–0.5 | B > A | |
| Synthetic indicator 3 (2015–2019) | mean ± SD | 0.39 ± 0.12 | 0.42 ± 0.2 | 0.45 ± 0.13 | 0.39 ± 0.03 | p = 0.208 |
| median | 0.34 | 0.44 | 0.46 | 0.39 | ||
| quartiles | 0.31–0.48 | 0.38–0.52 | 0.41–0.53 | 0.37–0.41 | ||
| Synthetic Indicator Value | Synthetic Indicator 1 (2015–2019) | Synthetic Indicator 2 (2015–2019) | Synthetic Indicator 3 (2015–2019) | p |
| mean ± SD | 0.35 ± 0.12 | 0.44 ± 0.08 | 0.39 ± 0.29 | p < 0.001 |
| median | 0.36 | 0.44 | 0.42 | |
| quartiles | 0.27–0.43 | 0.38–0.49 | 0.34–0.52 | SI2, SI3 > SI1 |
| Synthetic Indicator Value | Synthetic Indicator 1 (2005–2009) | Synthetic Indicator 2 (2005–2009) | Synthetic Indicator 3 (2005–2009) | p |
| mean ± SD | 0.26 ± 0.05 | 0.29 ± 0.03 | 0.28 ± 0.07 | p < 0.001 |
| median | 0.27 | 0.29 | 0.3 | |
| quartiles | 0.24–0.29 | 0.28–0.31 | 0.24–0.33 | SI2, SI3 > SI1 |
Publisher’s Note: MDPI stays neutral with regard to jurisdictional claims in published maps and institutional affiliations. |
© 2021 by the authors. Licensee MDPI, Basel, Switzerland. This article is an open access article distributed under the terms and conditions of the Creative Commons Attribution (CC BY) license (https://creativecommons.org/licenses/by/4.0/).
Share and Cite
Kożuch, A.; Marzęda, A. The Effects of Natural and Economic Factors on the Financial Performance of Forest Management Units: The Example of Forest Districts of the State Forests National Forest Holding from Eastern Poland. Forests 2021, 12, 1559. https://doi.org/10.3390/f12111559
Kożuch A, Marzęda A. The Effects of Natural and Economic Factors on the Financial Performance of Forest Management Units: The Example of Forest Districts of the State Forests National Forest Holding from Eastern Poland. Forests. 2021; 12(11):1559. https://doi.org/10.3390/f12111559
Chicago/Turabian StyleKożuch, Anna, and Andrzej Marzęda. 2021. "The Effects of Natural and Economic Factors on the Financial Performance of Forest Management Units: The Example of Forest Districts of the State Forests National Forest Holding from Eastern Poland" Forests 12, no. 11: 1559. https://doi.org/10.3390/f12111559
APA StyleKożuch, A., & Marzęda, A. (2021). The Effects of Natural and Economic Factors on the Financial Performance of Forest Management Units: The Example of Forest Districts of the State Forests National Forest Holding from Eastern Poland. Forests, 12(11), 1559. https://doi.org/10.3390/f12111559