Article

The Size of the Assimilatory Apparatus and Its Relationship with Selected Taxation and Increment Traits in Pine (Pinus sylvestris L.) Stands

by
Cezary Beker
*,
Mieczysław Turski
,
Katarzyna Kaźmierczak
,
Tomasz Najgrakowski
,
Roman Jaszczak
,
Grzegorz Rączka
and
Sandra Wajchman-Świtalska
Department of Forest Management, Faculty of Forestry and Wood Technology, Poznań University of Life Sciences, Wojska Polskiego 71C, 60-625 Poznań, Poland
*
Author to whom correspondence should be addressed.
Forests 2021, 12(11), 1502; https://doi.org/10.3390/f12111502
Submission received: 1 September 2021 / Revised: 25 October 2021 / Accepted: 28 October 2021 / Published: 30 October 2021
(This article belongs to the Section Forest Inventory, Modeling and Remote Sensing)

Abstract

:
Studies were carried for 200 trees coming from eight pure pine stands aged 25–95 years, growing in a fresh mixed coniferous forest habitat, in the Murowana Goślina Forest Experimental Station (52°34′ N, 17°00′ E) in western Poland. The aim of the study was to determine the size of the assimilatory apparatus of single pines (Pinus sylvestris L.): weight of leaved twigs (ugc), needle weight (ic), the volume of leaved twigs (ugo) and needle volume (io) and its relationship with selected dendrometric and increment traits of trees. The basic dendrometric traits were determined (height—h and diameter at breast height—d1.3) together with selected increments (heights—Ih5 and Ih10, diameter at breast height—Id5 and Id10, basal area at breast height—Ig5 and Ig10, volume—Iv5 and Iv10). A statistically significant linear correlation and a multiple linear correlation were shown between analysed traits, which confirms a strong relationship of the size of the assimilatory apparatus with tree increment. In this context, the strong correlation with the increment in basal area at breast height (correlation coefficient 0.8731 ÷ 0.9836) and with the increment in diameter at breast height (correlation coefficient 0.7835 ÷ 0.9581), after determining the increment in diameter at breast height requires only simple mathematical transformations to determine the increment in basal area at breast height. For the above-mentioned reasons, the increment in basal area at breast height is predisposed to be commonly used in the determination of the efficiency of the assimilatory apparatus of trees.

1. Introduction

The size of the assimilatory apparatus in trees may be characterised using different indicators, from the simplest, but at the same time less accurate dimensional traits of the crown, such as crown projection area and crown volume, to more accurate quantitative traits, e.g., weight of leaved twigs, needle weight, volume of leaved wigs and needle volume [1].
The size of the assimilatory apparatus of the crown and its efficiency in the process of organic matter production has a primary effect on tree increment. Lemke [2] stated a very strong correlation between the size of the assimilatory apparatus in pines and an increment in stem volume. This conclusion is essential for the rationalisation of decisions taken in forest economy, particularly breeding, forest management and utilisation. It is an indication for the practical application of such procedures, which by maintaining an optimal stand structure, taking into consideration the efficiency of the assimilatory apparatus—results in the maximum increment in tree volume. Growth efficiency depends on the size of the tree and the volume of needles. When determining the prescribed yield, we also need to take into consideration, next to the growing stock, the increment predicted for the coming period. The size of tree crowns is an element in the forecast of the increment capacity of trees and stands [3].
Most studies concerning the assimilatory apparatus conducted to date focused on the determination of this parameter in the aspect of the stand, and not a single tree. Publications on forest productivity referred to productive biomass per hectare depending on, e.g., mean height, site index, age or degree of stocking. In this respect, several studies may be mentioned concerning the biomass of different stands, in a global aspect [4,5,6,7,8], in the USSR [9,10], in Canada [11], in the United States [12,13,14,15], for the following specific tree species: Norway spruce [16], Scots pine [17], compared to deciduous (beech) and coniferous (spruce) species [18]. Attempts to determine the complicated structure of forest biomass using linear regression equations were undertaken by Usoltsev [19] as well as Onuchin and Borisov [20]. Later models took into consideration the total crown biomass [21,22]. Other components of biomass, such as the leaves and roots, were included when the models were made more precise by combining them with average characteristics of the stand [23,24]. Interesting studies on needle biomass in pine were conducted in Finland by Vanninen et al. [25], Mäkelä and Vanninen [26], Vanninen and Mäkelä [27], Helmisari et al. [28], Lehtonen [29] and Muukkonen [30]. Chroust [31] developed empirical equations for leaf biomass in stands located in the former Czechoslovakia, while Heinsdorf and Krauß [32] prepared dry biomass tables for Scots pine in Germany. Among other methods used to determine crown biomass, we need to mention a model proposed by Shinozaki et al. [33,34], using the stem diameter at crown base. Dry biomass in kg/ha for leaves (needles), twigs and the number of trees per hectare jointly and in 4-centimeter diameter subclasses, depending on site index and age of the stand, are given in “Tables of crown biomass for even-aged stands of Picea abies in Switzerland” [24]. The above-mentioned authors also evaluated crown biomass in forest tree species from the Ural Mountains and Kazakhstan [35]. Studies on the determination of tree crown biomass were also conducted by Danilov [36], Smirnov [37], Babich [38], Sokolov et al. [39] and Sokolov and Kurbanov [40].
The first tables facilitating an estimation of fresh needle mass in Scots pine were prepared by Burger [41], on the basis of 210 trees coming from 58 stands. Studies on the size of the assimilatory apparatus, although on a much lesser scale, were also undertaken by Tiren [42], Dengler [43] and Badoux [44]. The size of the assimilatory apparatus was typically characterised using the weight of fresh or dry needles, the number of needles or their upper area [45]. Currently, research is underway on carbon content by tree species, biomass components and the impact of environmental factors on these values [46,47].
In Poland, an attempt to estimate the size of the assimilatory apparatus, approximated as the volume of leaved twigs in pine stands, was undertaken by Lemke [48,49]. His further studies [50,51] resulted in the development of “Tables for the estimation of needle weight and needled twigs in Scots pine” on sites typical of this species. These studies, conducted over a period of many years on a rich empirical material of 1808 trees from 33 stands, were crowned with the development of “Tables of the assimilatory apparatus in Scots pine (Pinus sylvestris L.)” [52] using regression equations as variables of the simple dimensional traits of trees (diameter at breast height and height) and their age. Socha and Wężyk [53], on the basis of investigations conducted in forests located in Niepołomice, proposed allometric equations for the estimation of needle biomass in Scots pine.
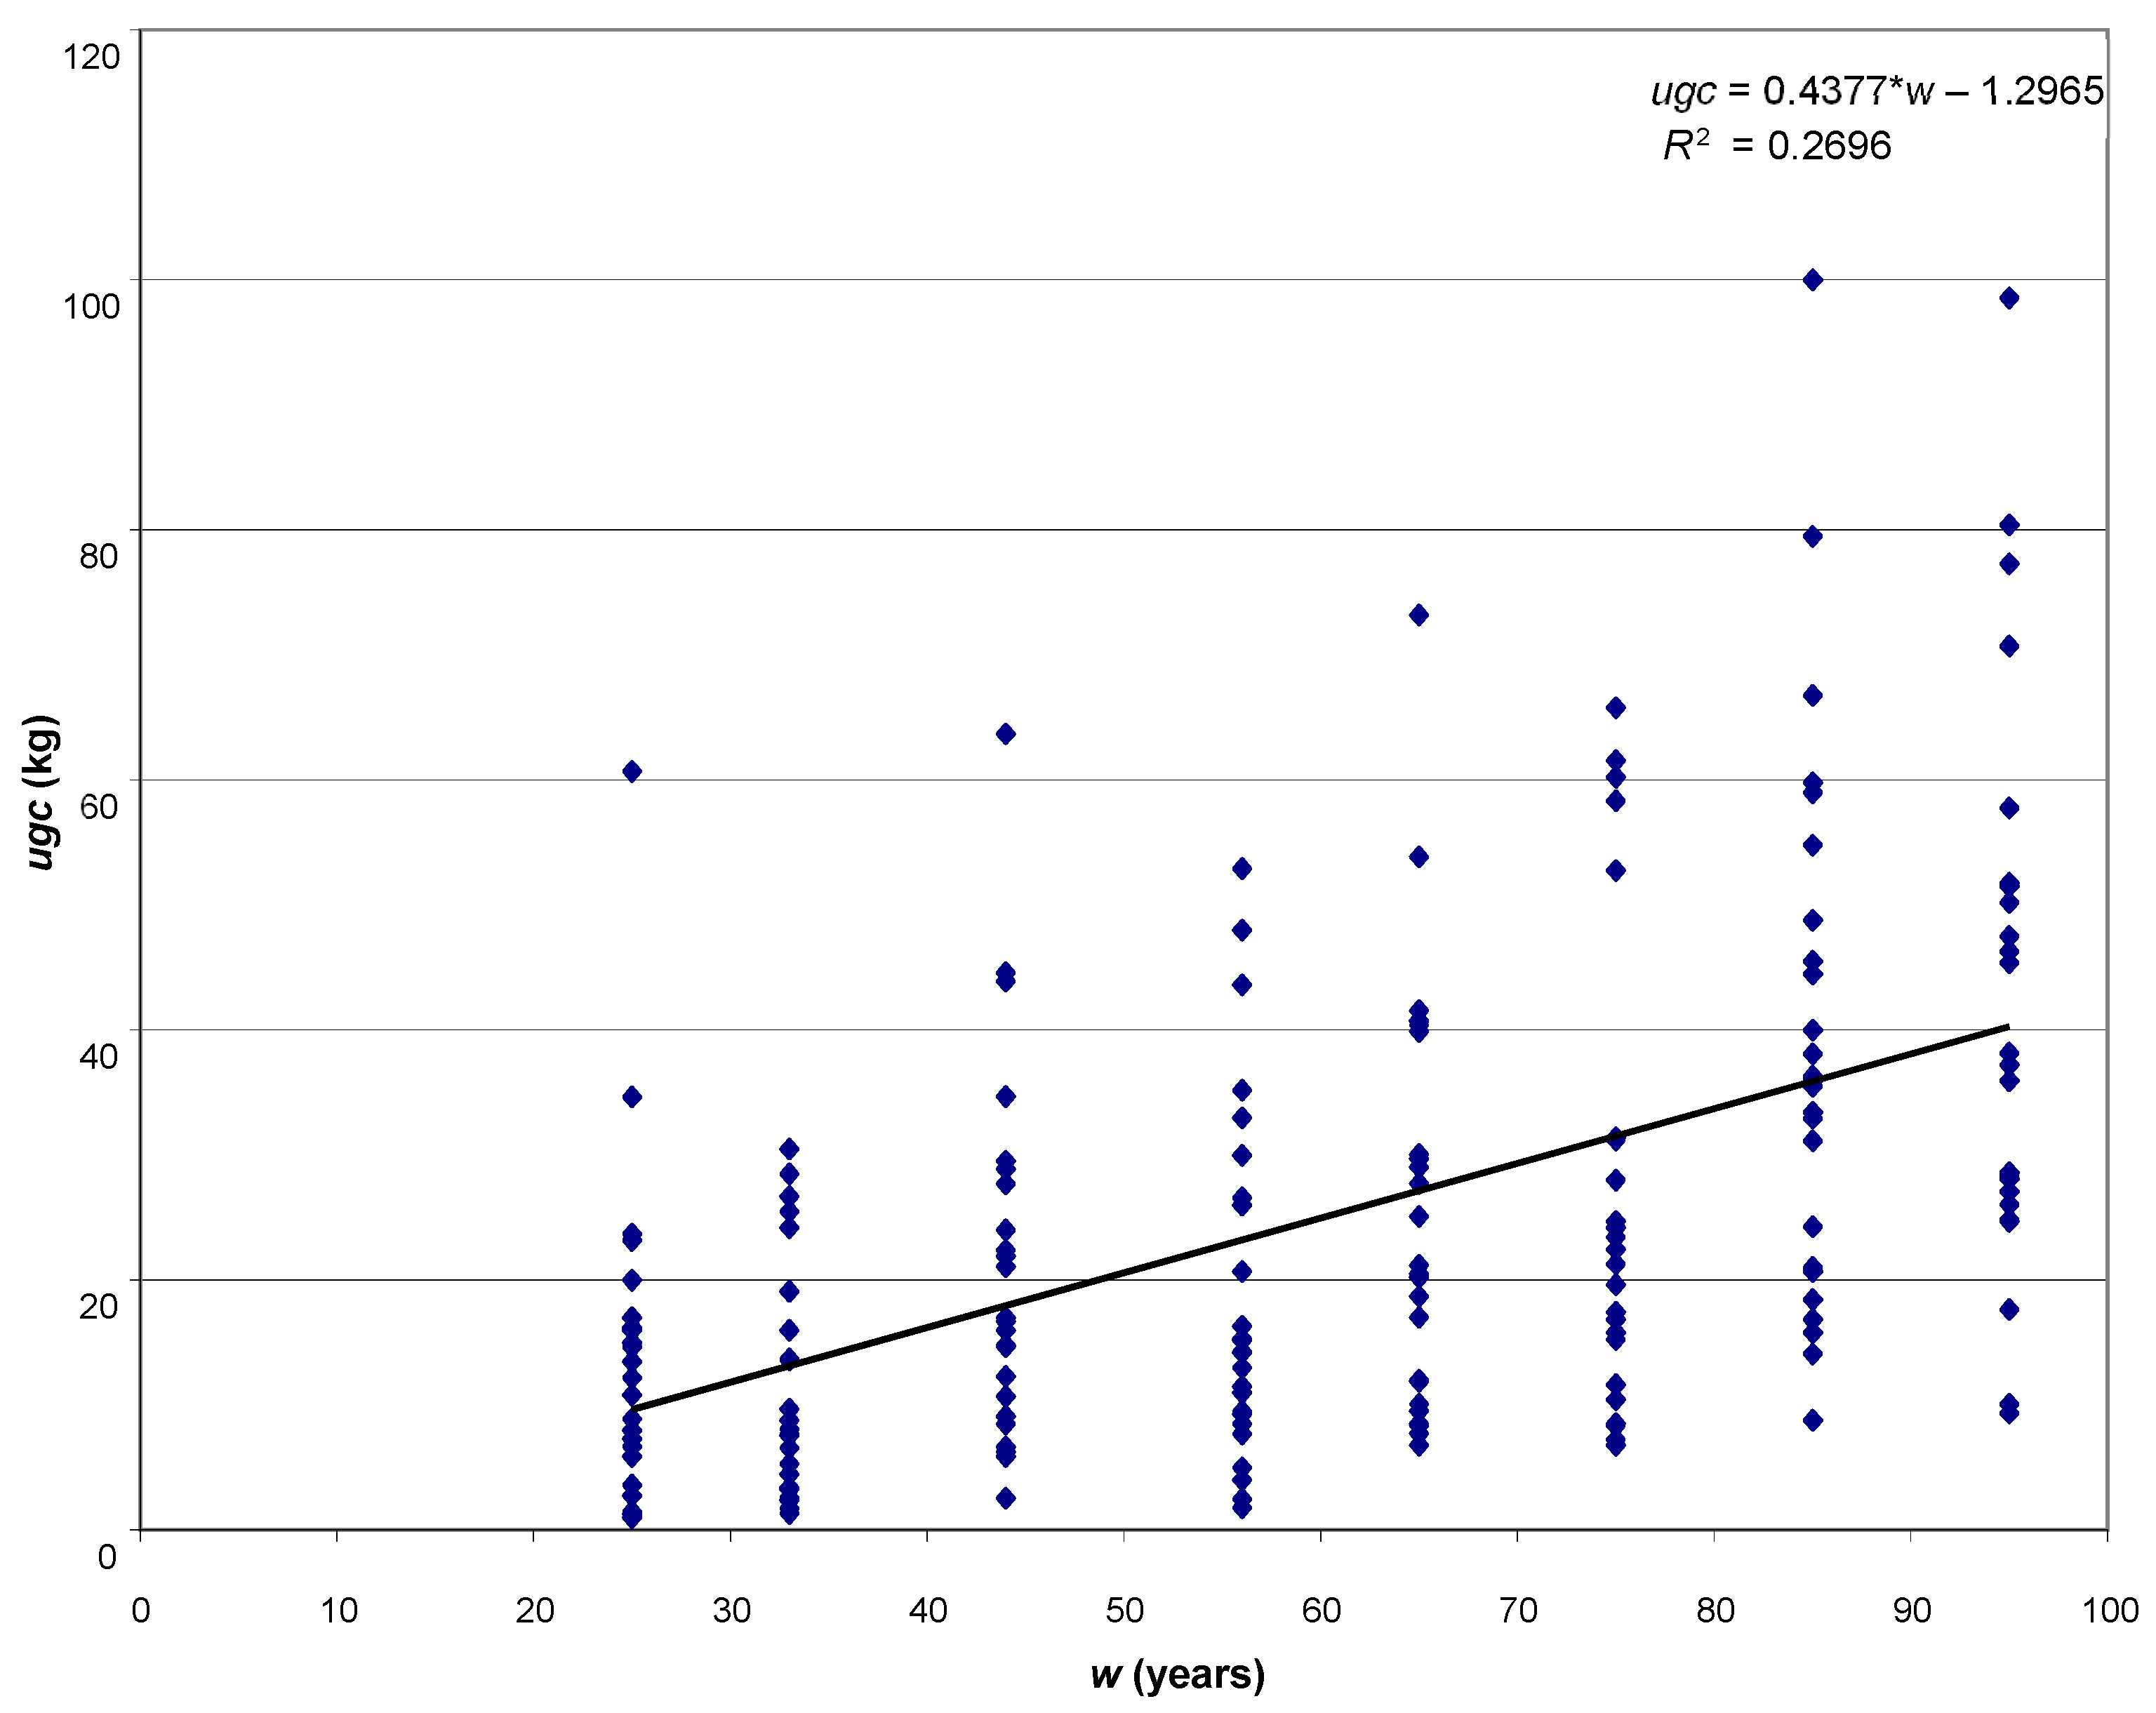
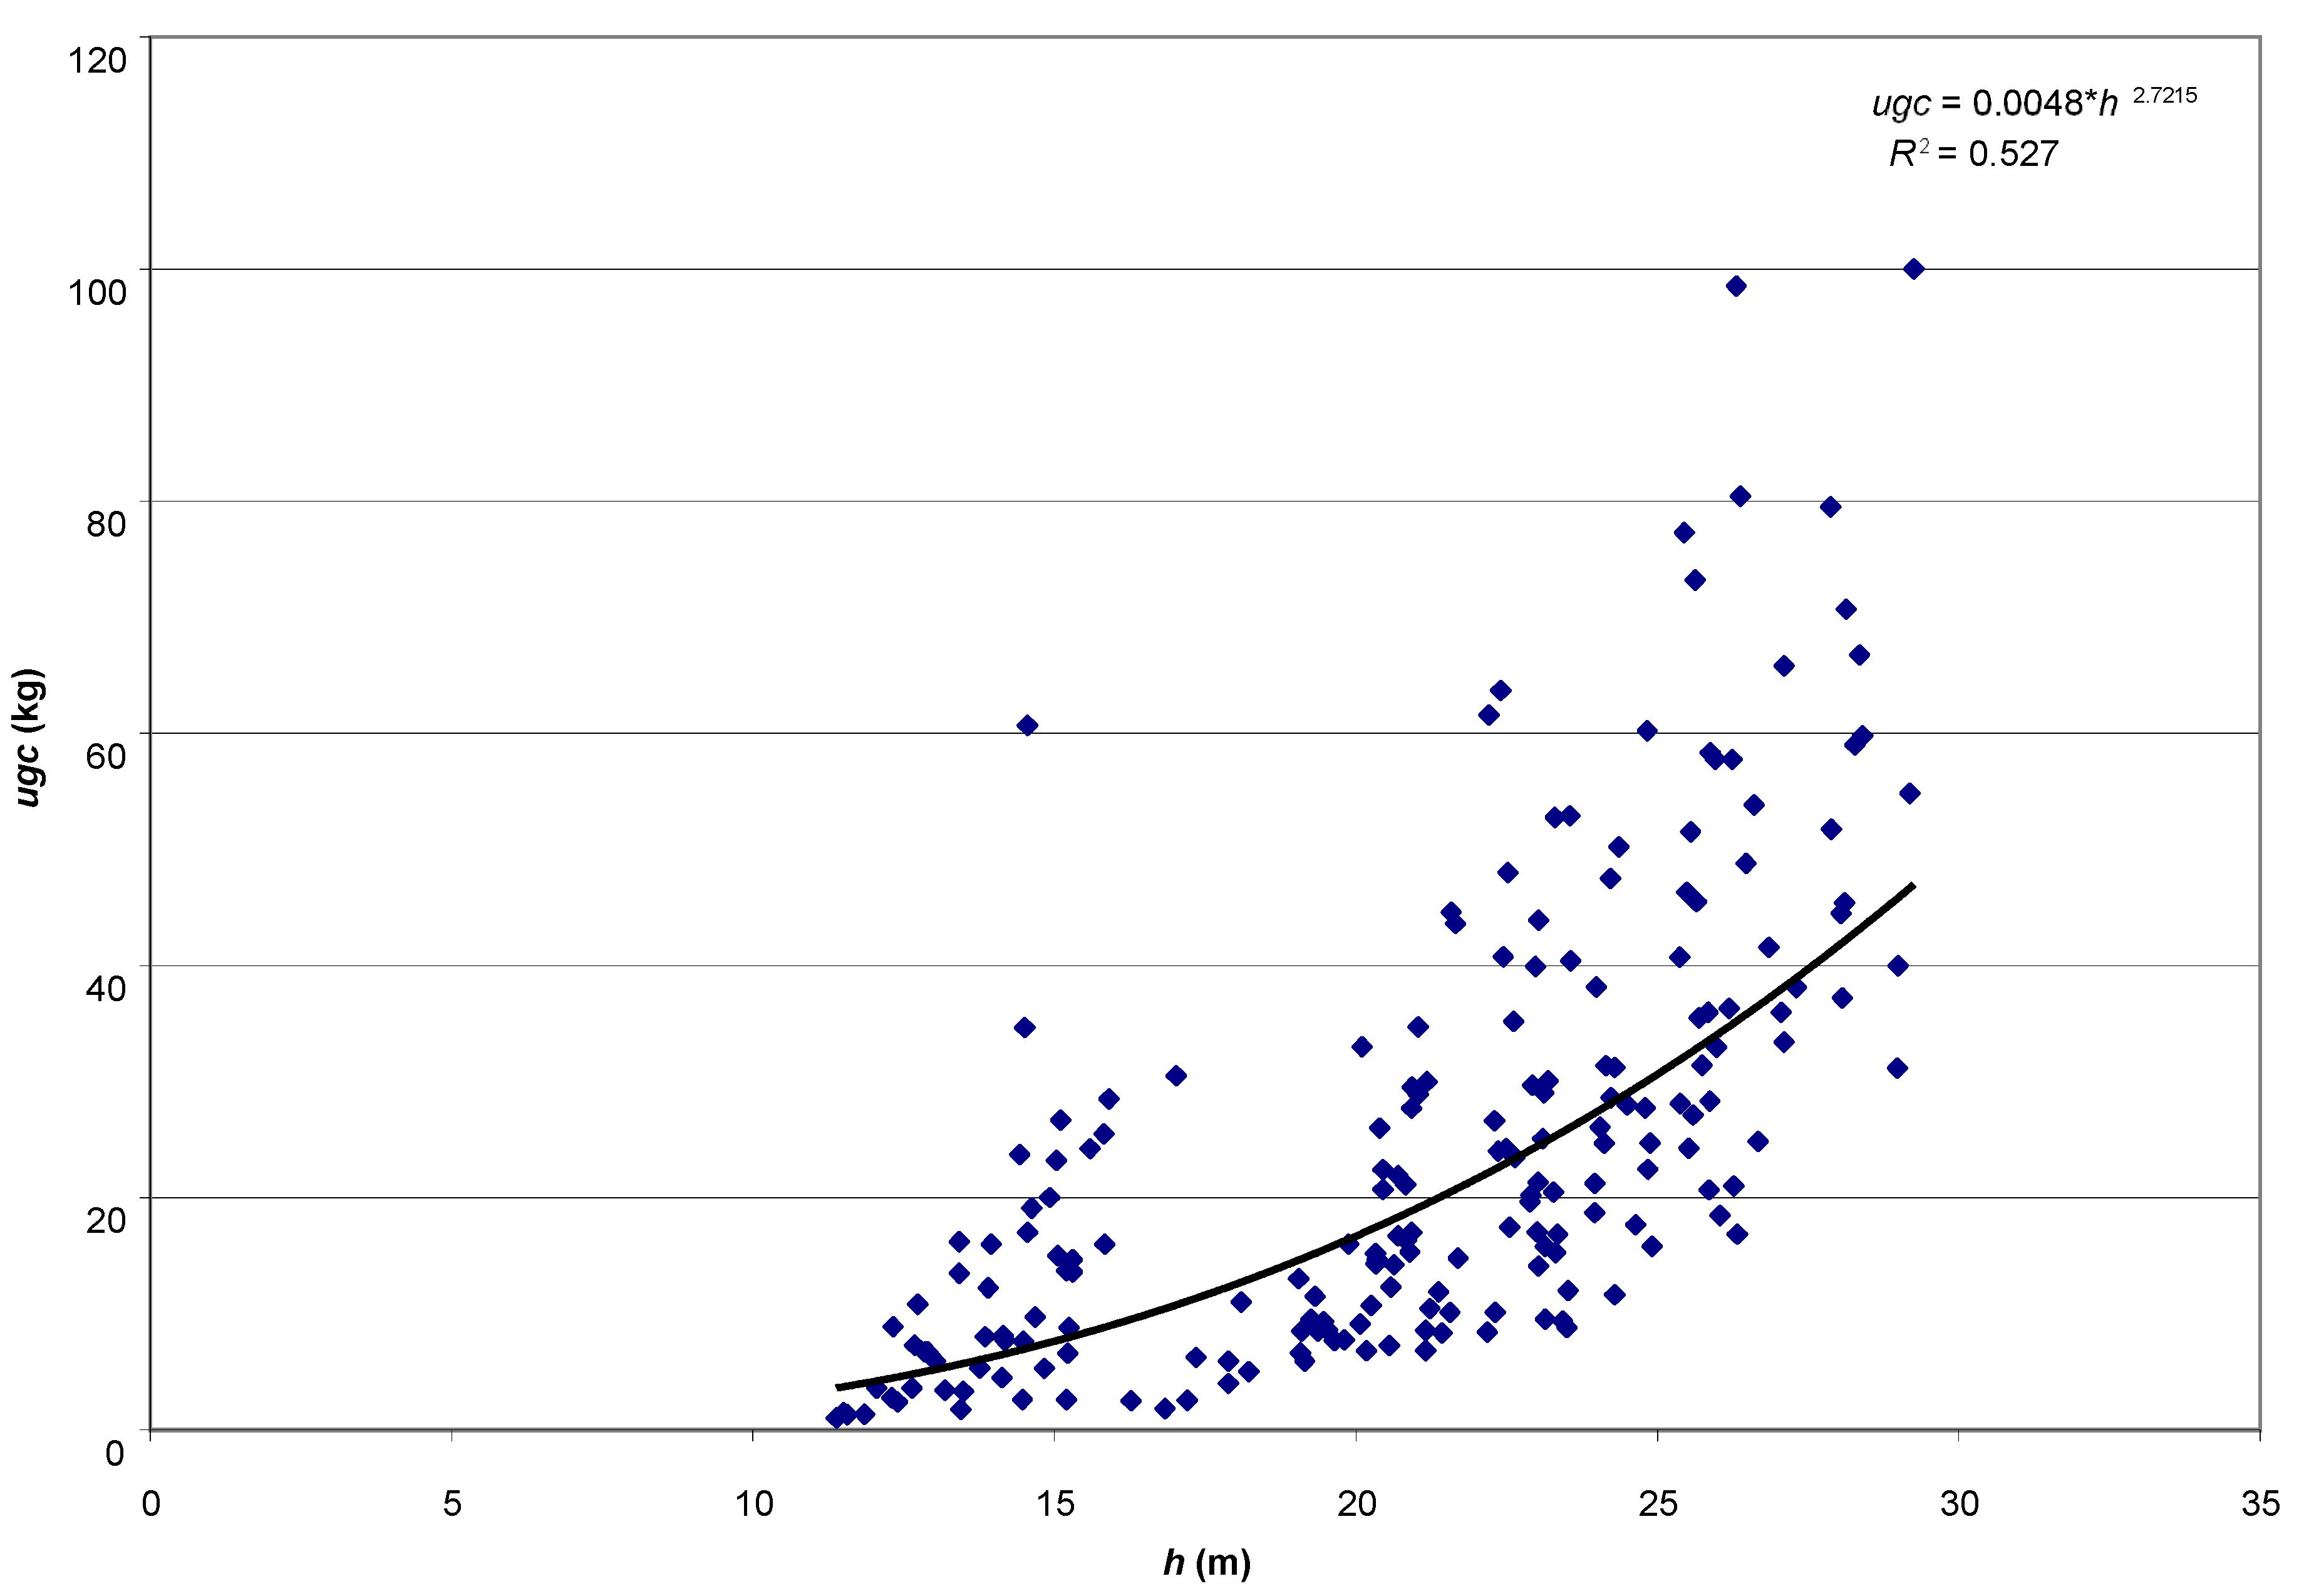
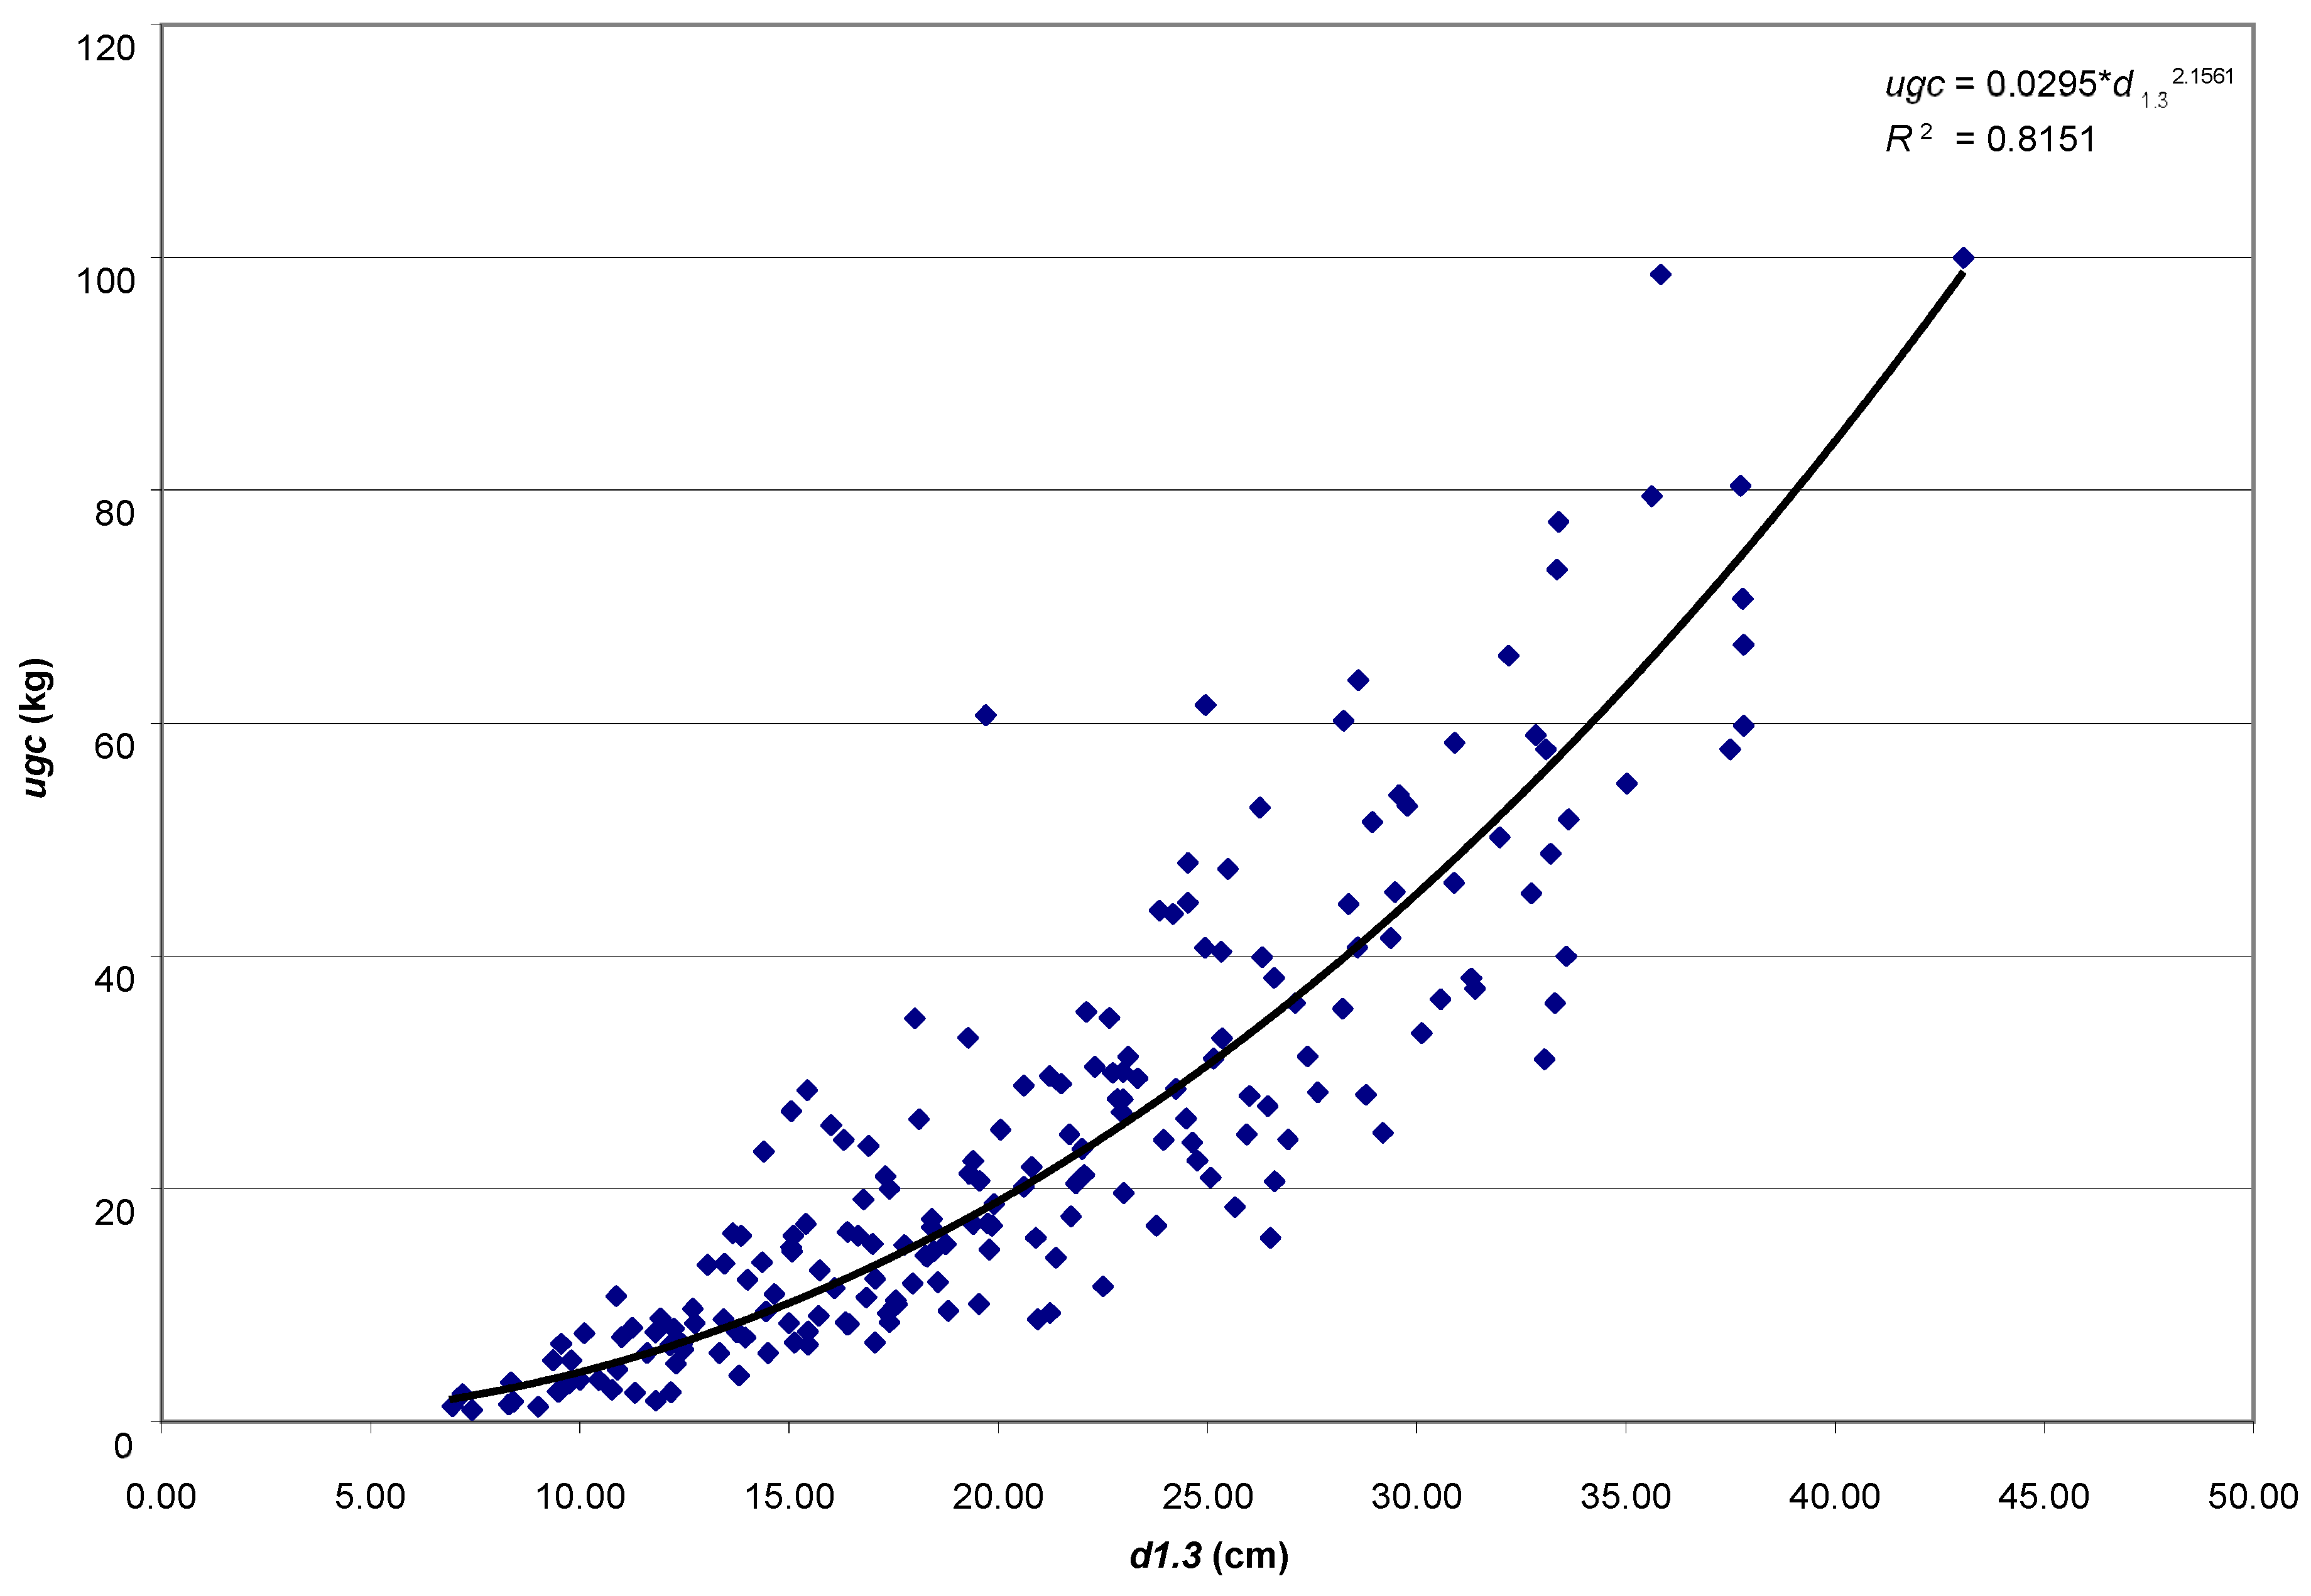
The aim of the study was to determine the size of the assimilatory apparatus of single pines: weight of leaved twigs (ugc), needle weight (ic), the volume of leaved twigs (ugo) and needle volume (io), and its relationship with selected dendrometric and increment traits of trees. A research hypothesis was made that the basic taxation features (age, height and diameter at breast height) will be strongly related to the weight of leaved twigs, thanks to which it will be possible to use them in the future to develop a local model of the Scots pine biomass fraction.

2. Material and Methods

The analytical material comprises results of measurements for 200 trees coming from 8 pure pine stands aged 25–95 years, growing on the fresh mixed coniferous forest habitat, in the Murowana Goślina Forest Experimental Station (52°34′ N, 17°00′ E) in western Poland. Average temperature in the five years before the study was 8.02 °C, and average annual rainfall was 544.2 mm.
In each stand, one plot with 200–350 trees was chosen. The location of a plot in a stand was supposed to minimize the non-age-related differences between trees. All plots created a trajectory of changes resulted from the chronosequence. On trees from all the 8 mean sample plots, the position of breast heights and the direction of north were permanently marked. The breast height diameter of the outside bark was measured crosswise from two directions of NS and EW rounded to 1 mm. The average diameter at breast height was calculated as the arithmetic mean of both these measurements rounded to 1 mm. Tree heights were measured in terms of diameter subclasses and levelled heights were determined on the basis of the height curve. For each stand, a total of 25 mean sample trees were selected. The number and dimensions of mean sample trees in diameter subclasses were established in accordance with the Draudt method [54]. The number of model trees falling into each diameter subclass was proportional to the number of trees in each diameter subclass. Mean sample trees with appropriately shaped medium-sized crowns were selected. The size of crowns and their conditions status were estimated by sight. Total stem length was measured on felled trees accurate to 1 cm. Next, discs were cut from the length of 0.0 m, 1.30 m, as well as 0.5 m, 1.5 m, 2.5 m, and the end of the last complete section. If a verticil swelling or another deformation was found in the position from which a disc was to be collected, a disc was cut from a regular fragment located in the nearest vicinity. Such collected analytical material was adequately secured to be transported to the laboratory. The weight of the leaved twigs of the crown was determined on the basis of a direct measurement of this trait. From each crown, all needle-covered twigs were collected, and they were next weighed immediately after being cut off. For 200 mean sample trees, after the sample from each tree had been weighed, additionally needle volume, together with twigs, was determined using xylometry. Measurements were always taken at the date of sample collection. Samples of fresh twigs with needles were collected for laboratory analyses. From 25–56-, and 65–95-years-old trees, 20 or 10% of twigs were collected for laboratory analyses, respectively. The sample mass twigs with needles, not less than 2 kg, depended on the stand age. Prior to measurement samples labelled with information on the number of the mean sample plot and the number of the tree—were stored in plastic bags to prevent them from drying. Next, in the course of laboratory studies using a DPM 001 electronic increment meter (Vienna, Austria) according to K. Johann, the number of annual growth rings was determined, and diameters were measured accurate to 0.01 mm in 5-year periods on all discs coming from 200 mean sample trees. To analyse the stems, increment values of the following dendrometric traits were collected within 5- and 10-year periods: height, diameter at breast height, basal area at breast height and volume. Within the age classes, Pearson’s linear and multiple correlation and the corresponding significance levels were determined between the features of the assimilation apparatus (weight of leaved twigs (ugc), needle weight (ic), the volume of leaved twigs (ugo), needle volume (io)) and the basic dendrometric traits (height—h and diameter at breast height—d1.3) and with selected increments (height—Ih5 and Ih10, diameter at breast height—Id5 and Id10, basal area at breast height—Ig5 and Ig10, volume—Iv5 and Iv10). For all empirical material, the functional dependencies of the weight of leaved twigs on the age, height and diameter at breast height of trees were presented (power function, coefficient of determination, correlation coefficient). All analyses were performed in the Statistica ver. 13 (TIBCO Software Inc. 2017).

3. Results

3.1. Structure of Dendrometric and Increment Traits as Well as the Size of the Assimilatory Apparatus in Trees

The structural characteristics of each stand were as follows: the stocking index was 0.81−1.23, the number of trees per hectare was 402−2927, the average diameter at breast height was 13.4−31.4 cm and the mean stand height was 15.49−28.32 m, the basal area per hectare was 31.13−43.15 m2, the volume per hectare was 256.36−396.21 m3; these are presented in Table 1.
Arithmetic means and coefficients of variation for dendrometric and increment traits are presented in Table 2 and Table 3.
The means for the values of the basic dendrometric characteristics increase with age, for height (h) ranging from 13.39 to 26.81 m and for diameter at breast height (d1.3) from 12.23 to 30.23 cm. A lower coefficient of variation, the value of which decreases with age, is characterised for height from 9.0 to 5.9%. In the case of diameter at breast height, it falls with the range of 29.5 to 17.6%. The mean values of increment in height and increment in diameter at breast height show a downward trend with age, ranging from 2.83 to 0.71 m for 5-year (Ih5) and from 5.67 to 1.24 m for 10-year increments in height (Ih10), as well as the range from 1.53 to 1.12 cm for 5-year (Id5) and from 2.98 to 2.07 cm for 10-year increments in diameter at breast height (Id10). In turn, the mean values of increment in basal area at the breast height increment and the volume increment exhibit an upward trend with age, from 0.0022 to 0.0062 m2 for the 5-year (Ig5) and from 0.0037 to 0.0110 m2 for the 10-year basal area at breast height increment (Ig10), as well as from 0.0274 to 0.1168 m3 for the 5-year (Iv5) and from 0.0448 to 0.2004 m3 for the 10-year volume increment (Iv10). In case of increment traits, the smallest variation was observed for an increment in height and the greatest for increments in basal area at breast height area and in volume. The length of the growing period influences the value of the coefficient of variation in analysed traits. A lower variation was recorded for increments in the 10-year period.
Table 4 and Table 5 present the basic descriptive statistics (arithmetic mean, coefficient of variation) of the size of the assimilatory apparatus. The mean values of the assimilatory apparatus in trees increased with age, for the weight of leaved twigs (ugc) from 11.15 to 42.85 kg, needle weight (ic) from 7.30 to 31.39 kg, volume of leaved twigs (ugo) from 12.4 to 46.54 dm3 and needle volume (ic) from 8.18 to 33.38 dm3. The discussed traits exhibit a similar variability, with coefficients of variation decreasing with age within the range from 100.1 to 51.8%.

3.2. A Dependence between the Size of the Assimilatory Apparatus and Dendrometric and Increment Traits of Trees

The values of linear correlation coefficients between the size of the assimilatory apparatus and basic dendrometric traits are presented in Table 6. They are positive and statistically significant in all the stands. A stronger correlation with the size of the assimilatory apparatus was found for the diameter at breast height, with the power of correlation ranging from 0.8358 to 0.9684.
For all the empirical material, the following are presented: dependences of the weight of leaved twigs on age: ugc = 0.1741 * w1.1506, R2 = 0.2931, r = 0.5414 (Figure 1); height: ugc = 0.0048 * h2.7515, R2 = 0.527, r = 0.7259 (Figure 2) and diameter at breast height: ugc = 0.0295 * d1.32.1561, R2 = 0.8151, r = 0.9028 (Figure 3).
Table 7, Table 8, Table 9 and Table 10 present values of coefficients of linear correlation between the size of the assimilatory apparatus and increment traits. In a vast majority of cases, a positive, statistically significant relationship was found for these traits. Only in 15 out of 256 cases was the relationship between the size of the assimilatory apparatus and increment in height in stands of older age classes statistically non-significant. In case of the size of the assimilatory apparatus, the strongest statistical correlation with increment traits was found for needle weight (0.4084 ÷ 0.9836), followed by the volume of leaved twigs (0.4098 ÷ 0.9799), weight of leaved twigs (0.4093 ÷ 0.9791) and needle volume (0.3956 ÷ 0.9805). Among increment traits, the strongest statistically significant correlation with the volume of the assimilatory apparatus was observed for the increment in basal area at breast height (0.8731 ÷ 0.9836), followed by volume increment (0.8313 ÷ 0.9790), basal area at breast height increment (0.7835 ÷ 0.9581) and increment in height (0.3956 ÷ 0.7577), respectively.
Values of multiple correlation coefficients between the size of the assimilatory apparatus and height as well as diameter at breast height are presented in Table 11. In all the stands, they were positive and statistically highly significant. Taking into consideration the size of the assimilatory apparatus, the strongest relationship with height and diameter at breast height was found for the volume of leaved twigs (0.8811 ÷ 0.9686), followed by the weight of leaved twigs (0.8782 ÷ 0.9627), needle weight (0.8691 ÷ 0.9647) and needle volume (0.8674 ÷ 0.9650). Similarly, as with simple correlations, also in these cases, the dependencies did not show an evident relationship with tree age.

4. Discussion

The increment of trees depends, primarily, on the size of the assimilation apparatus of the crown and its efficiency to produce organic matter. The growth of individual forest trees declines with advancing age and the decline results from reduced resource use efficiency [55]. Lemke [2] stated a very strong correlation between the size of the assimilatory apparatus in pines and an increment in stem volume. When comparing results in this study with those reported from investigations conducted by Lemke [48,56] and Lemke and Kaźmierczak [3], in pine stands of a similar age from 15 to 114, growing in the same habitat, fresh mixed coniferous forest, comparable dependencies of the size of the assimilatory apparatus with basic dendrometric traits and increment were observed in the trees. In the cited studies, a stronger relationship with the assimilatory apparatus was recorded in relation to the diameter at breast height in terms of height (correlation from 0.781 to 0.962), which was slightly weaker, as in this study (from 0.836 to 0.968). The strongest relationship with the weight of leaved twigs and needle weight was recorded for the increment in volume (correlation from 0.707 to 0.980), in this study (from 0.843 to 0.979); it was slightly weaker for the increment in basal area at breast height (from 0.656 to 0.959), in this study (from 0.852 to 0.984); followed by the increment in diameter at breast height (from 0.563 to 0.887), in this study (from 0.791 to 0.945) and the increment in height (from −0.115 to 0.816), in this study (from 0.021 to 0.758). In the case of the latter of the above-mentioned traits, the dependencies were statistically non-significant in some stands. The age of the stand generally did not have any effect on the power of the analysed dependencies.
The basic taxation features are strongly related to the weight of leaved twigs, thanks to which it is possible to use them to develop a local model of the Scots pine biomass fraction. The equations, based on universal features of standing trees (age, height and diameter at breast height), are simple in use and applicable for trees growing in stands, especially on sites typical for pine. The majority of allometric equations that can be found in the literature concern the dry biomass of the crown; only very few models predict the fresh mass of twigs with needles of individual pine trees [52]. The only ones, based on the same independent variables as the one discussed above, are multinomial equations proposed by Lemke [51] for use with different parameter sets for different age classes. In a publication, Socha and Wężyk [53] proposed a wide set of equations based on many more independent variables e.g., basal area increment, absolute crown length and relative crown length.
The increasing demand for credible biomass and carbon estimates at widely varying spatial scales requires circumspect evaluations of the sampling and modelling practices used for biomass equation development. The accuracy of forest biomass estimates can be improved, including estimates of the aboveground live tree components as well as the dead and nontree fractions [45].

5. Conclusions

A strong relationship between the size of the assimilatory apparatus and the basic dendrometric traits (height and diameter at breast height) confirms their applicability as variables in the development of allometric equations. In order to enhance the accuracy of regression equations, they should additionally include the age of trees as an independent variable. The application of these traits is of great practical importance, since they are determined within the framework of general stand valuations.
Taking into consideration the relationship of the size of the assimilatory apparatus with increment traits, we need to stress, in this context, a strong correlation with the increment in basal area at breast height (correlation coefficient of 0.8731 ÷ 0.9836). This trait is much easier to determine in the course of measurement work and at the same time it is much more objective in terms of the expected accuracy when compared with an increase in volume. In relation to the diameter at breast height increment (correlation coefficient of 0.7835 ÷ 0.9581), after the measurement of the diameter at breast height and its increment, it requires only simple mathematical transformations. For the above-mentioned reasons, the increment in breast height section area is predisposed to be commonly used in the determination of the efficiency of the assimilatory apparatus of trees. In contrast, increment in height may not be used for this purpose.
Characteristics of the assimilatory apparatus show a similar relationship with the analysed types of increment in trees. Thus, due to the lower consumption of labour and expenses, studies should be based on the weight of leaved twigs.

Author Contributions

Conceptualisation and methodology, C.B. and M.T.; field and laboratory work, C.B., M.T., K.K. and T.N.; formal analysis, C.B. and M.T.; writing—original draft preparation, C.B. and M.T.; writing—review and editing, C.B., M.T. and R.J.; visualization, C.B., M.T., R.J., G.R. and S.W.-Ś.; revising the manuscript, C.B., M.T., R.J., G.R. and S.W.-Ś. All authors have read and agreed to the published version of the manuscript.

Funding

This works was co-financed within the framework of Ministry of Science and Higher Education programme as “Regional Initiative Excellence” in years 2019–2022, project number 005/RID/2018/19.

Data Availability Statement

The data that support the findings of this study are available from the corresponding author upon reasonable request.

Conflicts of Interest

The authors declare no conflict of interest.

Nomenclature

Measured traits:
d1.3stem diameter at breast height (dbh)
hheight
ugcmass of needles weight of leaved twigs
icneedle weight
ugovolume of leaved twigs
ioneedle volume
wage of tree
Id55-years dbh increment
Id1010-years dbh increment
Ig55-years basal area at breast height increment
Ig1010-years basal area at breast height increment
Ih55-years height increment
Ih1010-years height increment
Iv55-years volume increment
Iv1010-years volume increment
Site description:
BMśwfresh mixed coniferous forest habitat
Statistical characteristic:
rcoefficient of linear correlations
R2coefficient of determination
Rcoefficient of multiple correlations

References

  1. Borowski, M. Przyrost Drzew i Drzewostanów (Growth of Trees and Stands); PWRiL: Warszawa, Poland, 1974; p. 354. [Google Scholar]
  2. Lemke, J. Ciężar igliwia, ulistnionych gałązek a przyrost miąższości strzały w drzewostanach sosnowych (Weight needles, leafy twigs and volume increment of stems in pine stands). Sylwan 1974, 5, 10–20. Available online: https://sylwan.lasy.gov.pl/apex/f?p=105:2:::NO:RP,2:P2_ZESZYT:1974_5 (accessed on 27 September 2021).
  3. Lemke, J.; Kaźmierczak, K. Zależność między aparatem asymilacyjnym a niektórymi rodzajami przyrostu drzew w drzewostanach sosnowych (The relationship between the assimilation apparatus and different types of tree increment in pine stands). PTPN 1993, 76, 73–78. [Google Scholar]
  4. Rodin, L.E.; Bazilevich, N.I. Production and Mineral Cycling in Terrestrial Vegetation; Oliver and Boyd: Edinburgh, UK; London, UK, 1967; p. 288. [Google Scholar]
  5. Madgwick, H.A.I. Biomass and productivity models of forest canopies. In Ecological Studies, Analysis of Temperate Forest Ecosystems; Reichle, D.E., Ed.; Springer: New York, NY, USA, 1970; Volume 1, pp. 47–54. [Google Scholar]
  6. Reichle, D.E. Dynamic Properties of Forest Ecosystems; International Biological Programme 23; Cambridge University Press: Cambridge, UK, 1981; p. 738. [Google Scholar]
  7. Cannell, M.G.R. World Forest Biomass and Primary Production Data; Academic Press: London, UK, 1982; p. 391. [Google Scholar]
  8. Valentine, H.T.; Tritton, L.M.; Furnival, G.M. Subsampling trees for biomass, volume, or mineral content. For. Sci. 1984, 30, 673–681. [Google Scholar]
  9. Utkin, A.I. Issledovania po pervichnoi biologicheskoi produktivnosti lessov v SSSR (Studying the primary biological productivity of the USSR forests). Lesovedenie 1970, 6, 58–89. [Google Scholar]
  10. Pozdnyakov, L.K. Produktivnost lesov Sibiri (Productivity of Siberian forests). In Resursy Biosfery Vypusk 1 (Biosphere Resources. Issue 1); Nauka: Leningrad, Russia, 1975; Volume 1, pp. 43–55. [Google Scholar]
  11. Stanek, W.; State, D. Equations Predicting Primary Productivity (Biomass) of Trees Shrubs and Lesser Vegetation Based on Current Literature; Pacific Forest Resources Centre, Canadian Forest Service: Victoria, BC, Canada, 1978; p. 58. Available online: https://digitalcommons.usu.edu/cgi/viewcontent.cgi?article=8128&context=aspen_bib (accessed on 27 September 2021).
  12. Gholz, H.L.; Grier, C.C.; Campbell, A.G.; Brown, A.T. Equations for Estimating Biomass and Leaf Area of Plants in the Pacific Northwest; School of Forestry, Oregon State University: Corvallis, OR, USA, 1979; p. 39. Available online: http://hdl.handle.net/1957/8239 (accessed on 27 September 2021).
  13. Alaback, P.B. Biomass regression equations for understory plants in coastal Alaska, effects of species and sampling design on estimates. Northwest Sci. 1986, 60, 90–103. Available online: http://hdl.handle.net/2376/1793 (accessed on 27 September 2021).
  14. Alaback, P.B. Biomass–dimension relationships of understory vegetation in relation to site and stand age. In Estimating Tree Biomass Regressions and Their Error, Proceedings of the Workshop, Syracuse, NY, USA, 26–30 May 1986; Wharton, E., Cunia, T., Eds.; General Technical Report NE-117; USDA Forest Service: Syracuse, NY, USA, 1987; pp. 141–148. [Google Scholar]
  15. Wharton, E.H.; Cunia, T. Estimating tree biomass regressions and their error. In Proceedings of the Workshop on Tree Biomass Regression Functions and Their Contribution to Error of Forestry Inventory Estimates, Syracuse, NY, USA, 26–30 May 1986; p. 303. [Google Scholar]
  16. Palumets, J. Analysis of Phytomass Partitioning in Norway Spruce; VIII Scripta Botanica, Tartu Uelikool: Tartu, Estonia, 1991; p. 95. [Google Scholar]
  17. Urban, J.; Cermak, J.; Ceulemans, R. Above- and below-ground biomass, surface and volume, and stored water in a mature Scots pine stand. Eur. J. For. Res. 2015, 134, 61–74. [Google Scholar] [CrossRef] [Green Version]
  18. Grote, R. Foliage branch biomass estimation of coniferous and deciduous tree species. Silva Fenn 2002, 36, 779–788. [Google Scholar] [CrossRef] [Green Version]
  19. Usoltsev, V.A. Prognozirovanye biologicheskoi produktivnosti beryosy i ociny v kolochnikh lesakh (Predicting biological productivity of birch and aspen island-like forests). Vestn. S. Kh. Nauk. Kazakhstana 1983, 6, 69–77. [Google Scholar]
  20. Onuchin, A.A.; Borisov, A.N. Opyt taksatsii fitomassy sosnovikh drevostoev (Trial in measuring the phytomass of Scots pine stands). Lesovedenie 1984, 6, 66–71. [Google Scholar]
  21. Usoltsev, V.A. Mezhdunarodny lesnoi monitoring, globalnye ekologicheskie programmy i basy dannykh o fitomasse lesov (International forest biomass monitoring, global ecological programs and forest biomass databases). Lesn. Khozyaistvo (For. Manag.) 1995, 5, 33–35. [Google Scholar]
  22. Grote, R.; Reiter, I.M. Competition-dependent modelling of foliage biomass in forest stands. Trees 2004, 18, 596–607. [Google Scholar] [CrossRef]
  23. Usoltsev, V.A. Rost i Struktura Fitomassy Drevostoev (Growth and Structure of Stands Phytomass); Nauka: Novosibirsk, Russia, 1988; p. 253. [Google Scholar]
  24. Usoltsev, V.A.; Hoffmann, C.W. A preliminary crown biomass table for even-aged Picea abies stands in Switzerland. Scand. J. For. Res. 1997, 12, 273–279. [Google Scholar] [CrossRef]
  25. Vanninen, P.; Ylitalo, H.; Sievänen, R.; Mäkelä, A. Effects of age and site quality on the distribution of biomass in Scots pine (Pinus sylvestris L.). Trees 1996, 10, 231–238. [Google Scholar] [CrossRef]
  26. Mäkelä, A.; Vanninen, P. Impact size and competition on tree form and distribution of aboveground biomass in Scots Pine. Can. J. For. Res. 1998, 28, 216–227. [Google Scholar] [CrossRef]
  27. Vanninen, P.; Mäkelä, A. Needle and stem wood production in Scots pine (Pinus sylvestris) trees of different age, size and competitive status. Tree Physiol. 1999, 20, 527–533. [Google Scholar] [CrossRef] [Green Version]
  28. Helmisari, H.S.; Makkonen, K.; Kellomaki, S.; Valtonen, E.; Malkonen, E. Below-and above-ground biomass, production and nitrogen use in Scots pine stands in eastern Finland. For. Ecol. Manag. 2002, 146, 317–326. [Google Scholar] [CrossRef]
  29. Lehtonen, A. Estimating foliage biomass in scots pine (Pinus sylvestris) and Norway spruce (Picea abies) plots. Tree Physiol. 2005, 25, 803–811. [Google Scholar] [CrossRef]
  30. Muukkonen, P. Generalized allometric volume and biomass equations for some tree species in Europe. Eur. J. For. Res. 2007, 126, 157–166. [Google Scholar] [CrossRef]
  31. Chroust, L. Above ground biomass of young pine forest (Pinus sylvestris) and its determination. Commun. Inst. For. Cechoslov. 1985, 14, 127–145. [Google Scholar]
  32. Heinsdorf, D.; Kraub, H.-H. Schätztafeln für Trockenmasse und Nährstoffspeicherung von Kiefernbeständen. IFE-Ber. Forsch. Entwickl. 1990, 18, 77. [Google Scholar]
  33. Shinozaki, K.; Yoda, K.; Hozumi, K.; Kira, T. A quantitative analysis of plant form—The pipe model theory 1, basic analysis. Jpn. J. Ecol. 1964, 14, 97–105. [Google Scholar] [CrossRef]
  34. Shinozaki, K.; Yoda, K.; Hozumi, K.; Kira, T. A quantitative analysis of plant form—The pipe model theory: 2, further evidence of the theory and its application in forest ecology. Jpn. J. Ecol. 1964, 14, 133–139. [Google Scholar] [CrossRef]
  35. Hoffmann, C.W.; Usoltsev, V.A. Tree-crown biomass estimation in forest species of the Ural and of Kazakhstan. For. Ecol. Manag. 2002, 158, 59–69. [Google Scholar] [CrossRef]
  36. Danilov, M.D. Variation of needle mass and moisture content of spruce in relation to needle age and age of the tree. Rep. USSR Acad. 1948, 61, 375–378. [Google Scholar]
  37. Smirnov, V.V. Organic Mass in Some Forests of the European Part of USSR; Nauka: Moscow, Russia, 1971; p. 362. [Google Scholar]
  38. Babich, N.A. Exactness of forest stand biomass calculation. Lesovedenie 1989, 1, 112–114. [Google Scholar]
  39. Sokolov, P.A.; Kurbanov, E.A.; Petrushev, A.O. Dynamics of biomass in the pine stands of the Central Povolgie Region. In Proceedings of the 20th IFSS, Padova, Italy, 20 September–1 October 1992; pp. 244–245. [Google Scholar]
  40. Sokolov, P.A.; Kurbanov, E.A. Estimation of crown biomass in the lime stands of European part of Russia. Forestry 1999, 72, 75–77. [Google Scholar] [CrossRef]
  41. Burger, H. Holz, Blattmenge und Zuwachs. IX Mitteilung: Die Föhre. Mitt. Schweiz. Anst. Forstl. Vers. 1948, 25, 435–493. [Google Scholar]
  42. Tiren, L. Über die Grösse der Nadelfläche einiger Kiefernbestände. Mitt. Aus Forstl. Vers. Schwed. 1927, 23, 295–336. [Google Scholar]
  43. Dengler, A. Kronengrösse, Nadelmenge und Zuwachsleistung von Altkiefern. Z. Für Forst Und Jagdwes. 1937, 7, 321–336. [Google Scholar]
  44. Badoux, E. Relations entre le developpement de la crime et l’accroissement chez le pin silvestre. Mitt. Schweiz. Anst. Forstl. Vers. 1946, 24, 405–516. [Google Scholar]
  45. Temesgen, H.; Affleck, D.; Poudel, K.; Gray, A.; Sessions, J. A review of the challenges and opportunities in estimating above ground forest biomass using tree-level models. Scand. J. For. Res. 2015, 30, 326–335. [Google Scholar] [CrossRef]
  46. Martin, A.R.; Doraisami, M.; Thomas, S.C. Global patterns in wood carbon concentration across the world’ strees and forests. Nat. Geosci. 2018, 11, 915–920. [Google Scholar] [CrossRef]
  47. Aun, K.; Kukumägi, M.; Varik, M.; Becker, H.; Aosaar, J.; Uri, M.; Morozov, G.; Buht, M.; Uri, V. Short-term effect of thinning on the carbon budget of young and middle-aged Scots pine (Pinus sylvestris L.) stands. For. Ecol. Manag. 2021, 492, 119241. [Google Scholar] [CrossRef]
  48. Lemke, J. Charakterystyka ilościowa igliwia i ulistnionych gałązek w młodszych drzewostanach sosnowych (Quantitative characteristics of needles and leafy twigs in younger pine stands). Folia For. Pol. 1973, 21, 173–197. [Google Scholar]
  49. Lemke, J. Szacowanie ciężaru świeżego igliwia sosny zwyczajnej (Estimating the weight of fresh Scots pine needles). Sylwan 1975, 6, 37–44. Available online: https://sylwan.lasy.gov.pl/apex/f?p=105:2:::NO:RP,2:P2_ZESZYT:1975_6 (accessed on 27 September 2021).
  50. Lemke, J. Żyzność siedliska a wielkość niektórych cech aparatu asymilacyjnego sosny zwyczajnej (Habitat fertility and the size of some features of the Scots pine assimilation apparatus). PTPN 1980, 50, 51–55. [Google Scholar]
  51. Lemke, J. Tabele do szacowania igliwia i uiglonych gałązek sosny zwyczajnej (Tables for estimation of the weight of needles and twigs with needles of the Scotch pine). Sylwan 1983, 2, 21–30. Available online: https://sylwan.lasy.gov.pl/apex/f?p=105:2:::NO:RP,2:P2_ZESZYT:1983_2 (accessed on 27 September 2021).
  52. Turski, M.; Beker, C.; Kaźmierczak, K.; Najgrakowski, T. Allometric equations for estimating the mass and volume of fresh assimilational apparatus of standing scots pine (Pinus sylvestris L.) trees. For. Ecol. Manag. 2008, 255, 2678–2687. [Google Scholar] [CrossRef]
  53. Socha, J.; Wężyk, P. Allometric equations for estimating the foliage biomass of Scots pine. Eur. J. For. Res. 2007, 126, 263–270. [Google Scholar] [CrossRef]
  54. Grochowski, J. Dendrometria (Dendrometry); PWRiL: Warszawa, Poland, 1973; p. 594. [Google Scholar]
  55. Ryan, M.G.; Binkley, D.; Fownes, H.J. Age-related decline in forest productivity: Pattern and process. Adv. Ecol. Res. 1997, 27, 213–262. [Google Scholar]
  56. Lemke, J. Charakterystyka ilościowa igliwia i ulistnionych gałązek w starszych drzewostanach sosnowych (Quantitative characterization of needles and branches bearing needles in older pine stands). Folia For. Pol. 1978, 23, 53–66. [Google Scholar]
Figure 1. Dependence of weight of leaved twigs (ugc) on age (w).
Forests 12 01502 g001
Figure 2. Dependence of weight of leaved twigs (ugc) on height (h).
Forests 12 01502 g002
Figure 3. Dependence of weight of leaved twigs (ugc) on diameter at breast height (d1.3).
Forests 12 01502 g003
Table 1. Structural characteristics of stands.
Age of Stand
(Years)
Stocking Index of StandNumber of Trees per HectareDiameter at Breast Height of the Stand
(Dg, cm)
Mean Stand Height
(H, m)
Basal Area per Hectare
(G, m2)
Volume per Hectare
(V, m3)
251.17259013.415.4936.53256.36
331.20292713.716.0043.15313.31
441.23122520.421.2340.04386.84
561.10116020.021.6536.44359.25
650.9476623.724.7433.79378.59
750.8153725.524.4627.42302.93
850.8841930.828.3231.22396.21
950.9140231.426.1231.13364.11
Table 2. Arithmetic means for dendrometric and increment traits.
TraitAge (Years)
2533445665758595
h (m)13.3914.6020.3920.0423.1623.3726.8125.56
d1.3 (cm)12.8812.2318.9617.7921.9024.8430.2329.39
Ih5 (m)2.832.181.991.761.291.111.070.71
Ih10 (m)5.674.133.583.262.471.891.871.24
Id5 (cm)1.531.161.391.361.291.261.461.12
Id10 (cm)2.982.142.442.802.362.302.642.07
Ig5 (m2)0.00280.00220.00400.00370.00420.00450.00620.0047
Ig10 (m2)0.00500.00370.00670.00730.00750.00800.01100.0085
Iv5 (m3)0.03330.02740.06880.05930.07760.07780.11680.0812
Iv10 (m3)0.05240.04480.10630.10300.12640.12670.20040.1434
Table 3. Coefficients of variation for dendrometric and increment traits.
TraitAge (Years)
2533445665758595
h (%)9.07.97.18.98.07.06.35.9
d1.3 (%)24.429.522.425.721.721.317.917.6
Ih5 (%)18.026.421.321.433.524.822.325.7
Ih10 (%)10.918.617.619.125.827.719.928.3
Id5 (%)58.759.549.351.447.747.939.047.8
Id10 (%)49.955.745.149.045.245.138.450.1
Ig5 (%)81.782.964.571.063.663.354.859.4
Ig10 (%)71.378.960.468.062.360.754.261.5
Iv5 (%)71.883.364.173.066.957.251.359.2
Iv10 (%)64.074.560.571.665.656.948.760.4
Table 4. Arithmetic means for the size of the assimilatory apparatus.
TraitAge (Years)
2533445665758595
ugc (kg)13.4011.1520.3819.0025.7926.9939.2842.85
ic (kg)8.447.3013.8912.2919.0318.3027.5031.39
ugo (dm3)14.9012.4022.9821.4328.0828.0542.7746.54
io (dm3)9.398.1815.0613.8620.4019.7229.3133.38
Table 5. Coefficients of variation for the size of the assimilatory apparatus.
TraitAge (Years)
2533445665758595
ugc (%)95.883.871.675.464.268.055.552.0
ic (%)95.078.369.473.162.563.253.551.8
ugo (%)99.682.169.974.963.965.655.054.4
io (%)100.177.569.873.762.064.254.953.5
Table 6. Values of linear correlation coefficients r between the size of the assimilatory apparatus (ugc, ic, ugo, io) and dendrometric traits (h, d1.3) depending on the age of stands.
TraitAssimilatory ApparatusAge (Years)
2533445665758595
hugc0.6638 *0.7519 *0.7664 *0.8574 *0.7303 *0.6402 *0.7236 *0.4911 *
ic0.6492 *0.7621 *0.7641 *0.8337 *0.7349 *0.5830 *0.7125 *0.4755 *
ugo0.6460 *0.7773 *0.7826 *0.8540 *0.7354 *0.5969 *0.7092 *0.4967 *
io0.6163 *0.7858 *0.7717 *0.8272 *0.7342 *0.5845 *0.6986 *0.4847 *
d1.3ugc0.8673 *0.9102 *0.9177 *0.9418 *0.9625 *0.8599 *0.9027 *0.8581 *
ic0.8668 *0.9119 *0.9031 *0.9178 *0.9646 *0.8377 *0.8930 *0.8358 *
ugo0.8568 *0.9148 *0.9284 *0.9361 *0.9684 *0.8488 *0.8882 *0.8520 *
io0.8494 *0.9125 *0.9143 *0.9121 *0.9648 *0.8367 *0.8887 *0.8375 *
* Statistically significant correlation for α = 0.05.
Table 7. Values of linear correlation coefficients r between the weight of leaved twigs (ugc) and increment traits (Ih5, Ih10, Id5, Id10, Ig5, Ig10, Iv5, Iv10) depending on the age of the stands.
Assimilatory ApparatusIncrement TraitAge (Years)
2533445665758595
ugcIh50.7279 *0.7211 *0.5332 *0.4743 *0.4093 *0.38030.21420.1264
Ih100.7577 *0.6545 *0.4904 *0.5308 *0.5705 *0.4981 *0.4967 *0.0574
Id50.9251 *0.9305 *0.8559 *0.8230 *0.8933 *0.8423 *0.7924 *0.8299 *
Id100.9162 *0.9446 *0.8479 *0.8014 *0.9325 *0.8306 *0.8684 *0.8514 *
Ig50.9704 *0.9299 *0.9271 *0.9055 *0.9638 *0.9260 *0.8760 *0.8726 *
Ig100.9615 *0.9365 *0.9227 *0.9018 *0.9791 *0.9271 *0.9176 *0.8880 *
Iv50.9528 *0.9480 *0.9286 *0.9747 *0.9675 *0.9556 *0.8699 *0.8750 *
Iv100.9499 *0.9511 *0.9225 *0.9734 *0.9739 *0.9478 *0.9136 *0.8901 *
* Statistically significant correlation for α = 0.05.
Table 8. Values of linear correlation coefficients r between needle weight (ic) and increment traits (Ih5, Ih10, Id5, Id10, Ig5, Ig10, Iv5, Iv10) depending on the age of the stands.
Assimilatory ApparatusIncrement TraitAge (Years)
2533445665758595
icIh50.7107 *0.7046 *0.5593 *0.4989 *0.4084 *0.39160.21060.1052
Ih100.7307 *0.6500 *0.5265 *0.5563 *0.5765 *0.5061 *0.5125 *0.0207
Id50.9230 *0.9441 *0.8536 *0.8307 *0.9084 *0.8794 *0.7906 *0.8165 *
Id100.9076 *0.9559 *0.8414 *0.8030 *0.9434 *0.8641 *0.8631 *0.8390 *
Ig50.9683 *0.9287 *0.9181 *0.9004 *0.9721 *0.9390 *0.8624 *0.8522 *
Ig100.9551 *0.9333 *0.9107 *0.8914 *0.9836 *0.9360 *0.9027 *0.8685 *
Iv50.9474 *0.9453 *0.9175 *0.9615 *0.9766 *0.9334 *0.8600 *0.8425 *
Iv100.9437 *0.9474 *0.9089 *0.9588 *0.9790 *0.9185 *0.9034 *0.8596 *
* Statistically significant correlation for α = 0.05.
Table 9. Values of linear correlation coefficients r between the volume of leaved twigs (ugo) and increment traits (Ih5, Ih10, Id5, Id10, Ig5, Ig10, Iv5, Iv10) depending on the age of the stands.
Assimilatory ApparatusIncrement TraitAge (Years)
2533445665758595
ugoIh50.7052 *0.7342 *0.5296 *0.4775 *0.4098 *0.4098 *0.21940.0954
Ih100.7382 *0.6639 *0.4912 *0.5382 *0.5779 *0.5178 *0.4933 *0.0304
Id50.9149 *0.9350 *0.8673 *0.8194 *0.8949 *0.8900 *0.7891 *0.8072 *
Id100.8996 *0.9526 *0.8637 *0.7958 *0.9353 *0.8757 *0.8664 *0.8316 *
Ig50.9609 *0.9366 *0.9371 *0.9009 *0.9640 *0.9519 *0.8648 *0.8542 *
Ig100.9479 *0.9460 *0.9358 *0.8957 *0.9799 *0.9495 *0.9086 *0.8718 *
Iv50.9450 *0.9682 *0.9400 *0.9730 *0.9706 *0.9475 *0.8361 *0.8582 *
Iv100.9416 *0.9718 *0.9359 *0.9710 *0.9741 *0.9346 *0.8884 *0.8740 *
* Statistically significant correlation for α = 0.05.
Table 10. Values of linear correlation coefficients r between needle volume (io) and increment traits (Ih5, Ih10, Id5, Id10, Ig5, Ig10, Iv5, Iv10) depending on the age of the stands.
Assimilatory ApparatusIncrement TraitAge (Years)
2533445665758595
ioIh50.6772 *0.7204 *0.5446 *0.4948 *0.3956 *0.38880.22300.0766
Ih100.6979 *0.6638 *0.5139 *0.5608 *0.5672 *0.5005 *0.4987 *−0.0028
Id50.8993 *0.9423 *0.8598 *0.8223 *0.9082 *0.8888 *0.7853 *0.7973 *
Id100.8797 *0.9581 *0.8538 *0.7921 *0.9410 *0.8763 *0.8569 *0.8196 *
Ig50.9487 *0.9326 *0.9253 *0.8963 *0.9703 *0.9446 *0.8608 *0.8371 *
Ig100.9329 *0.9405 *0.9224 *0.8853 *0.9805 *0.9430 *0.9011 *0.8531 *
Iv50.9305 *0.9641 *0.9243 *0.9612 *0.9728 *0.9372 *0.8321 *0.8313 *
Iv100.9278 *0.9669 *0.9198 *0.9568 *0.9735 *0.9222 *0.8838 *0.8478 *
* Statistically significant correlation for α = 0.05.
Table 11. Values of multiple correlation coefficients R between the size of the assimilatory apparatus (ugc, ic, ugo, io) and dendrometric traits (h and d1.3) depending on the age of stands.
TraitAssimilatory ApparatusAge (Years)
2533445665758595
h, d1.3ugc0.8905 *0.9109 *0.9234 *0.9418 *0.9627 *0.8782 *0.9049 *0.8909 *
ic0.8971 *0.9121 *0.9066 *0.9178 *0.9647 *0.8745 *0.8956 *0.8691 *
ugo0.8845 *0.9148 *0.9325 *0.9361 *0.9686 *0.8829 *0.8908 *0.8811 *
io0.8907 *0.9128 *0.9182 *0.9121 *0.9650 *0.8724 *0.8930 *0.8674 *
* Statistically significant correlation for α = 0.05.
Publisher’s Note: MDPI stays neutral with regard to jurisdictional claims in published maps and institutional affiliations.

