Article

Effect of Charcoal on the Properties, Enzyme Activities and Microbial Diversity of Temperate Pine Forest Soils

1
Department of Ecology and Silviculture, Faculty of Forestry, University of Agriculture in Krakow, Al. 29 Listopada 46, 31-425 Kraków, Poland
2
Office of Forest Management and Land Surveying in Szczecinek, Koszalińska 91b, 78-400 Szczecinek, Poland
3
Department of Forest Ecosystems Protection, Faculty of Forestry, University of Agriculture in Krakow, Al. 29 Listopada 46, 31-425 Kraków, Poland
4
Department of Microbiology and Biomonitoring, Faculty of Agriculture and Economics, University of Agriculture in Krakow, Al. Mickiewicza 24/28, 30-059 Kraków, Poland
*
Author to whom correspondence should be addressed.
Forests 2021, 12(11), 1488; https://doi.org/10.3390/f12111488
Submission received: 7 October 2021 / Revised: 26 October 2021 / Accepted: 26 October 2021 / Published: 29 October 2021
(This article belongs to the Special Issue Carbon Stock and Sequestration in Forest Ecosystems)

Abstract

:
Relict charcoal hearths (RCHs) increases soil fertility in forest ecosystems. However, the effects of RCHs on the activity and abundance of soil microorganisms remain unknown. In this paper, we analysed the impact of relict charcoal production on the soil enzymatic activity and composition of soil bacterial and fungal communities in Scots pine forests of the Manowo Forest District in northern Poland. Moreover, we determined the effect of relict charcoal production on the soil properties. Our research was conducted by comparing the physical, chemical, enzymatic and microbiological properties of charcoal-enriched and charcoal-free soils. Significant differences in physical properties were found between these two soil types in terms of their structure and water holding capacity. As expected, horizons enriched with charcoal were characterised by a significantly higher organic carbon content (4.7% on average compared to 2.2% in control horizons), and also by a considerably higher content of available phosphorus (an average of 64.07 mg·kg−1 compared to 36.21 mg·kg−1 in the control). Similarly, RCH horizons displayed a higher pH and higher contents of Ca and Na cations. These results indicated that RCH soils provided more favourable conditions for the soil microbiome, as reflected by the higher enzymatic activity and diversity of the microorganisms. Moreover, bacterial and fungal communities in RCH soils were more diverse and had greater species/genera richness, especially in the case of fungi. Members of the genus Rhodoplanes dominated the bacterial community at both RCH and non-RCH sites, followed by Streptomyces, Burkholderia, Skermanella, Tsukamurella and Candidatus Solibacter. Both culture- and next generation sequencing (NGS)-based analyses showed that soil fungal communities were dominated by Ascomycota, with Penicillium as the most abundant genus. Our results showed that hearth soils may represent a significant C pool in the forest ecosystem. This study supports the strategy of safeguarding such charcoal-enriched soils as precious C reservoirs and ecologically important biodiversity hotspots. Moreover, the application of charcoal may effectively increase the microbial diversity of forest soils, especially during the reforestation or re-cultivation of disturbed habitats.

1. Introduction

Relict charcoal hearths (RCHs) have been described in various landscapes across different countries [1,2,3,4,5]. Originally, RCHs were piles of wood sealed with soil or turf and set on fire to char, but not burn, the wood, which would pyrolyze to charcoal through a slow thermochemical decomposition. The RCH remains that have survived to date have unique terrain properties. They occur as small embankments of 18–20 m in diameter and approximately 0.5 m high, in clusters with a fairly regular layout. The burning of charcoal in relict charcoal hearths has existed since the Roman period (1st to 4th centuries AD) and spread during modern times with the development of metallurgy, which uses large amounts of charcoal to smelt metals from ores.
To date, research has shown that charcoal affects the physical and chemical properties of soils [6,7]. The soils used for charcoal production are characterised by an increased amount of organic and black (pyrogenic) carbon [8]. Charcoal is one of the most recalcitrant forms of C in the environment, especially when it occurs as macroscopic fragments [9]. Charcoal is relatively stable in soil, owing to its polycyclic and aromatic structure; therefore, charcoal-induced changes to soil processes will probably persist for years following charcoal addition [10]. Soils enriched with charcoal have a higher pH, as well as higher nutrient and organic matter contents [11]. Kolb et al. [10] suggested that adding charcoal to different soils affected microbial biomass, microbial activity and nutrient availability in relatively similar ways. Moreover, the porous structure of charcoal may provide favourable microsites for microbes and shelter against soil faunal predators [12].
Fungi form abundant and diverse communities in forest soils act as saprotrophs, symbiotrophs (e.g., mycorrhizal symbionts) and pathotrophs, influencing the C turnover as well as the retention and availability of other nutrients [13]. Fungi are considered the primary decomposers in forest soils because they produce several extracellular enzymes that allow them to be efficiently involved in the energy flow, nutrient cycle, and transformation of organic substances in soil. Therefore, fungi are, unsurprisingly, the most well-studied microbes in forest soils [14]. Most of the identified fungi in forest soils belong to Ascomycota and Basidiomycota [15,16,17,18,19]. The study by Urbanová et al. [17] on forest soils in Czechia showed that Capnodiales and Verrucariales were the major orders within the Ascomycota, while Agaricales and Russulales were the most abundant among the Basidiomycota. In this study, Cryptococcus and Candida were the most abundant in soil under Pinus, followed by Ophiocordyceps, Cadophora, Russula and Leucosporidiella. A recent study has demonstrated that the soil mycobiota of Scots pine (Pinus sylvestris L.) forests in Poland included the following groups of fungi: (a) saprotrophs, (b) ericoid mycorrhizal, (c) ectomycorrhizal, (d) root endophytes, (e) human and animal pathogens, (f) insect and rotifer pathogens and fungal hyperparasites [20]. Forest soils also offer suitable habitats for bacteria. Five phyla, Acidobacteria, Actinobacteria, Proteobacteria, Bacteroidetes and Firmicutes appear abundant in most forest soils [21]. Bradyrhizobium, Sphingomonas, Burkholderia, Rhodoplanes and Chthoniobacter were the most common genera in the soil of pines trees [17]. The microbial community structure is shaped by various biotic and abiotic factors [22,23,24,25,26]. Specifically, bacterial communities are highly influenced by abiotic factors, such as C:N ratio, pH and soil moisture [23,26,27,28], whereas fungal communities are more influenced by biotic factors. For example, the composition of soil bacterial communities is strongly correlated with soil pH. Comparatively, soil pH influences fungal composition to a lesser extent [27,29]. Tree hosts are the most important biotic factor that shapes soil microbiome community assemblages. They are affected by complex interactions such as changes in the microclimate (e.g., temperature and moisture), litter and root exudate production, or by direct interactions with root-symbiotic and root-associated microorganisms [17,30,31].
Carbon substrates are transformed via the activity of soil microorganisms and their enzymes. Enzymes form the fundamental system that enables microorganisms to decompose organic matter and thus may inform on soil C accumulation [32]. Enzymes are involved in many biochemical processes in soils, such as organic matter decomposition, carbon mineralisation and nutrient cycling [33,34]. The structure and functions of microbial communities are key drivers of the biogeochemical cycles and general quality of soils [35]. Bacteria and fungi are the main components of soil microbial biomass. Microbe biomass catalyses the microbial changes in soil and generates a supply of nutrients with a fast turnover compared to soil organic matter. Although the living soil microbial biomass constitutes a relatively small volume, it is essential to overall soil health, mediating 90% of soil ecosystem functions [36].
Although the behaviour of fungi and bacteria in various soil environments has been extensively studied, little is known about the growth of microorganisms in soils containing previously burned charcoal. To the best of our knowledge, a few studies have analysed how the chemical properties of RCH soils influence microbial activity in this environment [10,37]. To date, these mechanisms remain poorly understood. The aim of this study was to determine the effect of charcoal on the properties of forest soils, with a focus on soil microbial communities and enzyme activities. Our research concerns pine stands on Brunic Arenosols, which are typical soil in a temperate climate. The soils of these stands are characterized by sandy texture and strong acidification. We expected to find a more diverse and specific composition of bacterial and fungal communities in soils within RCHs than in soils outside of RCHs. To test this hypothesis, we investigated microbial communities using the traditional soil dilution method to detect active, culturable microfungi. Furthermore, we identified bacterial and fungal communities from soil samples using next-generation sequencing (NGS) technology. We also aimed to determine the intensity of nutrient release from charcoal-enriched soils and tested the following hypotheses: (1) charcoal from burning improves the physical and chemical properties of forest soils; (2) the effect of charcoal on soil chemical properties is related to the growth of enzyme activity; (3) charcoal positively modifies the soil environment, which may alter the composition and diversity of microbial communities.

2. Materials and Methods

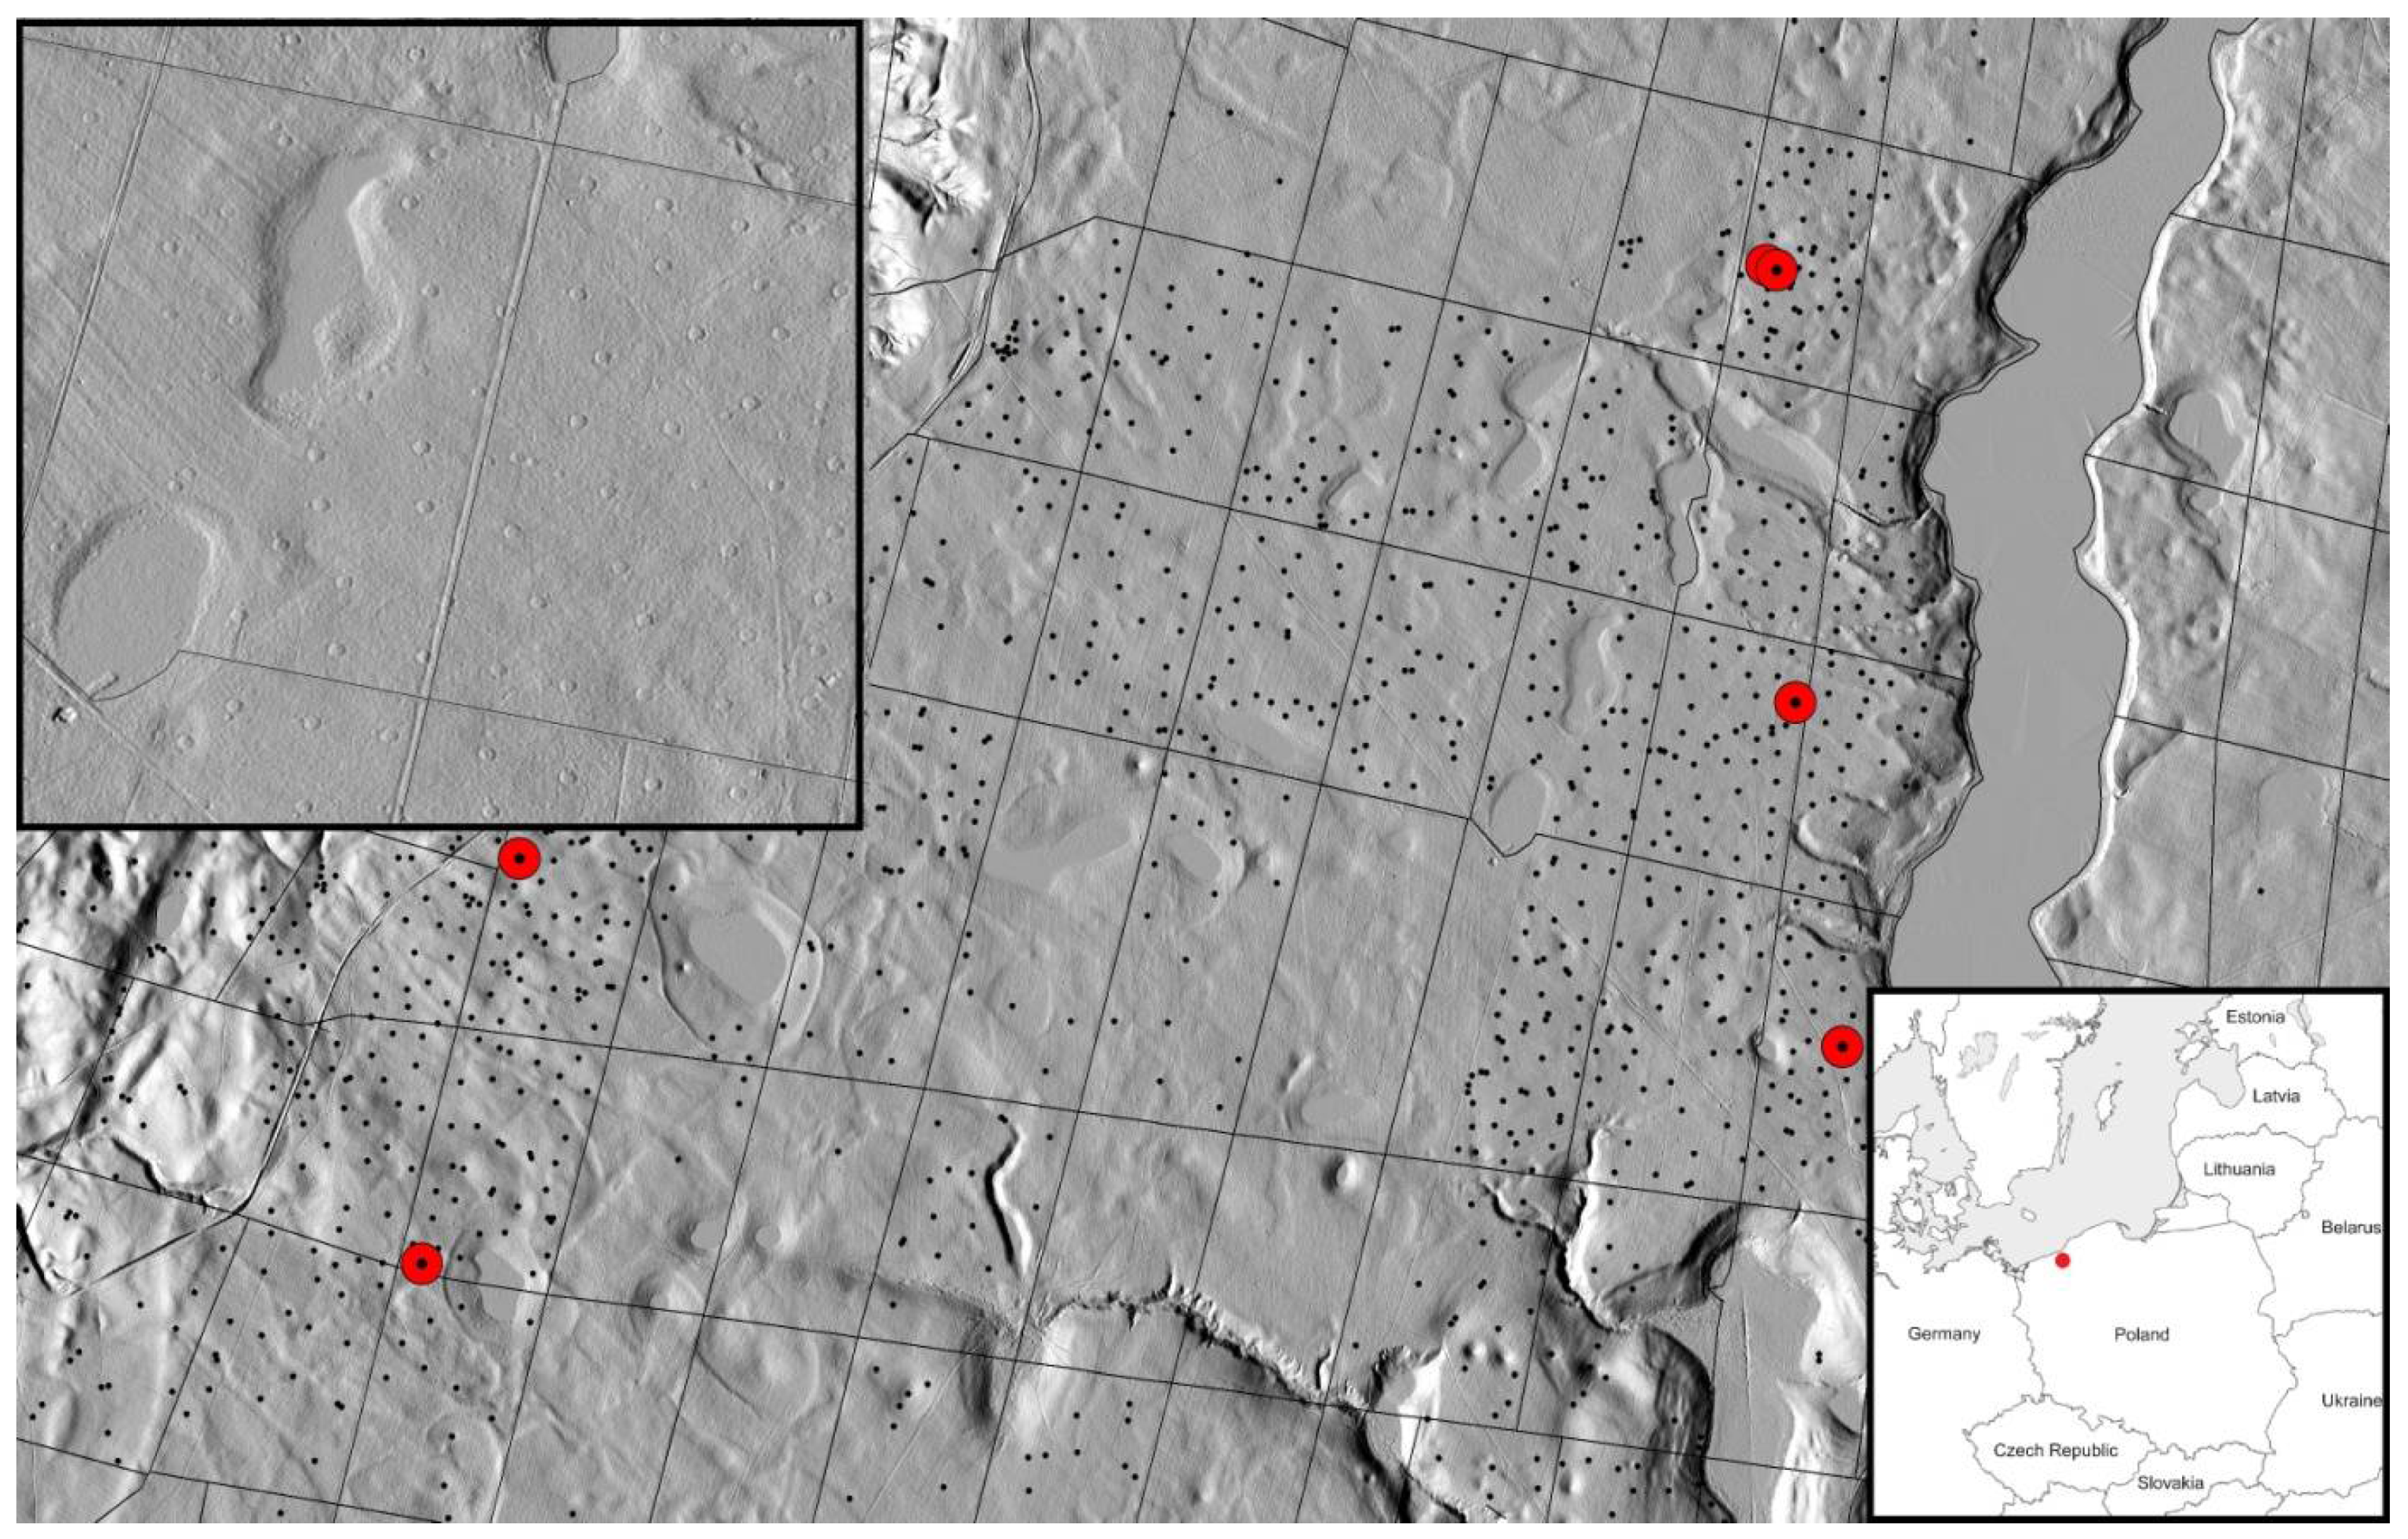
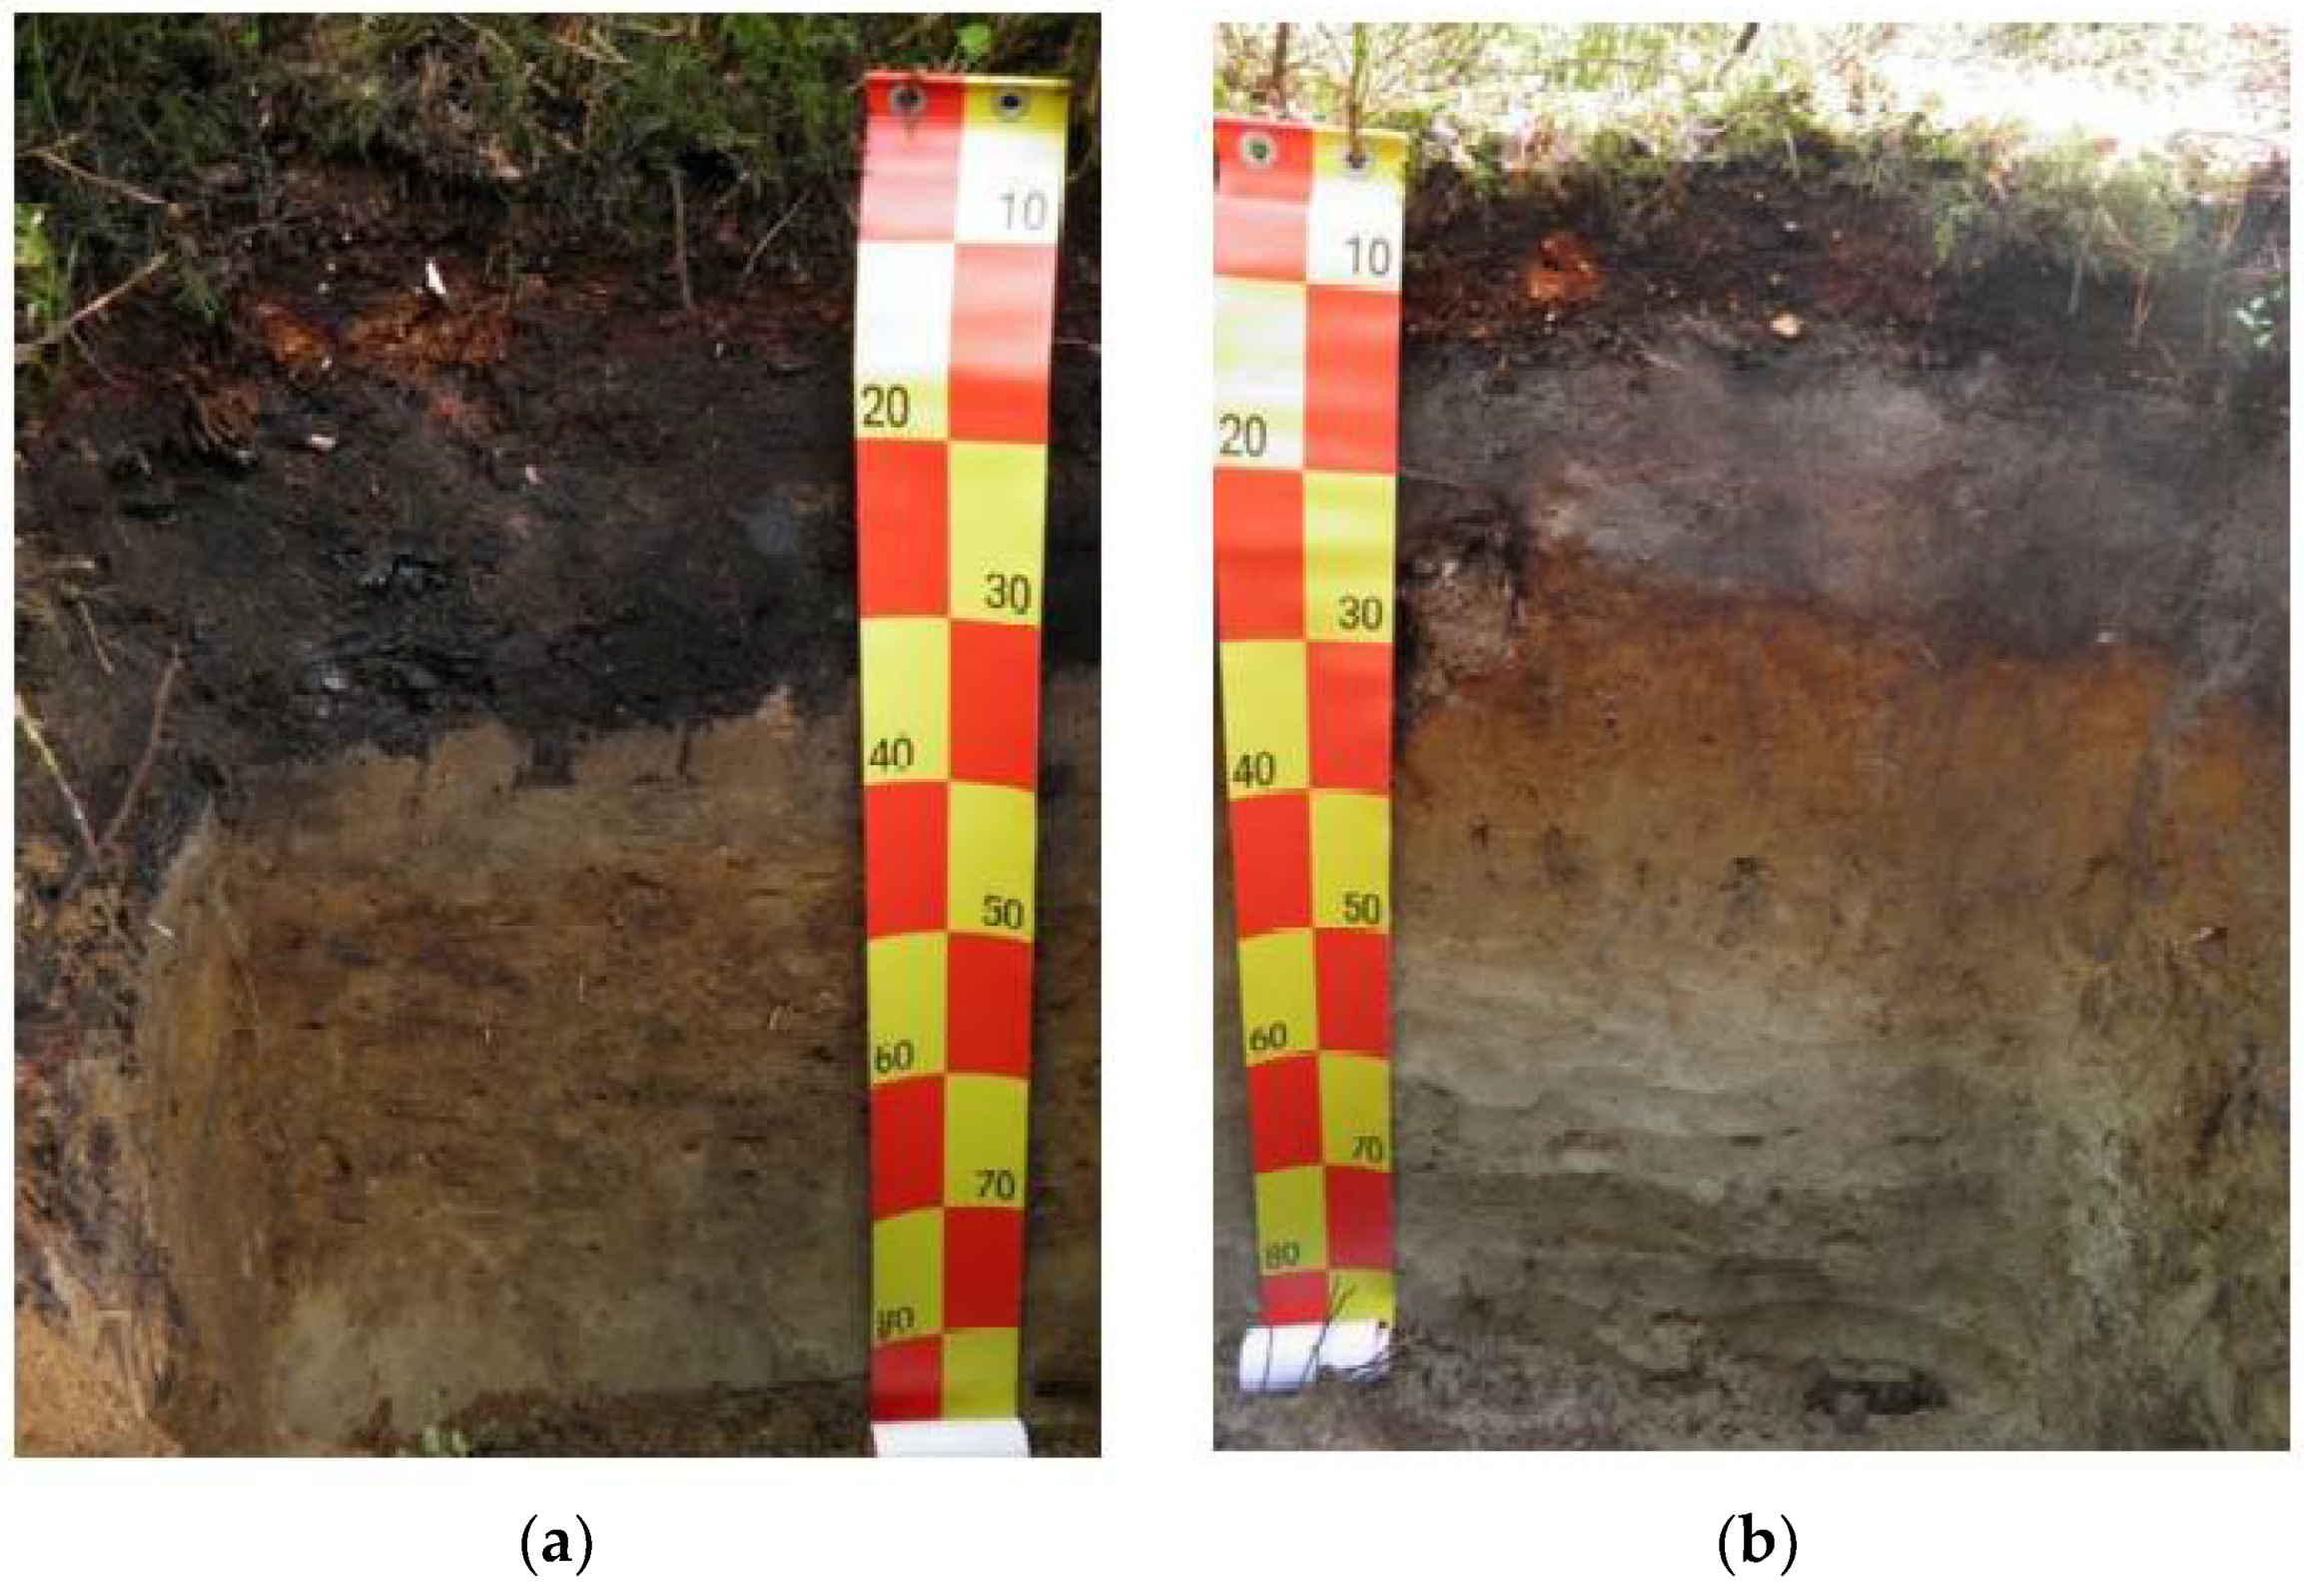
2.1. Study Sites and Soil Sampling

The study was carried out in the Manowo Forest District, northern Poland (54°08′52″ N; 16°27′53″ E) (Figure 1). The field sites were dominated by Brunic Arenosols [38] and located in an area where the soils had derived from glacial sands. The tested soils were characterised by a slightly loamy sand texture, with an average content of 89% sand, 9% silt and 2% clay. The selected area contained abundant RCHs, as the burning of charcoal occurred approximately 200–250 years ago. The diameter of one RCH ranged from 18 m to 20 m. The Office of Forest Management and Land Surveying inventoried 2435 RCHs, while monitoring the natural values of the Forest District. We performed two experiments to characterise the chemical and microbiological properties of charcoal-enriched soils. In the first field experiment, six soil profiles were dug and described, and soil samples were collected for detailed laboratory analyses. Soil samples were collected from each separated genetic horizon. Five profiles represented RCHs, and one profile was the control. In the second experiment, 50 research plots were designated for detailed studies, including 25 plots from RCHs (where samples were collected from horizons containing charcoal remains) and 25 plots from the background (where reference samples were collected from areas with no previously produced charcoal). The samples used in the second experiment were obtained from humus mineral horizons after removing the organic horizon. Furthermore, the study plots in the second experiment were located near the profiles dug in the first experiment (Figure 1).
Soil samples were collected from the horizon that contained charcoal remains to determine the composition of soil microbial communities. In addition, control soil samples were taken from the humus mineral horizon of plots with no previously produced charcoal. Each sample consisted of 10 soil sub-samples (each 100 g) stored in a sterile plastic container. A total of eight soil samples were taken, including five samples with charcoal remains (RCH1–RCH5) and three reference (control) samples with no RCH content (C1–C3). Soil samples used to determine fungal and bacterial diversity were immediately transported to the laboratory and stored in the dark at 4 °C for subsequent analyses.

2.2. Laboratory-Based Analysis of Soils

Air-dried soil samples were passed through a sieve with a mesh diameter of 2 mm. The particle size distribution was determined using laser diffraction (Analysette 22, Fritsch, Idar-Oberstein, Germany). The soil pH was determined in H2O and 1 M KCl using the potentiometric method. C and N levels were measured using an elemental analyser (LECO CNS TruMac Analyzer, Leco Corporation, St. Joseph, MI, USA). Cations (Ca2+, Mg2+, K+, and Na+) were extracted using ammonium acetate, and their concentrations were determined using inductively coupled plasma analysis (ICP-OES Thermo iCAP 6500 DUO, Thermo Fisher Scientific, Cambridge, UK). The Cd, Cr, Cu, Ni, Pb and Zn contents were determined after mineralisation in a mixture of concentrated nitric and perchloric acids at a ratio of 2:1 using ICP-OES (Thermo iCAP 6500 DUO, Thermo Fisher Scientific, Cambridge, UK). Available phosphorus content was determined using the Bray-Curtz methods. The Sokolow method was used to determine exchangeable acidity [39]. Moisture was determined using the Kopecky’s cylinders method.
Enzymatic activity was determined using fresh samples (with their natural moisture) that were passed through a sieve with a diameter of 2 mm and stored at 4 °C. The activities of the extracellular enzymes β-glucosidase (BG), β-D-cellobiosidase (CB), β-xylosidase (XYL), N-acetyl-β-D-glucosaminidase (NAG), phosphatase (PH) and arylsulphatase (SP) were determined using fluorogenically-labelled substrates [40,41,42]. The fluorescence was measured using a multidetector plate reader (SpectroMax), with excitation and emission set at a wavelength of 355 nm and 460 nm, respectively.
Water samples collected during the soil column experiment and stored at 4 °C were chemically analysed. The samples were passed through 0.45-μm filters, and the water chemistry was analysed via ion chromatography using a DIONEX ICS 5000 unit. Concentrations of total carbon (TC), inorganic carbon (IC), total organic carbon (TOC) and total nitrogen (TN) were determined using a TOC analyser (Shimadzu, Japan). The concentration of TOC in filtered water samples was equal to dissolved organic carbon (DOC) when performing our analyses.

2.3. Isolation and Identification of Culturable Fungi from RCH Soils Using the Soil Dilution Method

Ten grams of a soil sample was suspended in 90 mL of sterile distilled water and thoroughly mixed for three minutes to obtain the 10−1 suspension. Next, serial dilutions were prepared to obtain 10−2, 10−3, 10−4 and 10−5 suspensions. A 0.1-mL volume of each dilution was added to sterile plates (five replicates) containing Rose Bengal Agar medium [43] supplemented with tetracycline hydrochloride to avoid bacterial contamination. Inoculated plates were incubated for up to 7–10 days at 22 °C in the dark, after which individual fungal colonies were transferred on malt extract agar medium (MEA; 2% malt extract (Merck KGaA, Darmstadt, Germany), 1.5% agar (Biomaxima S.A., Lublin, Poland) for identification. Finally, only three dilutions (10−3, 10−4 and 10−5) were selected to assess the culturable microfungi on each sample, based on the number of fungal colonies (up to 50) per plate. The purified cultures were grouped according to culture morphology using an Eclipse 50i microscope (Nikon) equipped with an Invenio 5S digital camera (DeltaPix) to capture photographic images. Taxonomically relevant structures were measured using the Coolview Software (Version 1.6.0, Warsaw, Poland).
Depending on the size of the morphological group, 1–15 isolates from each group were selected for molecular identification. Morphological identification was confirmed by sequencing the internal transcribed spacers 1 and 2 (ITS1-5.8S-ITS2) region. Penicillium-like fungi and Trichoderma species were more accurately identified by amplifying beta-tubulin (TUB2) and elongation factor 1-α (TEF1-α) gene sequences (Supplementary Materials, Table S1). A total of 196 isolates were selected for molecular identification and were deposited in the culture collection of the Department of Forest Ecosystems Protection, University of Agriculture, Krakow, Poland (Supplementary Materials, Table S1).
DNA was extracted using the Genomic Mini AX Plant Kit (A&A Biotechnology, Gdynia, Poland) according to the manufacturer’s instructions. The primers used were ITS 1F [44] and ITS4 [45] for ITS1-5.8S-ITS2, Bt2a and Bt2b [46] for TUB2, and EF1-728 [47] and TEF1rev [48] for TEF1-α.
Gene fragments were amplified in a 25-µL reaction mixture containing 0.25 µL of Phusion High-Fidelity DNA polymerase (Finnzymes, Espoo, Finland), 5 µL of Phusion HF buffer (5×), 0.5 µL of dNTPs (10 mM), 0.75 µL of DMSO (100%) and 0.5 µL of each primer (25 µM). The gene regions were amplified under the following conditions: a denaturation step at 98 °C for 30 s, followed by 35 cycles at 98 °C for 5 s, 52–60 °C (depending on the optimal Tm of the primers and fungal DNA) for 10 s, 72 °C for 30 s and a final chain elongation step at 72 °C for 8 min in a LabCycler thermocycler (SensoQuest Biomedical Electronics GmbH, Germany). The amplified products were sequenced using a BigDye® Terminator v3.1 Cycle Sequencing Kit (Applied Biosystems, Foster City, CA, USA) and the ABI Prism 3100 Genetic Analyzer (Applied Biosystems, Foster City, CA, USA) at the DNA Research Centre (Poznań, Poland) using the same primers listed above. The product sequences were deposited in NCBI GenBank (Supplementary Materials, Table S1) and compared against the GenBank database using the BLASTn algorithm. Only matches from reliable sources (i.e., available ex-type sequences from taxonomic studies) were accepted as proof of identification. Sequences with ≥99.6% similarity to the ITS1-5.8S-ITS2 region (400–500 bp) were considered as belonging to identical species and were included in the alignment. The respective taxonomic thresholds for fungal identification at the genus, family, order and class levels were 94.3%, 88.5%, 81.2% and 80.9%, respectively, based on ITS1-5.8S-ITS2 sequences [49].
The number of colony-forming units (CFUs) in every soil sample was also determined. The frequency of occurrence in a single soil sample was calculated as the percentage of CFUs for any isolated taxon with respect to the total number of CFUs in the sample. The relative frequency (RF) was expressed as the ratio of the number of isolates of a specific taxon to the total number of isolates in each nest. Dominance (Y) was calculated as described by Du et al. [50]; a dominant genus was defined when Y > 0.02. The following ecological diversity measures used by Du et al. [50] and characterised by Magurran [51] were calculated for each nest: species richness index (S), Margalef index (D′), Shannon-Wiener index (H′), Simpson diversity index (Ds), Simpson dominant index (λ), Pie index (PIE) and Pielou’s evenness index (J).

2.4. DNA Extraction and the Metabarcoding of Fungal ITS and Bacterial 16S Amplicons

Metabarcoding analysis was performed on the following three soil samples: RCH1, RCH5 and C1 (stored at −80 °C before processing). DNA extraction was performed using the Genomic Mini AX Bacteria kit (A&A Biotechnology) and a modified procedure involving additional mechanical lysis using zircon beads and a FastPrep-24 homogeniser. The resulting DNA extracts were further purified using an Anti-Inhibitor Kit (A&A Biotechnology).
Each DNA extract was used to prepare two amplicon libraries targeting the fungal ITS region (primers: ITS3F 5′-GCATCGATGAAGAACGCAGC-3′ and ITS4R 5′-TCCTCCGCTTATTGATATGC-3′; [45]) and hypervariable V3-V4 region (16S Amplicon PCR Forward Primer: 5′-TCGTCGGCAGCGTCAGATGTGTATAAGAGACAGCCTACGGGNGGCWGCAG-3′, 16S Amplicon PCR Reverse Primer: 5′-GTCTCGTGGGCTCGGAGATGTGTATAAGAGACAGGACTACHVGGGTATCTAATCC-3′; [52]) of bacterial 16 rDNA. The library construction involved a two-step amplification using the Herculase II Fusion DNA Polymerase Nextera XT Index Kit V2 (Agilent Technologies, Santa Clara, CA, USA) following 16S Metagenomic Sequencing Library Preparation protocol (Part# 15044223, Rev B, Illumina, San Diego, CA, USA) and a quality-check according to the Illumina qPCR Quantification Protocol Guide. Finally, amplicon libraries were sequenced (2 × 300 bp) using the Illumina MiSeq platform.
Sequencing data were processed via final operational taxonomical unit (OTU) calling and taxonomic profiling using CLC Genomic Workbench (Version 12, Hilden, Germany) and Microbial Genomics Module Plugin (Version 4.1, Hilden, Germany). Sequences were classified using OTU clustering or picking (97% similarity, minimum score of 40) against the UNITE (Version 7.2) and Greengenes (Version 13) databases for the ITS and 16S regions, respectively. All fungal OTUs identified in NGS analysis were manually queried against the NCBI GenBank database using BLASTn and corrected accordingly if necessary. This was done using the same taxonomic threshold values previously described for identification using Sanger sequencing, in order to ensure full cross-compatibility of results during fungal identification using the culture-based method and Illumina metabarcoding. The OTU datasets were then filtered, retaining only OTUs belonging to true fungi and sequences with query cover >75%, as well as bacterial OTUs belonging to either Archaea or Bacteria (i.e., at least identified at the kingdom level).
Data obtained on the occurrence of fungal species (both in fungal isolations and in ITS metabarcoding) and bacterial genera were used to calculate (1) the relative abundance of the most common fungal genera and bacterial phyla, (2) the numbers and proportions of shared and unique fungal species and bacterial genera, and to generate abundance heatmaps (using log10 transformed CFU or sequence data) for all fungal isolates, as well as the most common fungal species and bacterial genera identified from metabarcoding. Abundance was calculated, and heatmaps were constructed in R environment using the microeco [53] and pheatmap [54] packages, respectively. Ecological guilds of fungi detected in NGS analysis were determined according to the FUNGuild database using the FUNguild-dedicated python script [55].

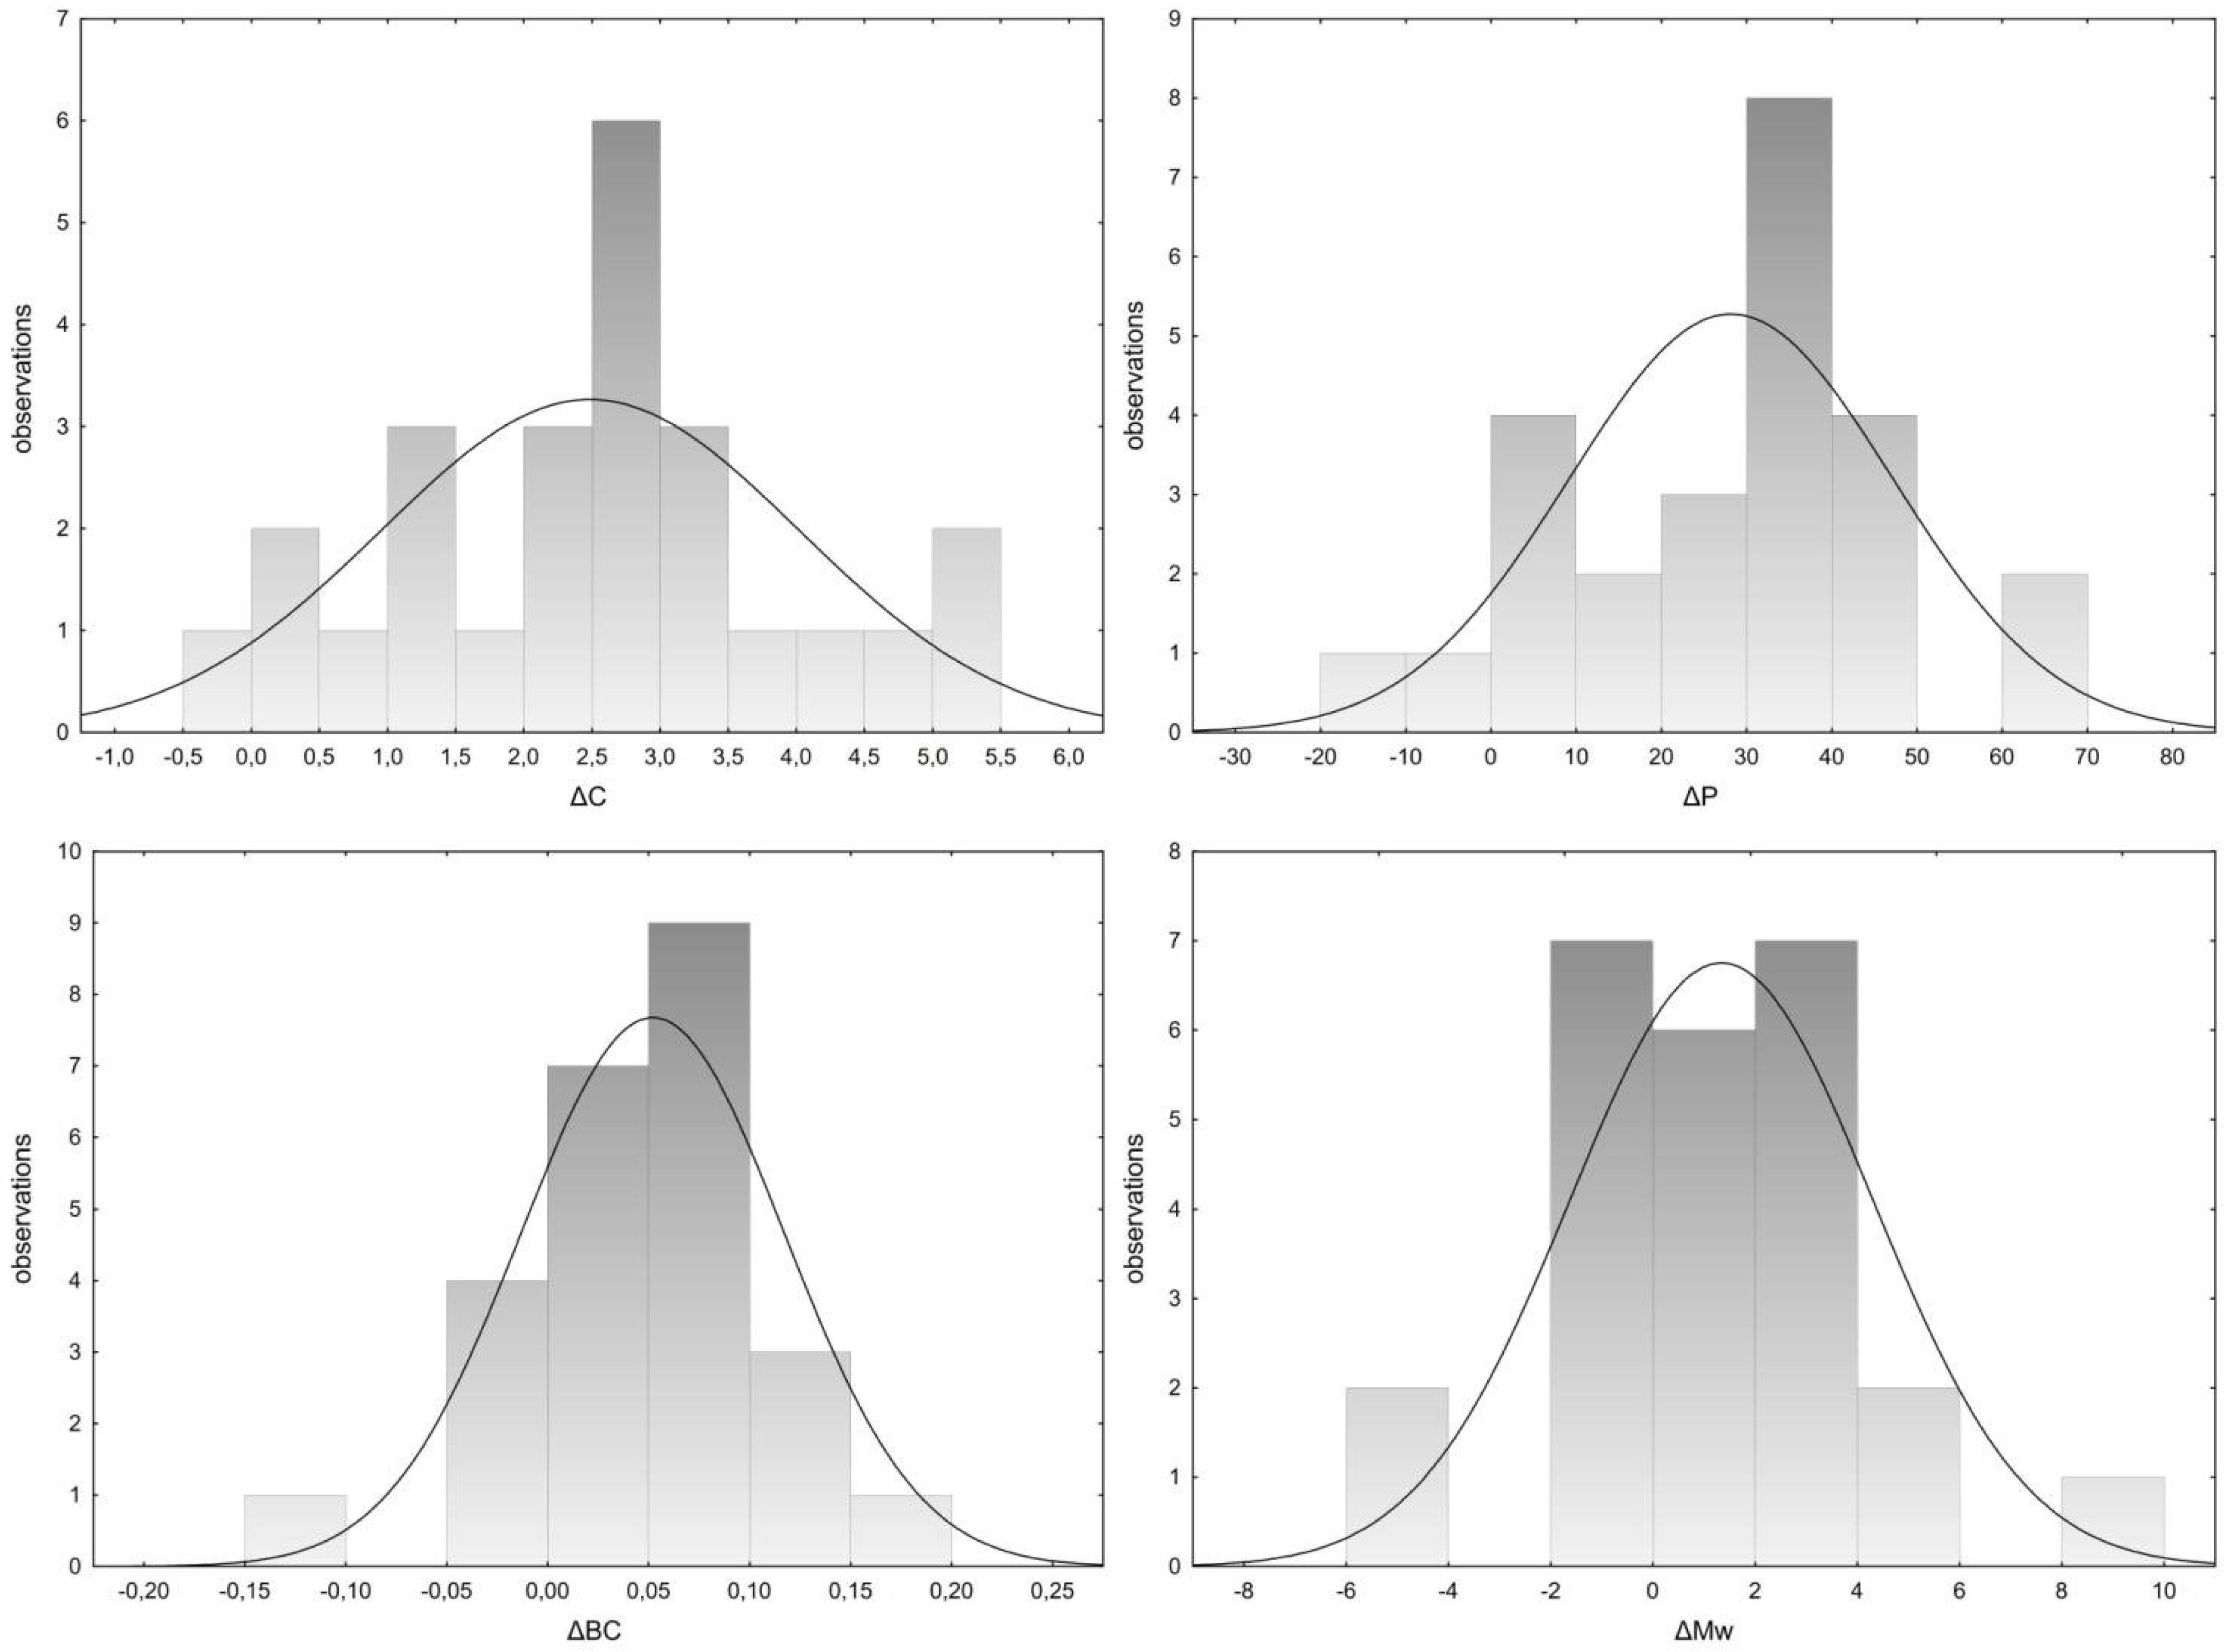
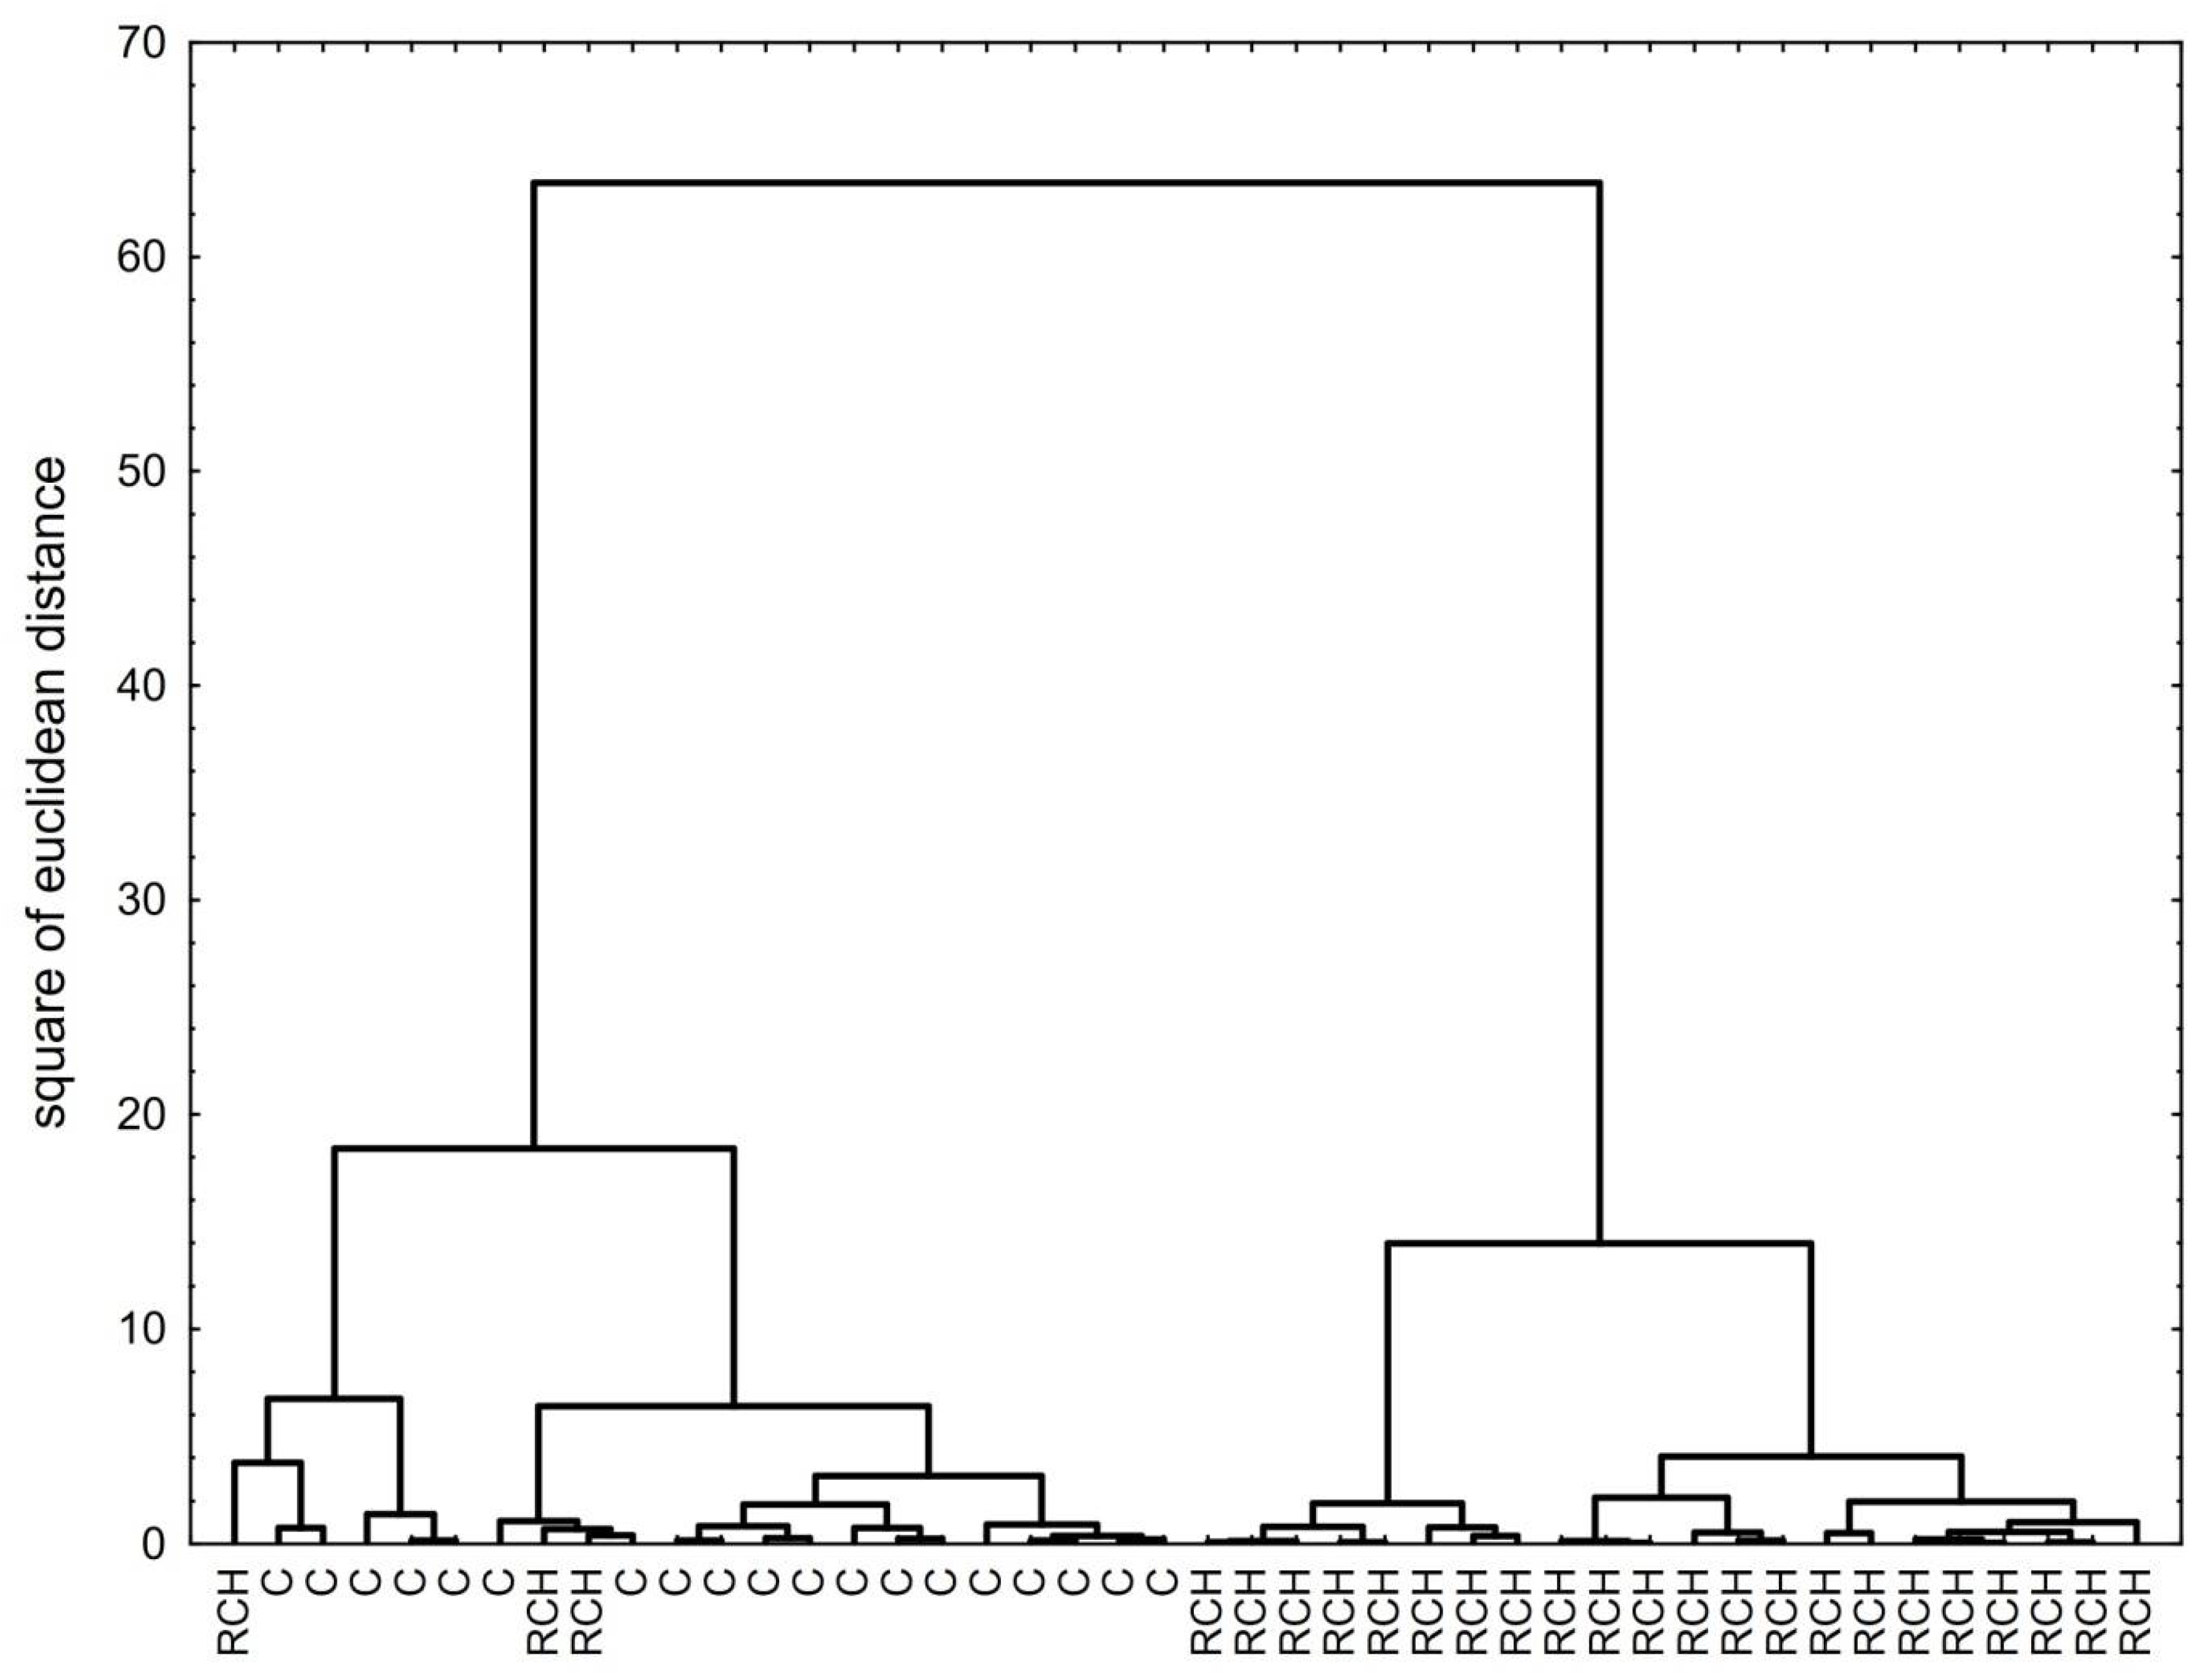
2.5. Statistical Analysis

The Mann–Whitney U test was used to compare the means between the different soil properties. Agglomeration of soil samples into groups that differed in C, N, P content and enzyme activity was conducted based on Ward’s method (cluster analysis) [56]. Cluster analysis is a technique to group similar observation into a number of clusters based on the observed values of several variables. In our grouping analysis we used carbon, nitrogen and phosphorous content. The multiple regression method was used to develop models that described the relationship between enzyme activity and soil properties. All statistical analyses were performed using the Statistica v. 10 software (San Francisco, CA, USA), released in 2010.

3. Results

3.1. Physico-Chemical Properties of RCH Soils

The soil profile of RCHs clearly differed from that of soils where no charcoal was burned. The RCH profile was characterised by the presence of a charcoal-enriched horizon directly below the organic horizon (Figure 2) (Supplementary Materials, Figure S1). The charcoal-enriched horizon was thicker (18 to 25 cm), had a clearly developed structure (subangular blocky) and was strongly overgrown with root systems (Table 1). Horizons enriched with charcoal differed in their physical and chemical properties from other horizons in the soil profile of RCHs (Table 1 and Table 2).
Experiment 2 confirmed the differences observed in soils with RCHs. Horizons enriched with charcoal contained significantly higher levels of organic carbon (4.66% on average) and available phosphorus (average 64.07 mg·kg−1) than control horizons (2.19% and 36.21 mg·kg−1, respectively), but a similar nitrogen content (Table 3). Charcoal-enriched horizons contained significantly higher C/N ratios (average 33.1), whereas horizons of humus-accumulated control soils showed an average C/N ratio of 16.3 (Table 3). The differences in the contents of carbon, phosphorus, BC and moisture between charcoal-enriched and control horizons are shown in Figure 3. Charcoal-enriched horizons typically contained 2.5–3.0% more C; this difference was even 5.0–5.5% in individual samples. Differences in available phosphorous usually amounted to 30–40 mg·kg−1 but could even reach 60–70 mg·kg−1 relative to the control horizons. Differences in the total sum of exchangeable cations were usually 0.05–0.10 cmol(+)·kg−1. Charcoal-enriched horizons were primarily characterised by high humidity (2–4%) compared to control soils (Figure 3). Charcoal-enriched horizons displayed a significantly higher pH (average 3.85 in H2O and 3.50 in KCl) than control horizons (average 3.64 and 3.32 in H2O and KCl, respectively) (Table 1). Furthermore, charcoal-enriched horizons had a higher content of Ca and Na cations (average 0.07 and 0.04 cmol(+)·kg−1, respectively) than control soils (0.03 and 0.02 cmol(+)·kg−1, respectively) and a higher content of certain microelements and heavy metals (Cd, Co, Mn, Ni, Zn) (Table 4). No significant differences were found in the levels of Mg and K cations and the total contents of Cr and Cu between the charcoal-enriched and control horizons.

3.2. Enzymes Activities of RCH Soils

Charcoal-enriched horizons showed significantly higher activities of specific enzymes involved in transforming compounds to C, N and P (Figure 4). The mean activities of CB, BG, NAG and PH were 6.59, 8.82, 11.27 and 36.66 nM MUB·1 g d.m.·h−1, respectively, in charcoal-enriched horizons, but were, on average, 0.58, 3.20, 5.09 and 13.96 nM MUB·1 g d.m.·h−1, respectively, in control horizons. No significant difference was found in XYL and SP activity; their activities only tended to increase in charcoal-enriched horizons. From the regression analysis, we created models that accurately predicted the activity of analysed extracellular enzymes (R2 = 0.46–0.88). Carbon content most significantly influenced the predicted activity of the five tested enzymes (CB, BG, NAG, SP, and PH) (Table 5). Agglomeration analysis conclusively distinguished charcoal-enriched horizons from the humus-accumulated horizons of control soils based on the C, N and P content (Figure 5). Filtrates obtained from charcoal-enriched and control horizons showed highly similar contents of cations and ions, except for DOC, which was at a significantly higher concentration in control horizons than in charcoal-enriched horizons (at 5.91 mg·L−1 and 4.80 mg·L−1, respectively) (Table 6).

3.3. Diversity Analyses of Culturable Fungi from RCH Soils Using the Soil Dilution Method

A total of 79 fungal taxa belonging to 26 genera were identified from 1691 CFUs obtained from eight soil samples (Supplementary Materials, Table S2). Forty-seven taxa were identified at the species level and 21 taxa at the genus level. The rest was classified only to the level of family or higher. In total, 16 taxa were assigned to Mucoromycota, 61 to Ascomycota and 2 to Basidiomycota (Supplementary Materials, Table S2). The genus Penicillium was the most abundant in terms of mean frequency in the sample (42.7%) and species richness (14 species). A relatively high abundance (>6%) was also revealed for Mortierella (5 species), Trichoderma (5 species), Tolypocladium (2 species), Umbelopsis (4 species) and Oidiodendron (12 species) (Supplementary Materials, Tables S2 and S3).
The number of culturable microfungi (expressed as the total number of CFUs) was highest in C2 and lowest in RCH3 and RCH4 (Table S2). More culturable microfungi were obtained in control soil samples (mean = 306.3 CFUs) than in RCH soil samples (mean = 154.4 CFUs). Conversely, the variety of fungal taxa was greater in RCH soil samples (mean = 26.8) than in control soil samples (mean = 20.3).
The number of fungal genera varied from 10 to 14 in RCH soil samples and from 7 to 11 in control samples (Table S2). Mortierella, Penicillium, Tolypocladium and Trichoderma were the only genera present in all soil samples, whose members occurred more frequently in control soils (Supplementary Materials, Table S3). Other fungal genera were detected in certain soil samples. For example, Oberwinklerozyma and Talaromyces were specific to control soils (accounting for 15.4% of all fungal genera detected in these samples) (Supplementary Materials, Table S2). By contrast, Ascocoryne, Aspergillus, Cladosporium, Geomyces, Hyaloscypha, Infundichalara, Metapochonia, Microsphaeropsis, Phialocephala, Pochonia, Saitozyma, Sarocladium and Leptobacillium were specific to RCH soils (accounting for 54.2% of all fungal genera detected in these samples). Seven fungal genera, i.e., Absidia, Humicolopsis, Mucor, Oidiodendron, Pseudogymnoascus, Sagenomella and Umbelopsis were detected in certain RCH and control soils (Supplementary Materials, Table S2). Oidiodendron and Sagenomella occurred more frequently in RCH soils than in control soils. Members of the Oidiodendron genus (12 species) were detected in all RCH soil samples at a mean frequency of 10.9%, as well as in one of the control soil samples (1 species at a mean frequency of 0.9%). Similarly, two fungal species of the genus Sagenomella were detected in all RCH soil samples at a mean frequency of 4.3% and in one of the control soil samples at a mean frequency of 0.1% (Supplementary Materials, Table S3).
The number of taxa shared by the two soil types (RCH and control) was 25. The number of taxa specific to each soil was 43 for RCH soils and 11 for control soils (Supplementary Materials, Table S2). Out of 79 detected fungal taxa, only five were found in each soil sample, namely Mortierella macrocystis W. Gams, M. sossauensis E. Wolf, Penicillium janczewski K.W. Zaleski, Tolypocladium album (W. Gams) C.A. Quandt, Kepler & Spatafora and Trichoderma viride Pers. (Supplementary Materials, Table S2). The most common taxa in RCH soils were Aspergillus inflatus (Stolk & Malla) Samson, Frisvad, Varga, Visagie & Houbraken, M. macrocystis, Oidiodendron sp. 2, Oidiodendron sp. 6, P. janczewski, P. subspinulosum Houbraken, Sagenomella verticillate W. Gams & B.E. Söderstr., Umbelopsis isabellina (Oudem.) W. Gams, U. vinacea (Dixon-Stew.) Arx, T. album and T. viride. Taxa isolated considerably more frequently from RCH samples than from control samples were A. inflatus, M. macrocystis, Oidiodendron sp. 2, Oidiodendron sp. 6, S. verticillata, U. isabellina and U. vinacea. The most common taxa in control soils were Mortierella alliacea Linnem., M. macrocystis, M. sossauensis, Penicillium adametzii K.W. Zaleski, P. janczewskii and T. album. Among these fungi, M. alliacea, M. sossauensis, P. adametzii and T. album occurred more frequently in control soils than in RCH soils (Supplementary Materials, Table S2).
Penicillium spp. were the most dominant fungal genera in four RCH soils (RCH1, RCH2, RCH3 and RCH-5) and all control soils (with Y-values ranging from 11.1111 to 38.6823). The most dominant fungal genus in RCH 4 was Umbelopsis (Y = 4.8186) (Table 7). Species diversity measured with Margalef’s (D′), Shannon’s diversity (H′) and Simpson’s diversity (DS) indices was greater in all RCH soils except RCH1, which had the lowest diversity indices. The same relation was observed with the Pielou index (J), reflecting species uniformity (Table 8). The fungal community in RCH1 soil showed the highest degree of ecological dominance, with a λ value of 0.3495. Conversely, the lowest λ value was obtained in RCH2 and RCH3 soils (λ = 0.0975 and λ = 0.0955, respectively) (Table 8).

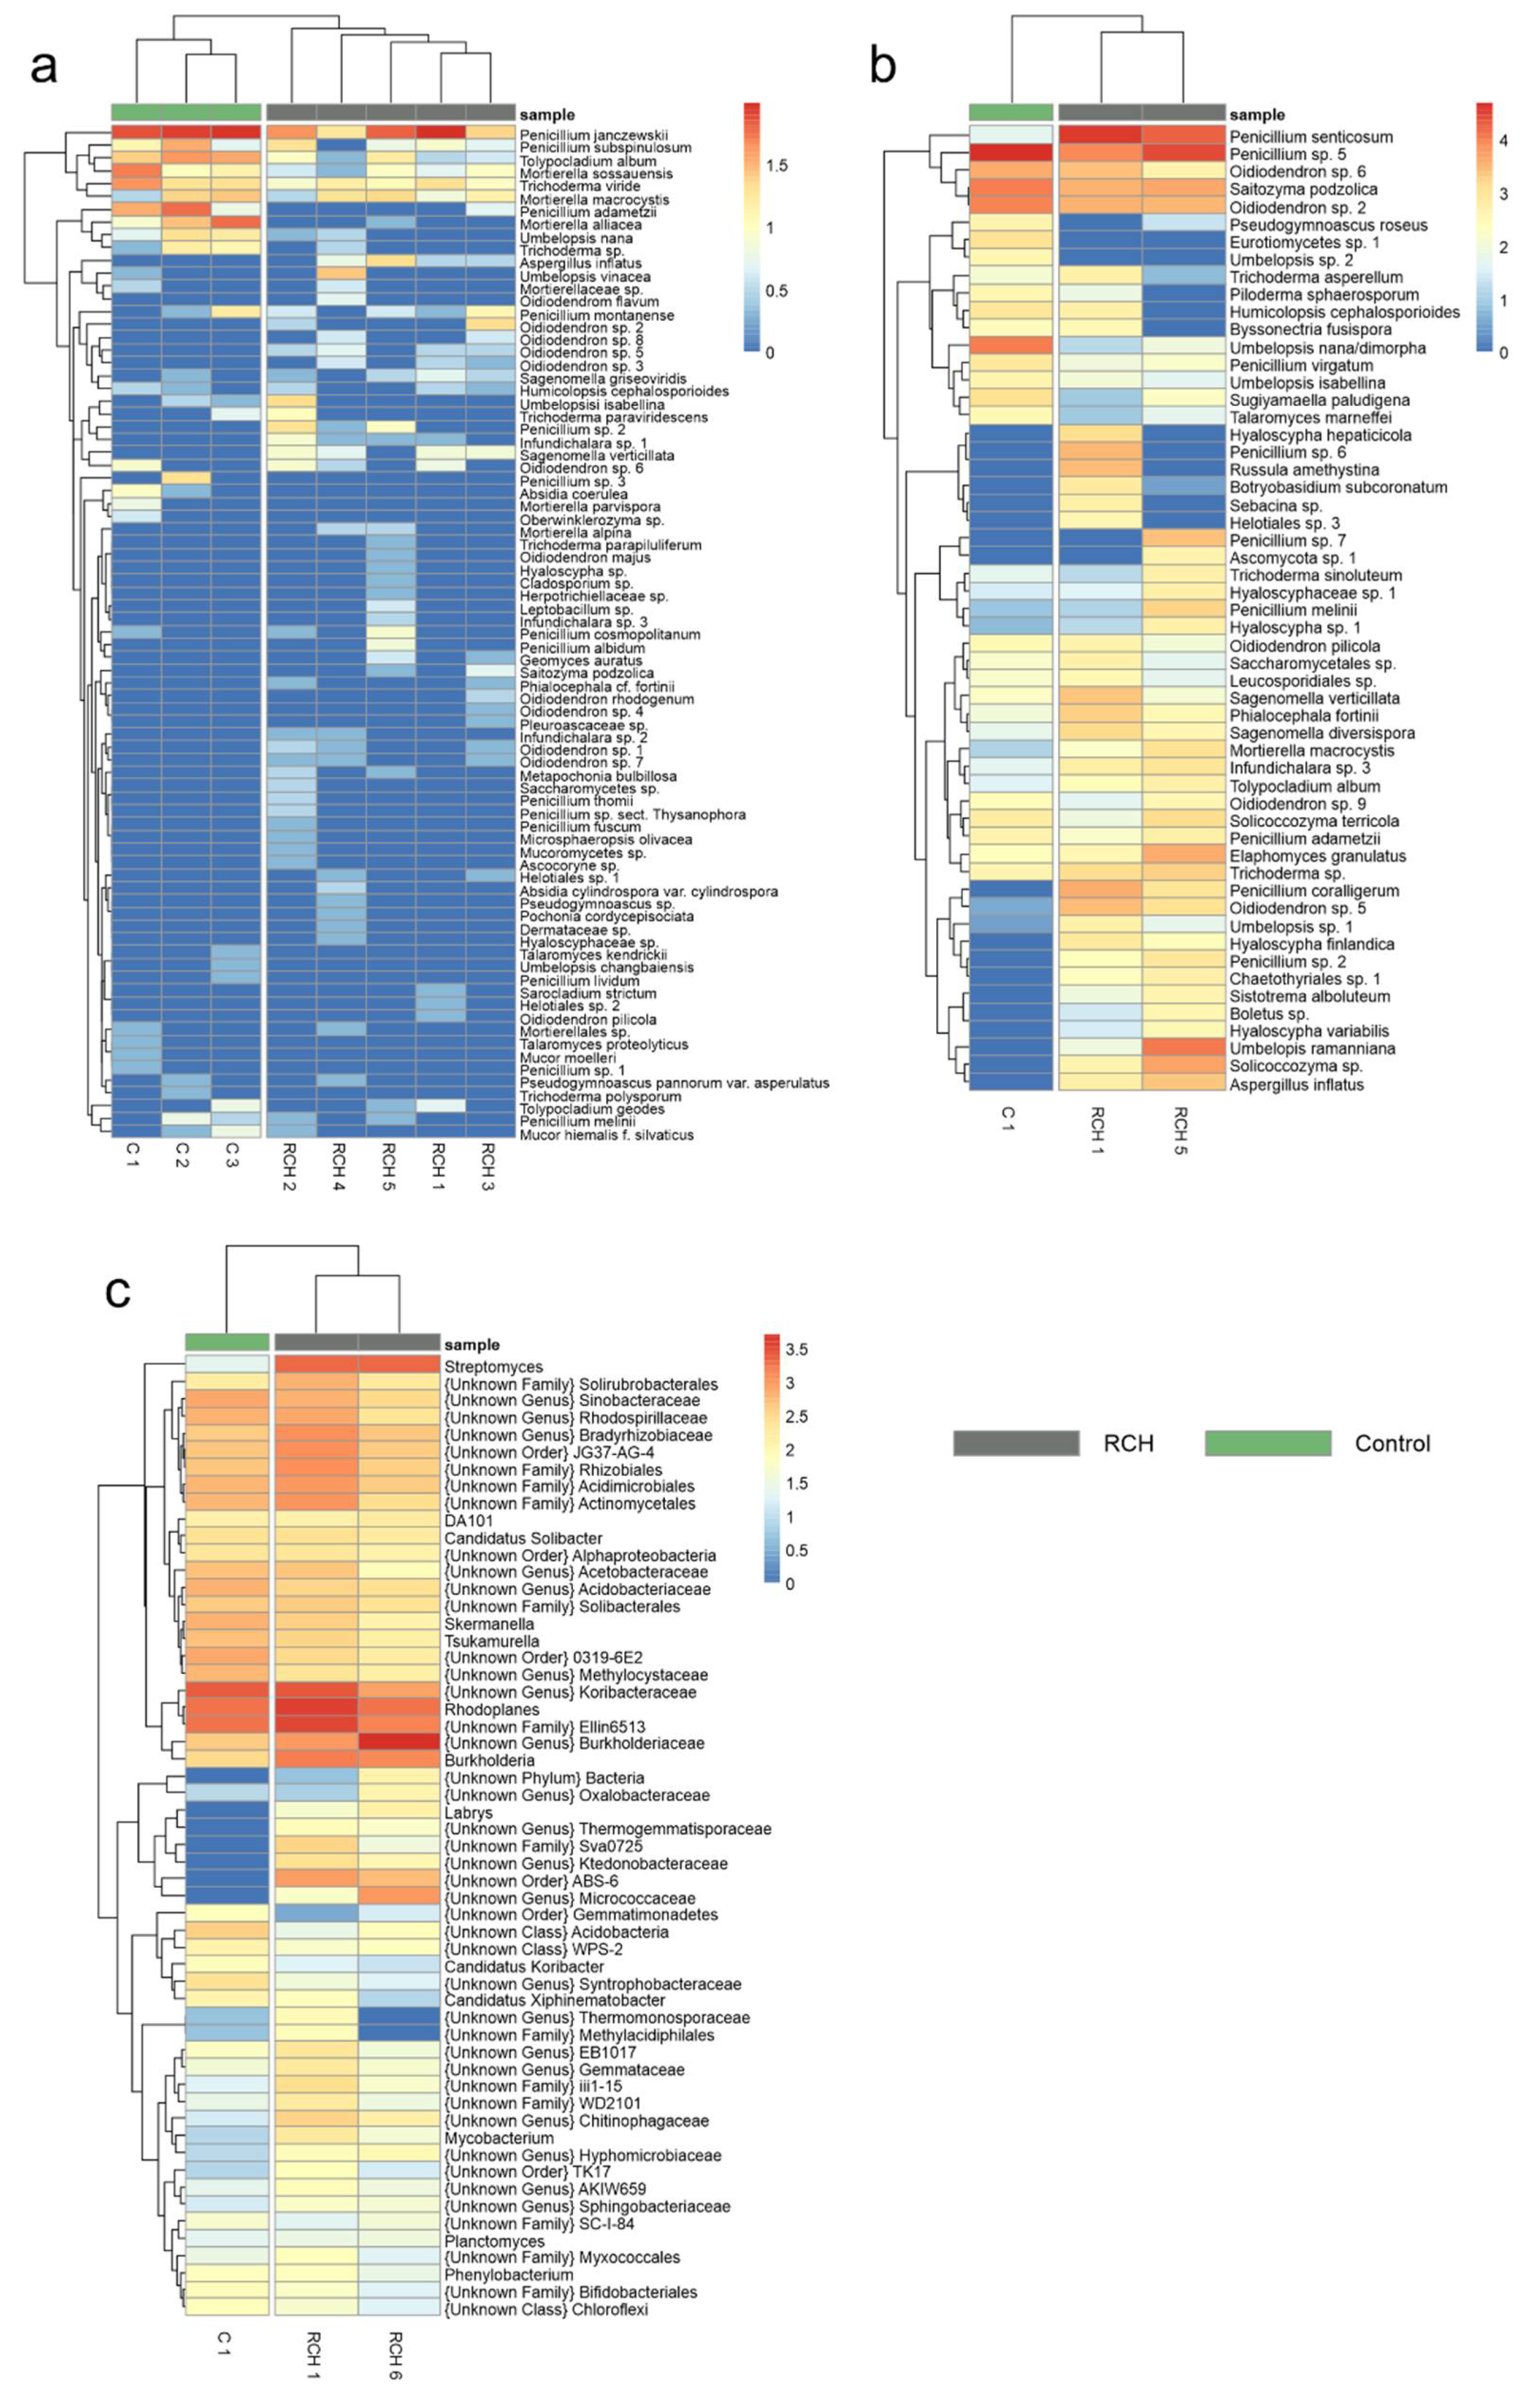
3.4. Identification of Fungal and Bacterial Communities Using ITS and 16S rDNA Next-Generation Sequencing

The number of ITS reads was relatively similar among the three soil samples analysed using NGS and ranged from 89,335 in RCH1 to 98,023 in RCH5. The opposite was observed in bacterial 16S sequences, with an uneven distribution among tested samples. The highest number of 16S reads (29,219) was recorded in RCH1. The number of reads in RCH5 (19,669) and C1 (16,808) accounted for only 67.32% and 57.52% of the RCH1 reads, respectively.
Clustering of ITS sequences yielded 447 unique OTUs that were identified as 433 taxa. Of these, 130 taxa were identified to the species level and 232 to levels of higher taxonomic units (up to the phylum level), while 71 taxa were classified as “unidentified fungus” (i.e., impossible to define at the phylum level) (Supplementary Materials, Table S4). Altogether, 34 taxa were assigned to Mucoromycota, 236 to Ascomycota, 87 to Basidiomycota and 1 to Glomeromycota (Supplementary Materials, Table S4). Four additional taxa were assigned to Rozellomycota. By far, the most abundant fungal genus detected via NGS analysis was Penicillium, which amounted to 55.68% of the total number of ITS reads (Figure 6). This genus was also the most abundant in terms of species number (16 species). The following 10 genera reached an abundance level of 1%: Oidiodendron (10.14% of reads, 14 species), Umbelopsis (8.44% of reads, 14 species), Saitozyma (6.39% of reads, sole species: S. podzolica), Solicoccozyma (2.65% of reads, two species), Trichoderma (1.68% of reads, 8 species), Elaphomyces (1.66% of reads, sole species: E. granulatus), Sagenomella (1.55% of reads, two species), Hyaloscypha (1.15% of reads, 6 species), Russula (1.09% of reads, two species) and Aspergillus (1.00% of reads, three species).
A notable result of NGS metabarcoding of fungi was the high number (283) of unique taxa in RCH samples compared to 72 in control samples, with 78 shared taxa between the RCH and control samples (Figure 6). A relative abundance chart showing the 10 most common fungal genera (Figure 6) also indicates the higher diversity in RCH samples than in control samples dominated by only four fungal genera (Penicillium, Oidiodendron, Umbelopsis and Saitozyma) that collectively amounted to more than 90% of the reads.
Conversely, bacterial 16S rDNA sequence clustering generated 533 unique OTUs, of which 15 taxa were identified to the species level. Out of a total of 65,696 reads, 64 were assigned to Archaea (19 in RCH1, 14 in RCH5; and 31 in C1) and 65,625 to Bacteria (29,200 in RCH1, 19,650 in RCH5 and 16,775 in C1). A total of 26 phyla were identified, with Proteobacteria, Acidobacteria and Actinobacteria occurring the most frequently (43.43%, 25.36% and 18.22%, respectively; Figure 6). Rhodoplanes was the most abundant identified bacterial genus, constituting 10.41% of 16S rDNA reads. Although 24 taxa showed an abundance higher than 1%, many could not be identified up to the genus level. The following genera of the 24 most abundant taxa were found at a 1% threshold: Streptomyces (6.19%, 4068 reads), Burkholderia (4.49%, 2953 reads), Skermanella (1.68%, 1107 reads), Tsukamurella (1.50%, 988 reads) and Candidatus Solibacter (1.03%, 678 reads). Notable differences in the percentage of a few shared taxa were observed among RCH and control samples, e.g., in Streptomyces (6.85%, 10.39% and 0.13% for RCH1, RCH5 and C1, respectively), Burkholderia (5.04%, 5.99% and 1.78% for RCH1, RCH5 and C1, respectively) or Syntrophobacteraceae (0.12%, 0.08% and 1.43% for RCH1, RCH5 and C1, respectively). Moreover, 33 taxa undetected in C1 were present in RCH1 and RCH2 simultaneously; however, only three represented more than 1% of reads in each sample. They were {Unknown Order} ABS-6, {Unknown Family} Sva0725 and {Unknown Genus} Micrococcaceae.
The abundance of the most common fungal species (number of ITS reads > 350) and bacterial genera (number of 16S reads > 80) was plotted in two heatmaps (Figure 7). The abundance was scaled logarithmically due to large differences in the number of reads between particular species or genera. The heatmaps highlighted the similar diversity pattern of fungi and bacteria in two RCH samples. The heatmap clustering algorithms (all clustering methods were implemented in the package) confirmed this observation by consistently grouping both RCH samples against the control soil sample. It should be noted that this pattern was similar to that observed in culturable fungi (Figure 7).
Similar to the species diversity revealed in fungal isolations, diversity indices calculated based on ITS data showed that RCH soils were more diverse than control soil. Margalef’s index (D′), Simpson’s index (DS) and Shannon’s diversity index (H′) were significantly higher for RCH samples than for control sample (Table 8). RCH samples were also characterised by considerably higher species richness (218 and 238 vs. 150 in the control). Meanwhile, RCH5 showed the lowest λ index and the highest Pielou index (J), indicating its low dominance and high equitability. The diversity of bacterial genera was significantly higher in both RCH samples when measured with Margalef’s index (D′) but not with Shannon’s diversity index (H′) and Simpson’s index (DS), which were lowest in RCH5. By contrast, the richness of bacterial genera was much lower in control samples than in both RCH samples, repeating the pattern obtained from assessing species richness in fungi (Table 8).

4. Discussion

4.1. Influence of Charcoal Enrichment on the Physical Properties of Soils

Differences in the physical properties (e.g., structure and water holding capacity) of soils were detected in the present study. Charcoal-enriched horizons showed a clearly developed aggregate structure (subangular blocky), while charcoal-free soils were characterized by single grain structure. Because crushed charcoal forms the centres of aggregate structures, it can be assumed that these structures are the result of an increase in the number of soil microorganisms and their enzymatic activity. There is evidence of the influence of charcoal particles on the formation of aggregate structures in soils [57]. Charcoal can combine with soil mineral fractions or form part of soil aggregates. Moreover, charcoal can connect with clay and organic particles through cationic bridges. Biochar significantly affects several physical properties such as bulk density, porosity, infiltration rates and the stability of soil aggregates [58,59,60]. The contributing factor to improved soil structure also enhanced the development of fine roots. Here, we noted that charcoal-enriched horizons were more extensively overgrown with roots of undergrowth vegetation (mainly blueberries), which also grew more vigorously on charcoal-enriched surfaces. This finding is consistent with those of Rejkovich et al. [61], which showed that denser root systems were formed following soil fertilisation with biochar. However, certain studies reported a different trend. Mastrolonardo et al. [62] analysed the nutritional status and growth parameters of beech and birch trees growing on RCHs and reported lower values of the annual increments of wood for both species. In the present study, charcoal-enriched horizons were distinguished by higher humidity, suggesting that such soils have a higher capacity to accumulate water. The increase in water holding capacity of biochar-enriched horizons was confirmed in previous studies [60,63].

4.2. Influence of Charcoal Enrichment on Soil Chemical Properties

Large amounts of carbon and nutrients are introduced to the soil, together with charcoal. Mastrolonardo et al. [62] reported that 70–94% of the organic carbon in RCH soils came from charcoal, which was formed from the supply of 342 tons of biochar per hectare. With the increased carbon reserve, RCH soils showed higher concentrations of Ca, Mg, K and Na and higher values of CEC after 150 years. The amount of nutrients introduced into the soil significantly depends on the starting material from which the biochar was formed, the course of the pyrolysis process and the actual dose of biochar [59]. In the present study, the charcoal was produced mainly from the charring of pine wood (Pinus sylvestris) and, to a lesser extent, from aspen wood (Populus tremula) [64]. The soil enriched with carbon on RCH surfaces had significantly higher contents of Ca, Na and P. The lack of K enrichment in RCH soils could be explained by the high mobility of this cation and its extensive leaching through the permeable sandy soils of the study area. Studies have shown that, although biochar initially releases large amounts of nutrients, the amount of leached components decreases significantly over time [65]. This observation explains the lack of significant differences in filtrate composition between samples obtained from charcoal-enriched horizons and those from control horizons in the present study.

4.3. Influence of Charcoal Enrichment on Enzymatic Activity, Composition and Diversity of Soil Microorganisms

We noted a significant increase in the activities of four extracellular enzymes involved in C, N and P transformations. The impact of biochar enrichment of soil on its microbiological characteristics (e.g., the composition of microbial communities and their activity) has been reported in many studies [12,59,66]. Wardle et al. [67] showed that charcoal mixed with humus accelerated the decomposition of humus compounds, highlighting its stimulating effect on the activity of microorganisms related to the presence of charcoal. The highly porous structure and large surface area of charcoal provide a habitat for beneficial soil microorganisms such as mycorrhizal fungi or bacteria [12]. Domene et al. [68] showed that biochar at a dose of 30 t·h−1 caused an approximately two-fold increase in microbial carbon biomass in the soil. The enrichment of soil with biochar can promote changes in microbial composition and structure [59]. However, these changes are induced more by modifying ecological niches in the soil environment (e.g., changes in nutrients availability, pH) than by changing the source of C available to organisms [66].
The present study revealed 79 culturable fungal taxa from soil samples, including 30 taxa with no significant similarity at the species level to known fungal sequences in the GenBank database. The culturable fungal community was dominated by Ascomycota, followed by Mucoromycota, consistent with findings from previous studies on fungal diversity in the soils of Pinus sylvestris forests [69,70,71,72,73]. The six genera most common among culturable fungi were Mortierella, Oidiodendron, Penicillium, Tolypocladium, Trichoderma, and Umbelopsis. Similar results were obtained in different pine forests in Europe [17,20,69,70,71,72,73,74,75]. However, our results indicate that the application of a culture-based approach to detect soil fungi using Martin medium did not allow for the efficient detection of Basidiomycota, including mycorrhizal fungi. Moreover, NGS metabarcoding revealed that Basidiomycota was substantially underrepresented among the culturable fungi. ITS sequences belonging to Basidiomycota amounted to 21.55% of the total number of reads grouped in 84 OTUs with at least phylum level identification. In addition, three basidiomycetous genera, namely Russula, Saitozyma and Solicoccozyma, were among the 10 most abundant genera. These results indicate that Basidiomycota is a very important component of fungal communities associated with soils of temperate forests, including, notably, the fungal partners of ECM symbioses and soil yeasts [14,16,17,76,77,78]. For example, Kwaśna et al. [20] detected 34 species of Basidiomycota in soils of P. sylvestris, including the following predominant ones: Cantharellus cibarius Fr., Coltricia perennis (L.) Murrill, Cryptococcus sp., Inocybe lacera (Fr.) P. Kumm and Suillus spp. Interestingly, our NGS data confirmed the occurrence of C. perennis, Cryptococcus sp., Inocybe subcarpta Kühner & Boursier and three species of Suillus; however, their abundance was far from dominant as their collective presence amounted only to 97 ITS reads.
In the present study, we combined traditional culture methods and NGS to distinguish the following fungal groups: (a) saprotrophic Absidia spp., Gymnopilus spp., Mortierella spp., Mucor spp., Infundichalara spp., Penicillium spp., Talaromyces spp., Umbellopsis spp.; (b) ericoid mycorrhizal Cadophora finlandica (C.J.K. Wang & H.E. Wilcos) T.C. Harr & McNew, Oidiodendron spp., Pseudogymnoascus spp; (c) ectomycorrhizal Amanita rubescens Pers., Boletus edulis Bull., Elaphomyces asperulus Vittad., Imleria badia (Fr.) Vizzini, Russula amethystina Quél., R. sardonia Fr., Sistotrema sp., Wilcoxina mikolae (Chin S. Yang & H.E. Wilcox) Chin S. Yang & Korf; (d) root endophytes Archaeorhizomyces spp., Phialocephala spp.; (e) soil yeast Candida boleticola Nakase, Cryptococcus sp., Coniochaeta sp., Solicoccozyma terricola (T.A. Pedersen) Yurkov, Sugiyamaella paludigena (Golubev & Blagod.) H. Urbina & M. Blackw.; (f) animal pathogens Sagenomella spp.; (g) insect and rotifer pathogens and fungal hyperparasites Tolypocladium spp.; (f) plant pathogens Heterobasidion sp., Fusarium sp.; (i) nematode pathogens Pochonia bulbillosa (W. Gams & Malla) Zare & W. Gams; (j) dry rot fungi Piloderma sphaerosporum Jülich, Serpula himantioides (Fr.) P. Karst. Kwaśna et al. [20] screened similar functional groups of fungi in soils of P. sylvestris.
Results for the abundance of soil microorganisms varied between traditional culture methods and NGS. The abundance of culturable fungi (measured as total number of CFUs) was higher in control soils than in RCH soils. We could not confirm this result using Illumina sequencing, as this method generated highly similar numbers of ITS reads in RCH and control samples. Moreover, the number of reads of bacterial 16S sequences was lowest in control samples. These results suggest, firstly, that the serial dilution method is less efficient for soil substrates with a heavy charcoal content, most probably due to its high porosity, which makes a portion of fungal propagules (e.g., spores, and vegetative hyphae) harder to dislodge by shaking. Secondly, this same porosity promotes bacterial growth, providing a stable protective substrate.
NGS-based identification of bacteria present in the three soil samples showed that the three most abundant bacterial phyla were Proteobacteria, Acidobacteria and Actinobacteria (accounting for 43.43%, 45.35% and 18.22% of reads, respectively). This finding is consistent with that of López-Mondéjar et al. [79], who reported that temperate forest soils are dominated by these three groups, together with members of Bacteroidetes. However, the latter was not among the most frequently detected phyla in our study (with only 0.96% of reads). According to Uroz et al. [80], the prevalence of bacterial phyla may be related to the chemical characteristics of soils horizons, with organic horizons being richer in Proteobacteria, Bacteroidetes and Verrucomicrobia—the phyla that may preferentially utilise easily accessible carbon [81]. From our results, this type of association was only observed in the case of Bacteroidetes, whose abundance was 3.36 to 5.25 times higher in charcoal-enriched soils than in control soil. This heterotrophic group of bacteria participates in the decomposition of soil organic matter [82]. Wei et al. [83] state that the organic carbon content in soil is one of the most important factors affecting bacterial community structure, as it is the direct precursor of bacterial growth and activity. The five most common genera found in the total pool of sequences were Rhodoplanes (10.41% of reads), members of the family Burkholderiaceae (9.51% of reads), Koribacteraceae (8.94% of reads), Streptomyces (6.19% of reads) and Burkholderia (4.49% of reads). Three of these groups were among the five mentioned by Urbanová et al. [17] as the most commonly found bacteria in forest soils (which include Bradyrhizobium, Sphingomonas, Burkholderia, Rhodoplanes and Chthoniobacter). Rhodoplanes, Streptomyces, Burkholderia and members of the Koribacteraceae, Burkholderiaceae, Bradyrhizobiaceae and Micrococcaceae families were the most common in charcoal-enriched soils. Rhodoplanes, Skermanella and members of the families Koribacteraceae, Sinobacteraceae and Rhodospirillaceae were the most common in control soil.
Analysis of data obtained using the culture-based method combined with metabarcoding tools showed a clear separation of fungal and bacterial communities in the studied soil types, based on their charcoal content. This distinction was clearly observed in the patterns of ecological diversity indices, which consistently indicated that microbial communities associated with RCHs were more diverse. This observation was further evidenced by the consistent clustering of RCH soils against control samples during analysis using pheatmap (Figure 10). This effect was the most pronounced in fungi, whose vast majority of taxa (82% from NGS analysis, 68% from culture-based methods) was unique either to RCH or control soils. Fungal and bacterial diversity, as well as species and genera richness, were higher at RCH sites compared to non-charcoal-enriched sites, although these habitat types were otherwise very similar. Similar responses of soil fungi to increased organic carbon content were noted in other pyrogenic carbonaceous materials. Biochar can be used for agricultural purposes, especially to improve soil structure, increase porosity, decrease bulk density, as well as enhance aggregation and water retention [59]. The microbial community composition and structure may change following the addition of biochar to soil [59]. It may be increased [66,84] or decreased [85,86] due to the high competition among microorganisms in charcoal-enriched soils negatively affecting the abundance of certain fungal or bacterial species. However, the literature lacks any information on the impact of long-term charcoal deposition on the abundance, activity and biodiversity of soil microorganisms in temperate P. sylvestris forests. Therefore, our results demonstrate a positive effect overall, suggesting that the application of charcoal may be a novel and useful tool to increase the microbial diversity of forest soils, especially for the reforestation or re-cultivation of disturbed habitats.
Our research confirmed the importance of charcoal in shaping soil properties, which had consequences for the number and diversity of bacteria and fungi. The greater fungal and bacterial diversity in RCH soils could be an effect of higher contents of organic carbon, phosphorus, Ca, as well as certain microelements and heavy metals (Cd, Co, Mn, Ni and Zn), allowing for the presence of more specialised organisms. In addition, well-developed aggregate structures and higher humidity in charcoal-enriched horizons could provide better conditions and sheltered habitats for microbial growth. The soils of relict charcoal hearths have different physical and chemical properties which favor the formation of hotspots. The formation of hotspots in sandy soils of pine forests is the result of a historic forest management method—charcoal production. In poor temperate pine forests, it is important to enhance soil biodiversity by preserving hotspots which induce changes of soil properties beneficial for the development of microorganisms. The obtained results indicate the need to protect relicts of charcoal hearths, especially by avoiding soil plowing.

5. Conclusions

Our findings confirmed the formulated hypotheses. Charcoal from wood burning improved the properties of forest soils, particularly the organic carbon content and the contents of macro- and micro-elements, which increased the enzymatic activity of soil microorganisms. Charcoal-enriched horizons typically contained 2.5–3.0% more C, with individual samples even containing 5.0–5.5% more C. Differences in available P usually amounted to 30–40 mg·kg−1 but could even reach 60–70 mg·kg−1 in relation to control soils. Variables that significantly affected the activity of BG and PH were the contents of carbon and available phosphorus. The highest BG and PH activities were found in tested soils with a C content > 4.8% and the content of available P > 31.4 mg·kg−1. The enrichment of soil with charcoal affected its microbial communities. Bacterial and fungal diversity was greater in RCH soils than in non-RCH soils, suggesting that the presence of charcoal promoted the growth of bacteria and fungi in Scots pine forest soils. This effect was most likely due to the improved soil structure and porosity of charcoal particles that provided sheltered habitats for various groups of bacteria and fungi.
The occurrence of RCHs in areas with predominantly poor sandy soils increases the pool of carbon and nutrients. Thus, forest management strategies should pay special attention to the protection of RCHs as a source of stable C form accumulation and valuable biodiversity hotspots.

Supplementary Materials

The following are available online at https://www.mdpi.com/article/10.3390/f12111488/s1, Figure S1: Charcoal preserved in the soil profile, Table S1: Fungi isolated from the relict charcoal hearths (RCH) soil and control soil; National Center for Biotechnology Information (NCBI) accession numbers assigned to the sequences generated in this study, Table S2: Frequencies (%) of culturable fungi from relict charcoal hearths (RCH) soil and control soil, Table S3: Frequencies (%) of culturable fungal genera from relict charcoal hearths (RCH) soil and control soil, Table S4: Metabarcoding of fungal species (ITS) and bacterial genera (16S) associated with relict charcoal hearths (RCH) and control soils (C, P. sylvestris forest soil).

Author Contributions

Conceptualization, J.L., E.B., T.B., W.P., H.S., R.J., P.B. and A.L.-B.; data curation, J.L., E.B., T.B., W.P., H.S., R.J., P.B. and A.L.-B.; formal analysis, J.L., E.B., T.B., H.S., R.J., P.B. and A.L.-B.; funding acquisition, J.L., E.B., W.P., H.S., R.J. and P.B.; investigation, J.L., E.B., T.B., W.P., H.S., R.J., P.B. and A.L.-B.; visualization, J.L., E.B., H.S., R.J., P.B. and A.L.-B.; writing—original draft, J.L., E.B., T.B., W.P., H.S., R.J., P.B. and A.L.-B.; writing—review and editing, J.L., E.B., T.B., W.P., H.S., R.J., P.B. and A.L.-B. All authors have read and agreed to the published version of the manuscript.

Funding

This work was supported by the Ministry of Science and Higher Education of the Republic of Poland (SUB/040012/D019; SUB/040013/D019; A434; A439).

Data Availability Statement

Data is contained within the article.

Conflicts of Interest

The authors declare no conflict of interest.

References

  1. Hardy, B.; Dufey, J.E. The resistance of centennial soil charcoal to the “Walkley-Black” oxidation. Geoderma 2017, 303, 37–43. [Google Scholar] [CrossRef]
  2. Krebs, P.; Pezzatti, G.B.; Stocker, M.; Bürgi, M.; Conedera, M. The selection of suitable sites for traditional charcoal production: Ideas and practice in southern Switzerland. J. Hist. Geogr. 2017, 57, 1–16. [Google Scholar] [CrossRef]
  3. Mastrolonardo, G.; Francioso, O.; Certini, G. Relic charcoal hearth soils: A neglected carbon reservoir. Case study at Marsiliana forest, Central Italy. Geoderma 2018, 315, 88–95. [Google Scholar] [CrossRef]
  4. Rutkiewicz, P.; Malik, I.; Wistuba, M.; Osika, A. High concentration of charcoal hearth remains as legacy of historical ferrous metallurgy in southern Poland. Quat. Int. 2019, 512, 133–143. [Google Scholar] [CrossRef]
  5. Donovan, S.; Ignatiadis, M.; Ouimet, W.; Dethier, D.; Hren, M. Gradients of geochemical change in relic charcoal hearth soils, Northwestern Connecticut, USA. Catena 2021, 197, 104991. [Google Scholar] [CrossRef]
  6. Criscuoli, I.; Baronti, S.; Alberti, G.; Rumpel, C.; Giordan, M.; Camin, F.; Ziller, L.; Martinez, C.; Pusceddu, E.; Miglietta, F. Anthropogenic charcoal-rich soils of the XIX century reveal that biochar leads to enhanced fertility and fodder quality of alpine grasslands. Plant Soil 2017, 411, 499–516. [Google Scholar] [CrossRef] [Green Version]
  7. Cheng, C.H.; Lin, T.P.; Lehmann, J.; Fang, L.J.; Yang, Y.W.; Menyailo, O.V.; Chang, K.-H.; Lai, J.S. Sorption properties for black carbon (wood char) after long term exposure in soils. Org. Geochem. 2014, 70, 53–61. [Google Scholar] [CrossRef]
  8. Bonhage, A.; Hirsch, F.; Schneider, A.; Raab, A.; Raab, T.; Donovan, S. Long term anthropogenic enrichment of soil organic matter stocks in forest soils–detecting a legacy of historical charcoal production. For. Ecol. Manag. 2020, 459, 117814. [Google Scholar] [CrossRef]
  9. de Lafontaine, G.; Asselin, H. Soil charcoal stability over the Holocene across boreal northeastern North America. Quat. Res. 2011, 76, 196–200. [Google Scholar] [CrossRef]
  10. Kolb, S.E.; Fermanich, K.J.; Dornbush, M.E. Effect of charcoal quantity on microbial biomass and activity in temperate soils. Soil Sci. Soc. Am. J. 2009, 73, 1173–1181. [Google Scholar] [CrossRef] [Green Version]
  11. Glaser, B.; Lehmann, J.; Zech, W. Ameliorating physical and chemical properties of highly weathered soils in the tropics with charcoal—A review. Biol. Fertil. Soils 2002, 35, 219–230. [Google Scholar] [CrossRef]
  12. Pietikäinen, J.; Kiikkilä, O.; Fritze, H. Charcoal as a habitat for microbes and its effect on the microbial community of the underlying humus. Oikos 2000, 89, 231–242. [Google Scholar] [CrossRef]
  13. Frąc, M.; Hannula, S.E.; Bełka, M.; Jędryczka, M. Fungal biodiversity and their role in soil health. Front. Microbiol. 2018, 9, 707. [Google Scholar] [CrossRef] [PubMed] [Green Version]
  14. Baldrian, P. Forest microbiome: Diversity, complexity and dynamics. FEMS Microbiol. Rev. 2017, 41, 109–130. [Google Scholar] [CrossRef] [Green Version]
  15. Baldrian, P.; Kolařík, M.; Štursová, M.; Kopecký, J.; Valášková, V.; Větrovský, T.; Žifčáková, L.; Šnajdr, J.; Rídl, J.; Vlček, Č.; et al. Active and total microbial communities in forest soil are largely different and highly stratified during decomposition. ISME J. 2012, 6, 248–258. [Google Scholar] [CrossRef] [Green Version]
  16. Goldmann, K.; Schöning, I.; Buscot, F.; Wubet, T. Forest management type influences diversity and community composition of soil fungi across temperate forest ecosystems. Front. Microbiol. 2015, 6, 1300. [Google Scholar] [CrossRef] [Green Version]
  17. Urbanová, M.; Šnajdr, J.; Baldrian, P. Composition of fungal and bacterial communities in forest litter and soil is largely determined by dominant trees. Soil Biol. Biochem. 2015, 84, 53–64. [Google Scholar] [CrossRef]
  18. Egidi, E.; Delgado-Baquerizo, M.; Plett, J.M.; Wang, J.; Eldridge, D.J.; Bardgett, R.D.; Maestre, F.T.; Singh, B.K. A few Ascomycota taxa dominate soil fungal communities worldwide. Nat. Commun. 2019, 10, 2369. [Google Scholar] [CrossRef] [PubMed] [Green Version]
  19. Wu, D.; Zhang, M.; Peng, M.; Sui, X.; Li, W.; Sun, G. Variations in soil functional fungal community structure associated with pure and mixed plantations in typical temperate forests of China. Front. Microbiol. 2019, 10, 1636. [Google Scholar] [CrossRef] [Green Version]
  20. Kwaśna, H.; Behnke-Borowczyk, J.; Gornowicz, R.; Łakomy, P. Effects of preparation of clear-cut forest sites on the soil mycobiota with consequences for Scots pine growth and health. For. Pathol. 2019, 49, e12494. [Google Scholar] [CrossRef]
  21. Lladó, S.; López-Mondéjar, R.; Baldrian, P. Forest soil bacteria: Diversity, involvement in ecosystem processes, and response to global change. Microbiol. Mol. Biol. Rev. 2017, 81, e00063-16. [Google Scholar] [CrossRef] [PubMed] [Green Version]
  22. Wardle, D.A.; Bardgett, R.D.; Klironomos, J.N.; Setälä, H.; Van Der Putten, W.H.; Wall, D.H. Ecological linkages between aboveground and belowground biota. Science 2004, 304, 1629–1633. [Google Scholar] [CrossRef] [PubMed]
  23. Singh, B.K.; Dawson, L.A.; Macdonald, C.A.; Buckland, S.M. Impact of biotic and abiotic interaction on soil microbial communities and functions: A field study. Appl. Appl. Appl. Soil Ecol. 2009, 41, 239–248. [Google Scholar] [CrossRef]
  24. Andrew, D.R.; Fitak, R.R.; Munguia-Vega, A.; Racolta, A.; Martinson, V.G.; Dontsova, K. Abiotic factors shape microbial diversity in Sonoran Desert soils. Appl. Environ. Microbiol. 2012, 78, 7527–7537. [Google Scholar] [CrossRef] [Green Version]
  25. De Vries, F.T.; Manning, P.; Tallowin, J.R.; Mortimer, S.R.; Pilgrim, E.S.; Harrison, K.A.; Hobbs, P.J.; Quirk, H.; Shipley, B.; Cornelissen, J.H.C.; et al. Abiotic drivers and plant traits explain landscape-scale patterns in soil microbial communities. Ecol. Lett. 2012, 15, 1230–1239. [Google Scholar] [CrossRef]
  26. Wang, C.; Michalet, R.; Liu, Z.; Jiang, X.; Wang, X.; Zhang, G.; An, L.; Chen, S.; Xiao, S. Disentangling large-and small-scale abiotic and biotic factors shaping soil microbial communities in an alpine cushion plant system. Front. Microbiol. 2020, 11, 925. [Google Scholar] [CrossRef] [PubMed]
  27. Rousk, J.; Bååth, E.; Brookes, P.C.; Lauber, C.L.; Lozupone, C.; Caporaso, J.G.; Knight, R.; Fierer, N. Soil bacterial and fungal communities across a pH gradient in an arable soil. ISME J. 2010, 4, 1340–1351. [Google Scholar] [CrossRef]
  28. Bainard, L.D.; Hamel, C.; Gan, Y. Edaphic properties override the influence of crops on the composition of the soil bacterial community in a semiarid agroecosystem. Appl. Soil Ecol. 2016, 105, 160–168. [Google Scholar] [CrossRef]
  29. Lauber, C.L.; Hamady, M.; Knight, R.; Fierer, N. Pyrosequencing-based assessment of soil pH as a predictor of soil bacterial community structure at the continental scale. Appl. Environ. Microbiol. 2009, 75, 5111–5120. [Google Scholar] [CrossRef] [Green Version]
  30. Prescott, C.E.; Grayston, S.J. Tree species influence on microbial communities in litter and soil: Current knowledge and research needs. For. Ecol. Manag. 2013, 309, 19–27. [Google Scholar] [CrossRef]
  31. Dastogeer, K.M.; Tumpa, F.H.; Sultana, A.; Akter, M.A.; Chakraborty, A. Plant microbiome—An account of the factors that shape community composition and diversity. Curr. Plant Biol. 2020, 23, 100161. [Google Scholar] [CrossRef]
  32. Allison, S.D.; Gartner, T.B.; Holland, K.; Weintraub, M.; Sinsabaugh, R.L. Soil enzymes: Linking proteomics and ecological processes. In Manual of Environmental Microbiology, 3rd ed.; American Society of Microbiology: Washington, DC, USA, 2007; pp. 704–711. [Google Scholar]
  33. Błońska, E.; Bednarz, B.; Kacprzyk, M.; Piaszczyk, W.; Lasota, J. Effect of scots pine forest management on soil properties and carabid beetle occurrence under post-fire environmental conditions—A case study from Central Europe. For. Ecosyst. 2020, 7, 28. [Google Scholar] [CrossRef]
  34. Błońska, E.; Piaszczyk, W.; Staszel, K.; Lasota, J. Enzymatic activity of soils and soil organic matter stabilization as an effect of components released from the decomposition of litter. Appl. Soil Ecol. 2021, 157, 103723. [Google Scholar] [CrossRef]
  35. Nannipieri, P.; Trasar-Cepeda, C.; Dick, R.P. Soil enzyme activity: A brief history and biochemistry as a basis for appropriate interpretations and meta-analysis. Biol. Fertil. Soils 2018, 54, 11–19. [Google Scholar] [CrossRef]
  36. Nannipieri, P.; Kandeler, E.; Ruggiero, P. Enzyme activities and microbiological and biochemical processes in soil. In Enzymes in the Environonment; Marcel Dekker, Inc.: New York, NY, USA, 2002; pp. 1–33. [Google Scholar]
  37. Gul, S.; Whalen, J.K.; Thomas, B.W.; Sachdeva, V.; Deng, H. Physico-chemical properties and microbial responses in biochar-amended soils: Mechanisms and future directions. Agric. Ecosyst. Environ. 2015, 206, 46–59. [Google Scholar] [CrossRef]
  38. IUSS Working Group WRB. World Reference Base for Soil Resources 2014: International Soil Classification System for Naming Soils and Creating Legends for Soil Maps; Update 2015; World Soil Resources Reports No. 106; FAO: Rome, Italy, 2015; 192p. [Google Scholar]
  39. Ostrowska, A.; Gawliński, S.; Szczubiałka, Z. Methods of Analysis and Assessment of Soil and Plant Properties: A Catalgoue; Institute of Environmental Protection–National Research Institute: Warsaw, Poland, 1991; 334p. [Google Scholar]
  40. Pritsch, K.; Raidl, S.; Marksteiner, E.; Blaschke, H.; Agerer, R.; Schloter, M.; Hartmann, A. A rapid and highly sensitive method for measuring enzyme activities in single mycorrhizal tips using 4-methylumbelliferone-labelled fluorogenic substrates in a microplate system. J. Microbiol. Methods 2004, 58, 233–241. [Google Scholar] [CrossRef] [PubMed]
  41. Turner, B.L. Variation in pH optima of hydrolytic enzyme activities in tropical rain forest soils. Appl. Environ. Microbiol. 2010, 76, 6485–6493. [Google Scholar] [CrossRef] [PubMed] [Green Version]
  42. Sanaullah, M.; Razavi, B.S.; Blagodatskaya, E.; Kuzyakov, Y. Spatial distribution and catalytic mechanisms of β-glucosidase activity at the root-soil interface. Biol. Fertil. Soils 2016, 52, 505–514. [Google Scholar] [CrossRef]
  43. Martin, J.P. Use of acid, rose bengal, and streptomycin in the plate method for estimating soil fungi. Soil Sci. 1950, 69, 215–232. [Google Scholar] [CrossRef]
  44. Gardes, M.; Bruns, T.D. ITS primers with enhanced specificity for basidiomycetes-application to the identification of mycorrhizae and rusts. Mol. Ecol. 1993, 2, 113–118. [Google Scholar] [CrossRef] [PubMed]
  45. White, T.J.; Bruns, T.; Lee, S.J.W.T.; Taylor, J. Amplification and direct sequencing of fungal ribosomal RNA genes for phylogenetics. PCR Protoc. Guide Methods Appl. 1990, 18, 315–322. [Google Scholar]
  46. Glass, N.L.; Donaldson, G.C. Development of primer sets designed for use with the PCR to amplify conserved genes from filamentous ascomycetes. Appl. Environ. Microbiol. 1995, 61, 1323–1330. [Google Scholar] [CrossRef] [Green Version]
  47. Carbone, I.; Kohn, L.M. A method for designing primer sets for speciation studies in filamentous ascomycetes. Mycologia 1999, 91, 553–556. [Google Scholar] [CrossRef]
  48. Kullnig-Gradinger, C.M.; Szakacs, G.; Kubicek, C.P. Phylogeny and evolution of the genus Trichoderma: A multigene approach. Mycol. Res. 2002, 106, 757–767. [Google Scholar] [CrossRef]
  49. Vu, D.; Groenewald, M.; De Vries, M.; Gehrmann, T.; Stielow, B.; Eberhardt, U.; Al-Hatmi, A.; Groenewald, J.; Cardinali, G.; Houbraken, J.; et al. Large-scale generation and analysis of filamentous fungal DNA barcodes boosts coverage for kingdom fungi and reveals thresholds for fungal species and higher taxon delimitation. Stud. Mycol. 2019, 92, 135–154. [Google Scholar] [CrossRef]
  50. Du, W.; Yao, Z.; Li, J.; Sun, C.; Xia, J.; Wang, B.; Shi, D.; Ren, L. Diversity and antimicrobial activity of endophytic fungi isolated from Securinega suffruticosa in the Yellow River Delta. PLoS ONE 2020, 15, e0229589. [Google Scholar] [CrossRef] [PubMed]
  51. Magurran, A.E. Biological Diversity and Woodland Management: An Investigation with Special Reference to Banagher, Co. Derry, N. Ireland. Doctoral Dissertation, New University of Ulster, Ulster, Ireland, 1981. [Google Scholar]
  52. Klindworth, A.; Pruesse, E.; Schweer, T.; Peplies, J.; Quast, C.; Horn, M.; Glöckner, F.O. Evaluation of general 16S ribosomal RNA gene PCR primers for classical and next-generation sequencing-based diversity studies. Nucleic Acids Res. 2013, 41, e1. [Google Scholar] [CrossRef]
  53. Liu, C.; Cui, Y.; Li, X.; Yao, M. microeco: An R package for data mining in microbial community ecology. FEMS Microbiol. Ecol. 2021, 97, fiaa255. [Google Scholar] [CrossRef]
  54. Kolde, R. Pheatmap: Pretty Heatmaps. R Package Version 1.0.10. 2018. Available online: https://CRAN.R-project.org/package=pheatmap (accessed on 7 September 2021).
  55. Nguyen, N.H.; Song, Z.; Bates, S.T.; Branco, S.; Tedersoo, L.; Menke, J.; Schilling, J.S.; Kennedy, P.G. FUNGuild: An open annotation tool for parsing fungal community datasets by ecological guild. Fungal Ecol. 2016, 20, 241–248. [Google Scholar] [CrossRef]
  56. Everrit, B. Cluster Analysis; Halstead Press: New York, NY, USA, 1980; p. 11. [Google Scholar]
  57. Juriga, M.; Šimanský, V. Effect of biochar on soil structure—Review. Acta Fytotech. Zootech. 2018, 21, 11–19. [Google Scholar] [CrossRef]
  58. Oguntunde, P.G.; Abiodun, B.J.; Ajayi, A.E.; van de Giesen, N. Effects of charcoal production on soil physical properties in Ghana. J. Plant Nutr. Soil Sci. 2008, 171, 591–596. [Google Scholar] [CrossRef]
  59. Ding, Y.; Liu, Y.; Liu, S.; Li, Z.; Tan, X.; Huang, X.; Zeng, G.; Zhou, L.; Zheng, B. Biochar to improve soil fertility: A review. Agron. Sustain. Dev. 2016, 36, 36. [Google Scholar] [CrossRef] [Green Version]
  60. Adekiya, A.O.; Agbede, T.M.; Olayanju, A.; Ejue, W.S.; Adekanye, T.A.; Adenusi, T.T.; Ayeni, J.F. Effect of biochar on soil properties, soil loss, and cocoyam yield on a tropical sandy loam Alfisol. Sci. World J. 2020, 2020, 9391630. [Google Scholar] [CrossRef]
  61. Rajkovich, S.; Enders, A.; Hanley, K.; Hyland, C.; Zimmerman, A.R.; Lehmann, J. Corn growth and nitrogen nutrition after additions of biochars with varying properties to a temperate soil. Biol. Fertil. Soils 2012, 48, 271–284. [Google Scholar] [CrossRef]
  62. Mastrolonardo, G.; Calderaro, C.; Cocozza, C.; Hardy, B.; Dufey, J.; Cornelis, J.T. Long-term effect of charcoal accumulation in hearth soils on tree growth and nutrient cycling. Front. Environ. Sci. 2019, 7, 51. [Google Scholar] [CrossRef]
  63. Lustosa Carvalho, M.; Tuzzin de Moraes, M.; Cerri, C.E.P.; Cherubin, M.R. Biochar amendment enhances water retention in a tropical sandy soil. Agriculture 2020, 10, 62. [Google Scholar] [CrossRef] [Green Version]
  64. Krąpiec, M. The Results of the Dendrological Analysis of the Charred Wood Sample—Expertise; Office of Forest Management and Geodesy, Department in Szczecinek: Szczecinek, Poland, 2016. [Google Scholar]
  65. Angst, T.E.; Sohi, S.P. Establishing release dynamics for plant nutrients from biochar. Gcb Bioenergy 2013, 5, 221–226. [Google Scholar] [CrossRef]
  66. Hardy, B.; Sleutel, S.; Dufey, J.E.; Cornelis, J.T. The long-term effect of biochar on soil microbial abundance, activity and community structure is overwritten by land management. Front. Environ. Sci. 2019, 7, 110. [Google Scholar] [CrossRef] [Green Version]
  67. Wardle, D.A.; Nilsson, M.C.; Zackrisson, O. Fire-derived charcoal causes loss of forest humus. Science 2008, 320, 629. [Google Scholar] [CrossRef] [PubMed]
  68. Domene, X.; Mattana, S.; Hanley, K.; Enders, A.; Lehmann, J. Medium-term effects of corn biochar addition on soil biota activities and functions in a temperate soil cropped to corn. Soil Biol. Biochem. 2014, 72, 152–162. [Google Scholar] [CrossRef] [Green Version]
  69. Kwaśna, H.; Łakomy, P.; Gornowicz, R.; Borowczyk-Behnke, J.; Kuźmiński, R. Wpływ sposobu przygotowania gleby na aktywność biologiczną gleby względem patogenów korzeni w 40− letnim drzewostanie sosnowym. Sylwan 2015, 159, 117–125. [Google Scholar]
  70. Kwasna, H.; Lakomy, P.; Gornowicz, R.; Mikicinski, A.; Borowczyk-Behnke, J.; Galazka, S. Struktura zbiorowisk grzybów i bakterii w glebie 1-rocznej uprawy i 10-letniego młodnika w zależności od sposobu przygotowania gleby. Sylwan 2015, 159, 71–81. [Google Scholar]
  71. Kwaśna, H.; Walkowiak, L.; Łakomy, P.; Behnke-Borowczyk, J.; Gornowicz, R.; Mikiciński, A.; Gałązka, S.; Szewczyk, W. Effects of silvicultural techniques on the diversity of microorganisms in forest soil and their possible participation in biological control of Armillaria and Heterobasidion. J. Plant Prot. Res. 2015, 55, 241–253. [Google Scholar] [CrossRef]
  72. Malecka, M.; Kwasna, H.; Szewczyk, W. Fungal communities in barren forest soil after amendment with different wood substrates and their possible effects on trees’, pathogens, insects and nematodes. J. Plant Prot. Res. 2015, 55, 301–311. [Google Scholar] [CrossRef]
  73. Behnke-Borowczyk, J.; Kwasna, H. Wpływ metodyki badań na ocenę struktury zbiorowisk mikroorganizmów w glebie leśnej. Sylwan 2016, 160, 492–503. [Google Scholar]
  74. Santalahti, M.; Sun, H.; Jumpponen, A.; Pennanen, T.; Heinonsalo, J. Vertical and seasonal dynamics of fungal communities in boreal Scots pine forest soil. FEMS Microbiol. Ecol. 2016, 92, fiw170. [Google Scholar] [CrossRef] [Green Version]
  75. Castaño, C.; Lindahl, B.D.; Alday, J.G.; Hagenbo, A.; Martínez de Aragón, J.; Parladé, J.; Pera, J.; Bonet, J.A. Soil microclimate changes affect soil fungal communities in a Mediterranean pine forest. New Phytol. 2018, 220, 1211–1221. [Google Scholar] [CrossRef] [Green Version]
  76. Buee, M.; Reich, M.; Murat, C.; Morin, E.; Nilsson, R.H.; Uroz, S.; Martin, F. 454 Pyrosequencing analyses of forest soils reveal an unexpectedly high fungal diversity. New Phytol. 2009, 184, 449–456. [Google Scholar] [CrossRef]
  77. Yurkov, A.M.; Kemler, M.; Begerow, D. Assessment of yeast diversity in soils under different management regimes. Fungal Ecol. 2012, 5, 24–35. [Google Scholar] [CrossRef]
  78. Mašínová, T.; Bahnmann, B.D.; Větrovský, T.; Tomšovský, M.; Merunková, K.; Baldrian, P. Drivers of yeast community composition in the litter and soil of a temperate forest. FEMS Microbiol. Ecol. 2017, 93, fiw223. [Google Scholar] [CrossRef]
  79. López-Mondéjar, R.; Voříšková, J.; Větrovský, T.; Baldrian, P. The bacterial community inhabiting temperate deciduous forests is vertically stratified and undergoes seasonal dynamics. Soil Biol. Biochem. 2015, 87, 43–50. [Google Scholar] [CrossRef]
  80. Uroz, S.; Ioannidis, P.; Lengelle, J.; Cébron, A.; Morin, E.; Buee, M.; Martin, F. Functional assays and metagenomic analyses reveals differences between the microbial communities inhabiting the soil horizons of a Norway spruce plantation. PLoS ONE 2013, 8, e55929. [Google Scholar] [CrossRef]
  81. Eilers, K.G.; Lauber, C.L.; Knight, R.; Fierer, N. Shifts in bacterial community structure associated with inputs of low molecular weight carbon compounds to soil. Soil Biol. Biochem. 2010, 42, 896–903. [Google Scholar] [CrossRef]
  82. Bolhuis, H.; Cretoiu, M.S.; Stal, L.J. Molecular ecology of microbial mats. FEMS Microbiol. Ecol. 2014, 90, 335–350. [Google Scholar]
  83. Wei, H.; Peng, C.; Yang, B.; Song, H.; Li, Q.; Jiang, L.; Wei, G.; Wang, K.; Wang, H.; Liu, S.; et al. Contrasting soil bacterial community, diversity, and function in two forests in China. Front. Microbiol. 2018, 9, 1693. [Google Scholar] [CrossRef] [PubMed]
  84. Prayogo, C.; Jones, J.E.; Baeyens, J.; Bending, G.D. Impact of biochar on mineralisation of C and N from soil and willow litter and its relationship with microbial community biomass and structure. Biol. Fertil. Soils 2014, 50, 695–702. [Google Scholar] [CrossRef]
  85. Jin, H. Characterization of Microbial Life Colonizing Biochar and Biocharamended Soils. Ph.D. Thesis, Cornell University, Ithaca, NY, USA, 2010. [Google Scholar]
  86. Taketani, R.G.; Tsai, S.M. The influence of different land uses on the structure of archaeal communities in Amazonian anthrosols based on 16S rRNA and amoA genes. Microb. Ecol. 2010, 59, 734–743. [Google Scholar] [CrossRef]
Figure 1. Localization of study plots in Manowo Forest District, northern Poland (black point-relict charcoal hearths localization; red point–study plots localization).
Forests 12 01488 g001
Figure 2. Soil profile with charcoal (a) and soil profile without charcoal (b).
Forests 12 01488 g002
Figure 3. Difference in soil properties between charcoal hearth horizon (RCH) samples and control (∆C–carbon content (%); ∆P–phosphorus content (mg·kg−1); ∆BC–base cations content (cmol(+)·kg−1); ∆Mw–soil moisture in percent by weight (%); observations number of RCH).
Forests 12 01488 g003
Figure 4. Enzymatic activity [nM MUB·g d.m.·h−1] of soil from charcoal hearth horizon (RCH) and control soil; CB-β-D-cellobiosidase, XYL–β-xylosidase, NAG-N-acetyl-β-D-glucosaminidase, BG-β-glucosidase, PH-phosphatase and SP–arylosulphatase; letters (a, b)–significant differences between variants of study plots.
Forests 12 01488 g004
Figure 5. Cluster analysis grouping the soil from the charcoal hearth horizon (RCH) and control soil (C); chemical properties (carbon, nitrogen and phosphorus content) were used in the design of the diagram.
Forests 12 01488 g005
Figure 6. Relative abundance of 10 most common fungal genera (a), ITS metabarcoding (b) and 10 most common bacterial phyla in 16S metabarcoding (c). The Venn diagrams above the bar charts indicate fungal species and bacterial genera unique to and shared between charcoal-enriched and control samples, starting from the top: numbers of species/genera in each group, proportions of the overall number of species/genera in each group (in round brackets), and proportions of colony forming units or ITS/16S sequences belonging to species/genera in each group (in square brackets). Please note the higher diversity of fungi in charcoal-enriched samples (high number/proportion of unique species, more diverse composition of most common genera) and lack of such a clear effect for bacteria.
Forests 12 01488 g006
Figure 7. Heatmaps constructed based on log10 + 1 transformed abundance data on the occurrence of culturable fungi (a) and on the most frequent fungal species (b) and bacterial genera (c) generated in Illumina metabarcoding analysis. Minimum number of reads for ITS sequences was 350 and for 16S sequences it was 80. Please note consistent clustering of RCH samples (gray) against the control sample (green) in all three datasets.
Forests 12 01488 g007
Table 1. C and N content and acidity of the examined soil profiles.
ProfileHorizonColor (Moist)Description of HorizonsNCC/NpH H2OpH KClHw
RCH 10–102.5YR/2.5/2F, ++0.9835.31363.592.6520.86
10–355YR/2.5/1SB, +++0.096.9475.94.233.664.42
35–455YR/5/1SB, +0.020.8836.34.64.371.92
45–605YR/5/8SG0.030.5820.84.714.651.57
>605YR/7/2SG0.010.1110.84.84.720.84
RCH 20–102.5YR/2.5/2F, ++0.9833.9534.73.482.5914.32
10–3210YR/2/1SB, +++0.063.6156.14.383.813.07
32–4710YR/6/1SB, +0.020.6632.84.544.341.8
47–907.5YR/5/6SG0.010.1714.34.554.611.19
RCH 30–122.5YR/2.5/2F, ++0.6618.6628.33.542.6611.4
12–307.5YR/3/1SB, +++0.073.553.84.33.743.28
30–387.5YR/5/2SB, +0.020.4627.84.714.191.91
38–807.5YR/6/6SG0.010.1313.94.534.511.19
RCH 40–42.5YR/2.5/2F, ++1.4437.8426.44.023.118.34
4–277.5YR/2.5/1SB, +++0.093.4538.24.473.824.49
27–407.5YR/4/2SB, +0.040.9124.24.824.262.27
40–805YR/5/6SG0.020.7429.85.474.41.49
RCH 50–122.5YR/2.5/2F, ++0.620.7734.73.512.6711.58
12–357.5YR/2.5/1SB, +++0.099.21105.74.263.595.69
35–457.5YR/6/2SB, +0.030.7327.44.614.212.29
45–807.5YR/5/6SG0.010.1310.74.634.591.4
Control0–102.5YR/2.5/2F, ++1.2141.1334.13.572.6521.62
10–255YR/7/1SG, +0.071.7623.63.733.194.45
25–505YR/5/8SB, +0.050.9620.74.714.611.97
>505YR/7/2SG0.010.089.854.80.67
Types of soil structure: F-fibers, SG—single grain, SB—subangular blocky; roots abundance: + >25% of horizon volume, ++ 25–50 of horizon volume, +++ 50–75% of horizon volume; C—organic carbon (%), N—total nitrogen (%); Hw–exchangeable acidity (cmol(+)·kg−1).
Table 2. Base cations content and microelements content in the examined soil profiles.
ProfileHorizonCaKMgNaPCdCoCrCuFeMnNiPbZn
RCH 10–103.2580.7940.8560.24881.760.410.7721.7510.34353839.516.135.7225.27
10–350.0610.0260.0240.019126.980.110.7315.713.236043.554.067.9816.9821.06
35–450.0090.0100.0050.00382.180.020.324.501.615822.538.880.618.577.44
45–600.0070.0090.0040.00270.560.011.16.282.0810,052.545.42.8124.8314.79
>600.0080.0020.0020.00096.320.010.863.131.73564538.951.4611.228.08
RCH 20–101.2450.5910.6420.24161.740.381.1728.539.47497874.2320.3846.7822.21
10–320.0650.0130.0140.01799.960.151.2214.223.53868472.248.9816.419.66
32–470.0080.0040.0030.00259.920.030.553.741.947072.567.351.2818.658.62
47–900.0050.0000.0020.001115.920.021.414.132.06896057.832.7714.5310.68
RCH 30–120.5590.4390.6320.13362.650.151.1834.569.09517334.7124.4541.3124.44
12–300.0380.0190.0180.013109.760.10.8313.063.4708137.658.6113.1413.81
30–380.0070.0000.0050.00275.320.060.271.721.595247.525.380.7913.244.63
38–800.0060.0050.0030.00166.220.051.234.152.14855546.922.614.2910.48
RCH 40–47.1811.1182.1490.174170.520.311.1524.818.955087504.718.540.5926.02
4–270.0960.0370.0360.01749.560.111.4917.703.8311,0053259.3522.4722.17
27–400.0550.010.0140.00970.980.021.555.862.4613,155456.282.7629.3420.26
40–800.2980.0120.0970.01251.520.010.655.141.977957.583.631.8519.679.1
RCH 50–121.8300.3900.7760.12155.930.330.9725.068.54516963.0317.3835.721.73
12–350.1890.0420.0410.034112.140.150.9413.324.407158.5156.48.4816.0823.26
35–450.0120.0070.0050.00369.30.010.654.421.718252.582.881.4119.929.07
45–800.0200.0100.010.010123.480.011.947.372.8311,78577.554.7821.4811.87
Control0–101.1811.0081.170.373110.040.740.8123.479.95247652.6917.8936.1347.75
10–250.0040.0140.0290.00820.230.070.256.153.23381637.762.8917.325.18
25–500.0050.0050.0050.00353.340.020.8924.242.18984040.772.3525.3916.53
>500.0060.0000.0010.00071.40.011.0314.071.905112.539.482.0410.158.65
Ca, K, Mg and Na (cmol(+)·kg−1); P, Cd, Co, Cr, Cu, Fe, Mn, Ni, Pb and Zn (mg·kg−1).
Table 3. C, N and P content and acidity of charcoal hearth horizon (RCH) and control soil (experiment 2).
CNC/NpH H2OpH KClHwP
RCH4.66 ± 1.50 a0.14 ± 0.03 a33.06 ± 7.81 a3.85 ± 0.19 a3.50 ± 0.28 a3.87 ± 0.97 a64.07 ± 14.33 a
Control2.19 ± 0.97 b0.13 ± 0.02 a16.33 ± 4.94 b3.64 ± 0.13 b3.32 ± 0.22 b4.00 ± 0.59 a36.21 ± 17.39 b
Mean ± standard deviation; C–organic carbon (%), N–total nitrogen (%), Hw–exchangeable acidity (cmol(+)·kg−1), P content (mg·kg−1); small superscript letters––significant differences between variants of study plots.
Table 4. Base cations content and microelements content in the charcoal hearth horizon (RCH) and control soil (experiment 2).
CaMgKNaCdCoCrCuFeMnNiPbZn
RCH0.07 ± 0.03 a0.03 ± 0.01 a0.04 ± 0.02 a0.03 ± 0.01 a0.14 ± 0.03 a0.68 ± 0.22 a5.84 ± 1.74 a1.57 ± 0.61 a3513.4 ± 420.0 b65.41 ± 22.33 a2.48 ± 0.73 a13.05 ± 3.72 b13.25 ± 3.16 a
Control0.03 ± 0.03 b0.04 ± 0.01 a0.03 ± 0.01 a0.02 ± 0.01 b0.07 ± 0.03 b0.61 ± 0.55 b6.23 ± 3.08 a1.44 ± 0.71 a3994.7 ± 868.6 a52.47 ± 13.17 b2.16 ± 1.21 b18.90 ± 4.40 a7.68 ± 2.24 b
Mean ± standard deviation; Ca, K, Mg and Na (cmol(+)·kg−1); Cd, Co, Cr, Cu, Fe, Mn, Ni, Pb and Zn (mg·kg−1); small superscript letters––significant differences between variants of study plots.
Table 5. Multiple regression analysis for enzyme activity based on properties of soil from charcoal hearth horizon (RCH) (experiment 2).
R2Equation Parameterβp
CB0.83C2.6870.0000
N−41.0840.0000
BG0.84C1.6560.0000
N−31.1280.0052
BC30.0000.0053
NAG0.79C1.4660.0003
P0.0650.0195
XYL0.57BC11.8060.0000
SP0.46C0.3390.0000
PH0.88C9.5680.0000
pH−1.9880.0374
Significance effect (p < 0.05) are shown in bold, R2 describes the percentage of explained variance, β is the regression coefficient for given equation parameter and p is the significance level for the equation parameter; CB-β-D-cellobiosidase, XYL-β-xylosidase, NAG-N-acetyl-β-D-glucosaminidase, BG-β-glucosidase, PH-phosphatase and SP-arylosulphatase; BC-base cations content.
Table 6. Properties of leachate from charcoal hearth horizon (RCH) and control soil (experiment 2).
DOCICTNNH4+NO2NO3Ca2+Mg2+K+Na+SO4PO4Cl
mg·L−1
RCH4.80 ± 1.28 b0.73 ± 0.13 a1.72 ± 0.27 a0.89 ± 0.14 a1.08 ± 0.81 a2.33 ± 3.07 a1.75 ± 0.75 a0.20 ± 0.13 a0.54 ± 0.66 a0.85 ± 0.99 a3.64 ± 1.52 a0.83 ± 0.96 a2.50 ± 0.64 a
Control5.91 ± 1.29 a0.70 ± 0.09 a1.78 ± 0.22 a0.94 ± 0.27 a1.47 ± 1.16 a1.69 ± 1.96 a2.23 ± 1.55 a0.20 ± 0.15 a0.72 ± 0.89 a1.07 ± 1,07 a4.20 ± 2.08 a1.53 ± 3.35 a2.46 ± 0.73 a
Mean ± standard deviation; DOC-dissolved organic carbon, IC-inorganic carbon, TN-total nitrogen; small superscript letters––significant differences between variants of study plots.
Table 7. The dominance (Y) values of culturable fungal genera from relict charcoal hearths (RCH) soil and control soil.
Genus *Relict Charcoal Hearths SoilControl SoilTotal
RCH1RCH2RCH3RCH4RCH5C1C2C3
Absidia///0.0264/0.08650.0008/0.0044
Aspergillus0.0149/0.02640.16521.1687///0.0304
Geomyces//0.0066/0.0263///0.0006
Humicolopsis0.01490.01280.0066//0.00540.0008/0.0023
Infundichalara0.00370.2043/0.02640.0263///0.0071
Leptobacillium////0.0263///0.0003
Metapochonia/0.0128//0.0029///0.0003
Mortierella0.37180.07982.91492.91492.99205.19572.69839.40443.2504
Mucor/0.0032///0.00140.00080.02780.0023
Oberwinklerozyma/////0.0122//0.0003
Oidiodendron0.37180.62566.35202.14160.00290.0662//0.2370
Penicillium38.682323.607511.11111.910223.143918.187730.935414.187820.6959
Pseudogymnoascus///0.0264//0.0008/0.0003
Sagenomella0.37180.20430.42300.10580.0117/0.0008/0.0393
Saitozyma//0.1058/0.0029///0.0009
Tolypocladium0.13380.20430.05950.00660.74800.71501.19921.60440.6388
Trichoderma1.34220.81710.42301.69210.35352.27210.90441.28441.1443
Umbelopsis/1.4076/4.8186/0.03380.36630.32110.2991
* Genera that occurred only as a single CFU were omitted.
Table 8. Microbial diversity analysis based on culturable fungi and ITS and16S rDNA next generation sequencing from relict charcoal hearths (RCH) soil and control soil.
Sample No.Shannon–Wiener Index (H′) Simpson Diversity Index (Ds) Dominant Index (λ) PIE Index (PIE)Pielou Index (J)Margalef Index (D′)Species Richness (S)
RCH1:
CFU0.71970.65050.34950.63000.56288.127019
ITS1.15200.79650.20350.79650.492244.0313218
16S1.48500.94490.05510.94490.686132.4700146
RCH21.21380.90250.09750.90760.799314.235033
RCH31.21870.90450.09550.94470.871811.483825
RCH41.18840.89850.10150.90590.804513.876230
RCH5
CFU1.04150.84460.15540.84920.736111.027026
ITS1.21800.86800.13200.86800.512547.4820238
16S1.35200.90360.09640.90370.621334.7010150
C1
CFU0.98100.85330.14670.85650.73488.625822
ITS0.83590.70040.29960.70040.384129.9770150
16S1.43700.94240.05760.94250.702626.0320111
C20.98640.86930.13070.87180.77147.085719
C30.95730.85220.14770.83830.74867.266519
Publisher’s Note: MDPI stays neutral with regard to jurisdictional claims in published maps and institutional affiliations.

