Changes in Soil Physical and Chemical Properties during Vegetation Succession on Miyake-jima Island


Abstract
1. Introduction
2. Materials and Methods
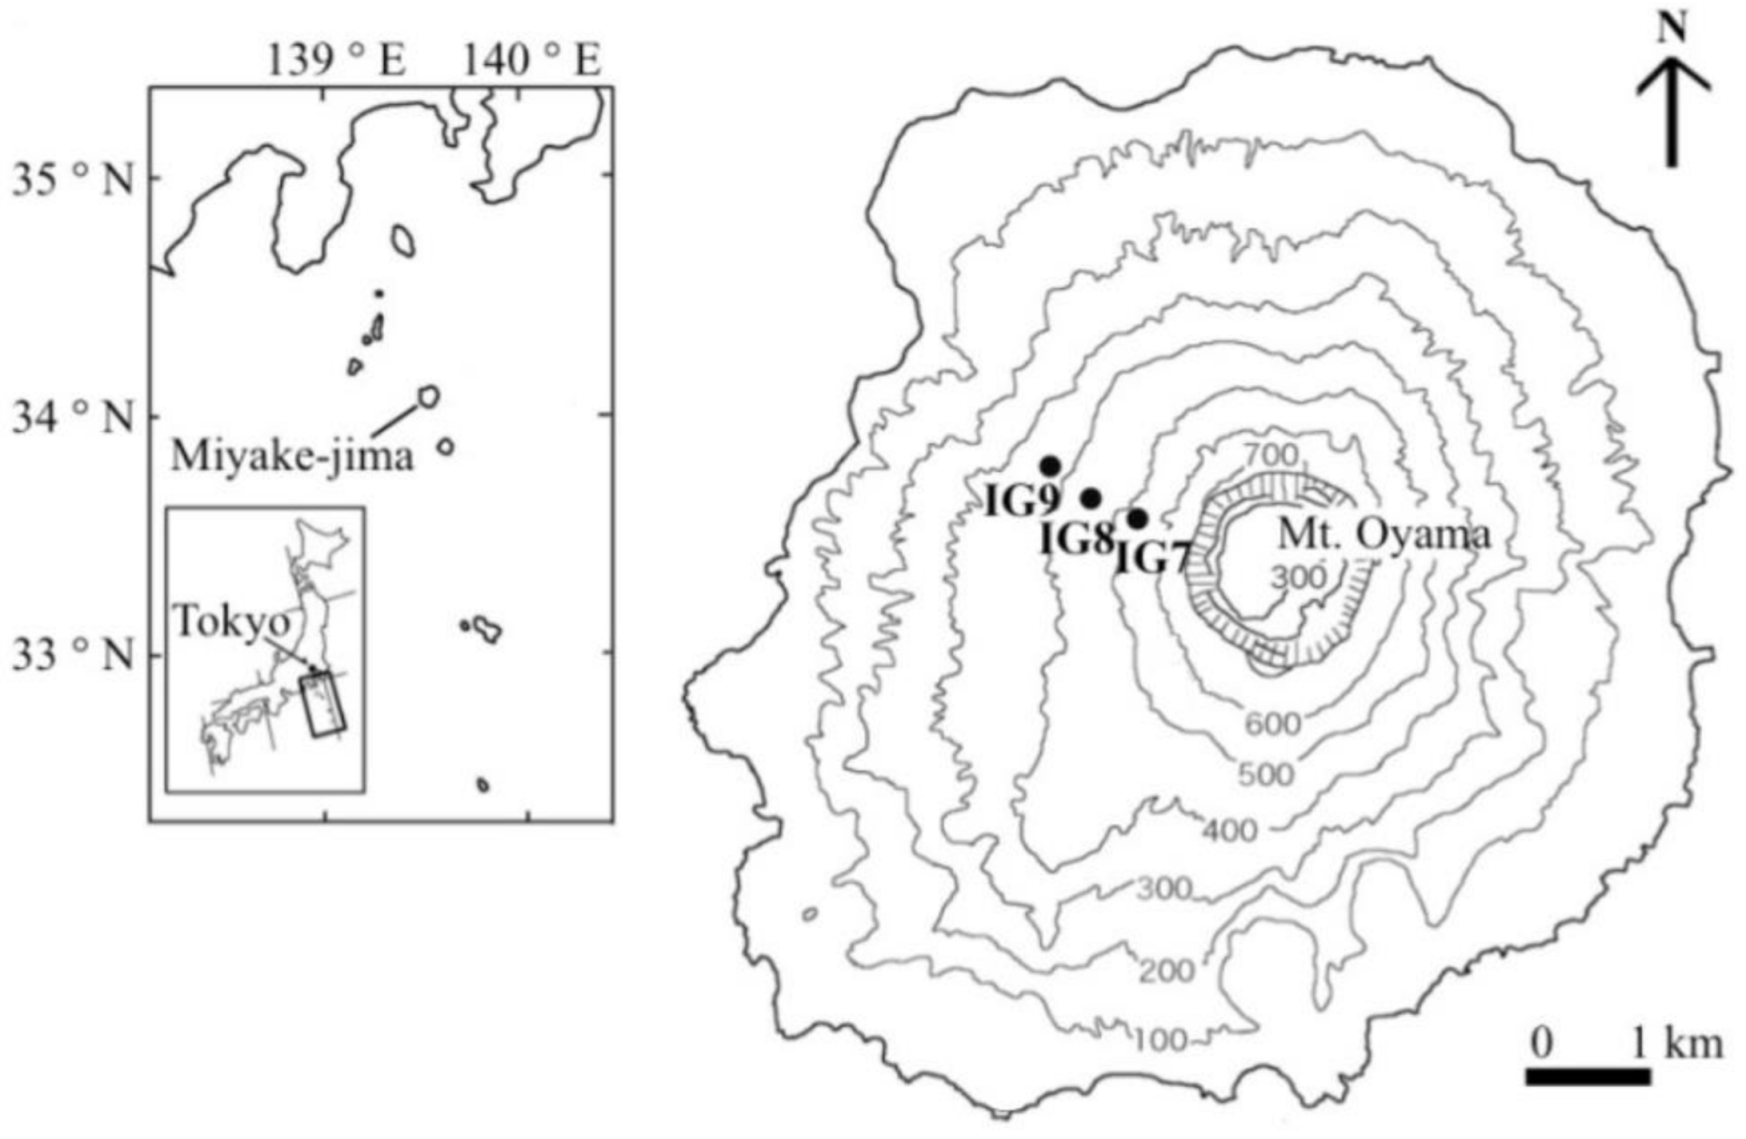
2.1. Study Site
2.2. Soil Sampling
2.3. Laboratory Procedures
2.4. Evaluation of Soil Quality Index
3. Results
3.1. Morphological Features of the Soil Profiles
3.2. Three-Phase Distribution and Hydraulic Conductivity of the Soil Core Samples
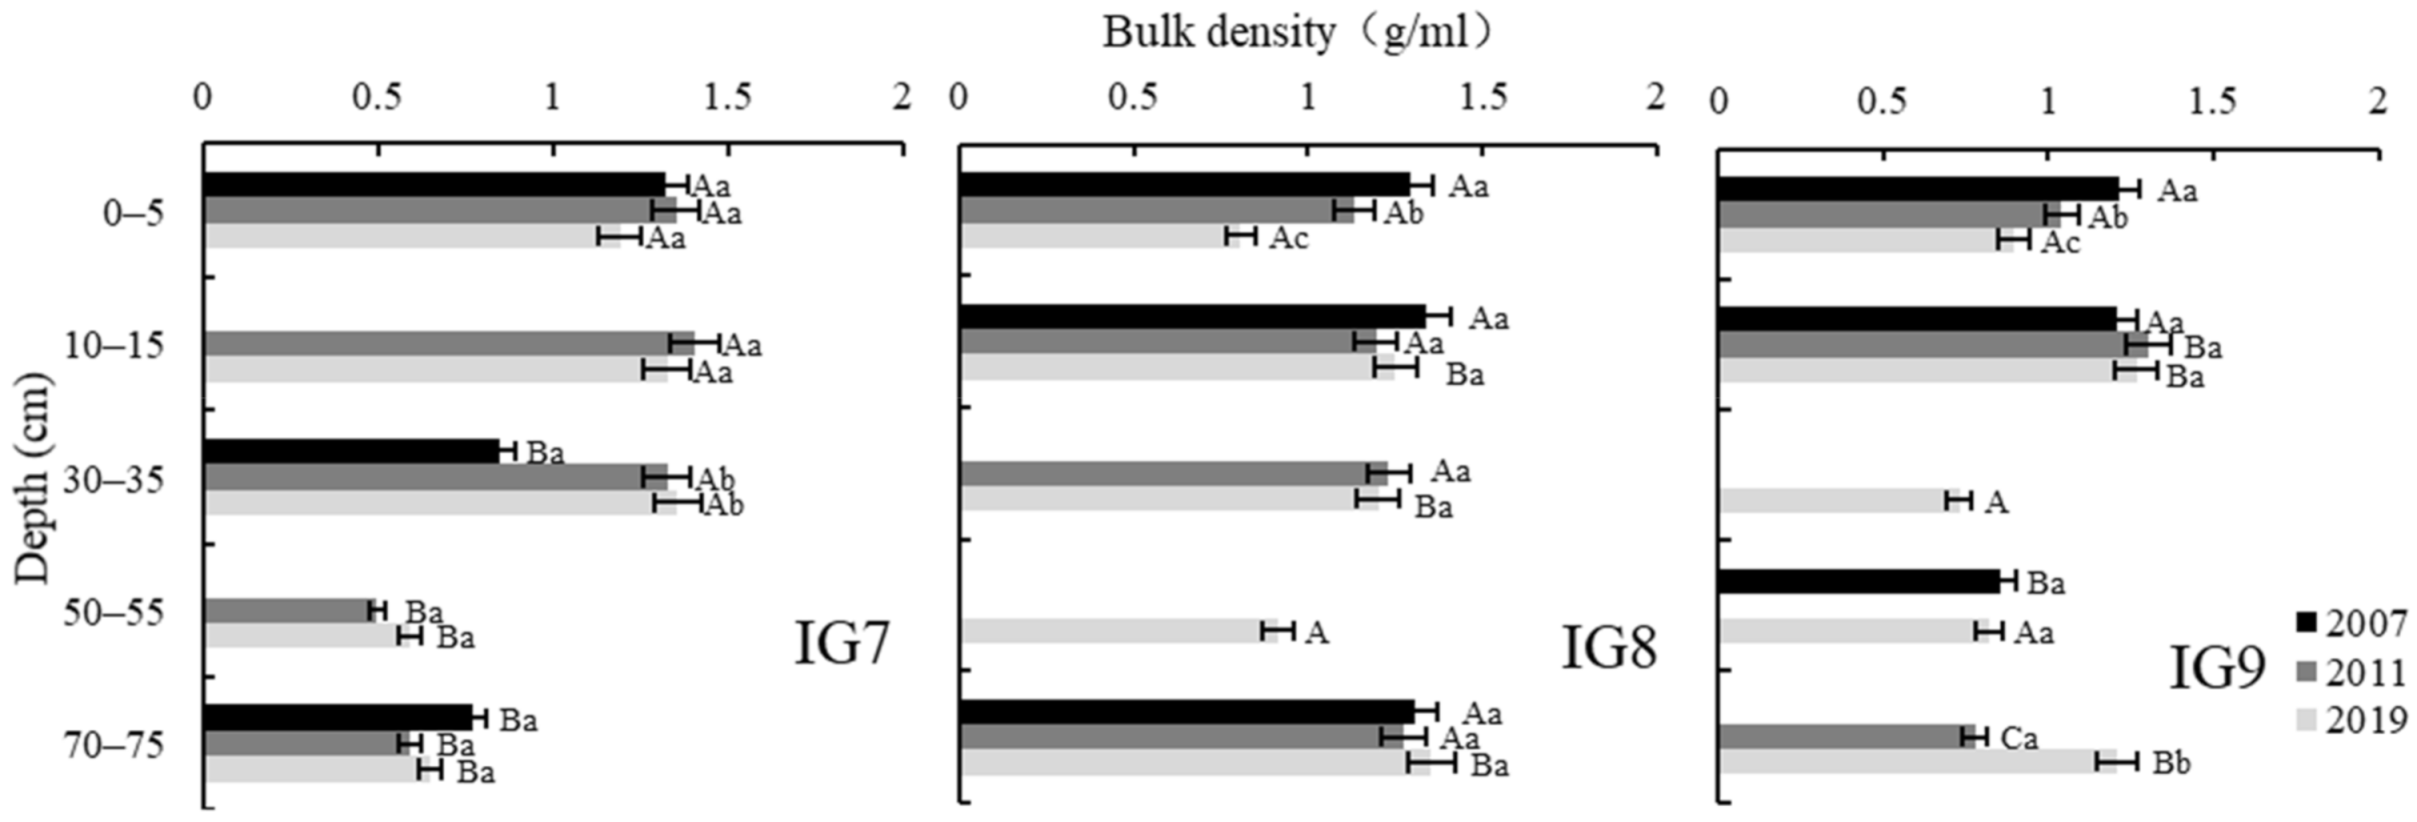
3.3. Bulk Density
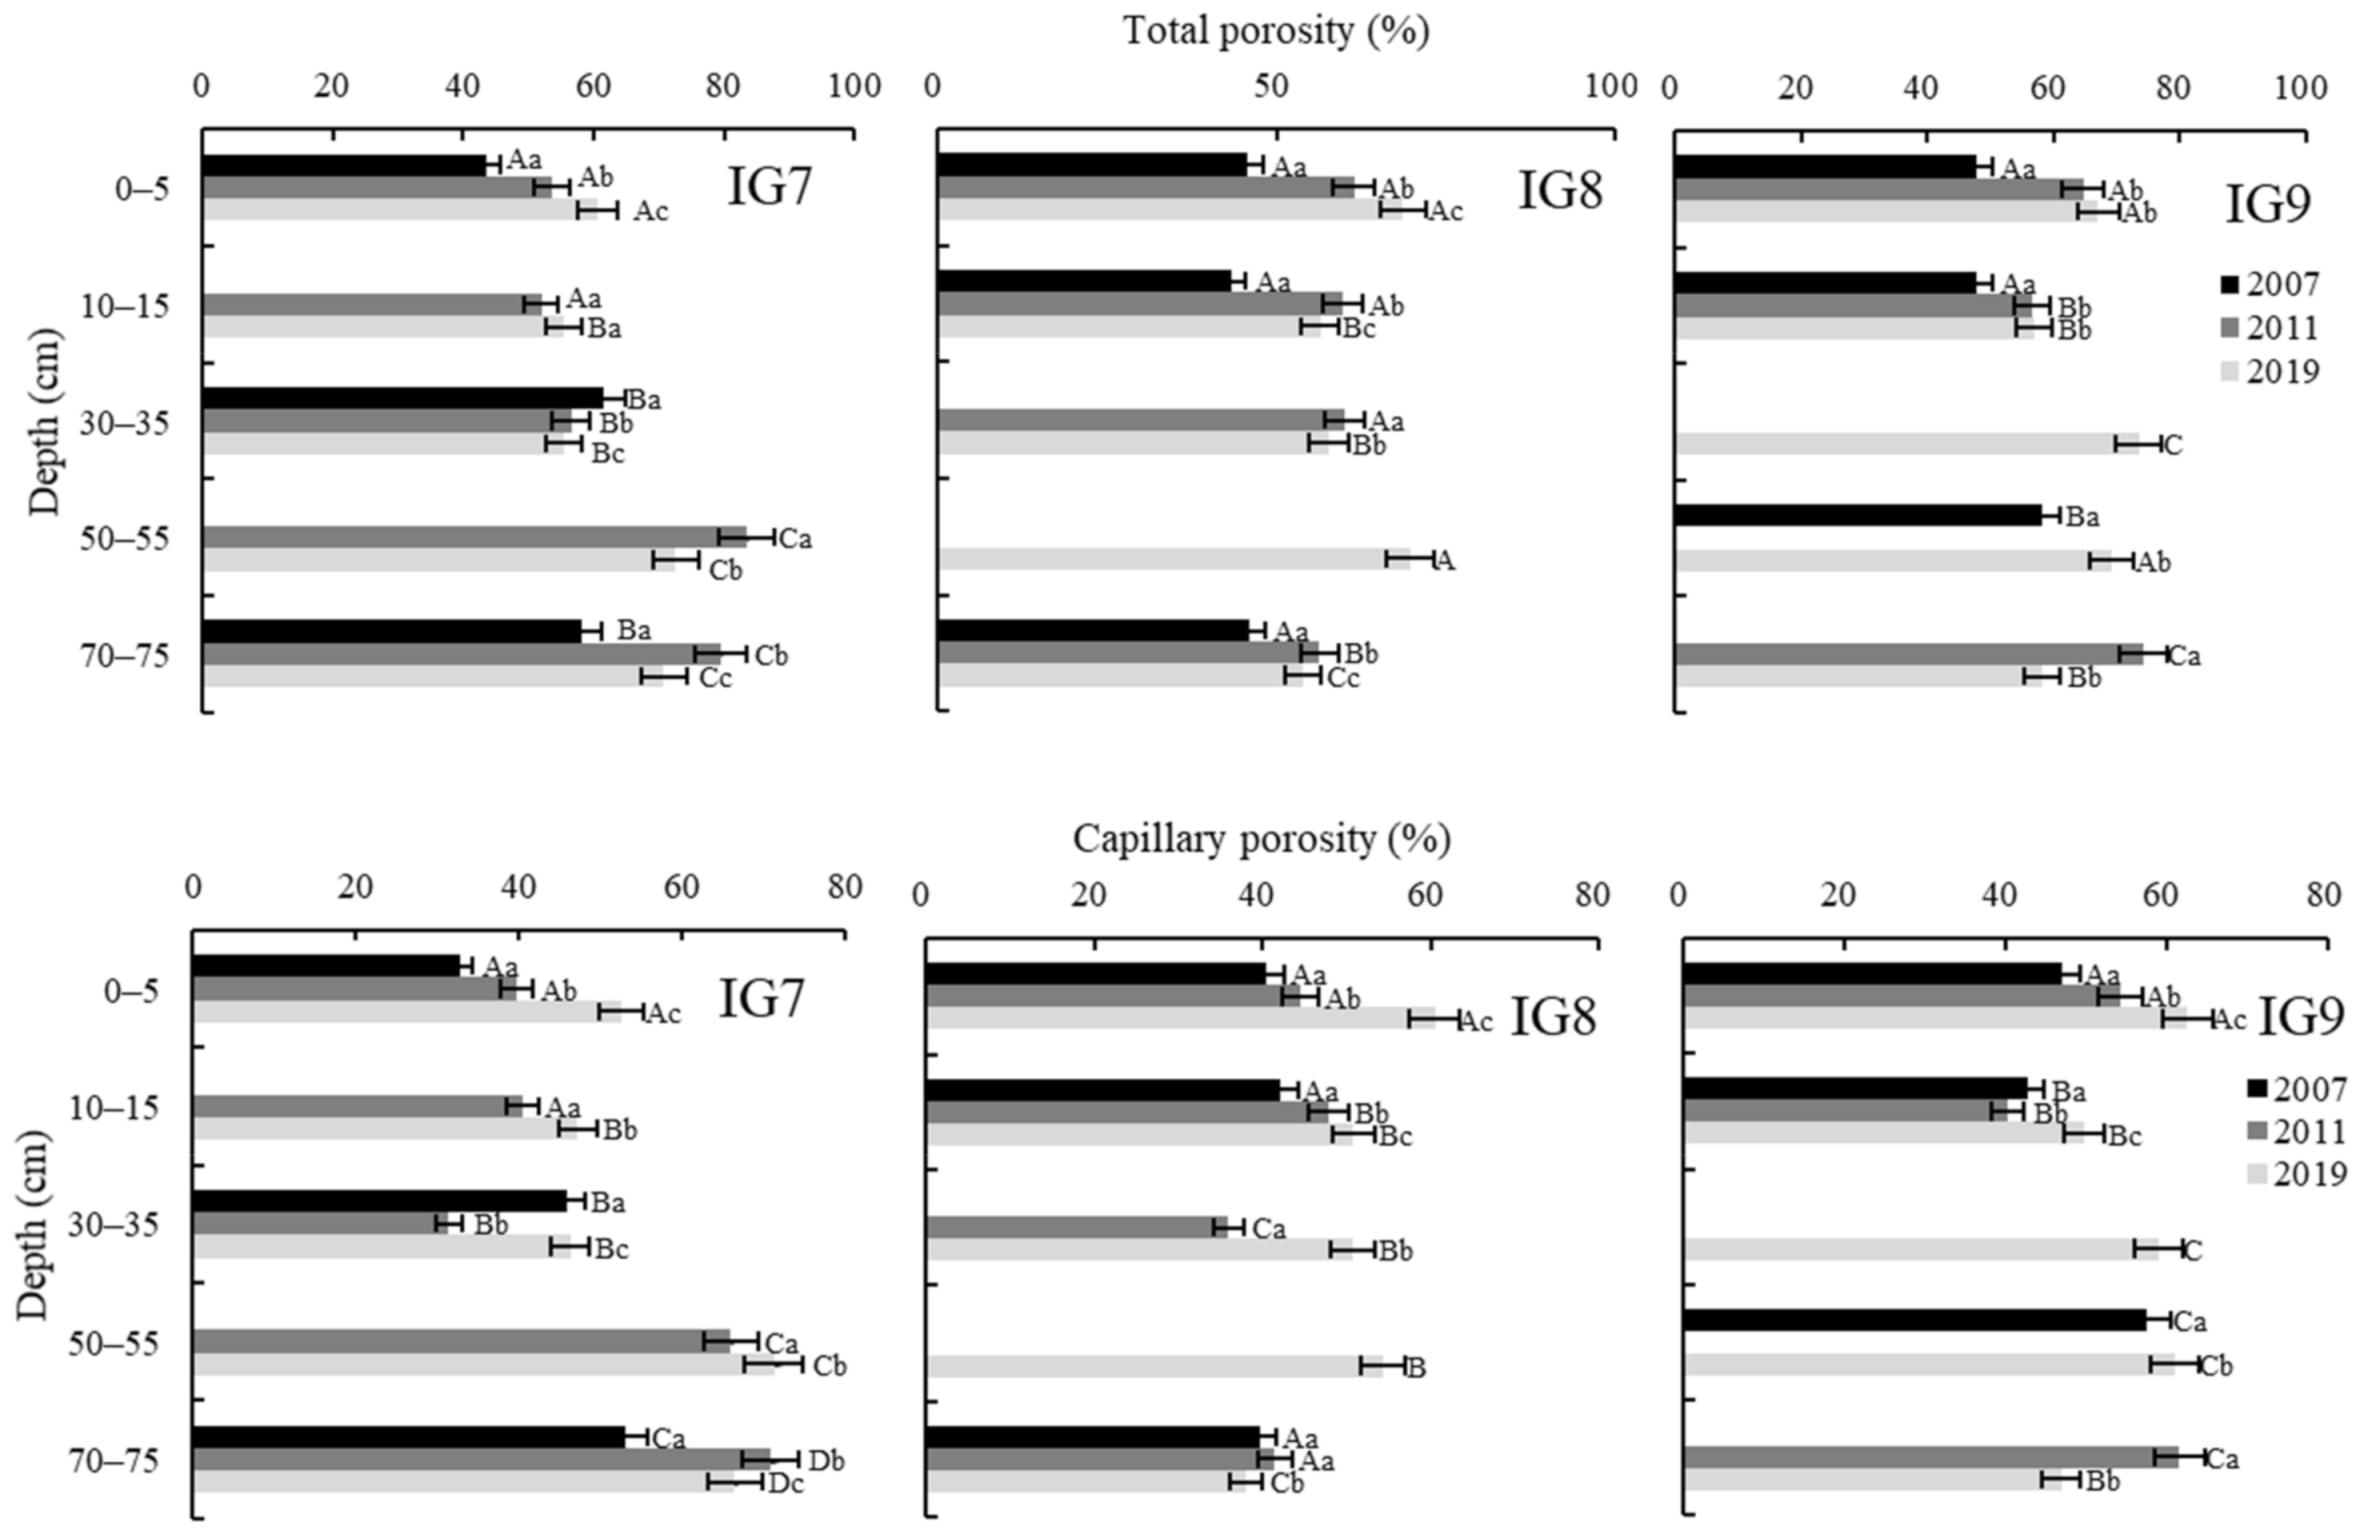
3.4. Soil Porosity
3.5. pH and Cation Exchange Capacity
3.6. Total Organic Carbon Contents and Total Nitrogen Contents
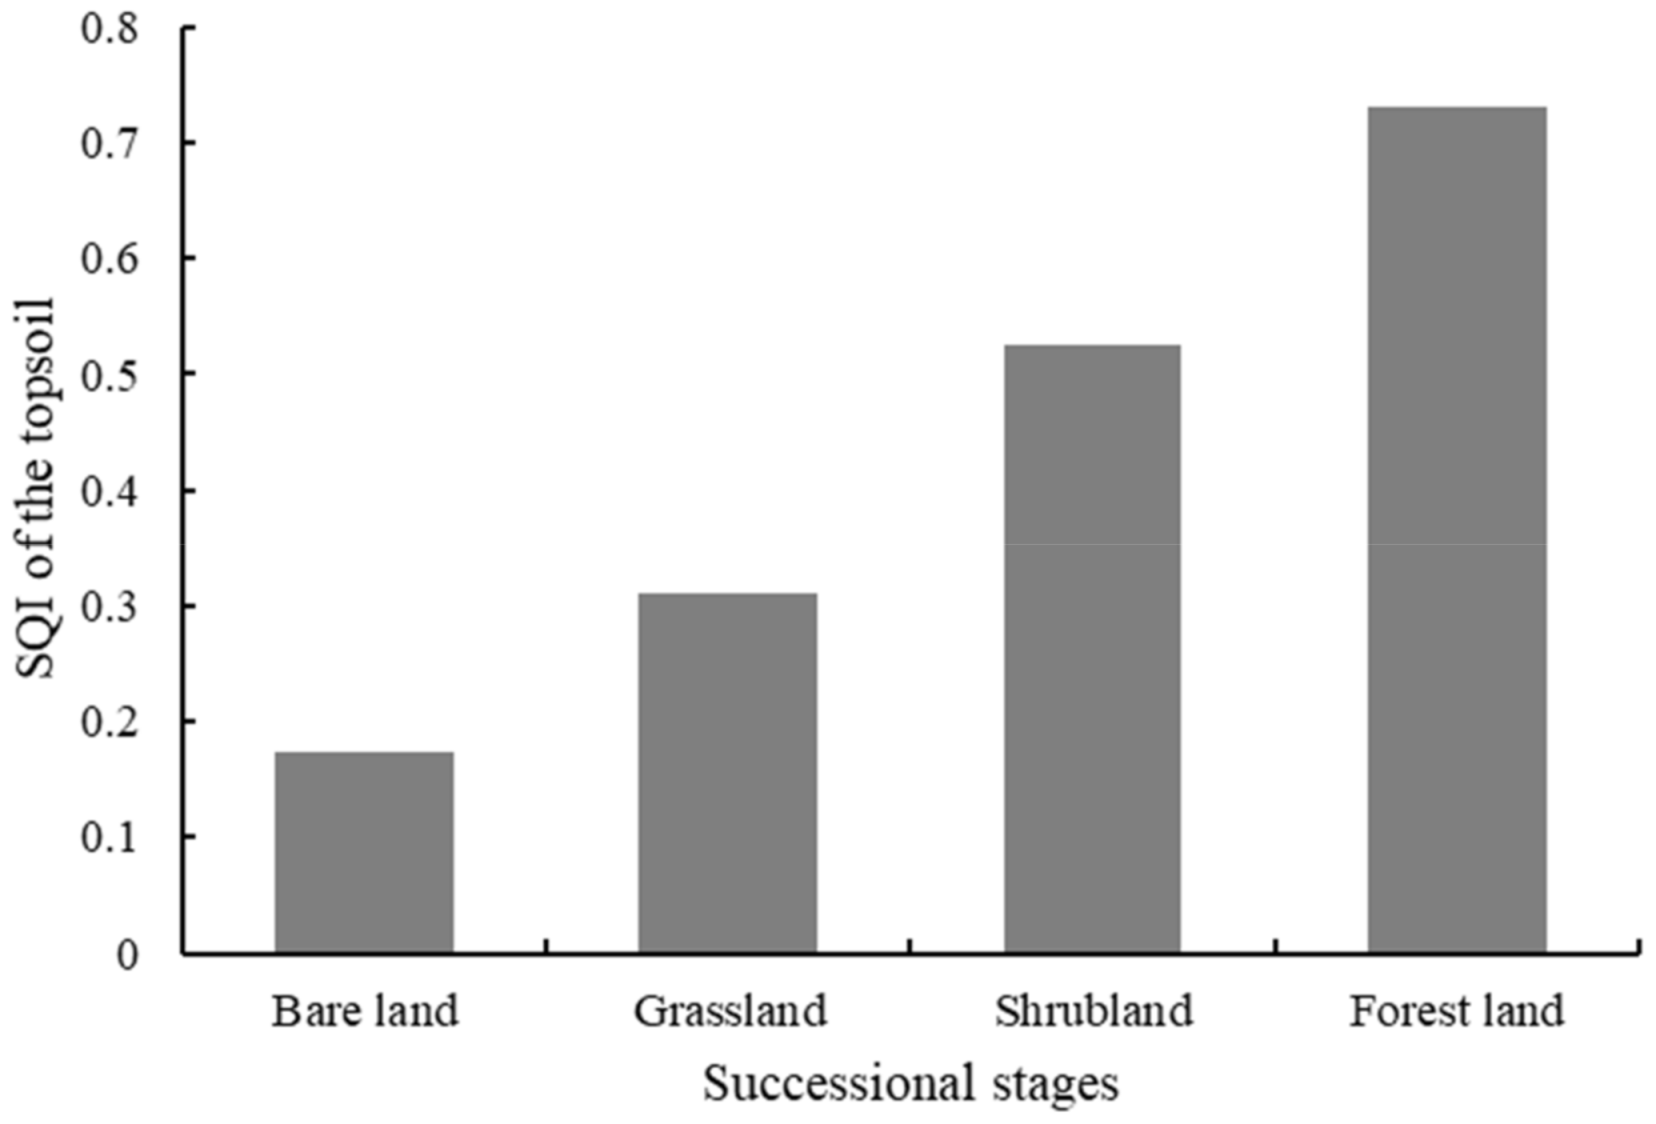
3.7. Evaluation of SQI
4. Discussion
5. Conclusions
Supplementary Materials
Author Contributions
Funding
Data Availability Statement
Acknowledgments
Conflicts of Interest
References
- Vitousek, P.M. The Hawaiian Islands as a model system for ecosystem studies. Pac. Sci. 1995, 49, 2–16. [Google Scholar]
- Oh, N.-H.; Richter, D.D. Elemental translocations and loss from three highly weathered soil-bedrock profiles in the southeastern United States. Geoderma 2005, 126, 5–25. [Google Scholar] [CrossRef]
- Chadwick, O.A.; Chorover, J. The chemistry of pedogenic thresholds. Geoderma 2001, 100, 321–353. [Google Scholar] [CrossRef]
- Riebe, C.S.; Kirchner, J.W.; Finkel, R.C. Sharp decrease in long-term chemical weathering rates along an altitudinal transect. Earth Planet. Sci. Lett. 2014, 218, 421–434. [Google Scholar] [CrossRef]
- White, A.F.; Schulz, M.S.; Stonestrom, D.A.; Vivit, D.V.; Fitzpatrick, J.; Bullen, T.D.; Blum, A.E. Chemical weathering of a marine terrace chronosequence, Santa Cruz, California part II: Solute profiles, gradients and the comparisons of contemporary and long-term weathering rates. Geochim. Cosmochim. Acta 2009, 73, 2769–2803. [Google Scholar] [CrossRef]
- Markewitz, D.; Davidson, E.A.; Figueiredo RD, O.; Victoria, R.L.; Krusche, A.V. Control of cation concentrations in stream waters by surface soil processes in an Amazonian watershed. Nature 2001, 410, 802–805. [Google Scholar] [CrossRef]
- Amundson, R.; Heimsath, A.M.; Owen, J.J.; Yoo, K.; Dietrich, W.E. Hillslope soils and vegetation. Geomorphology 2015, 234, 122–132. [Google Scholar] [CrossRef]
- Chadwick, O.A.; Gavenda, R.T.; Kelly, E.F.; Ziegler, K.; Olson, C.G.; Elliott, W.C.; Hendricks, D.M. The impact of climate on the biogeochemical functioning of volcanic soils. Chem. Geol. 2003, 202, 195–223. [Google Scholar] [CrossRef]
- Lucas, Y. The role of plants in controlling rates and products of weathering: Importance of biological pumping. Annu. Rev. Earth Planet. Sci. 2001, 29, 135–163. [Google Scholar] [CrossRef]
- Viles, H.A. The agency of organic beings: A selective review of recent work in biogeomorphology. In Vegetation and Erosion: Processes and Environments; Thornes, J.B., Ed.; Wiley: Chichester, UK, 1990; pp. 5–25. [Google Scholar]
- Brantley, S.L.; Lebedeva, M.; Hausrath, E.M. A geobiological view of weathering and erosion. In Fundamentals of Geobiology; Knoll, A., Ed.; Wiley-Blackwell: West Sussex, UK, 2012; pp. 205–227. [Google Scholar] [CrossRef]
- Drever, J.I. The effect of land plants on weathering rates of silicate minerals. Geochim. Cosmochim. Acta 1994, 58, 2325–2332. [Google Scholar] [CrossRef]
- Dahlgren, R.A.; Saigusa, M.; Ugolini, F.C. The nature, properties and management of volcanic soils. Adv. Agron. 2004, 82, 113–182. [Google Scholar] [CrossRef]
- Jones, G.A.; Henry, G.H.R. Primary plant succession on recently deglaciated terrain in the Canadian High Arctic. J. Biogeogr. 2003, 30, 277–296. [Google Scholar] [CrossRef]
- Leamy, M.L. Andisols of the World. Congresco International de Suelos Volcanicos, Communicationes, Universida de La Laguna Secretariado de Publicaciones, Serie Informes; 1984; Volume 13, pp. 368–387. [Google Scholar]
- Tsai, C.C.; Chen, Z.S.; Kao, C.I.; Ottner, F.; Kao, S.J.; Zehetner, F. Pedogenic development of volcanic ash soils along a climosequence in northern Taiwan. Geoderma 2010, 156, 48–59. [Google Scholar] [CrossRef]
- Kato, T.; Higashi, T.; Kamijo, T.; Tamura, K. Several chemical and mineralogical properties of volcanic ash samples erupted in 2000 from Miyake Island. Pedologist 2002, 46, 14–21. (In Japanese) [Google Scholar] [CrossRef]
- Kamijo, T.; Kitayama, K.; Sugawara, A.; Urushimichi, S.; Sasai, K. Primary succession of the warm-temperate broad-leaved forest on a volcanic island, Miyake-jima, Japan. Folia Geobot. 2002, 37, 71–91. [Google Scholar] [CrossRef]
- Miyazaki, T. Features of historical eruption at Miyake-jima Volcano. Bull. Volcanol. Soc. Jpn. Second. Ser. Spec. Issue 1984, 29, S1–S15. (In Japanese) [Google Scholar] [CrossRef]
- Nakada, S.; Masashi, N.; Yasuda, A.; Shimano, T.; Nobuo, G.; Marekazu, O.; Toshitsugu, F. Chronology of the Miyakejima. J. Geogr. 2001, 110, 168–180. (In Japanese) [Google Scholar] [CrossRef][Green Version]
- Yamakoshi, T.; Nakano, M.; Watari, M.; Mizuyama, T.; Chiba, T. Gully development characteristics after the 2000 eruption at Miyakejima Volcano. J. Jpn. Soc. Eros. Control. Eng. 2003, 55, 40–48. (In Japanese) [Google Scholar] [CrossRef]
- Doi, Y.; Yamakoshi, T.; Watari, M. Scoria runoff at Tatsune, Miyakejima island on July 16, 2002. J. Jpn. Soc. Eros. Control. Eng. 2003, 56, 32–36. (In Japanese) [Google Scholar] [CrossRef]
- Kamijo, T. Influence and restoration of vegetation. J. Jpn. For. Soc. 2006, 46, 46–50. (In Japanese) [Google Scholar] [CrossRef]
- Kamijo, T.; Kawagoe, M.; Kato, T.; Kiyohara, Y.; Matsuda, M.; Hashiba, K.; Shimada, K. Destruction and recovery of vegetation caused by the 2000-year eruption on Miyake-jima Island, Japan. J. Disaster Res. 2008, 3, 226–235. [Google Scholar] [CrossRef]
- Takahashi, T.; Kazuhiro, K.; Kamijo, T. The vegetation recovery in Miyakejima Island after the 2000 volcanic eruption using satellite remote sensing. J. Jpn. Inst. Landsc. Archit. 2008, 71, 539–542. [Google Scholar] [CrossRef]
- Ministry of Education—Singapore. The Third National Survey on the Natural Environment; Ministry of the Environment: Tokyo, Japan, 1988. [Google Scholar]
- Kato, T.; Kamijo, T.; Hatta, T.; Tamura, K.; Higashi, T. Initial Soil Formation Processes of Volcanogenous Regosols (Scoriacious) from Miyake-jima Island, Japan. Soil Sci. Plant Nutr. 2005, 51, 291–301. [Google Scholar] [CrossRef]
- Kottek, M.; Grieser, J.; Beck, C.; Rudolf, B.; Rubel, F. World Map of the Köppen-Geiger climate classification updated. Meteorol. Z. 2006, 15, 259–263. [Google Scholar] [CrossRef]
- Yamanishi, A.; Kamijo, T.; Tsunekawa, A.; Higuchi, H. Monitoring vegetation damage caused by the year 2000 Miyake Island’s volcanic eruption using satellite data. J. Jpn. Inst. Landsc. Archit. 2003, 66, 473–476. [Google Scholar] [CrossRef]
- The Japanese Society of Pedology. The Soil Survey Manual, Revised Edition; HAKUYUSHA: Tokyo, Japan, 1997. [Google Scholar]
- Schollenberger, C.J.; Simon, R.H. Determination of exchange capacity and exchangeable bases in soil. Ammonium acetate method. Soil Sci. 1945, 59, 13–24. [Google Scholar] [CrossRef]
- Andrews, S.S.; Mitchell, J.P.; Mancinelli, R.; Karlen, D.L.; Hartz, T.K.; Horwath, W.R.; Pettygrove, G.S.; Scow, K.M.; Munk, D.S. On-farm assessment of soil quality in California’s Central Valley. Agron. J. 2002, 94, 12–23. [Google Scholar] [CrossRef]
- Masto, R.E.; Chhonkar, P.K.; Singh, D.; Patra, A.K. Alternative soil quality indices for evaluating the effect of intensive cropping, fertilisation and manuring for 31 years in the semi-arid soils of India. Environ. Monit. Assess. 2008, 136, 419–435. [Google Scholar] [CrossRef] [PubMed]
- Bastida, F.; Moreno, J.L.; Hernandez, T.; Garcia, C. Microbiological degradation index of soils in a semiarid climate. Soil Biol. Biochem. 2006, 38, 3463–3473. [Google Scholar] [CrossRef]
- Zhao, K.; Fahey, T.J.; Liang, D.; Jia, Z.; Ma, L. Effects of long-term successive rotations, clear-cutting and stand age of prince Rupprecht’s larch (Larix principis-rupprechtii Mayr) on soil quality. Forests 2019, 10, 932. [Google Scholar] [CrossRef]
- Li, D.; Si, J.; Zhang, X.; Gao, Y.; Luo, H.; Qin, J.; Gao, G. The mechanism of changes in hydraulic properties of Populus euphratica in response to drought stress. Forests 2019, 10, 904. [Google Scholar] [CrossRef]
- Arnold, J.; Corre, M.D.; Veldkamp, E. Soil N cycling in old-growth forests across an andosol toposequence in Ecuador. For. Ecol. Manag. 2009, 257, 2079–2087. [Google Scholar] [CrossRef]
- Peña-Ramírez, V.M.; Vázquez-Selem, L.; Siebe, C. Soil organic carbon stocks and forest productivity in volcanic ash soils of different age (1835–30,500 years B.P.) in Mexico. Geoderma 2009, 149, 224–234. [Google Scholar] [CrossRef]
- Molina, A.; Vanacker, V.; Corre, M.D.; Veldkamp, E. Patterns in soil chemical weathering related to topographic gradients and vegetation structure in a high Andean tropical ecosystem. J. Geophys. Res. Earth Surf. 2019, 124, 666–685. [Google Scholar] [CrossRef]
- Kang, B.; Liu, S.R.; Cai, D.X.; Lu, L.H.; He, R.M.; Gao, Y.X.; Di, W.Z. Soil physical and chemical characteristics under different vegetation restoration patterns in China south subtropical area. Ying Yong Sheng Tai Xue Bao J. Appl. Ecol. 2010, 21, 2479–2486. [Google Scholar]
- Miao, R.H.; Song, Y.H.; Sun, Z.L.; Guo, M.X.; Zhou, Z.X.; Liu, Y.Z. Soil seed bank and plant community development in passive restoration of degraded sandy grasslands. Sustainability 2016, 8, 581. [Google Scholar] [CrossRef]
- Bach, E.M.; Baer, S.G.; Six, J. Plant and soil responses to high and low diversity grassland restoration practices. Environ. Manag. 2012, 49, 412–424. [Google Scholar] [CrossRef]
- Cardinale, B.J.; Duffy, J.E.; Gonzalez, A.; Hooper, D.U.; Perrings, C.; Venail, P.; Narwani, A.; Mace, G.M.; Tilman, D.; Wardle, D.A.; et al. Biodiversity loss and its impact on humanity. Nature 2012, 486, 59–67. [Google Scholar] [CrossRef]
- Tahmasebi, P.; Moradi, M.; Omidipour, R. Plant functional identity as the predictor of carbon storage in semi-arid ecosystems. Plant Ecol. Divers. 2017, 10, 139–151. [Google Scholar] [CrossRef]
- Tilman, D.; Reich, P.B.; Knops, J.M. Biodiversity and ecosystem stability in a decade-long grassland experiment. Nature 2006, 441, 629–632. [Google Scholar] [CrossRef]
- Dijkstra, F.A.; West, J.B.; Hobbie, S.E.; Reich, P.B.; Trost, J. Plant diversity, CO2, and N influence inorganic and organic N leaching in grasslands. Ecology 2007, 88, 490–500. [Google Scholar] [CrossRef]
- Li, D.S.; Zhang, P.; Zhang, S.L.; Yin, J.D.; Lu, F.D. A study on water conservation capacity of forest soil in Huangqian reservoir area. J. Nanjing For. Univ. 2004, 28, 25–27. [Google Scholar]
- Yu, B.; Xie, C.; Cai, S.; Chen, Y.; Lv, Y.; Mo, Z.; Yang, Z. Effects of tree root density on soil total porosity and non-capillary porosity using a ground-penetrating tree radar Unit in Shanghai, China. Sustainability 2018, 10, 4640. [Google Scholar] [CrossRef]
- Ahuja, L.R.; Naney, J.W.; Green, R.E.; Nielsen, D.R. Macroporosity to characterize spatial variability of hydraulic conductivity and effects of land management. Soil Sci. Soc. Am. J. 1984, 48, 699–702. [Google Scholar] [CrossRef]
- Ajayi, A.E.; Horn, R. Transformation of ex-arable land to permanent grassland promotes pore rigidity and mechanical soil resilience. Ecol. Eng. 2016, 94, 592–598. [Google Scholar] [CrossRef]
- Gu, C.; Mu, X.; Gao, P.; Zhao, G.; Sun, W.; Tatarko, J.; Tan, X. Influence of vegetation restoration on soil physical properties in the loess plateau, china. J. Soils Sediments 2019, 19, 716–728. [Google Scholar] [CrossRef]
- Hooper, D.U.; Bignell, D.E.; Brown, V.K.; Brussard, L.; Mark Dangerfield, J.; Wall, D.H.; Wardle, D.A.; Coleman, D.C.; Giller, K.E.; Lavelle, P.; et al. Interactions between aboveground and belowground biodiversity in terrestrial ecosystems: Patterns, mechanisms and feedbacks. BioScience 2000, 50, 1049–1061. [Google Scholar] [CrossRef]
- Tang, X.Y.; Liu, S.G.; Liu, J.X.; Zhou, G.Y. Effects of vegetation restoration and slope positions on soil aggregation and soil carbon accumulation on heavily eroded tropical land of Southern China. J. Soils Sediments 2010, 10, 505–513. [Google Scholar] [CrossRef]
- Fu, X.L.; Shao, M.A.; Wei, X.R.; Horton, R. Soil organic carbon and total nitrogen as affected by vegetation types in Northern Loess Plateau of China. Geoderma 2010, 155, 31–35. [Google Scholar] [CrossRef]
- Nelson, J.D.J.; Schoenau, J.J.; Malhi, S.S. Soil organic carbon changes and distribution in cultivated and restored grassland soils in Saskatchewan. Nutr. Cycl. Agroecosystems 2008, 82, 137–148. [Google Scholar] [CrossRef]
- Gamboa, A.M.; Galicia, L. Land-use/cover change effects and carbon controls on volcanic soil profiles in highland temperate forests. Geoderma 2012, 170, 390–402. [Google Scholar] [CrossRef]
- Sokołowska, J.; Józefowska, A.; Woźnica, K.; Zaleski, T. Succession from meadow to mature forest: Impacts on soil biological, chemical and physical properties—Evidence from the Pieniny mountains, Poland. CATENA 2020, 189, 104503. [Google Scholar] [CrossRef]
- Cleveland, C.C.; Townsend, A.R.; Constance, B.C.; Ley, R.E.; Schmidt, S.K. Soil microbial dynamics in Costa Rica: Seasonal and biogeochemical constraints. Biotropica 2004, 36, 184–195. [Google Scholar] [CrossRef]
- Li, Y.Y.; Shao, M.A.; Zheng, J.Y.; Zhang, X.C. Spatial-temporal changes of soil organic carbon during vegetation recovery at Ziwuling, China. Pedosphere 2005, 15, 601–610. [Google Scholar]
- Deng, L.; Wang, K.; Chen, M.; Shangguan, Z.; Sweeney, S. Soil organic carbon storage capacity positively related to forest succession on the loess plateau, China. CATENA 2013, 110, 1–7. [Google Scholar] [CrossRef]


| Site | Altitude (m) | Aspect (°) | Slope (°) | Volcanic Ash Thickness (cm) | Vegetation Restoration Time | Land Cover Types | Coverage (%) | Main Plant Species |
|---|---|---|---|---|---|---|---|---|
| IG7 | 538 | N50W | 6 | 43 | 7 | Bare land | <1 | — |
| 11 | Grassland | 55 | Miscanthus condensatus | |||||
| 19 | Grassland | 99 | Miscanthus condensatus | |||||
| IG8 | 443 | N60W | 12 | 38 | 7 | Grassland | 91 | Miscanthus condensatus |
| 11 | Shrubland | 130 | Rubus trifidus | |||||
| 19 | Shrubland | 176 | Alnus sieboldiana | |||||
| IG9 | 388 | N50W | 6 | 20 | 7 | Shrubland | 131 | Alnus sieboldiana |
| 11 | Forest land | 180 | Alnus sieboldiana | |||||
| 19 | Forest land | 242 | Alnus sieboldiana |
| Depth (cm) | Three-Phase Distribution (%) | Soil Porosity (%) | Hydraulic Conductivity (cm/s) | ||||
|---|---|---|---|---|---|---|---|
| Solid Fraction | Liquid Fraction | Gas Fraction | Total Porosity | Capillary Porosity | Non-Capillary Porosity | ||
| IG7 | |||||||
| 0–5 | 39.5 (0.4) | 26.6 (1.1) | 34.0 (0.7) | 60.5 (0.4) | 52.5 (0.9) | 8.0 (0.8) | 11.7 × 10⁻² (0.0002) |
| 10–15 | 44.7 (2.4) | 36.2 (1.0) | 19.2 (1.5) | 55.3 (2.4) | 47.1 (1.4) | 8.2 (1.2) | 0.6 × 10⁻² (0.003) |
| 30–35 | 44.7 (1.6) | 19.6 (0.5) | 35.6 (2.1) | 55.3 (1.6) | 46.3 (0.9) | 9.0 (0.9) | 18.9 × 10⁻² (0.01) |
| 50–55 | 27.4 (1.0) | 66.9 (2.0) | 5.7 (1.1) | 72.6 (1.0) | 71.2 (1.2) | 1.4 (0.2) | 0.1 × 10⁻² (0.0002) |
| 70–75 | 29.3 (1.4) | 63.4 (2.2) | 7.3 (1.0) | 70.7 (1.4) | 66.5 (2.0) | 4.2 (0.8) | 0.1 × 10⁻² (0.0002) |
| Mean * | 37.1 (1.4) a | 42.5 (1.4) a | 20.4 (1.3) a | 62.9 (1.4) a | 56.7 (1.3) a | 6.2 (0.8) a | 6.3 × 10⁻² (0.003) a |
| IG8 | |||||||
| 0–5 | 31.3 (3.1) | 46.3 (1.6) | 22.4 (2.7) | 68.7 (3.1) | 60.5 (0.6) | 8.2 (2.8) | 0.1 × 10⁻² (0.0005) |
| 10–15 | 43.6 (1.2) | 44.9 (0.6) | 11.6 (1.7) | 56.4 (1.2) | 50.9 (0.4) | 5.5 (0.8) | 0.1 × 10⁻² (0.0005) |
| 30–35 | 42.3 (1.2) | 36.2 (2.4) | 21.6 (1.4) | 57.7 (1.2) | 50.8 (1.0) | 7.0 (0.7) | 0.1 × 10⁻² (0.0008) |
| 50–55 | 30.2 (2.5) | 22.7 (0.8) | 47.0 (3.3) | 69.8 (2.5) | 54.4 (2.2) | 15.4 (0.4) | 21.6 × 10⁻² (0.01) |
| 70–75 | 46.1 (1.1) | 33.0 (2.6) | 21.0 (2.1) | 53.9 (1.1) | 38.0 (2.5) | 15.9 (2.0) | 0.1 × 10⁻² (0.0001) |
| Mean * | 38.7 (1.8) a | 36.6 (1.6) b | 24.7 (2.3) a | 61.3 (1.8) a | 50.9 (1.3) b | 10.4 (1.3) b | 4.4 × 10⁻² (0.0003) a |
| IG9 | |||||||
| 0–5 | 32.9 (3.6) | 52.5 (1.6) | 14.6 (4.4) | 67.1 (3.6) | 62.6 (2.1) | 4.5 (2.6) | 6.1 × 10⁻² (0.05) |
| 10–15 | 43.2 (3.0) | 30.3 (2.2) | 26.6 (3.7) | 56.8 (3.0) | 49.6 (3.4) | 7.2 (1.0) | 6.1 × 10⁻² (0.05) |
| 30–35 | 26.4 (1.7) | 37.9 (4.3) | 35.7 (4.3) | 73.6 (1.7) | 59.0 (1.9) | 14.6 (1.0) | 11.2 × 10⁻² (0.05) |
| 50–55 | 30.8 (2.0) | 49.7 (1.1) | 19.5 (2.3) | 69.2 (2.0) | 60.9 (1.7) | 8.3 (0.5) | 0.8 × 10⁻² (0.006) |
| 70–75 | 41.8 (1.9) | 41.0 (2.7) | 17.2 (1.9) | 58.2 (1.9) | 46.9 (2.2) | 11.4 (0.7) | 0.1 × 10⁻² (0.0001) |
| Mean * | 35.0 (2.4) a | 42.3 (2.4) a | 22.7 (3.3) a | 64.9 (2.4) a | 55.8 (2.3) a | 9.2 (1.1) b | 4.8 × 10⁻² (0.03) a |
| Sites | pH (H2O) | pH (KCl) | CEC (cmol/kg) | ||||||
|---|---|---|---|---|---|---|---|---|---|
| 2007 | 2011 | 2019 | 2007 | 2011 | 2019 | 2007 | 2011 | 2019 | |
| IG7 | |||||||||
| A/C1d | 3.9 (0.03) | 4.8 (0.03) | 5.7 (0.03) | 3.8 (0.01) | 4.1 (0.03) | 4.7 (0.01) | 4.6 (0.11) | 6.7 (0.17) | 4.8 (0.10) |
| C1d | 3.9 (0.02) | 4.8 (0.04) | 5.9 (0.02) | 3.8 (0.03) | 4.1 (0.02) | 4.8 (0.02) | 4.6 (0.13) | 6.7 (0.12) | 6.9 (0.24) |
| C2d | 3.9 (0.04) | 4.3 (0.02) | 5.5 (0.01) | 3.8 (0.02) | 4.0 (0.02) | 4.4 (0.03) | 4.6 (0.28) | 5.5 (0.18) | 6.9 (0.06) |
| C3 | 3.9 (0.04) | 4.3 (0.03) | 5.2 (0.02) | 3.8 (0.02) | 4.0 (0.02) | 4.3 (0.01) | 4.6 (0.19) | 5.5 (0.13) | 5.4 (0.09) |
| C4 | 3.9 (0.02) | 4.4 (0.03) | 5.1 (0.02) | 3.8 (0.02) | 4.1 (0.02) | 4.3 (0.01) | 3.5 (0.29) | 4.6 (0.26) | 6.9 (0.11) |
| 2A1 | 3.9 (0.03) | 4.4 (0.02) | 5.2 (0.01) | 4.0 (0.02) | 4.1 (0.02) | 4.6 (0.01) | 16.7 (0.21) | 23.5 (0.19) | 18.6 (0.13) |
| 2A2 | 3.9 (0.03) | 4.6 (0.02) | 4.9 (0.01) | 4.1 (0.01) | 4.4 (0.03) | 4.7 (0.01) | 9.5 (0.21) | 12.2 (0.25) | 15.1 (0.14) |
| 2BW | 3.9 (0.02) | 4.6 (0.04) | 4.7 (0.01) | 4.1 (0.03) | 4.5 (0.02) | 4.7 (0.01) | 7.9 (0.25) | 11.7 (0.13) | 16.9 (0.08) |
| 3C | 4.0 (0.03) | 4.6 (0.03) | 4.7 (0.01) | 4.4 (0.02) | 4.7 (0.03) | 4.8 (0.01) | 1.3 (0.23) | 1.0 (0.14) | 7.9 (0.27) |
| Mean * | 3.9 (0.03) Aa | 4.4 (0.03) Ab | 5.1 (0.02) Ac | 3.9(0.02) Aa | 4.2 (0.02) Aa | 4.5 (0.01) Ab | 6.1 (0.21) Aa | 8.2 (0.17) Ab | 10.2 (0.14) Ac |
| IG8 | |||||||||
| A/C1d | 3.9 (0.03) | 4.6 (0.04) | 5.3 (0.03) | 3.6 (0.01) | 4.2 (0.02) | 4.3 (0.01) | 6.4 (0.18) | 8.2 (0.11) | 12.3 (0.01) |
| C1d | 4.1 (0.02) | 4.8 (0.02) | 5.7 (0.01) | 3.8 (0.03) | 4.2 (0.01) | 4.5 (0.01) | 7.1 (0.22) | 9.2 (0.15) | 8.5 (0.05) |
| C2 | 3.8 (0.03) | 4.6 (0.02) | 5.0 (0.02) | 3.7 (0.02) | 4.1 (0.03) | 4.3 (0.01) | 8.0 (0.19) | 7.7 (0.16) | 5.9 (0.07) |
| 2A | 4.1 (0.02) | 4.7 (0.04) | 5.0 (0.01) | 4.1 (0.02) | 4.3 (0.03) | 4.5 (0.02) | 15.4 (0.11) | 20.5 (0.21) | 17.6 (0.16) |
| 3C | 3.8 (0.02) | 4.7 (0.02) | 5.1 (0.01) | 4.2 (0.01) | 4.5 (0.02) | 4.8 (0.01) | - | 6.0 (0.24) | 8.2 (0.17) |
| 4B | 4.0 (0.02) | 4.7 (0.03) | 4.8 (0.02) | 4.3 (0.01) | 4.5 (0.02) | 4.8 (0.01) | 10.8 (0.12) | 9.6 (0.18) | 3.9 (0.23) |
| 5C | 4.2 (0.02) | 4.8 (0.03) | 5.0 (0.02) | 4.6 (0.02) | 4.7 (0.02) | 5.0 (0.01) | 1.0 (0.11) | 3.8 (0.17) | 3.7 (0.11) |
| Mean * | 4.1 (0.02) Aa | 4.7 (0.03) Ab | 5.1 (0.02) Ac | 4.1 (0.02) Aa | 4.3 (0.02) Aa | 4.6 (0.01) Ab | 6.4(0.17) Aa | 8.4 (0.17) Ab | 7.1 (0.11) Ba |
| IG9 | |||||||||
| A/C1 | 3.8 (0.03) | 4.7 (0.02) | 5.7 (0.04) | 3.8 (0.02) | 3.8 (0.01) | 4.6 (0.01) | 6.2 (0.27) | 22.7 (0.32) | 19.4 (0.31) |
| Cd | 4.0 (0.02) | 5.0 (0.02) | 5.7 (0.06) | 3.9 (0.02) | 4.2 (0.02) | 4.4 (0.01) | 8.6 (0.23) | 9.7 (0.25) | 12.5 (0.01) |
| 2A | 4.1 (0.04) | 4.9 (0.02) | 5.4 (0.04) | 4.2 (0.02) | 4.4 (0.02) | 4.7 (0.01) | 25.2 (0.14) | 23.3 (0.33) | 21.5 (0.13) |
| 3C | 4.2 (0.02) | - | 5.5 (0.02) | 4.4 (0.02) | - | 4.9 (0.01) | - | 16.8 (0.17) | 9.2 (0.12) |
| 4B | 4.3 (0.03) | 4.8 (0.04) | 5.1 (0.02) | 4.5 (0.02) | 4.7 (0.02) | 5.0 (0.01) | 10.8 (0.28) | 12.8 (0.24) | 11.3 (0.17) |
| 5C | 4.5 (0.01) | 4.9 (0.04) | 5.1 (0.02) | 4.6 (0.01) | 5.0 (0.02) | 5.3 (0.01) | 10.8 (0.23) | 0.8 (0.24) | 5.1 (0.35) |
| 6C | 4.4 (0.03) | 5.0 (0.02) | 5.3 (0.01) | 4.8 (0.02) | 5.0 (0.01) | 5.4 (0.02) | 0.6 (0.17) | 0.3 (0.25) | 0.5 (0.10) |
| Mean * | 4.2 (0.03) Aa | 4.5 (0.03) Ab | 5.1 (0.03) Ac | 4.4 (0.02) Ba | 4.2 (0.01) Aa | 4.9 (0.01) Bb | 8.4 (0.23) Ba | 9.3 (0.26) Bb | 9.2 (0.17) Ab |
| Sites | Total Organic Carbon (g/kg) | Total Nitrogen (g/kg) | C/N | ||||||
|---|---|---|---|---|---|---|---|---|---|
| 2007 | 2011 | 2019 | 2007 | 2011 | 2019 | 2007 | 2011 | 2019 | |
| IG7 | |||||||||
| A/C1d | - | 1.1 (0.1) | 3.6 (0.1) | - | 0.1 (0.04) | 0.5 (0.03) | - | 12.4 (0.3) | 7.7 (0.5) |
| C1d | - | 1.1 (0.1) | 2.2 (0.3) | - | 0.1 (0.02) | 0.4 (0.03) | - | 12.4 (0.6) | 5.7 (0.5) |
| C2d | - | 0.8 (0.1) | 1.3 (0.1) | - | 0.1 (0.02) | 0.5 (0.04) | - | 11.1 (0.4) | 2.8 (0.2) |
| C3 | - | 0.8 (0.2) | 2.8 (0.1) | - | 0.1 (0.02) | 0.4 (0.02) | - | 11.1 (0.2) | 7.5 (0.8) |
| C4 | 1.3 (0.2) | 1.3 (0.3) | 8.0 (0.1) | - | 0.1 (0.02) | 0.8 (0.01) | - | 11.4 (0.2) | 10.2 (0.1) |
| 2A1 | 83.9 (1.6) | 96.8 (1.5) | 70.6 (1.7) | 6.8 (0.1) | 7.8 (0.2) | 5.8 (0.1) | 12.4 (0.5) | 12.5 (0.6) | 12.2 (0.1) |
| 2A2 | 46.4 (1.2) | 37.5 (1.5) | 59.8 (1.1) | 3.8 (0.2) | 3.3 (0.2) | 5.2 (0.2) | 12.3 (0.6) | 11.4 (0.7) | 11.6 (0.1) |
| 2BW | 31.0 (1.1) | 32.3 (1.2) | 31.6 (1.2) | 2.6 (0.1) | 2.9 (0.1) | 2.8 (0.2) | 11.8 (0.5) | 11.2 (0.2) | 11.3 (0.1) |
| 3C | 0.6 (0.1) | 2.2 (0.3) | 4.9 (0.2) | - | 0.2 (0.03) | 0.7 (0.02) | - | 10.9 (0.3) | 7.5 (0.2) |
| Mean * | 17.7 (0.8) Aa | 18.7 (0.6) Aa | 20.6 (0.5) Ab | 1.4 (0.1) Aa | 1.5 (0.1) Aa | 1.8 (0.1) Aa | 12.1 (0.5) Aa | 11.4 (0.4) Aa | 9.1 (0.3) Ab |
| IG8 | |||||||||
| A/C1d | 21.9 (1.2) | 11.1 (0.1) | 38.0 (1.5) | 0.9 (0.04) | 0.6 (0.04) | 2.4 (0.1) | 24.5 (1.2) | 18.1 (0.7) | 15.8 (0.4) |
| C1d | - | 0.4 (0.01) | 1.5 (0.4) | - | 0.1 (0.03) | 0.4 (0.02) | - | 5.5 (0.4) | 3.9 (0.1) |
| C2 | 0.5 (0.01) | 0.8 (0.01) | 2.3 (0.4) | - | 0.1 (0.04) | 0.4 (0.01) | - | 8.3 (0.1) | 5.2 (0.2) |
| 2A | 60.5 (1.2) | 87.1 (1.2) | 69.2 (1.4) | 4.2 (0.1) | 6.4 (0.1) | 5.2 (0.1) | 14.6 (0.5) | 13.6 (0.6) | 13.3 (0.4) |
| 3C | 20.1 (1.1) | 19.8 (1.1) | 36.3 (1.4) | 1.4 (0.1) | 1.6 (0.1) | 2.7 (0.3) | 14.5 (0.4) | 12.2 (0.5) | 13.5 (0.4) |
| 4B | 31.8 (1.2) | 31.1 (1.1) | 22.9 (1.3) | 2.2 (0.1) | 2.6 (0.1) | 1.9 (0.3) | 14.2 (0.5) | 11.9 (0.7) | 12.3 (0.2) |
| 5C | 2.8 (0.1) | 5.0 (0.1) | 3.7 (0.1) | - | 0.4 (0.01) | 0.5 (0.01) | - | 13.2 (0.7) | 6.9 (0.2) |
| Mean * | 14.1 (0.8) Ba | 17.2 (0.5) Ab | 16.2 (0.9) Bb | 0.9 (0.1) Ba | 1.3 (0.1) Ab | 1.3 (0.1) Bb | 16.9 (0.7) Ba | 10.8 (0.5) Bb | 8.2 (0.3) Bc |
| IG9 | |||||||||
| A/C1 | - | 58.5 (1.4) | 47.8 (1.6) | - | 4.1 (0.1) | 4.1 (0.1) | - | 14.2 (0.3) | 11.7 (0.3) |
| Cd | 0.2 (0.01) | 1.6 (0.4) | 11.1 (0.1) | - | 0.1 (0.01) | 1.2 (0.1) | - | 12.0 (0.5) | 9.3 (0.6) |
| 2A | 76.9 (1.1) | 74.1 (1.5) | 59.5 (1.4) | 6.2 (0.1) | 6.6 (0.1) | 5.7 (0.1) | 12.4 (0.7) | 11.2 (0.4) | 10.5 (0.1) |
| 3C | 20.7 (1.3) | - | 44.5 (1.3) | 1.7 (0.1) | - | 4.0 (0.1) | 12.1 (0.3) | - | 11.0 (0.1) |
| 4B | 30.2 (1.5) | 40.6 (1.5) | 41.9 (1.4) | 2.7 (0.1) | 3.7 (0.2) | 3.9 (0.3) | 11.4 (0.3) | 11.1 (0.4) | 10.9 (0.2) |
| 5C | 7.1 (0.1) | 1.6 (0.3) | 7.9 (0.1) | 0.5 (0.02) | 0.1 (0.03) | 0.9 (0.02) | 14.8 (0.3) | 12.5 (0.4) | 9.1 (0.1) |
| 6C | - | 0.4 (0.02) | 1.4 (0.2) | - | 0.1 (0.01) | 0.3 (0.02) | - | 9.0 (0.2) | 4.4 (0.2) |
| Mean * | 16.7 (0.8) Aa | 20.2 (0.9) Bb | 24.5 (0.9) Cc | 1.3 (0.1) Aa | 1.7 (0.1) Ab | 2.3 (0.1) Cc | 12.6 (0.4) Aa | 10.3 (0.4) Bb | 8.8 (0.2) Bc |
| Principal Component | PC1 | PC2 | PC3 |
|---|---|---|---|
| Eigenvalues | 6.94 | 2.55 | 1.65 |
| Variance (%) | 53.36 | 19.62 | 12.68 |
| Bulk density | −0.96 | −0.16 | −0.10 |
| Capillary porosity | 0.93 | −0.22 | 0.17 |
| Porosity | 0.92 | 0.28 | 0.10 |
| Solid fraction | −0.92 | −0.28 | −0.10 |
| Total nitrogen | 0.90 | 0.29 | 0.08 |
| Total organic carbon | 0.90 | 0.30 | 0.02 |
| Liquid fraction | 0.88 | −0.41 | −0.16 |
| Cation exchange capacity | 0.82 | 0.20 | −0.14 |
| Gas fraction | −0.47 | 0.81 | 0.31 |
| Non-capillary porosity | −0.34 | 0.80 | −0.16 |
| pH (H2O) | −0.09 | −0.47 | 0.74 |
| Hydraulic conductivity | −0.26 | 0.53 | 0.70 |
| pH (KCl) | 0.09 | −0.38 | 0.62 |
Publisher’s Note: MDPI stays neutral with regard to jurisdictional claims in published maps and institutional affiliations. |
© 2021 by the authors. Licensee MDPI, Basel, Switzerland. This article is an open access article distributed under the terms and conditions of the Creative Commons Attribution (CC BY) license (https://creativecommons.org/licenses/by/4.0/).
Share and Cite
Peng, X.; Tamura, K.; Asano, M.; Takano, A.; Kawagoe, M.; Kamijo, T. Changes in Soil Physical and Chemical Properties during Vegetation Succession on Miyake-jima Island. Forests 2021, 12, 1435. https://doi.org/10.3390/f12111435
Peng X, Tamura K, Asano M, Takano A, Kawagoe M, Kamijo T. Changes in Soil Physical and Chemical Properties during Vegetation Succession on Miyake-jima Island. Forests. 2021; 12(11):1435. https://doi.org/10.3390/f12111435
Chicago/Turabian StylePeng, Xinhao, Kenji Tamura, Maki Asano, Aya Takano, Minami Kawagoe, and Takashi Kamijo. 2021. "Changes in Soil Physical and Chemical Properties during Vegetation Succession on Miyake-jima Island" Forests 12, no. 11: 1435. https://doi.org/10.3390/f12111435
APA StylePeng, X., Tamura, K., Asano, M., Takano, A., Kawagoe, M., & Kamijo, T. (2021). Changes in Soil Physical and Chemical Properties during Vegetation Succession on Miyake-jima Island. Forests, 12(11), 1435. https://doi.org/10.3390/f12111435