Article

Profitability of the First Commercial Thinning, a Simulation Study in Northern Finland

1
Natural Resources Institute Finland (Luke), Itäinen Pitkäkatu 4a, 20520 Turku, Finland
2
Natural Resources Institute Finland (Luke), Yliopistonkatu 6B, 80100 Joensuu, Finland
3
Forest Centre, Rautionkatu 2C, 90400 Oulu, Finland
4
Natural Resources Institute Finland (Luke), Paavo Havaksentie 3, 90570 Oulu, Finland
*
Author to whom correspondence should be addressed.
Forests 2021, 12(10), 1389; https://doi.org/10.3390/f12101389
Submission received: 9 September 2021 / Revised: 4 October 2021 / Accepted: 8 October 2021 / Published: 12 October 2021
(This article belongs to the Section Forest Economics, Policy, and Social Science)

Abstract

:
Despite positive signals from increasing growing stock volumes and improved roundwood trade, first commercial thinnings (FCTs) tend to be a bottleneck in Finnish forest management and forestry. The reasons are many, but probably the most crucial would be the lack of simultaneous economic incentives for participating agents, i.e., private forest owners and forest machine contractors. This is due to poor stand characteristics in most FCT cases: low cutting removal with small average stem size. There are five predetermined management options: (1) Industrial wood thinning with only two timber assortments, pulpwood and saw logs, (2) Integrated procurement of industrial and energy wood, (3) Energy wood thinning solely consisting of delimbed stems, (4) Whole-tree energy wood thinning with an energy price of 3 € m−3 and (5) Whole-tree energy wood thinning with energy price of 8 € m−3, that were applied for six separate forest stands located in Northern Finland, and derived from a database representing stands with an urgent need for FCT. Then, a two-phase financial analysis consisting of stand-level optimization (private forest owners) and profitability assessment (contractor) was conducted in order to find out whether there would be simultaneous economic incentives for both participants of FCT. The stand-level optimization revealed the financially best management options for a private forest owner, and then, for a contractor, the profitability assessment exposed the profit (or loss) associated with the particular management option. In brief, our results demonstrated that conducting either an industrial wood thinning (1) or an integrated procurement (2) resulted in a positive economic incentive for both the private forest owner and the contractor in all six cases (stands). Further, applying energy wood thinning with delimbed stems (3) would even generate a financial loss for the contractor, given the roadside prices applied in this study.

1. Introduction

The growing stock volume of the Finnish forest resources has been accumulating steadily during the last decades, reaching a value of almost 2500 million cubic meters [1], and so too has the roundwood trade increased during recent years, ranging between ca. 60 and 71 million cubic meters per annum [1]. Despite these positive signals, first commercial thinnings (FCTs) tend to be a bottleneck of the Finnish silviculture—the area of managed/conducted FCTs falls distinctively short of the planned/scheduled area which is based on the silvicultural status and urgency [2]. For instance, in Lapland (the northernmost province of Finland), the need for FCTs within the next five years corresponds to a total of app. 470,000 hectares, while during the last five years there have been carried out app. 190,000 hectares of FCTs [3]. Such a gap between the need for FCTs and actually managed hectares of FCTs—the backlog of FCTs—would in time create problems at aggregate levels in the form of, e.g., a reduction in mean annual increment and decreased timber supply (“passive management”, see [4]). In order to avoid the problems stemming from the backlog of FCTs, potential financial incentives need to be discovered and further revealed for various stakeholders involved in FCT operations. In addition, managing young forests could generate positive socio-economic impacts both at the regional as well as on the national level [5].
In general, stand density is controlled through thinnings to increase growth and to improve stem quality by removing low-quality stems (e.g., [6]). More precisely, FCT in conifer stands affects the diameter growth of dominant trees and, in general, the vigorousness of trees—so that neglecting FCT would delay the diameter growth and, in some cases, would increase the mortality at stand level [7,8]. On the other hand, one of the main reasons for the neglected FCTs is the generally low profitability due to the small stem size and high harvesting costs [9,10]. During the years, there have been several attempts to improve the profitability of FCT, for instance, by applying delimbed-tree [11,12,13,14], or whole-tree harvesting [14,15,16,17,18], integrated harvesting of energy wood and pulpwood [14,19,20,21] or rationalizing integrated harvesting of small-diameter wood by introducing a new technical prototype [22,23]. Regardless of various attempts and existing subsidies (for subsidies, see [24,25]) to improve the profitability of FCT, there still exists a challenge to carry out a financially viable FCT, at least so that each actor (forest owner, forest machine contractor and forest industry company) involved would have a solid financial incentive to venture into business. Further, we consider that the scope of this study (to discover financial incentives related to participating actors of FCT) is eminently country-specific due to, e.g., different legal and operational practices between countries (see [18,24]) facing seemingly similar FCT problems. Thus, the primary goal is to discover the financial incentives associated with FCT country-wise, and only after comparing the results between countries.
In order to assess the financial viability of forest management in a theoretically sound way, one needs to apply stand-level optimization [26], through which the bare land value is maximized (e.g., [27]). In brief, maximizing the bare land value (BLV) yields the discounted economic surplus over an infinite time horizon [28]. In the case of rotation forestry, RF (for terminology, see, e.g., [29]) stand-level optimization reveals the timing and intensity of thinnings as well as the length of the rotation. In this study, the RF approach was adopted, and five options to conduct a FCT were simulated and further optimized (to maximize the BLV) for discovering their financial performance from the viewpoint of a private forest owner. The five options present commonly-used practices applied for FCT, ranging from pure industrial roundwood procurement to a ‘whole trees for energy wood’ alternative. The real-life data for the analyses were derived from a silvicultural database consisting of non-industrial private forest owners’ and NIPFs’ forests in Finland [30]. When stand-level optimization is executed by applying stumpage prices (here), the results, i.e., optimal solutions, refer to the profitability from the private forest owner’s point of view (e.g., [31]).
Conducting a FCT requires that all agents involved find financial incentives to participate. Thus, a financially viable result for a private forest owner does not necessary guarantee that a FCT actually takes place—for example, if there is no economic incentive for a forest machine contractor to employ a thinning, i.e., cut the trees (cf. [32]). In this study, each optimal solution (from the private forest owner’s point of view) was further dismantled so that the diameter distribution of removed trees in FCT was used in calculating the logging costs (incl. cutting and forwarding) and logging revenues. Then, the five options were ranked according to financial feasibility related to logging, i.e., net revenues (gross revenues from logging—logging costs). Finally, the two different profitability measures (max BLV and net revenues from logging) were compared to find out whether any of the five options to conduct a FCT would generate financial incentives for a private forest owner and a contractor simultaneously.

2. Materials and Methods

2.1. Forest Data

The simulations and, further, the financial analyses were based on stand characteristics of six individual stands located in northern Finland (Figure 1). The six stands were derived from a database consisting of NIPF (non-industrial private forests) stands with an urgent need for the first commercial thinning, FCT [30]. The chosen stands belong to specific clusters of postponed FCTs. The clusters (consisting of individual stands) were derived from the project “Timber from postponed first thinnings in Northern Finland”, implemented by the Natural Resources Institute Finland (Luke) and Finnish Forest Centre (Metsäkeskus), and funded by the Centre for Economic Development, Transport and the Environment (ELY) of Northern Ostrobothnia. The stands were selected according to: (i) the stand has passed the juvenile development phase but is not yet a mature stand (technically representing category 2 or 3 in the Finnish system) and (ii) a FCT had been suggested to be conducted in the stand within the past five years. The six chosen stands were quite similar with respect to stem number (trees per hectare) and soil type, but there was a distinctive difference in basal area and mean diameter (DBH) among the stands (Table 1).

2.2. Simulations

For each stand, five options to conduct the first commercial thinning (FCT) were simulated. The FCT options were: (1) Industrial wood thinning with only two timber assortments, pulpwood and saw logs (traditional), (2) Integrated procurement of industrial and energy wood (integrated), (3) Energy wood thinning solely consisting of stems (energy wood, delimbed stems), (4) whole-tree energy wood thinning with energy price of 3 € m3 (energy wood, whole I) and (5) whole-tree energy wood thinning with energy price of 8 € m−3 (energy wood, whole II). Further, in options (2), (4) and (5), 30% of foliage and branches was assumed to be left on site after thinning, and in option (3) all, i.e., 100%, was assumed to be left. The timing and intensity of the first commercial thinning according to the above-mentioned options (1–5) were obtained through a stand-level optimization. For the rest of the rotation, the management regime was unbounded, i.e., the optimization algorithm sought the management regime (a solution) which resulted in the maximum value of discounted net revenues (see, e.g., [4,26]). In brief, the first commercial thinning was constrained to be conducted according to five predetermined options, the optimization algorithm only seeking the optimal timing and intensity for the first commercial thinning while for the rest of the rotation the optimization algorithm sought the optimal solution freely, without any constraints. The rationale was to discover which option to conduct the first commercial thinning would financially outperform other options.
Technically, the simulations (stand projections) were conducted by a Motti stand simulator, so that the simulator provided the objective function values for the optimization algorithm PIKAIA (see [34] for detailed technical description and [35] for an application of PIKAIA in forestry) to seek the maximum of net present values. An identical approach has been applied earlier, see, e.g., [4,27]. Since the simulations—as well as the optimization—started with a standing timber (see [36]), we had to conduct both the simulations and optimization separately for the ongoing rotation and for the future generations, and then sum up the results.
Motti is a stand-level decision-support tool for assessing the effects of forest management on stand dynamics [37,38,39]. In brief, Motti consists of two sets of models: stand-level and individual-level tree models, both based on an empirical–statistical modelling approach. Natural regeneration and early growth models are based on stand-level modelling, while for mature trees (Hdom > 7 m) predictions are simulated according to individual-tree models [40]. The Motti stand simulator has been widely applied in discovering various effects of forest management in boreal forests (to name a few, bioenergy: [19], peatland forestry: [41], biodiversity: [42], carbon policy: [39,43] and peatland cutaways: [44]). In addition, the Motti stand simulator has been applied in stand-level optimization, as well [4,31,35,39,45].

2.3. Financial Analyses

2.3.1. Private Forest Owner

The profitability for a private forest owner was assessed by applying the optimization algorithm integrated into the Motti stand simulator, as described above. The optimization problem was described as a discrete-time system of state and control variables (see, e.g., [39], [46]). Since the simulations and optimization started with an ongoing generation, juvenile stands (resulting in different time horizons) had to be explicitly separated from the ongoing rotation of future generations. This was accomplished by the following: First, we had to maximize the net present value of bare land over an infinite time horizon to correspond with future tree generations. For that purpose, let Z t i describe a stand state before the ith thinning at stand age ti, I = 0, …, T (so that tT presents the time for clear-cut and t0 a bare land). Further, Z t i denotes the growing stock (expressed as m3 ha−1) which is a result of earlier thinnings and tree growth and is further affected by silvicultural measures s c s t l , such as precommercial thinning occurring at time tl = 0, … M. Then, k presents timber assortments (k = 1, …, K) and a stumpage price (€ m−3); for each timber assortment, k is denoted by pk. Let b be the discount factor s.t. b = 1/(1 + r), where r is the interest rate in real terms (i.e., without inflation). The removal (in m3) of each timber assortment k in ith thinning is denoted by hki. Thinning intensity (removal relative to growing stock) in ith thinning is gi, so that gT = 100%. Stand establishment costs (at time t0) are denoted by w, reflecting a fixed amount of seedlings and a fixed cost of site preparation in artificial regeneration, according to prevailing silvicultural guidelines [47]. Optimized variables include the number of thinnings, the timing of thinnings, the intensity of thinnings, the number and timing of silvicultural measures, and the rotation period. Applying the [28] rotation model, the objective function is to maximize the net present value of bare land over an infinite time horizon:
M a x L E V { t i , T , g i , M , s c s t i } = i = 0 T b t i k = 1 K p k h k i ( Z t i , g i ) l = 0 M b t l s = 1 S S C s t l w 1 b t T
For the ongoing rotation, including the five options for the first commercial thinning, stand management was optimized by maximizing the net present value, NPV. The starting point for simulation differed among the stands due to stand characteristics (see Table 1), a priori resulting in different timing for clear-cutting of the ongoing rotation. Since the time horizon might vary among simulated management regimes of the ongoing rotation, the discounted MaxLEV (Equation (1)) was included into the financial analysis commensurate with the management regimes (see [26] for technical details). Finally, the financial performance associated with the five management regimes was assessed according to:
M a x N P V p { t i , T , g i , M , s c s t i } = i > 0 T b t i n k = 1 K p k h k i ( Z t i n , g i ) + b t T n ( m a x L E V )
where MaxNPVp represents the maximum net present value according to an option p for the first commercial thinning, p = 1, …, 5 and n is the stand age (in years) at the starting point of the simulation in ongoing rotation (Note that there are no silvicultural measures in ongoing rotation, since the starting point in each stand 1–6 is beyond a tending phase (see Table 1)).

2.3.2. Contractor

Having achieved the MaxNPV through stand-level optimization (Equations (1) and (2)), the first commercial thinning was further dissolved into diameter distributions, enabling the calculation of the logging costs. In this study, we assume that the contractor is an independent operator seeking a profit on procuring the feedstock (industrial timber, energy wood or both depending on the option) to market (see, e.g., [32]). Further, we apply roadside prices for industrial timber and price of delivery sales for energy wood (see Section 2.4 for detailed values). Then, the profitability of the first commercial thinning for a contractor is:
p = k = 1 K h k p k k = 1 K v k
where Πp is the profit of FCT option p, p = 1, …, 5, hk is the harvested amount h of timber assortment k (m3 ha−1), pk’ is the roadside unit price for timber assortment k (€ m−3) and vk is the logging cost (incl. cutting and forwarding) associated with the harvested hk (€ ha−1). The cutting productivities in all options were calculated by applying the time consumption model of [21]. The forwarding productivity of industrial roundwood and delimbed energy wood was calculated using the model of [48]. When forwarding whole trees and tree tops the function of [49] was applied. The load size of the medium-sized forwarder was set at 9.3 m3 for industrial roundwood and delimbed energy wood, 6.5 m3 for whole trees and 4.7 m3 for undelimbed tree tops [49,50]. The total length of the strip road network at stand was assumed to be 600 m ha−1, based on an average strip road spacing of 20 m [51]. The productive machine hour (PMh) productivities of harvester and forwarder were converted to operating hour productivities—also known as scheduled machine hour (SMh) productivity—by the coefficients of 1.39 and 1.30 [52]. The hourly cost of a thinning harvester and a medium-sized forwarder were 102.3 € SMh−1 and 81.0€ SMh−1 [53]. The logging costs associated with each option 1–5 were calculated according to the above-mentioned values.

2.4. Economic Data

Financial analysis conducted for the private forest owner’s viewpoint was based on stumpage prices (Lapland) and silvicultural costs derived from a nominal time series of 2015–2019 [54], representing the latest available statistics during the preparation of this study. Annual roadside prices and quarterly price of energy wood time series covering years 2015–2019 were applied to assess contractor’s revenues. The nominal time series was deflated by the cost-of-living index [55] to attain real prices and costs (Table 2). Then, for option 4 (energy wood, whole I) and option 5 (energy wood, whole II) unit prices of 3 and 8 € m−3 were applied in the first commercial thinning, respectively.

3. Results

3.1. Logging Costs

The resulting logging costs (reflecting the optimal first commercial thinning) are presented in Table 3. The lowest logging costs (expressed in € m−3, incl. cutting and forwarding) were for energy wood, whole II where the stumpage price of energy wood was set to 8 € m−3 for a private forest owner. The highest logging costs were associated with traditional and industrial wood procurement (Table 3).

3.2. Growth and Yield

As expected, the timing of the final cutting of the ongoing rotation fluctuated considerably, depending on the option (1–5) used to conduct the first commercial thinning (Figure 2, Table 4). For simplicity, optimal management associated with options 1–5 is presented only for stand 1 (Figure 2). In the integrated option (option number 2) the optimal rotation was 94 years, while in option 5 (energy wood, whole II) the corresponding rotation was as high as 107 years (Figure 2). Options 1 (traditional) and 3 (energy wood, stems) resulted in almost identical rotation periods of 101 and 102 years, respectively (Figure 2).
On average, the integrated option (2) resulted in the highest cutting removal at the first thinning: 75.8 m3 ha−1 (Table 4). The lowest cutting removal at the first thinning was associated with option 3 (energy wood, stems), 50.8 m3 ha−1 (Table 4). However, with respect to total cutting removal of the ongoing rotation, the options 1–5 were quite close to each other, the range being from app. 310 to 326 m3 ha−1 (Table 4). For the future generations, the rotation period varied only mildly: from app. 83 to 87 years depending on the option (Table 4). The cutting removals of future generations, however, fluctuated a bit more, relatively: from ca. 376 to 407 m3 ha−1 (Table 4).

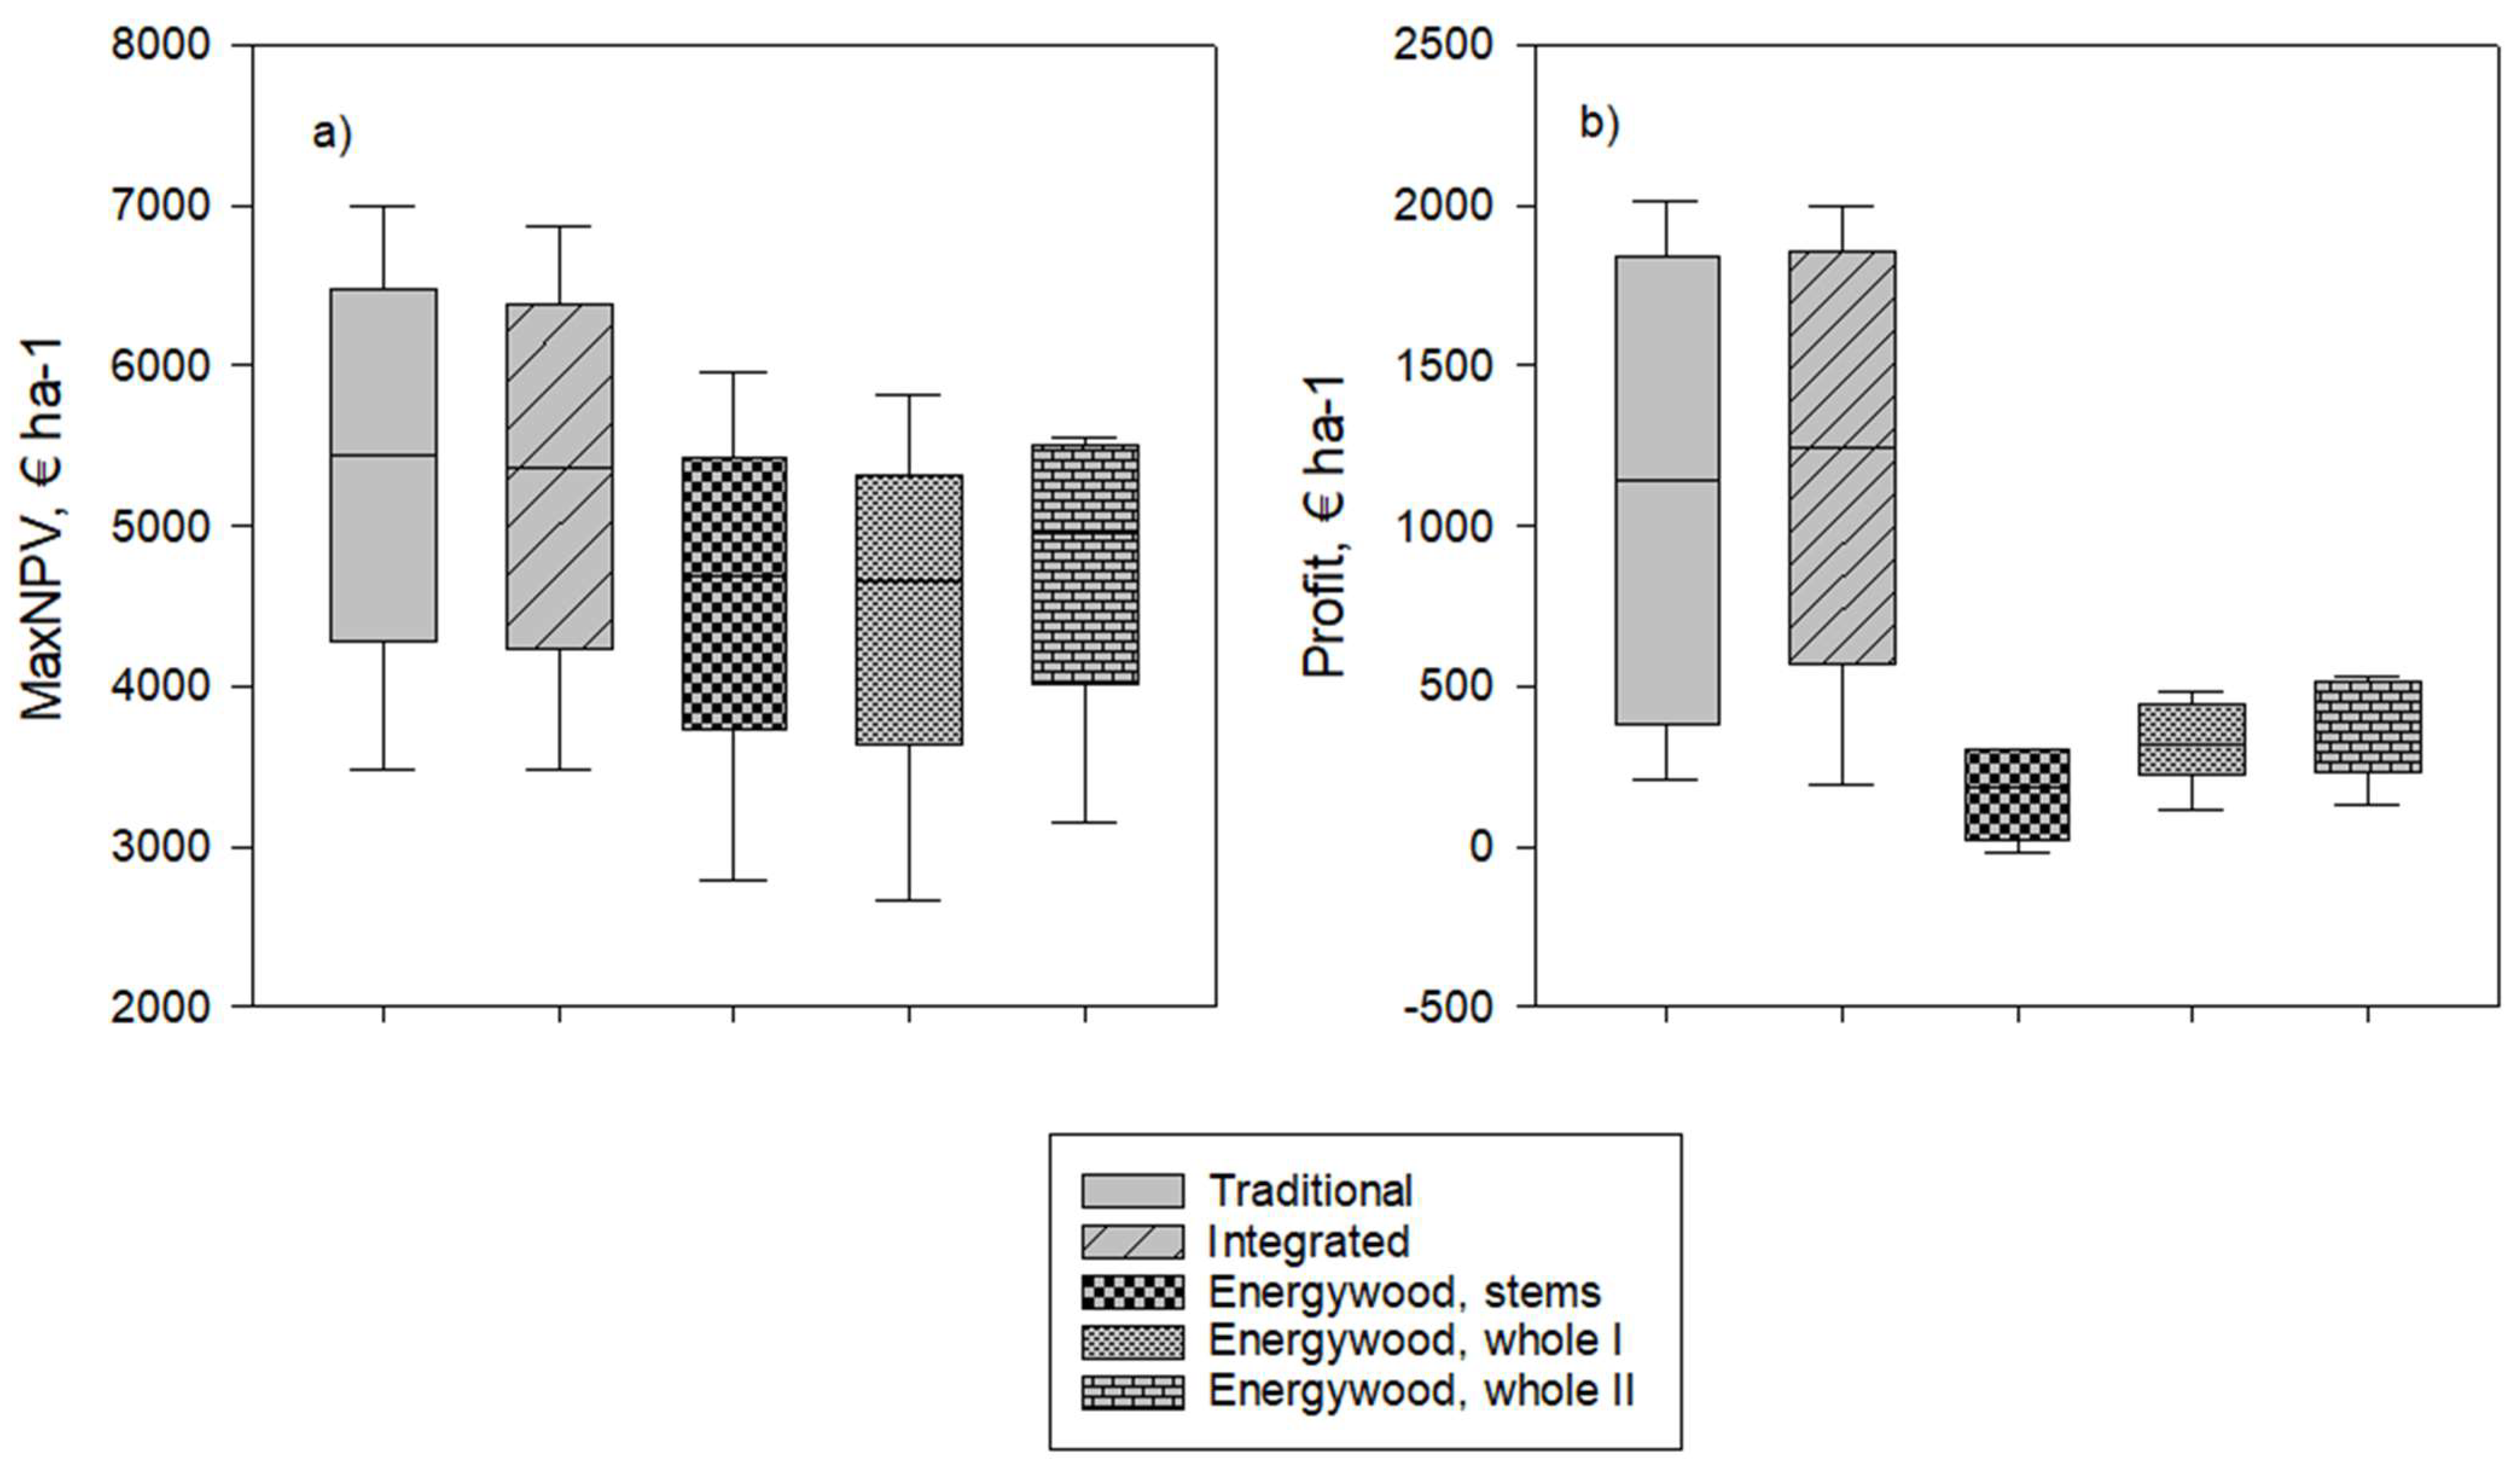
3.3. Financial Performance

From the private forest owner’s point of view, the best performer (expressed as MaxNPV, Equation (2)) was option 1, traditional, where only saw logs and pulpwood are procured (Figure 3a). For instance, the highest MaxNPV was reached with option 1, the value of 6999 € ha−1, while the lowest MaxNPV value was associated with option 4 (Energy wood, whole I), 2665 € ha−1 (Figure 3a). For pure energy wood alternatives (option 3, 4 and 5), the best performer was option 5 (energy wood, whole II) with a median of 4879 € ha−1 (Figure 3a). Two options (traditional and integrated, options 1 and 2, respectively) distinctively outperformed the other three options (3, 4 and 5) from the contractor’s point of view (Figure 3b). The highest profit among the six stands for a contractor at the first thinning was as much as ca. 2000 € ha−1 in option 1 (traditional), while in option 3 (energy wood, stems) a contractor might even operate at a loss (Figure 3b). Further, in option 4 (energy wood, whole I) and 5 (energy wood, II) the contractor barely makes a profit at the first commercial thinning (Figure 3b).

4. Discussion

It is a known fact that the profitability of timber harvesting improves with increased stem volume and removal of harvested trees per hectare, indicating that the profitability would be better in clearcutting (e.g., progressive strip clearcut system) than in, e.g., the first commercial thinning or shelterwood cutting, especially in peatland forests (for a concise literature on the topic, see [56]). Thus, the first commercial thinning in even-aged boreal forests can be challenging with respect to financial performance—to find a profitable option depends both on the harvesting method and stand characteristics (e.g., [22,52,57,58,59]). It appears that there is no generic method applicable, rather, one has to choose a management option conditional on stand characteristics (such as stand density and average stem volume). Further, there is a lack of papers which would tackle the problem of the first thinning by applying a stand-level optimization (cf. [59])—to our knowledge this study is the first attempt in boreal forests (cf. [60,61]).
This study focused on the profitability of the first commercial thinning by introducing a stand-level optimization with five predetermined options to conduct the first thinning. The rationale was to discover the best financial outcome for a private forest owner to conduct the first commercial thinning, and then to find out whether the solution would be financially viable for a contractor, as well (for a similar approach dealing with simultaneous financial incentives, see [32,45]). The optimization algorithm primarily solved the timing and intensity of the first thinning (according to the constraints relevant for each option 1–5), and, secondarily, the timings and intensity of other thinnings and the timing for a clearcut in ongoing rotation. Additionally, the bare land value (reflecting future tree generations) was maximized through optimization (see, e.g., [26,46,62]), and it was further summed up with the financial result of the ongoing rotation. The five options to conduct the first commercial thinning can be seen as good representatives of the current practices applied in Finnish forestry, ranging from pure industrial wood procurement to a whole-tree energy wood option. Further, the stands (to be simulated) were derived from an updated database of postponed FCTs, with the emphasis on hot issues (timing and intensity) associated with the FCT.
Since first commercial thinning (FCT) is, in practice, the first silvicultural action to generate immediate income to a forest owner [63,64], it would be reasonable to maximize the profit associated with the FCT as well. Among the five options (technically, set-ups) to conduct the FCT, the best financial performer from the private forest owner’s point of view was traditional procurement focusing solely on industrial wood, i.e., saw logs and pulpwood. This option financially outperformed the other four, indicating also that the result would hold for the rest of the ongoing rotation as well as for future rotations. Earlier studies (e.g., [14,20])—without applying a stand-level optimization—somewhat contradict this outcome, suggesting that integrated harvesting (procuring both pulpwood and energy wood) in the first thinning would be financially feasible to apply. In this connection, however, it should be highlighted that we ignored the effect of stem quality and the spatial distribution of remaining trees. The former relates to the fact that different thinning methods applied in the FCT usually generate slightly different overall stem quality in the future [60], resulting in a different timber grade distribution in thinnings and clearcut [65]. This has a clear effect on stand-level optimum and financial performance, as well [46]. The latter (spatial distribution) refers to sufficient dominant and co-dominant crop trees left growing in the FCT, and the spatial arrangement which either contributes to or debilitates that, depending on the applied thinning method in FCT [61]. Further, forest management (e.g., in a form of alternative thinning profiles) has a clear impact on abiotic and biotic risks related to forestry [66]. Namely, it has been demonstrated that stand-level optimization with distance-dependent growth models (including spatial distribution) results in a different outcome than that with distance-independent growth models [67].
Having resolved the optimal management for a private forest owner through stand-level optimization, the next step was to check whether the solution would be financially desirable for a contractor, too. Thus, we analysed the optimal solutions of each stand (1–6) by dismantling the thinning removal of the FCT into diameter distribution and, further, into cutting incomes and logging costs associated with the contractor responsible for the procurement. The results of those analyses revealed that two options were distinctively better performers than the other three. Namely, the traditional and integrated options (options 1 and 2, respectively) were, financially, the most attractive for a contractor, resulting in profits from the FCT in each stand simulated. This result was clear, since the other three options (options 3, 4 and 5) even generated losses for a forest machine contractor and were, generally, distinctively less attractive with respect to financial outcome. Combining the results from the stand-level optimization (private forest owner) and the profitability analysis of the CFT (contractor), one could conclude that there might be a win-win option, or even two win-win options, applicable to conduct the FCT, namely traditional (solely industrial timber) and integrated procurement of industrial timber and energy wood.
Then, the interpretation of the results is conditional for separate issues. First, the simulations started with ongoing stands, implying that the stand development might have already departed from an optimal path (e.g., [68]). However, the more important topic (than starting from bare land—see [26]) was to describe presentable cases of typical postponed FCTs and to discover the best financial management option to conduct a postponed FCT. Then, the results are conditional to applied supply chains (time consumption related to machinery in cutting and to the forwarder), reflecting the productivity of the applied machinery. In this study, we applied time consumption models and productivity parameters based on studies [21,48,49,50,52] which might be considered a bit outdated. Undoubtedly, there has been some progress (improvements) in operators’ professional skills, technical solutions and changes in the working environment during the last decade. However, a recent study on the integrated harvesting of industrial roundwood and energy wood (clearcuttings on peatland) demonstrates that the models applied in this study would not drastically differ in terms of harvesting productivity from the latest models available [56]. Third, harvesting trees with branches reduces the quality of the chips, but this is a critical issue only for small heating plants, which require stick free chips to operate properly [12]. Further, whole tree harvesting indicates somewhat higher chipping and transportation costs than supply chains based on delimbed wood material [12].
Finally, although we found a win-win situation (financial incentives for both participants, private forest owner and contractor), for conducting a FCT the ultimate decision is vitally dependent on the market situation: is there enough demand for roundwood at the regional level [69] and, evidently, at a global scale [70]? Further, integration of roundwood markets between countries (namely, Sweden and Finland) might generate a boost to local timber supply, as well [71].

Author Contributions

Conceptualization, A.A. and J.L.; methodology, A.A. and J.L.; software, A.A..; validation, A.A., M.-L.P., A.H. and J.L; formal analysis, A.A. and J.L.; investigation, A.A.; resources, M.-L.P. and A.H.; data curation, A.A., A.H. and M.-L.P.; writing—original draft preparation, A.A.; writing—review and editing, A.A., A.H., J.L. and M.-L.P.; visualization, A.A. and A.H.; project administration, M.-L.P.; funding acquisition, A.A. and M.-L.P. All authors have read and agreed to the published version of the manuscript.

Funding

This research was funded by the European Regional Development Fund administered via Lapland and North Ostrobothnia Centres for Economic Development, Transport and the Environment, ELY (grant number A73917) and the APC was funded by the Natural Resources Institute Finland (Luke).

Institutional Review Board Statement

Not applicable.

Informed Consent Statement

Not applicable.

Data Availability Statement

Not applicable.

Acknowledgments

We’d like to thank Aapeli Leminen at Forest Centre for generating an excellent map (Figure 1).

Conflicts of Interest

The authors declare no conflict of interest.

References

  1. Ihalainen, A.; Mäki-Simola, E.; Sauvula-Seppälä, T.; Torvelainen, J.; Uotila, E.; Vaahtera, E.; Ylitalo, E. (Eds.) Finnish Forest Resources; Natural Resources Institute Finland (Luke): Helsinki, Finland, 2019; p. 198. [Google Scholar]
  2. Korhonen, K.T.; Ihalainen, A.; Ahola, A.; Heikkinen, J.; Henttonen, H.M.; Hotanen, J.-P.; Nevalainen, S.; Pitkänen, J.; Strandström, M.; Viiri, H. (Eds.) Suomen Metsät 2009–2013 ja Niiden Kehitys 1921–2013; Natural Research Institute Finland: Helsinki, Finland, 2017; p. 86. [Google Scholar]
  3. Korhonen, K.T.; Ihalainen, A.; Strandström, M.; Salminen, O.; Hirvelä, H.; Härkönen, K. Riittääkö puu—VMI-tulokset. In 61. Lapin Metsätalouspäivät, Rovaniemi; METO—Metsäalan Asiantuntijat ry: Helsinki, Finland, February 2019. [Google Scholar]
  4. Ahtikoski, A.; Hökkä, H. Intensive forest management—Does it financially pay off on drained peatlands? Can. J. For. Res. 2019, 49, 1101–1113. [Google Scholar] [CrossRef]
  5. Karttunen, K.; Ahtikoski, A.; Kujala, S.; Törmä, H.; Kinnunen, J.; Salminen, H.; Huuskonen, S.; Kojola, S.; Lehtonen, M.; Hynynen, J.; et al. Regional socio-economic impacts of intensive forest management, a CGE approach. Biomass Bionerg. 2018, 118, 8–15. [Google Scholar] [CrossRef] [Green Version]
  6. Assman, E. The Principles of Forest Yield Study—Studies in the Organic Production, Structure, Increment and Yield of Forest Stands; Pergamon Press: Oxford, UK, 1970; pp. 1–506. [Google Scholar]
  7. Hakkila, P. Ensiharvennuspuun hyödyntäminen (Utilization of roundwood from first thinnings). Folia Forestalia 1996, 428–433. [Google Scholar]
  8. Stöd, R.; Siren, M.; Tanttu, V.; Verkasalo, E. Jäävän puuston ja poistuman tekninen laatu ensiharvennusmänniköissä (Technical quality of remaining trees after first thinning). Metsätieteen Aikakauskirja 2003, 2003, 6110. [Google Scholar]
  9. Nuutinen, Y.; Kärhä, K.; Laitila, J.; Jylhä, P.; Keskinen, S. Productivity of whole-tree bundler in energy wood and pulpwood harvesting from early thinnings. Scand. J. For. Res. 2011, 26, 329–338. [Google Scholar] [CrossRef]
  10. Mäkinen, H.; Hynynen, J. Wood density and tracheid properties of Scots pine: Responses to repeated fertilization and timing of the first commercial thinning. Forestry 2014, 87, 437–447. [Google Scholar] [CrossRef] [Green Version]
  11. Laitila, J.; Heikkilä, J.; Anttila, P. Harvesting alternatives, accumulation and procurement cost of small-diameter thinning wood for fuel in Central-Finland. Silva Fenn. 2010, 44, 465–480. [Google Scholar] [CrossRef] [Green Version]
  12. Laitila, J.; Väätäinen, K. Truck transportation and chipping productivity of whole trees and delimbed energy wood in Finland. Croat. J. For. Eng. 2012, 33, 199–210. [Google Scholar]
  13. Petty, A. Opportunities for Cost Mitigation and Efficiency Improvements through Ration Alization of Small-Diameter Energy Wood Supply Chains. Ph.D. Thesis, University of Eastern Finland, Joensuu, Finland, 2014. [Google Scholar]
  14. Karttunen, K.; Laitila, J.; Ranta, T. First-thinning harvesting alternatives for industrial or energy purposes based on regional Scots pine stand simulations in Finland. Silva Fenn. 2016, 50, 16. [Google Scholar] [CrossRef] [Green Version]
  15. Kärhä, K.; Jouhiaho, A.; Mutikainen, A.; Mattila, M. Mechanized energy wood harvesting from early thinnings. Int. J. For. Eng. 2005, 16, 15–26. [Google Scholar] [CrossRef]
  16. Heikkilä, J.; Siren, M.; Äijälä, O. Management alternatives of energy wood thinning stands. Biomass Bioenerg. 2007, 31, 255–266. [Google Scholar] [CrossRef]
  17. Ahtikoski, A.; Heikkilä, J.; Alenius, V.; Siren, M. Economic viability of utilizing biomass energy from young stands—The case of Finland. Biomass Bioenerg. 2008, 32, 988–996. [Google Scholar] [CrossRef]
  18. Laitila, J.; Väätäinen, K. Productivity and cost of harvesting overgrowth brushwood from roadsides and field edges. Int. J. For. Eng. 2021, 32, 140–154. [Google Scholar]
  19. Heikkilä, J.; Sirén, M.; Ahtikoski, A.; Hynynen, J.; Sauvula, T.; Lehtonen, M. Energy wood thinning as a part of the stand management of Scots pine and Norway spruce. Silva Fenn. 2009, 43, 129–146. [Google Scholar] [CrossRef] [Green Version]
  20. Kärhä, K. Integrated harvesting of energy wood and pulpwood in first thinnings using the two-pile cutting method. Biomass Bioenerg. 2011, 35, 3397–3403. [Google Scholar] [CrossRef]
  21. Laitila, J.; Väätäinen, K. Hakkuutyön tuottavuus metsävarustellulla turvetuotantotraktorilla karsitun aines- ja energiapuun korjuussa (The cutting productivity in integrated harvesting of pulpwood and delimbed energy wood with a forestry-equipped peat harvesting tractor). Suo Mires Peat 2013, 64, 97–112. [Google Scholar]
  22. Kärhä, K.; Jylhä, P.; Laitila, J. Integrated procurement of pulpwood and energy wood from early wood from early thinnings using whole-tree bundling. Biomass Bioenerg. 2011, 35, 3389–3396. [Google Scholar] [CrossRef]
  23. Nuutinen, Y.; Björheden, R. Productivity and work processes of small-tree bundler Fixteri FX15a in energy wood harvesting from early pine dominated thinnings. Int. J. For. Eng. 2016, 27, 29–42. [Google Scholar] [CrossRef]
  24. Petty, A.; Kärhä, K. Effect of subsidies on the profitability of energy wood production of wood chips from early thinnings in Finland. For. Policy Econ. 2011, 12, 575–581. [Google Scholar] [CrossRef]
  25. Ministry of Agriculture and Forestry of Finland. Available online: https://mmm.fi/en/forests (accessed on 19 May 2021).
  26. Amacher, G.S.; Ollikainen, M.; Koskela, E. Economics of Forest Resources; The MIT Press: Cambridge, MA, USA, 2009; pp. 1–448. [Google Scholar]
  27. Niinimäki, S.; Tahvonen, O.; Mäkelä, A. Applying a process-based model in Norway spruce management. For. Ecol. Manag. 2012, 265, 102–115. [Google Scholar] [CrossRef]
  28. Faustmann, M. Berechnung des Werthes, welchen Waldboden, sowie noch nicht haubare Holzbestände für die Waldwirthschaft besitzen. (Calculation of the value which forest land and immature stands possess for forestry). Allgemeine For. Jagd Zeitung 1849, 25, 441–455. [Google Scholar]
  29. Parkatti, V.-P.; Assmuth, A.; Rämö, J.; Tahvonen, O. Economics of boreal conifer species in continuous cover and rotation forestry. For. Policy Econ. 2019, 100, 55–67. [Google Scholar] [CrossRef]
  30. Finnish Forest Centre. Open Database on NIPFs’ Forests Including Silvicultural Status Associated with Each Stand. 2019. Available online: https://www.metsakeskus.fi/en/open-forest-and-nature-information/information-about-finnish-forests (accessed on 17 October 2019).
  31. Ahtikoski, A.; Karhu, J.; Ahtikoski, R.; Haapanen, M.; Hynynen, J.; Kärkkäinen, K. Financial assessment of alternative breeding goals using stand-level optimization and data envelopment analysis. Scand. J. For. Res. 2020, 35, 262–273. [Google Scholar] [CrossRef]
  32. Tharakan, P.J.; Volk, T.A.; Lindsey, C.A.; Abrahamson, L.P.; White, E.H. Evaluating the impact of three incentive program on the economics of cofiring willow biomass with coal in New York State. Energ. Policy 2005, 33, 337–347. [Google Scholar] [CrossRef]
  33. Tonteri, T.; Hotanen, J.P.; Kuusipalo, J. The Finnish forest site type approach: Ordination and classification studies of mesic forest sites in southern Finland. Vegetatio 1990, 87, 85–98. [Google Scholar] [CrossRef]
  34. Metcalfe, T.S.; Charbonneau, P. Stellar structure modeling using a parallel genetic algorithm for objective global optimization. J. Comp. Phys. 2003, 185, 176–193. [Google Scholar] [CrossRef] [Green Version]
  35. Ahtikoski, A.; Salminen, H.; Hökkä, H.; Kojola, S.; Penttilä, T. Optimising stand management on peatlands: The case of northern Finland. Can. J. For. Res. 2012, 42, 247–259. [Google Scholar] [CrossRef]
  36. Hyytiäinen, K.; Tahvonen, O. The effects of legal limits and recommendations on timber production: The case of Finland. For. Sci. 2001, 47, 443–454. [Google Scholar]
  37. Salminen, H.; Lehtonen, M.; Hynynen, J. Reusing legacy FORTRAN in the MOTTI growth and yield simulator. Comput. Electron. Agr. 2005, 49, 103–113. [Google Scholar] [CrossRef]
  38. Hynynen, J.; Salminen, H.; Ahtikoski, A.; Huuskonen, S.; Ojansuu, R.; Siipilehto, J.; Lehtonen, M.; Eerikäinen, K. Long-term impacts of forest management on biomass supply and forest resource development: A scenario analysis for Finland. Eur. J. For. Res. 2015, 134, 415–431. [Google Scholar] [CrossRef]
  39. Juutinen, A.; Ahtikoski, A.; Lehtonen, M.; Mäkipää, R.; Ollikainen, M. The impact of a short-term carbon payment scheme on forest management. For. Policy Econ. 2018, 90, 115–127. [Google Scholar] [CrossRef]
  40. Hynynen, J.; Salminen, H.; Huuskonen, S.; Ahtikoski, A.; Ojansuus, R.; Siipilehto, J.; Lehtonen, M.; Rummukainen, A.; Kojola, S.; Eerikäinen, K. Scenario Analysis for the Biomass Supply Potential and the Future Development of Finnish Forest Resources; Working Papers of the Finnish Forest Research Institute 302; Natural Resources Institute Finland (Luke): Helsinki, Finland, 2014; Unpublished work. [Google Scholar]
  41. Kojola, S.; Ahtikoski, A.; Hökkä, H.; Penttilä, T. Profitability of alternative management regimes in Scots pine stands on drained peatlands. Eur. J. For. Res. 2012, 131, 413–426. [Google Scholar] [CrossRef]
  42. Mönkkönen, M.; Juutinen, A.; Mazziotta, A.; Miettinen, K.; Podkopaev, D.; Reunanen, P.; Salminen, H.; Tikkanen, O.-P. Spatially dynamic forest management to sustain biodiversity and economic returns. J. Environ. Manag. 2014, 134, 80–89. [Google Scholar] [CrossRef]
  43. Helin, T.; Salminen, H.; Hynynen, J.; Soimakallio, S.; Huuskonen, S.; Pingound, K. Global warming potentials of stemwood used for energy and materials in Southern Finland: Differentiation of impacts based on type of harvest and product lifetime. GCB Bioenergy 2016, 8, 334–345. [Google Scholar] [CrossRef]
  44. Aro, L.; Ahtikoski, A.; Hytönen, J. Profitability of growing Scots pine on cutaway peatlands. Silva Fenn. 2020, 54, 18. [Google Scholar] [CrossRef]
  45. Ahtikoski, A.; Haapanen, M.; Hynynen, J.; Karhu, J.; Kärkkäinen, K. Genetically improved reforestation stock provides simultaneous benefits for growers and a sawmill, a case study in Finland. Scand. J. For. Res. 2018, 33, 484–492. [Google Scholar] [CrossRef]
  46. Tahvonen, O.; Pihlainen, S.; Niinimäki, S. On the economics of optimal timber production in boreal Scots pine stands. Can. J. For. Res. 2013, 43, 719–730. [Google Scholar] [CrossRef]
  47. The Forestry Development Centre Tapio. Metsänhoidon Suositukset; Äijälä, O., Koistinen, A., Sved, J., Vanhatalo, K., Väisänen, P., Eds.; The Forestry Development Centre Tapio: Helsinki, Finland, 2014; p. 136. [Google Scholar]
  48. Nurminen, T.; Korpunen, H.; Uusitalo, J. Time consumption analysis of the mechanized cut-to-length harvesting system. Silva Fenn. 2006, 40, 335–363. [Google Scholar] [CrossRef] [Green Version]
  49. Laitila, J.; Asikainen, A.; Nuutinen, Y. Forwarding of whole trees after manual and mechanized felling bunching in pre-commercial thinnings. Int. J. For. Eng. 2007, 18, 29–39. [Google Scholar] [CrossRef]
  50. Laitila, J.; Niemistö, P.; Väätäinen, K. Productivity of multi-tree cutting in thinnings and clear cuttings of young downy birch (Betula pubescens) dominated stands in the integrated harvesting of pulpwood and energy wood. Balt. For. 2016, 22, 116–131. [Google Scholar]
  51. Niemistö, P. Runkolukuun perustuvat harvennusmallit. In Thinning Models Based on the Number of Stems; Research Papers 432; Finnish Forest Research Institute: Helsinki, Finland, 1992; p. 18. [Google Scholar]
  52. Jylhä, P.; Dahl, O.; Laitila, J.; Kärhä, K. The effect of supply system on the wood paying capability of a kraft pulp mill using Scots pine harvested from first thinnings. Silva Fenn. 2010, 44, 695–714. [Google Scholar] [CrossRef] [Green Version]
  53. Laitila, J.; Ahtikoski, A.; Repola, J.; Routa, J. Pre-feasibility study of supply systems based on artificial drying of delimbed stem forest chips. Silva Fenn. 2017, 51, 5659. [Google Scholar] [CrossRef] [Green Version]
  54. Luke (Natural Resources Institute Finland). Statistics Database; Natural Resources Institute Finland: Helsinki, Finland, 2020; Available online: https://statdb.luke.fi/PXWeb/pxweb/en/LUKE/?rxid=9dc1d1ef-f143-49af-aff3-61e935eadc8f (accessed on 14 September 2020).
  55. Statistics Finland. Consumer Price Index Release, Appendix table 3, Cost-of-living Index 1951:10=100. 2020. Available online: https://www.stat.fi/til/khi/2017/11/khi_2017_11_2017-12-14_tau_003_en.html (accessed on 16 September 2020).
  56. Laitila, J.; Väätäinen, K.; Kilpeläinen, H. Integrated harvesting of industrial roundwood and energy wood from clearcutting of a Scots pine-dominated peatland forest. Int. J. For. Eng. 2020, 31, 19–28. [Google Scholar] [CrossRef]
  57. Di Fulvio, F.; Kroon, A.; Bergström, D.; Nordfjell, T. Comparison of energy wood and pulpwood thinning systems in young birch stands. Scand. J. For. Res. 2011, 26, 339–349. [Google Scholar] [CrossRef] [Green Version]
  58. Di Fulvio, F.; Bergström, D. Analyses of a single-machine system for harvesting pulpwood and/or energy-wood in early thinnings. Int. J. For. Eng. 2013, 24, 2–15. [Google Scholar] [CrossRef]
  59. Karlsson, L.; Nyström, K.; Bergström, D.; Bergsten, U. Development of Scots pine stands after first biomass thinning with implications on management profitability over rotation. Scand. J. For. Res. 2015, 30, 416–428. [Google Scholar] [CrossRef]
  60. Niemistö, P.; Kilpeläinen, H.; Poutiainen, E. Effect of first thinning type and age on growth, stem quality and financial performance of a Scots pine stand in Finland. Silva Fenn. 2018, 52, 21. [Google Scholar] [CrossRef] [Green Version]
  61. Nuutinen, Y.; Miina, J.; Saksa, T.; Bergström, D.; Routa, J. Comparing the characteristics of boom-corridor and selectively thinned stands of Scots pine and birch. Silva Fenn. 2021, 55. [Google Scholar] [CrossRef]
  62. Assmuth, A.; Tahvonen, O. Optimal carbon storage in even- and uneven-aged forestry. For. Policy Econ. 2018, 87, 93–100. [Google Scholar] [CrossRef] [Green Version]
  63. Huuskonen, S.; Ahtikoski, A. Ensiharvennuksen ajoituksen ja voimakkuuden vaikutus kuivahkon kankaan männiköiden tuotokseen ja tuottoon. (The effect of the timing and intensity of the first thinning on the wood yield and economic yield of a pine stand on a fairly dry forest site type). Metsätieteen Aikakauskirja 2005, 2, 99–115. [Google Scholar]
  64. Huuskonen, S.; Hynynen, J. Timing and intensity of precommercial thinning and their effects on the first commercial thinning in Scots pine stands. Silva Fenn. 2006, 40, 645–662. [Google Scholar] [CrossRef] [Green Version]
  65. Ojansuu, R.; Mäkinen, H.; Heinonen, J. Including variation in branch and tree properties improves timber grade estimates in Scots pine stands. Can. J. For. Res. 2018, 48, 542–553. [Google Scholar] [CrossRef]
  66. Viiri, H. Parantaako vai heikentääkö metsänhoito metsien kestävyyttä metsätuhoja vastaan? (Does forest management in general improve or weaken the resilience towards abiotic and biotic damages?). Metsätieteen Aikakauskirja 2020. [Google Scholar] [CrossRef]
  67. Pukkala, T.; Miina, J.; Kurttila, M.; Kolström, T. A spatial yield model for optimizing the thinning regime of mixed stands of Pinus sylvestris and Picea abies. Scand. J. For. Res. 1998, 13, 31–42. [Google Scholar] [CrossRef]
  68. Hyytiäinen, K.; Ilomäki, S.; Mäkelä, A.; Kinnunen, K. Economic analysis of stand establishment for Scots pine. Can. J. For. Res. 2006, 36, 1179–1189. [Google Scholar] [CrossRef]
  69. Schwab, O.; Bull, G.; Maness, T. A mill-specific roundwood demand equation for southern and central Finland. J. For. Econ. 2005, 11, 95–106. [Google Scholar] [CrossRef]
  70. Morland, C.; Schier, F.; Janzen, N.; Weimar, H. Supply and demand functions for global wood markets: Specification and plausibility testing of econometric models within the global forest sector. For. Policy Econ. 2018, 92, 92–105. [Google Scholar] [CrossRef]
  71. Chudy, R.P.; Hagler, R.W. Dynamics of global roundwood prices—Cointegration analysis. For. Policy Econ. 2020, 115, 102155. [Google Scholar] [CrossRef]
Figure 1. A map presenting the locations of Stands 1–6 under study.
Forests 12 01389 g001
Figure 2. Volume of a growing stock associated with option 1 (traditional), 2 (integrated), 3 (energy wood, stems), 4 (energy wood, whole I) and 5 (energy wood, whole II) according to stand-level optimization in stand 1, m3 ha−1.FCT conducted at the stand age between 54 and 59 years, depending on the option.
Forests 12 01389 g002
Figure 3. (a) Boxplots presenting the maximum NPV of options 1–5, € ha−1 (private forest owner’s viewpoint), and (b) profit associated with options 1–5 at the first commercial thinning (contractor’s point of view). (Note that bottom edge of each box illustrates the 25th percentile, upper edge the 75th percentile, a line within a box marks the median and whiskers of the boxplots indicate 5th and 95th percentiles.)
Forests 12 01389 g003
Table 1. Stand characteristics of stands 1–6.
Stand NumberMain Tree SpeciesSite Type *Stem Number/haBasal Area, m2/haMean Height, mMean DBH **, cm
1Scots pineMT204424.639.5815.13
2Norway spruceMT143433.2814.0519.70
3Scots pineMT166425.9810.5715.58
4Norway spruceMT168935.6813.6718.33
5Norway spruceMtkg132032.9514.2920.21
6Norway spruceMtkg148126.7212.4717.71
* Myrtillus type (MT) on mineral soils and the corresponding site type on peatlands Myrtillus type (Mtkg) both indicate a fertile site type. For the Finnish forest site type classification, see [33]. ** Mean diameter at breast height.
Table 2. Stumpage prices (€ m−3), silvicultural costs (€ ha−1), roadside prices (€ m−3) and price of energy wood (€ m−3) in real terms (base year 2019). Price of energy wood is at roadside. Shading refers to prices applied only for a contractor.
Felling MethodPine LogsSpruce LogsBirch LogsPine PulpwoodSpruce PulpwoodBirch Pulpwood
Regeneration felling53.5451.7045.8618.3720.0117.53
Thinning47.1848.7838.5914.8516.2314.04
First thinning40.9042.6933.7612.3512.2112.23
First thinning
Roadside prices 1
57.3153.17--27.7932.12--
First thinning
Price of energy wood 2
23.1823.1823.1823.1823.1823.18
Silvicultural costs
Mounding405.90 € ha−1
Planting640.23 € ha−1
Seeding251.13 € ha−1
Early precommercial thinning369.96 € ha−1
Precommercial thinning452.68 € ha−1
Improvement of young stands458.64 € ha−1
1 roadside prices and the price of energy wood were applied when assessing the profitability for the contractor (see Equation (3)). 2 identical price applies for stem, foliage and branches.
Table 3. Average stem volumes (dm3), cutting removals (m3 ha−1) and logging costs (€ m−3) associated with the five options for first commercial thinning (FCT) according to stand-level optimization.
OptionStem/Tree Volume. dm3Cutting Removal. m3 ha−1Logging Cost. € m−3
Traditional129.58 (44.28) 164.44 (14.83) [19.6] 420.51 (2.94)
Integrated131.30 (35.05)75.81 (16.00) [18.9]19.97 (2.74)
Energy wood, d.tems 2110.67 (126.31)50.87 (6.60)20.10 (2.30)
Energy wood I 2138.30 (29.40)59.91 (7.92)17.97 (1.57)
Energy wood II 3145.00 (31.89)64.85 (8.68)17.66 (1.62)
1 in parenthesis standard deviation. 2 stumpage price of energy wood 3 € m−3. 3 stumpage price of energy wood 8 € m−3. 4 in brackets average saw timber removal of total cutting removal, traditional and integrated option, m3 ha−1.
Table 4. Thinning removal of the first thinning. Total cutting removal and rotation period associated with optimal solutions according to management options. Total cutting removal and rotation period associated with future generations also shown. Stand-level optimizations simulated with 3% interest rate.
StandManagement optionCutting Removal of the 1st Thinning, m3 ha−1Total Cutting Removal
m3 ha−1
Ongoing b Future c
Rotation Period,
yrs
Ongoing Future
Stand 1Traditional45.0 (0.0)279.1324.010198
Integrated54.0 (10.7) a266.2356.394104
Energywood stems46.0 (46.0)275.2304.710295
Energywood whole I52.0 (52.0)268.9346.3101102
Energywood whole II52.0 (52.0)299.2314.410796
Stand 2Traditional76.0 (0.0)303.7404.311078
Integrated88.0 (12.5)312.8381.011078
Energywood stems52.0 (52.0)311.9426.011181
Energywood whole I59.0 (59.0)319.2442.611183
Energywood whole II60.0 (60.0)315.8420.311080
Stand 3Traditional58.0 (0.0)352.0355.99187
Integrated69.0 (11.6)361.6369.99189
Energywood stems47.0 (46.6)352.3363.09187
Energywood whole I57.0 (56.8)362.8388.19191
Energywood whole II68.0 (67.9)364.0391.69192
Stand 4Traditional82.0 (0.0)325.3390.811279
Integrated95.0 (13.5)330.3414.611182
Energywood stems64.5 (64.5)320.9413.111082
Energywood whole I76.0 (75.7)335.9437.811285
Energywood whole II75.5 (75.5)332.4423.311183
Stand 5Traditional79.0 (0.0)304.7402.611078
Integrated91.0 (13.3)317.0413.811179
Energywood Stems51.0 (50.9)317.6425.711281
Energywood whole I63.0 (62.5)323.3442.811283
Energywood whole II75.0 (74.5)332.4423.311183
Stand 6Traditional48.0 (0.0)295.7381.211177
Integrated58.0 (9.5)325.5428.711181
Energywood Stems45.2 (45.0)298.2372.411176
Energywood whole I53.3 (53.0)303.8385.811178
Energywood whole II54.0 (53.6)312.6399.211480
Traditional64.4 (0.0) d310.1376.5105.882.8
Integrated75.8 (11.8)318.9395.4104.785.5
AverageEnergywood stems50.8 (50.8)312.7384.2106.383.7
Energywood whole I59.9 (59.9)319.0407.2106.387.0
Energywood whole II64.9 (64.9)326.1395.3107.385.7
a (of which energy wood). b ongoing rotation. c future rotations. d arithmetic average of stands 1–6.
Publisher’s Note: MDPI stays neutral with regard to jurisdictional claims in published maps and institutional affiliations.

