1. Introduction
In a world that is becoming dominated by spatial images of landscapes, maps continue to serve as a source of valuable information to society [
1]. Historically, through the inclusion and omission of features, color schemes, annotations, and other elaborations, maps inform and inspire [
2]. In a contemporary environment, maps support decisions related to resource allocation, assist in making management decisions, confirm tacit knowledge held by individuals or groups, and improve engagement with specific social communities [
3]. Maps are ubiquitous on the Internet, yet maps illustrating specific themes are often outdated, inconsistent, and inaccurate [
4]. Thus, the main drawback with maps is that they often represent the state of knowledge of a subject or resource at some specific point in time, and therefore can become outdated as our knowledge increases [
5]. Weather maps represent an extreme case of those needing frequent updates (perhaps on the order of minutes) as predictability of weather systems improves.
Maps illustrating the current distributions of plant and animal species are informative reference materials and robust conservation and decision-making tools [
6,
7]. These types of maps are different from maps found in forest plans, which contain specific information related to the management of land (property boundaries, locations of proposed management activities, habitat areas, etc.). A standard source of current tree range maps can be of value in supporting broad-scale decisions and informing debates over current and potential vegetation ranges. Natural and anthropogenic forces (e.g., changes in land uses) can also cause changes in tree ranges, even over a period as short as four decades [
7], which is nearly the amount of time that has passed since the development of the range maps used in
Silvics of North America (
SNA). The magnitude and directionality of changes to tree ranges in the current context of global change will likely vary by tree species, due to expansion [
8] and contraction [
9] of specific ranges, and uncertain linkages of range movement to climatic factors [
10]. New versions of standard maps may also be necessary when monitoring vital environmental conditions and when associated societal concerns are significant [
11]. Unless noted otherwise, discussed tree ranges refer to current, at the time of map development, tree distributions as indicated by species presence or absence data. In this respect, tree species presence or absence information can be used to develop range maps that simply reflect (a) the absolute presence or absence of a species. However, through geospatial analyses of the presence or absence information, new standard maps can be developed that reflect (b) a measure of suitability of lands for hosting a tree species or (c) the probability of presence of a tree species.
The development process for the maps that were included in
SNA was informed by field surveys, botanical lists, herbarium species, and expert opinion [
7]. At that time, the use of geospatial analyses involving information from national inventories was not possible. Since that time, others [
8,
9] have noted potential shifts in the natural range of North American tree species. In hindsight, the data gaps for informing the tree range maps used in
SNA are evident even though the information and technology were not available to address them, and as a result, one should assume that the maps each contain uncertainties.
For the reasons noted above, which indicate that standard tree range maps are useful reference materials for broad-scale conservation and decision-making purposes, the need for accurate range maps of North American trees is evident. In fact, a desire that has been expressed for nearly a century, as many may have been developed using incomplete or inadequate information [
12]. However, exact, precise information on tree species presence across the North American landscape is an elusive ideal. In the distant past, tree range maps were based on expert opinion and observation, incomplete botanical records, and inconsistent forest inventories [
9].
Tree range maps for a number of important species found in North America can be found on the SNA Internet site (
https://www.srs.fs.usda.gov/pubs/misc/ag_654/table_of_contents.htm, accessed on 7 October 2021) and in the original printed volumes (
Figure 1) [
13], or more directly at their original source [
14]. These range maps describe broad geographic extents for certain abundant tree species in North America, making it an important resource to consult when comparing the historical natural range of a species and the projected future range associated with potential impacts of climate change [
7]. The process for developing standard maps likely changes depending on the efforts pursued, as knowledge and technology evolves. The standards used in the development of the 1970s-era maps included a focus on a specific map scale and annotation that described the general landscape, with the goal of creating highly accurate maps that were intended to be widely accepted [
14]. As suggested earlier, knowledge of tree species ranges was gathered from subject area experts, field surveys, published works, older maps, and herbarium specimens. A process for generalizing the native range maps was followed so that intricate range detail would not be entirely lost, and so that irregularities in detail between different maps were minimized at the scale at which they were presented. Methods for addressing outlier observations, and for drafting preliminary maps indicating the native range of tree species, were also followed. These maps were displayed in panchromatic form at scales (1:10,000,000 to 1:30,000,000) appropriate to the amount of land coverage need for each species’ range [
7]. Within the maps, annotation and symbology were sufficient to understand the approximate natural range of each species at a broad scale. The tree ranges described in [
14] were eventually digitized and are now available as geographic information system (GIS) shapefiles. Electronic (digital) maps have some advantages over paper or scanned paper maps, including enhanced color resolution and quality, more frequent publication, the potential for correction and update, and improved viewing accessibility on computer devices [
4]. In addition, improvements in mapping processes (new data sources, different ways to handle uncertainty) can better represent a phenomenon across the landscape [
15]. Similarly, improvements in spatial resolution can assist in the identification of more specific places of interest [
16].
The frequency that reference maps are updated is affected by budgeting restrictions and the impression of scientific need held by funding agencies [
17]. These issues are intimately related to the availability of resources (people, data, etc.) for such an effort. Therefore, an important goal for organizations embarking on a major map revision shouldn’t focus only on their accuracy but also on their practicability through social values in the decision-making process [
18]. As such, organizations face issues involving the setting of human-capital priorities, which can be influenced by pressure exerted on the process by those who believe they have control over it [
19]. When funding, but not personnel, is dedicated to works like these, the use of a wide variety of experts becomes the main alternative. This distributed nature of work can result in product quality issues caused by inexperience, arbitrary protocols or lack of adherence to established protocols, and time constraints [
20]. At many scales and for several purposes, updating standard forest range maps is essential. Yet, the cost and effort incurred by those responsible for the effort will not be trivial [
21].
This research aimed to gauge the need for updated standard tree range maps for North American trees species through two surveys of stakeholders. One survey of registered foresters in four US states involved a specific, controlled sample frame. The second survey of a broader set of stakeholders throughout North America involved a less specific, uncontrolled sample frame. Each survey was identical, and the responses reflect a diverse set of values concerning tree range maps. The null hypothesis was that we would not observe overwhelming support for new tree range maps. A second hypothesis was that if support was observable for new maps, the suggestions would be minimal, essentially reflective of the need to adjust ranges based on more recent observations of tree species growing naturally in environments not reflected in the original maps [
14].
2. Materials and Methods
A survey instrument was developed to assess the opinions of forestry and natural resource professionals in North America concerning the broader
SNA publication and whether this reference work required an update. The research team developed an Internet-based survey using the Survey Monkey (
www.surveymonkey.com, accessed on 7 October 2021) platform. The research team initially designed the survey. Then it was reviewed by an independent, external group of stakeholders who provided valuable suggestions and adjustments. Finally, the University of Georgia Institutional Review board reviewed the survey, which determined it did not need human subjects’ approval before implementing.
Two sampling frames were developed, one where the members of the sampling frame were tightly controlled and another where this was not possible. The first was composed of 2589 registered foresters in four US States: North Carolina, Michigan, Mississippi, and Alabama. In our investigation, these were the only four states where (a) registration of foresters is required at the state level, and (b) contact information was freely available. Other US states either do not have a registration program for foresters, or the contact information was not freely available (e.g., California, Georgia, Mississippi, South Carolina). Contact information for potential respondents to the survey in the four selected states was accessible through state-managed Internet sites, which were assumed to contain correct and current e-mail addresses of the registered foresters. We assumed that the target population (foresters in the US) was somewhat synonymous with those included as potential respondents [
22]. When we failed to receive a response from a potential sample respondent, we treated this occurrence as a nonresponse. We then compared responses to a question from the survey (
Before this survey, were you aware of the publication SNA?) from the first 30 respondents against the responses of the last 30 respondents (who were assumed to be a proxy for non-respondents) to determine whether significant differences were evident [
23] using a chi-squared test of independence. We found that the differences between these two groups were not significant, and we therefore assumed nonresponse bias was not evident.
The second sampling frame consisted of members of the Ecological Society of America, the Society of American Foresters, the Canadian Institute of Forestry, the Forest Guild, and other groups. These groups would not provide direct contact information (e-mail addresses) about their members. However, they were willing to share a link to the survey with their members. Relationships were developed with representatives of these groups who had access to their members through e-mail newsletters and other means. These representatives were committed to forwarding our solicitation to their members on the day that the survey opened. Similarly, they committed to forwarding the reminder messages developed by the research team. Although our intent was to limit exposure of the survey to the membership of these organizations, due to the manner in which we were allowed to distribute the survey, this sampling frame was not tightly controlled. We noticed through e-mail inquiries that some organization members had forwarded the link to the survey to others around the world. Further, some duplication in sampling frame membership between the two surveys may have occurred, although we could not verify this to be the case. The presence of this duplication may have affected the response rate of one or the other surveys. However, only the response rate for the first survey could be determined. Therefore, although the integrity of the sampling frame was not as sound as that of the first survey, the feedback received was valuable in that it may represent a more diverse set (geographically, professionally) of stakeholders of SNA.
The survey structure began with questions regarding the basic demographics of the survey respondents (years of experience, educational level, current occupation, etc.). The survey then presented potential respondents with several questions regarding the content of SNA. One aim of the survey was to determine whether the life history descriptions of the North American tree species were sufficient. The sections of the life history descriptions include physiological information, damaging agents, genetic variants, and growth and yield, among others. This paper focuses on one specific question from the survey, and two potential follow-up questions, that were related directly to the status of the tree range maps.
When thinking about the maps contained in Silvics of North America, what is your opinion on the current range maps? (Keep current panchromatic maps, Remove the maps, Update the maps, Other (please specify))
If you think the current range maps should be removed, why? (check all that apply) (Ranges are changing too quickly to accurately maintain the maps; Ranges are too general; Ranges do not include areas where a species was introduced; Maps are already outdated; Ranges are incorrect, Other (please specify))
If you think that the current range maps should be updated, how should they be updated? (check all that apply) (Informing them with sources such as USDA FIA data or Canadian National Inventory data; Informing them with expert opinion; Adding color and other enhancements; Informing them with remote sensing sources; Other (please specify))
In association with these questions, we assumed that survey participants understood that all of the tree range maps might be updated. We employed skip logic in many instances to allow a survey participant to bypass questions that they did not want to answer for one reason or another. In some instances, a particular answer to a question would direct the survey respondent to a more in-depth set of questions related to their response. For example, if a respondent indicated that they did not feel that the tree range maps required updating, the respondent was directed to a follow-up question asking about the reasons for this opinion. Several questions within the survey involved a binary response (i.e., yes/no). In contrast, other questions prompted survey participants to select one or more responses from a list of potential responses. Further, several survey questions were designed to allow respondents to submit open-ended responses through a text box.
At approximately the same day and time, the survey solicitation was e-mailed to the two sampling frames. Per standard protocol, a second solicitation was e-mailed two weeks later. A final solicitation was e-mailed the day before the survey terminated. When possible, protocols were engaged to prevent duplicate contact with potential respondents once they had completed the survey.
Chi-squared tests were conducted to determine whether differences in demographic information existed between the two samples, using years of experience and educational level. For this analysis, non-response weights were not applied because the non-response information was lacking from one study and because the goal was to identify differences between the samples [
24]. A chi-squared test of independence was also employed to determine whether the demographic characteristics of the two groups (experience, education level, and region) influenced their response to the other questions. As in [
25,
26], a graphical comparison of the response distribution profiles of the two surveys was utilized as a tool to examine differences between samples. Opinions on whether the maps should be updated were then parsed (percent of respondents indicating “yes” to the answer) by experience and educational level. This information was then used to determine whether differences in characteristics of survey participants by experience and educational level were evident in the two samples [
24].
3. Results
The response rate for the first survey was about 13% of the registered foresters in North Carolina, Michigan, Mississippi, and Alabama (345 people). With the availability of skip logic, it was evident that a portion of the survey respondents were either unable or unwilling to answer every question posed. The response rate to the second, broader survey of professional organizations was unknown due to the reasons presented earlier. However, 524 people completed the second survey, and feedback from this second survey is valuable in that it might represent a more diverse set of stakeholders than the professional foresters from four states. In total, we received 698 total responses from both surveys.
Interestingly, approximately 45% of the first survey participants indicated being familiar with
SNA compared to 79% of the second survey participants. Therefore, knowledge of the set of tree range maps was lower amongst the practicing foresters. Of those respondents from the first survey, the majority had obtained at most a Bachelor’s degree (approximately 68% of the respondents) or a Master’s degree (approximately 26%). Of those respondents from the second survey, about 40% had obtained at most a Bachelor’s degree, 28% a Master’s degree, and 28% a Doctorate. Through a statistical and graphical comparison of the response distribution profiles of the two surveys, differences in the education level were observed between the two studies (
p < 0.05,
Figure 2). These educational differences may have influenced awareness of the tree range maps, as the results from the statistical tests indicated that education level and affirmative response (update the maps) were significantly associated regardless of the surveyed group (
p = 0.0124 for both surveys). However, we did not observe a similar relationship between an affirmative response and the level of experience of respondents in each survey.
With respect to the key survey question (keep, remove, or update the range maps), we received 248 responses (of 345 people) from the first survey and 450 responses (of 524 people) from the second. Interestingly, both surveys indicated an overwhelming affirmative response to update the tree range maps contained in SNA:
The survey of professional organizations (second survey) showed a higher inclination for updating the maps, which may be partly attributed to different demographics (wider geographic audience, education level) or familiarity with the reference work itself (
Figure 3). People with a longer professional history were less inclined (yet still overly supportive) of updating the maps, whereas there seemed to be little difference between people with only a Bachelor’s degree and people with a Master’s degree. Between the two samples, a statistically significant difference (
p < 0.05) in the proportion of respondents who indicated updating the maps was observed. Only three people (0.4%, total, from both surveys) suggested that the tree range maps should be removed from
SNA. We therefore reject the null hypothesis which indicated we would not observe overwhelming support for new tree range maps.
Although most respondents to the two surveys suggested that the tree range maps needed to be updated, some respondents suggested that the older maps, hand-drawn and based on expert opinion, were still of value. Perhaps this was because the older maps may facilitate some level of topical coverage depth and portrayal across time and space [
27]. With respect to the methods that might be employed in updating the tree range maps, several strategies were deemed important (
Table 1). Responses from the broader, second survey placed more emphasis on using each of these strategies.
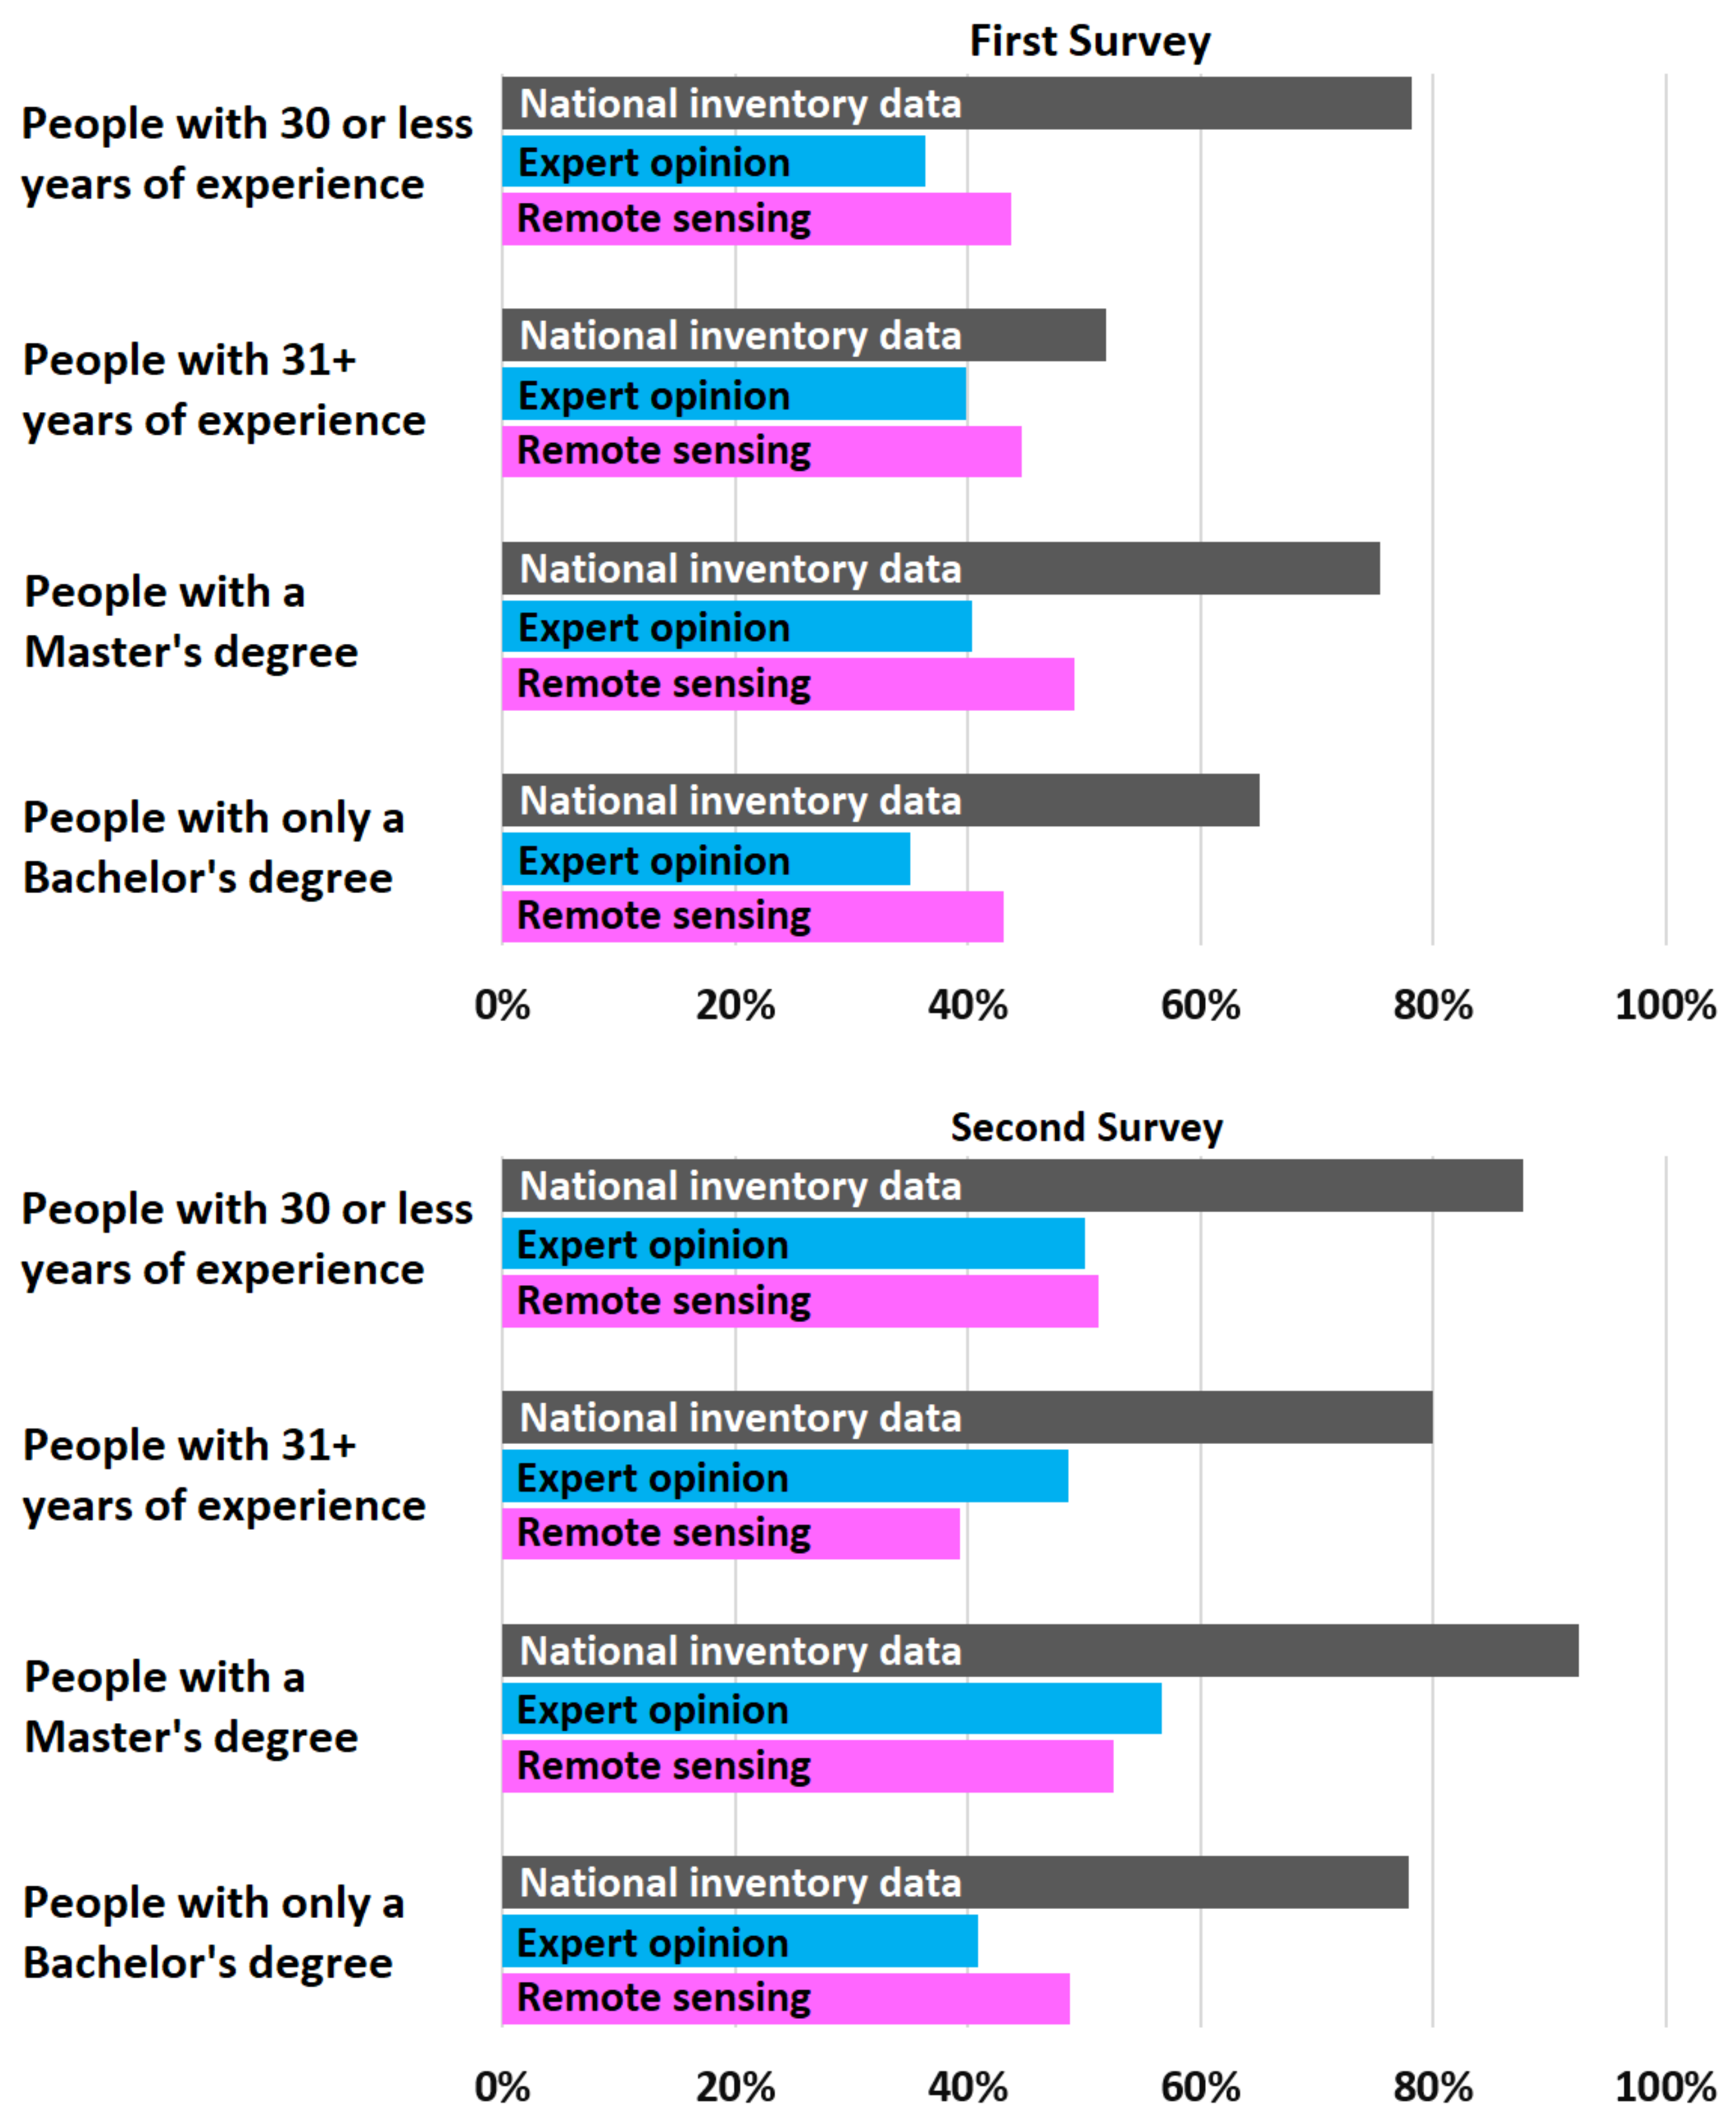
From a review of the survey results, it was apparent that respondents to the second survey in nearly every case (degree obtained, years of experience) were more supportive of using national inventory plot data, expert opinion, and remote sensing methods to help update the tree range maps (
Figure 4). This may be due to the greater familiarity of national inventories and remote sensing methods by the people of the second survey’s sample frame, as compared to the registered foresters from the first survey’s sample frame.
We received 91 additional comments from the two surveys. Therefore, we reject the second hypothesis that if support were observable for new tree range maps, the suggestions would be minimal. From the additional commentary provided by the surveys, the use of current research knowledge was stressed several times as necessary in developing new maps, along with the use of local knowledge regarding establishment or re-establishment efforts of tree species outside of their native ranges. Other suggestions provided by survey participants pointed to valuable information in herbaria collections, information in the collections of state forest agencies, and knowledge in the minds and records of seasoned professionals (e.g., consultants and others). Others suggested that new maps could be informed by sources such as the US Department of Agriculture (USDA) Plants Database field observations. Additional information could come from non-governmental programs such as NatureServe or citizen science programs such as iNaturalist.org.
Concerning the physical presentation of tree range maps, survey respondents noted that the addition of color and other enhancements could enhance display quality and interpretation potential (57.0% from the first survey, 65.9% from the second). However, only one respondent directly indicated that the format of the original panchromatic maps [
14] was sufficient for updated tree range maps. From the additional commentary provided by the surveys, several respondents also suggested that the addition of smaller political units (counties) would be beneficial for informing orientation on those maps where these were absent. On a different note, several respondents suggested that updated maps should contain more information than simply the presence or absence of a particular tree species. This may be achieved, as several noted, by employing classes (e.g., common, frequent, infrequent) and/or the wise use of color to infer the dominance or importance of trees. Heat mapping, or the use of color to represent areas of different levels of values of interest, was also suggested as a means to achieve this goal. Heat mapping is a process for creating choropleth maps representing the geographical distributions of phenomena not apparent from underlying data [
28,
29]. Further, along with maps that illustrate the potential presence or absence of a tree species, some consideration should be explored for the potential development of maps that illustrate the probability of presence of a tree species, and the suitability of lands for hosting a tree species.
In addition, information gathered by the surveys suggested that updated range maps should allow map users to understand the extent of the native range of each tree species concurrent with the actual current range. For example, assuming the original maps [
14] may represent historical ranges of trees, it was suggested that the use of different colors to represent the old and new ranges might enhance the ability of a map user to more easily understand expansion and contraction. This type of information may be valuable to decision makers as they consider the potential implications of species migration due to climate change.
4. Discussion
The importance of updated tree range maps can be found in their support of broad-scale management, environmental, and political decisions that affect land use, and in their ability to support analyses of vital environmental conditions. The accuracy of tree range maps and their ability to assist in addressing practical issues facing society influence their value. The ability to improve the accuracy of tree range maps is affected not only by the knowledge and technology available, but also by the slow transition of tree species presence across a broad, complex environment. For these reasons, and due to funding and personnel issues, standard tree range maps for North America have been updated only every three to five decades. The two stakeholder surveys we conducted regarding the use of
SNA indicated that there is a need to update the tree range maps. Because the processes for undertaking such a task will likely be complex and immense, care must be taken when considering the trade-offs between complexity and detail, the need for map generalization for presentation, and the consistency with which generalization occurs across different maps [
30]. For example, although it may be necessary to only represent species in areas that contain favorable conditions [
6], it may be impossible to present fine spatial detail on maps of certain scales. Further, the level of uncertainty is absent from these maps, because it is traditionally difficult to calibrate. Therefore, the detail provided in these maps represents a cleaned-up version of reality [
31]. In addition, special attention must be given to recent research to account for factors or drivers of change in a tree species’ range, including, for example, range porosity as a response to climate change [
7].
One method that an organization might implement when updating the tree range maps includes reliance on the locations of national inventory field plots that contain at least one tree of a given species within a plot. The simple presence of a tree species at a given location of a field plot could be of value, along with physiographic information, in developing an interpolated estimate of the extent of a landscape where one might expect the tree species to occur. Another method would entail the development of a series of models, based on interpolated estimates of tree presence, to describe species distribution and range maps [
32]. However, even when automated mathematical and geospatial processes are employed, expert opinion is likely necessary for developing high-quality maps [
30]. At a minimum, tree species experts should evaluate the projected current range to verify that the landscape conditions suggested by an informed model are appropriate for that tree species. However, in difficult situations (e.g., sparse data, heterogeneous landscape conditions), more effort on behalf of an expert may be necessary to create a logical and credible tree range map. From a practical perspective, models contain error and uncertainty, and validating the reliability of model outcomes to reasonably estimate the presence or absence of a tree species based on current knowledge of a landscape can require extensive field data representative of the vast ecological conditions of North America. Other than the sparse data that may be available from national forest inventories, the information to conduct these assessments may be limited.
In contrast to drawing maps by hand, new maps may require manual and automated GIS processes and the management of many files that are modified in an iterative manner using an intuitive naming convention, until the desired final product is obtained [
33]. New maps can include additional marginalia and explanatory notes, along with a more contemporary design [
33]. From a cartographical perspective, it is beneficial to include the lowest level of administrative lines (e.g., county lines) without cluttering up the map. For maps that are large enough to provide greater detail, the addition of hill-shading effects may help map users understand the range of growing environments. Color intensity would also provide a further indication of the potential density of tree species within a range. In the United States, new maps may be informed from observational data managed by state and national inventory programs such as the
USDA Tree Atlas,
Biota of North America, or the various state-level
Natural Areas Inventories. Similar programs may exist in Canada and Mexico. However, a process based on field measurements runs the risk of being guided by mistaken tree species identification and minor amounts of trees planted well outside their native range.
The goal of mapping the native range of tree species may need to be re-examined when new tree range maps are developed. Although including trees planted outside of their native range can add complexity to range maps, it may also result in subsequent natural dispersal of those species. And, some efforts have been made to plant tree species in favorable conditions outside their known ranges. Well-known examples from around the world include the planting of
Pseudotsuga menziesii in England [
34] and
Pinus radiata in New Zealand [
35]. When observed, these locations would be valuable additions to any revised maps if other information (national inventory plots, remote sensing) cannot detect their presence. In addition, the superimposition of the current range over what was known to be the historic range, and the inclusion of alternative colors, may be of value. Adding the historical (old maps) and current (new map) perspective to a single map product may also inform discussion concerning the hypotheses that hand-drawn or computer-generated range maps are either overly liberal in their description of ranges or overly conservative.
The sources of information that can guide the development of updated tree range maps may also need to be re-examined. Alternatives to herbarium records, field surveys, and national inventories may address knowledge gaps that prove insightful to the description of current ranges of some tree species. For example, in the future, crowdsourced data may be used to improve land cover or tree range maps [
36]. Ideally, sufficient training would be required by the participants in the data collection effort to avoid misclassification errors. Whether training was undertaken by crowdsourcing, some moderation would seem necessary by the organization managing the data collection. The capture of leaf or needle imagery, if possible, may also someday be subjected to image processing algorithms to suggest the species of tree observed.
The two surveys were conducted to guide the potential revision of the
SNA since its prior revision thirty years ago and its maps created fifty years ago. With respect to the original hypotheses, we did observe overwhelming support for the development of new tree species range maps, and we also observed that the survey respondents offered suggestions for updating the maps that were extensive and diverse (not minimal). With the data available today (e.g., field records, aerial imagery, satellite imagery) and the current state of computer systems, tree species range estimates may be developed with a greater degree of sophistication than fifty years ago. For example, with new information, over half of the range maps for a set of neotropical bat species were recently updated or developed [
37]. The updating of maps may occur despite issues of technocratic geography [
38], where features on Earth (e.g., tree species ranges, perhaps) may be ever-changing due to technological innovations. Because of this, some may argue that maps may always be in need of change. Precursors to the range maps mentioned in this paper include mapping efforts that were based on field notes, botanical lists, and herbarium specimens. The range maps [
39] were sometimes incomplete and contained errors, but they provided a broad picture of the forest resources of North America. Whatever may be the case today, updating North American tree species range maps may require significant effort and collaboration. From the two surveys we conducted, the main suggestions for updating the tree range maps included:
Inform the development of updated maps with national inventory data;
Inform the development of updated maps with expert opinion;
Inform the development of updated maps with remote sensing data products;
Conduct a verification/validation of estimated tree species ranges;
Use color to enhance the message of the maps;
Include county-level political boundaries on all maps to help orient users.
Although not as serious as some other societal problems, this effort may require an organizational commitment to new technology, modeling techniques, workforce development, and more effective use of existing information, all of which may have high costs [
40,
41].


 ,
, 


