
Elevation Alone Alters Leaf N and Leaf C to N Ratio of Picea crassifolia Kom. in China’s Qilian Mountains


 ,
,  ,
, 
Abstract
1. Introduction
2. Materials and Methods
2.1. Study Area
2.2. Sampling and Management
2.3. Data Analysis
3. Results
3.1. Variation in Soil Properties and P. crassifolia Leaf Stoichiometry across Elevation
3.2. Dominant Factors Affecting the Leaf Stoichiometry of P. crassifolia
4. Discussion
4.1. Effect of Elevation on Soil Properties
4.2. Overall Patterns of Leaf Stoichiometry of P. crassifolia across the Elevation Gradient
4.3. Effects of MAP and MAT on Leaf Stoichiometry of P. crassifolia
4.4. Effects of Soil pH and SOC:STN on Leaf Stoichiometry of P. crassifolia
4.5. Effects of Other Factors on Leaf Stoichiometry of P. crassifolia
4.6. Nutrient Limitations of P. crassifolia in the Study Area
5. Conclusions
Author Contributions
Funding
Institutional Review Board Statement
Informed Consent Statement
Data Availability Statement
Conflicts of Interest
References
- Jiang, L.; He, Z.; Liu, J.; Xing, C.; Gu, X.; Wei, C.; Zhu, J.; Wang, L. Elevation gradient altered soil C, N, and P stoichiometry of Pinus taiwanensis forest on Daiyun Mountain. Forests 2019, 10, 1089. [Google Scholar] [CrossRef]
- Finzi, A.C.; Austin, A.T.; Cleland, E.E.; Frey, S.D.; Houlton, B.Z.; Wallenstein, M.D. Responses and feedbacks of coupled biogeochemical cycles to climate change: Examples from terrestrial ecosystems. Front. Ecol. Environ. 2011, 9, 61–67. [Google Scholar] [CrossRef]
- Müller, M.; Oelmann, Y.; Schickhoff, U.; Böhner, J.; Scholten, T. Himalayan treeline soil and foliar C: N: P stoichiometry indicate nutrient shortage with elevation. Geoderma 2017, 291, 21–32. [Google Scholar] [CrossRef]
- Vitousek, P.M.; Porder, S.; Houlton, B.Z.; Chadwick, O.A. Terrestrial phosphorus limitation: Mechanisms, implications, and nitrogen–phosphorus interactions. Ecol. Appl. 2010, 20, 5–15. [Google Scholar] [CrossRef] [PubMed]
- Soethe, N.; Lehmann, J.; Engels, C. Nutrient availability at different altitudes in a tropical montane forest in Ecuador. J. Trop. Ecol. 2008, 24, 397–406. [Google Scholar] [CrossRef]
- Zhao, N.; He, N.P.; Wang, Q.F.; Zhang, X.Y.; Wang, R.L.; Xu, Z.W.; Yu, G.R. The altitudinal patterns of leaf C: N: P stoichiometry are regulated by plant growth form, climate and soil on Changbai Mountain, China. PLoS ONE 2014, 9, e95196. [Google Scholar] [CrossRef]
- Xu, S.J.; Fan, X.Y.; Wang, L.L.; Zhang, X.F.; An, L.Z. The patterns of nitrogen and phosphorus stoichiometry across communities along altitudinal gradients in Qilian Mountains, China. Biochem. Syst. Ecol. 2015, 62, 58–65. [Google Scholar] [CrossRef]
- Han, W.X.; Fang, J.Y.; Guo, D.L.; Zhang, Y. Leaf nitrogen and phosphorus stoichiometry across 753 terrestrial plant species in China. New Phytol. 2005, 168. [Google Scholar] [CrossRef]
- Kang, H.; Zhuang, H.; Wu, L.; Liu, Q.; Shen, G.; Berg, B.; Man, R.; Liu, C. Variation in leaf nitrogen and phosphorus stoichiometry in Picea abies across Europe: An analysis based on local observations. Forest Ecol. Manag. 2011, 261, 195–202. [Google Scholar] [CrossRef]
- Sardans, J.; Ubach, A.R.; Peuelas, J. Factors affecting nutrient concentration and stoichiometry of forest trees in Catalonia (NE Spain). Forest Ecol. Manag. 2011, 262, 2024–2034. [Google Scholar] [CrossRef]
- Wu, Y.T.; Liu, H.Y.; Song, Z.L.; Yang, X.M.; Li, Z.C.; Hao, Q.; Liu, L.N. Ecological stoichiometry of nitrogen, phosphorous, and sulfur in China’s forests. Acta Geochim. 2017, 36, 525–530. [Google Scholar] [CrossRef]
- Elser, J.J.; Bracken, M.E.S.; Cleland, E.E.; Gruner, D.S.; Harpole, W.S.; Hillebrand, H.; Ngai, J.T.; Seabloom, E.W.; Shurin, J.N.; Smith, J.E. Global analysis of nitrogen and phosphorus limitation of primary producers in freshwater, marine and terrestrial ecosystems. Ecol. Lett. 2007, 10, 1135–1142. [Google Scholar] [CrossRef]
- Tian, D.; Yan, Z.B.; Niklas, K.J.; Han, W.X.; Kattge, J.; Reich, P.B.; Luo, Y.K.; Fang, J. Global leaf nitrogen and phosphorus stoichiometry and their scaling exponent. Natl. Sci. Rev. 2018, 5, 728–739. [Google Scholar] [CrossRef]
- Sundqvist, M.K.; Sanders, N.J.; Wardle, D.V. Community and ecosystem responses to elevational gradients: Processes, mechanisms, and insights for Global Change. Annu. Rev. Ecol. Evol. Syst. 2013, 44, 261–280. [Google Scholar] [CrossRef]
- Qian, D.; Yan, C.; Xiu, L.; Feng, K. The impact of mining changes on surrounding lands and ecosystem service value in the southern slope of Qilian Mountains. Ecol. Complex. 2018, 36, 138–148. [Google Scholar] [CrossRef]
- Liang, E.Y.; Shao, X.M.; Eckstein, D.; Huang, L.; Liu, X.H. Topography- and species dependent growth responses of Sabina przewalskii and Picea crassifolia to climate on the northeast Tibetan Plateau. Forest Ecol. Manag. 2006, 236, 268–277. [Google Scholar] [CrossRef]
- Zhao, C.Y.; Nan, Z.G.; Cheng, G.D.; Zhang, J.H.; Feng, Z.D. GIS-assisted modelling of the spatial distribution of Qinghai spruce (Picea crassifolia) in the Qilian Mountains, northwestern China based on biophysical parameters. Ecol. Model. 2005, 191, 487–500. [Google Scholar] [CrossRef]
- Plante, P.M.; Rivest, D.; Vézina, A.; Vanasse, A. Root distribution of different mature tree species growing on contrasting textured soils in temperate windbreaks. Plant Soil 2014, 380, 429–439. [Google Scholar] [CrossRef]
- Wang, B.; Yu, P.T.; Zhang, L.; Wang, Y.H.; Yu, T.P.; Wang, S.L. Differential trends of Qinghai Spruce growth with elevation in northwestern China during the recent warming hiatus. Forests 2019, 10, 712. [Google Scholar] [CrossRef]
- Sandel, B.; Goldstein, L.J.; Kraft, N.J.B.; Okie, J.G.; Shuldman, M.I.; Ackerly, D.D.; Cleland, E.E.; Suding, K.N. Contrasting trait responses in plant communities to experimental and geographic variation in precipitation. New Phytol. 2010, 188, 565–575. [Google Scholar] [CrossRef]
- Chen, Y.H.; Han, W.X.; Tang, L.Y.; Tang, Z.Y.; Fang, J.Y. Leaf nitrogen and phosphorus concentrations of woody plants differ in responses to climate, soil and plant growth form. Ecography 2013, 36, 178–184. [Google Scholar] [CrossRef]
- Agren, G.I.; Weih, M. Plant stoichiometry at different scales: Element concentration patterns reflect environment more than genotype. New Phytol. 2012, 194, 944–952. [Google Scholar] [CrossRef]
- Qin, Y.Y.; Feng, Q.; Holden, N.M.; Cao, J.J. Variation in soil organic carbon by slope aspect in the middle of the Qilian Mountains in the upper Heihe River Basin, China. Catena 2016, 147, 308–314. [Google Scholar] [CrossRef]
- Dwj, A.; Cct, B.; Det, A. Changes in forest floor and soil nutrients in a mixed oak forest 33 years after stem only and whole-tree harvest—ScienceDirect. Forest Ecol. Manag. 2016, 361, 56–68. [Google Scholar] [CrossRef]
- Nelson, D.; Sommers, L.E. Total carbon, organic carbon, and organic matter. Methods Soil Anal. Part 2 Chem. Microbiol. Prop. 1982, 9, 539–579. [Google Scholar]
- Bao, S.D. Soil and Agricultural Chemistry Analysis; China Agriculture Press: Beijing, China, 2020. [Google Scholar]
- Olsen, S.R.; Cole, C.V.; Watanble, F.S.; Dean, S. United States Department of Agriculture; Estimation of Available Phosphorus in Soils by Extraction with Sodium Bicarbonate; USDA Cicular: Washington, DC, USA, 1954. [Google Scholar]
- Zhao, C.Y.; Nan, Z.R.; Cheng, G.D. Methods for modelling of temporal and spatial distribution of air temperature at landscape scale in the southern Qilian mountains, China. Ecol. Model. 2006, 189, 209–220. [Google Scholar] [CrossRef]
- Yang, F.; Niu, K.; Collins, C.G.; Yan, X.; Ji, Y.; Ling, N.; Zhou, X.; Du, G.; Guo, H.; Hu, S. Grazing practices affect the soil microbial community composition in a Tibetan alpine meadow. Land Degrad. Dev. 2018, 30, 49–59. [Google Scholar] [CrossRef]
- Yang, F.; Wu, J.J.; Zhang, D.D.; Chen, Q.; Zhang, Q.; Cheng, X.L. Soil bacterial community composition and diversity in relation to edaphic properties and plant traits in grasslands of southern China. Appl. Soil Ecol. 2018, 128, 43–53. [Google Scholar] [CrossRef]
- Tewksbury, C.E.; Miegroet, V.H. Soil organic carbon dynamics along a climatic gradient in a southern Appalachian spruce-fir forest. Can. J. Forest Res. 2007, 37, 1161–1172. [Google Scholar] [CrossRef]
- Godgift, S.; Henry, J.N.; Pantaleo, K.; Deo, D.S. Carbon stocks of Hanang forest, Tanzania: An implication for climate mitigation. J. Ecol. Nat. Environ. 2014, 6, 90–98. [Google Scholar] [CrossRef][Green Version]
- Zhang, H.; Guo, W.H.; Wang, G.G.; Yu, M.K.; Wu, T.G. Effect of environment and genetics on leaf N and P stoichiometry for Quercus acutissima across China. Eur. J. Forest Res. 2016, 135, 795–802. [Google Scholar] [CrossRef]
- McGroddy, M.E.; Daufresne, T.; Hedin, L.O. Scaling of C: N: P stoichiometry in forests worldwide: Implications of terrestrial Redfield-type ratios. Ecology 2004, 85, 2390–2401. [Google Scholar] [CrossRef]
- Reich, P.B.; Oleksyn, J. Global patterns of plant leaf N and P in relation to temperature and latitude. Proc. Natl. Acad. Sci. USA 2004, 101, 11001–11006. [Google Scholar] [CrossRef]
- Persson, J.; Fink, P.; Goto, A.; Hood, J.M.; Jonas, J.; Kato, S. To be or not to be what you eat: Regulation of stoichiometric homeostasis among autotrophs and heterotrophs. Oikos 2012, 119, 741–751. [Google Scholar] [CrossRef]
- Elser, J.J.; Fagan, W.F.; Kerkhoff, A.J.; Swenson, N.G.; Enquist, B.J. Biological stoichiometry of plant production: Metabolism, scaling and ecological response to global change. New Phytol. 2010, 186, 593–608. [Google Scholar] [CrossRef]
- Rina, S.; Koichi, T. Effects of leaf age, elevation and light conditions on photosynthesis and leaf traits in saplings of two evergreen conifers, Abies veitchii and A. mariesii. J. Plant Ecol. 2020, 4. [Google Scholar] [CrossRef]
- Cao, J.J.; Wang, X.Y.; Adamowski, J.F.; Biswas, A.; Feng, Q. Response of leaf stoichiometry of Oxytropis ochrocephala to elevation and slope aspect. Catena 2020, 194, 104772. [Google Scholar] [CrossRef]
- Weidner, S.; Koller, R.; Latz, E.; Kowalchuk, G.; Bonkowski, M.; Scheu, S.; Jousset, A. Bacterial diversity amplifies nutrient-based plant-soil feedbacks. Funct. Ecol. 2015, 29, 1341–1349. [Google Scholar] [CrossRef]
- Zheng, S.; Shangguan, Z. Spatial patterns of leaf nutrient traits of the plants in the Loess Plateau of China. Trees 2007, 21, 357–370. [Google Scholar] [CrossRef]
- Elser, J.J.; Fagan, W.F.; Denno, R.F.; Dobberfuhl, D.R.; Folarin, A.; Huberty, A.; Sterner, R.W. Nutritional constraints in terrestrial and freshwater food webs. Nature 2000, 408, 578–580. [Google Scholar] [CrossRef] [PubMed]
- Zhu, X.; He, Z.B.; Chen, L.F.; Du, J.; Yang, J.J.; Lin, P.F.; Li, J. Changes in species diversity, aboveground biomass, and distribution characteristics along an afforestation successional gradient in semiarid Picea crassifolia Plantations of Northwestern China. Forest Sci. 2017, 63, 17–28. [Google Scholar] [CrossRef]
- Zhang, X.F.; Liu, X.D.; Jing, W.M.; Cao, J.J. Characteristics of Leontopodium leontopodiodes leaf stoichiometry with altitude and their relationship with soil nutrients in Qilian Mountains, Northwest China. Chin. J. Appl. Ecol. 2019, 30, 4012–4020. [Google Scholar] [CrossRef]
- Lovelock, C.E.; Feller, I.C.; Ball, M.C.; Ellis, J.; Sorell, B. Testing the growth rate vs. geochemical hypothesis for latitudinal variation in plant nutrients. Ecol. Lett. 2007, 10, 1154–1163. [Google Scholar] [CrossRef] [PubMed]
- Liu, J.; Huang, W.; Zhou, G.; Zhang, D.; Liu, S. Nitrogen to phosphorus ratios of tree species in response to elevated carbon dioxide and nitrogen addition in subtropical forests. Global Chang. Biol. 2013, 19, 208–216. [Google Scholar] [CrossRef]
- Hall, E.K.; Singer, G.A.; Kainz, M.J.; Lennon, J.T. Evidence for a temperature acclimation mechanism in bacteria: An empirical test of a membrane-mediated trade-off. Funct. Ecol. 2010, 24, 898–908. [Google Scholar] [CrossRef]
- Littke, K.M.; Harrison, R.B.; Zabowski, D.; Briggs, D.G.; Maguire, D.A. Effects of geoclimatic factors on soil water, nitrogen, and foliar properties of Douglas-Fir plantations in the Pacific Northwest. Forest Sci. 2014, 60, 1118–1130. [Google Scholar] [CrossRef]
- Xue, Z.; Cheng, M. An Soil nitrogen distributions for different land uses and landscape positions in a small watershed on Loess Plateau, China. Ecol. Eng. 2013, 60, 204–213. [Google Scholar] [CrossRef]
- Moe, S.J.; Stelzer, R.S.; Forman, M.R.; Harpole, W.S.; Daufresne, T.; Yoshida, T. Recent advances in ecological stoichiometry: Insights for population and community ecology. Oikos 2005, 109, 29–39. [Google Scholar] [CrossRef]
- Du, B.M.; Ji, H.W.; Peng, C.; Liu, X.J.; Liu, C.J. Altitudinal patterns of leaf stoichiometry and nutrient resorption in Quercus variabilis in the Baotianman Mountains, China. Plant Soil 2017, 413, 193–202. [Google Scholar] [CrossRef]
- Diehl, P.; Mazzarino, M.J.; Funes, F.; Fontenla, S.; Gobbi, M.; Ferrari, J. Nutrient conservation strategies in native Andean-Patagonian forests. J. Veg. Sci. 2009, 14, 63–70. [Google Scholar] [CrossRef]
- Pinguet, Y.L.B.; Gross, N.; Maestre, F.T.; Maire, V.; Bello, F.; Fonseca, C.R.; Liancourt, P. Testing the environmental filtering concept in global drylands. J. Ecol. 2017, 105, 1058–1069. [Google Scholar] [CrossRef]
- Bui, E.N.; Henderson, B.L. C: N: P stoichiometry in Australian soils with respect to vegetation and environmental factors. Plant Soil 2013, 373, 553–568. [Google Scholar] [CrossRef]
- Zhang, D.; Wang, C.; Li, X.L.; Yang, X.S.; Zhao, L.B.; Liu, L.; Li, R. Linking plant ecological stoichiometry with soil nutrient and bacterial communities in apple orchards. Appl. Soil. Ecol. 2018, 126, 1–10. [Google Scholar] [CrossRef]
- Pietri, J.C.A.; Brookes, P.C. Nitrogen mineralisation along a pH gradient of a silty loam UK soil. Soil Biol. Biochem. 2007, 40, 797–802. [Google Scholar] [CrossRef]
- Borer, E.T.; Bracken, M.E.S.; Seabloom, E.W.; Smith, J.E.; Cebrian, J.; Cleland, E.E.; Ngai, J.T. Global biogeography of autotroph chemistry: Is insolation a driving force? Oikos 2013, 122, 1121–1130. [Google Scholar] [CrossRef]
- Li, J.G.; Wan, X.; Liu, X.X.; Chen, Y.; Slaughter, L.C.; Weindorf, D.C.; Dong, Y. Changes in soil physical and chemical characteristics in intensively cultivated greenhouse vegetable fields in North China. Soil Till. Res. 2019, 195, 104366. [Google Scholar] [CrossRef]
- Noll, A.; Mobilian, C.; Christopher, C. Five Decades of wetland soil development of a constructed tidal salt marsh, North Carolina, USA. Ecol. Restor. 2019, 37, 163–170. [Google Scholar] [CrossRef]
- Han, W.; Chang, J.; Jiang, H.; Niu, S.; Liu, Y.; Xu, J.; Wu, J.; Ge, Y. Plant species diversity affects plant nutrient pools by affecting plant biomass and nutrient concentrations in high-nitrogen ecosystems. Basic Appl. Ecol. 2021, 56, 213–225. [Google Scholar] [CrossRef]
- Chen, L.F.; He, Z.B.; Du, J.; Yang, J.J.; Zhu, X. Patterns and environmental controls of soil organic carbon and total nitrogen in alpine ecosystems of northwestern China. Catena 2016, 137, 37–43. [Google Scholar] [CrossRef]
- Zhu, M.; Feng, Q.; Zhang, M.X.; Liu, W.; Deo, R.C.; Zhang, C.Q.; Yang, L. Soil organic carbon in semiarid alpine regions: The spatial distribution, stock estimation, and environmental controls. J. Soil Sediments 2019, 19, 3427–3441. [Google Scholar] [CrossRef]
- Prescott, C.E.; Chappell, H.N.; Vesterdal, L. Nitrogen turnover in forest floors of coastal douglas-fir at sites differing in soil nitrogen capital. Ecology 2000, 81, 1878–1886. [Google Scholar] [CrossRef]
- Alewell, C.; Ringeval, B.; Ballabio, C.; Robinson, D.A.; Borrelli, P. Global phosphorus shortage will be aggravated by soil erosion. Nat. Commun. 2020, 11, 4546. [Google Scholar] [CrossRef]
- Tian, H.; Chen, G.; Zhang, C.; Melillo, J.M.; Hall, C.A.S. Pattern and variation of C: N: P ratios in China’s soils: A synthesis of observational data. Biogeochemistry 2010, 98, 139–151. [Google Scholar] [CrossRef]
- Li, H.; Ye, D.D.; Wang, X.G.; Settles, M.L.; Wang, J.; Hao, Z.Q.; Ma, Z.S. Soil bacterial communities of different natural forest types in Northeast China. Plant Soil 2014, 383, 203–216. [Google Scholar] [CrossRef]
- Minocha, R.; Long, S.; Thangavel, P.; Minocha, S.C.; Eagar, C.; Driscoll, C.T. Elevation dependent sensitivity of northern hardwood to Ca addition at Hubbard Brook experimental forest, NH, USA. Forest Ecol. Manag. 2010, 260, 2115–2124. [Google Scholar] [CrossRef]
- Egilla, J.N.; Davies, F.T.; Boutton, T.W. Drought stress influences leaf water content, photosynthesis, and water-use-efficiency of Hibiscus rosa-sinensis at three potassium concentrations. Photosynthetica 2005, 43, 135–140. [Google Scholar] [CrossRef]
- Koerselman, W.M.; Arthur, F.M. The vegetation N: P ratio: A new tool to detect the nature of nutrient limitation. J. Appl. Ecol. 1996, 33, 1441–1450. [Google Scholar] [CrossRef]
- Güsewell, S. N: P ratios in terrestrial plants: Variation and functional significance. New Phytol. 2004, 164, 243–266. [Google Scholar] [CrossRef] [PubMed]
- Cao, Y.; Wang, Y.; Xu, Z. Soil C: P ratio along elevational gradients in Picea schrenkiana forest of Tianshan Mountains. Pol. J. Ecol. 2019, 66, 325. [Google Scholar] [CrossRef]
- Han, W.X.; Fang, J.Y.; Reich, P.B.; Woodward, F.; Wang, Z.H. Biogeography and variability of eleven mineral elements in plant leaves across gradients of climate, soil and plant functional type in China. Ecol. Lett. 2011, 14, 788–796. [Google Scholar] [CrossRef]
- Kumar, B.; Dhar, S.; Paul, S.; Paramesh, V.; Dass, A.; Upadhyay, P.K.; Abdelbacki, A.M. Microbial biomass carbon, activity of soil enzymes, nutrient availability, root growth, and total biomass production in wheat cultivars under variable irrigation and nutrient management. Agronomy 2021, 11, 669. [Google Scholar] [CrossRef]
- Tran, C.T.K.; Watts-Williams, S.J.; Smernik, R.J.; Cavagnaro, T.R. Root and arbuscular mycorrhizal effects on soil nutrient loss are modulated by soil texture. Appl. Soil Ecol. 2021, 167, 104097. [Google Scholar] [CrossRef]


| Measured Parameters | Effect of Elevation | |
|---|---|---|
| p | df | |
| SOC (g·kg−1) | <0.001 | 4 |
| STN (g·kg−1) | <0.001 | 4 |
| STP (g·kg−1) | <0.001 | 4 |
| SOC:STN | <0.001 | 4 |
| SOC:STP | <0.001 | 4 |
| STN:STP | <0.001 | 4 |
| NH4+-N (mg·kg−1) | <0.001 | 4 |
| NO3−-N (mg·kg−1) | <0.001 | 4 |
| pH | <0.001 | 4 |
| LC (g·kg−1) | 0.158 | 4 |
| LN (g·kg−1) | <0.001 | 4 |
| LP (g·kg−1) | 0.203 | 4 |
| LC:LN | <0.001 | 4 |
| LC:LP | 0.388 | 4 |
| LN:LP | 0.428 | 4 |
| Parameter | Elevation (m) | ||||
|---|---|---|---|---|---|
| 2400 | 2600 | 2800 | 3000 | 3200 | |
| SOC (g·kg−1) | 50.03 ± 9.88 BC | 46.00 ± 5.01 C | 49.06 ± 11.50 BC | 56.40 ± 7.68 B | 86.83 ± 7.92 A |
| STN (g·kg−1) | 3.58 ± 0.73 BC | 3.72 ± 0.38 BC | 3.28 ± 0.70 C | 3.98 ± 0.75 B | 5.90 ± 0.43 A |
| STP (g·kg−1) | 0.54 ± 0.08 B | 0.63 ± 0.09 A | 0.48 ± 0.08 B | 0.62 ± 0.05 A | 0.52 ± 0.05 B |
| SOC:STN | 13.99 ± 0.83 A | 12.35 ± 0.48 B | 14.90 ± 0.78 A | 14.33 ± 1.62 A | 14.74 ± 1.37 A |
| SOC:STP | 92.41 ± 13.79 BC | 74.12 ± 5.72 C | 107.60 ± 42.23 B | 90.40 ± 10.09 B | 166.82 ± 22.45 A |
| STN:STP | 6.59 ± 0.82 B | 6.01 ± 0.60 B | 7.15 ± 2.47 B | 6.40 ± 1.14 B | 11.30 ± 0.92 A |
| NH4+-N (mg·kg−1) | 8.07 ± 0.73 A | 7.42 ± 0.55 A | 6.17 ± 2.47 B | 8.11 ± 0.54 A | 8.14 ± 1.55 A |
| NO3−-N (mg·kg−1) | 1.65 ± 0.41 C | 4.34 ± 2.88 AB | 3.43 ± 0.56 B | 3.37 ± 0.42 B | 4.94 ± 1.52 A |
| pH | 7.86 ± 0.10 A | 7.86 ± 0.09 A | 7.83 ± 0.27 A | 7.75 ± 0.18 A | 7.44 ± 0.24 B |
| Longitude | 100°21′55′′ E | 100°17′13′′ E | 100°14′28′′ E | 100°13′19′′ E | 100°22′35′′ E |
| Latitude | 38°37′5′′ N | 38°34′4′′ N | 38°33′9′′ N | 38°33′5′′ N | 38°38′15′′ N |
| MAT (°C) | 2.26 | 1.17 | 0.08 | −1.02 | −2.68 |
| MAP (mm) | 304.32 | 330.93 | 353.70 | 378.96 | 410.09 |
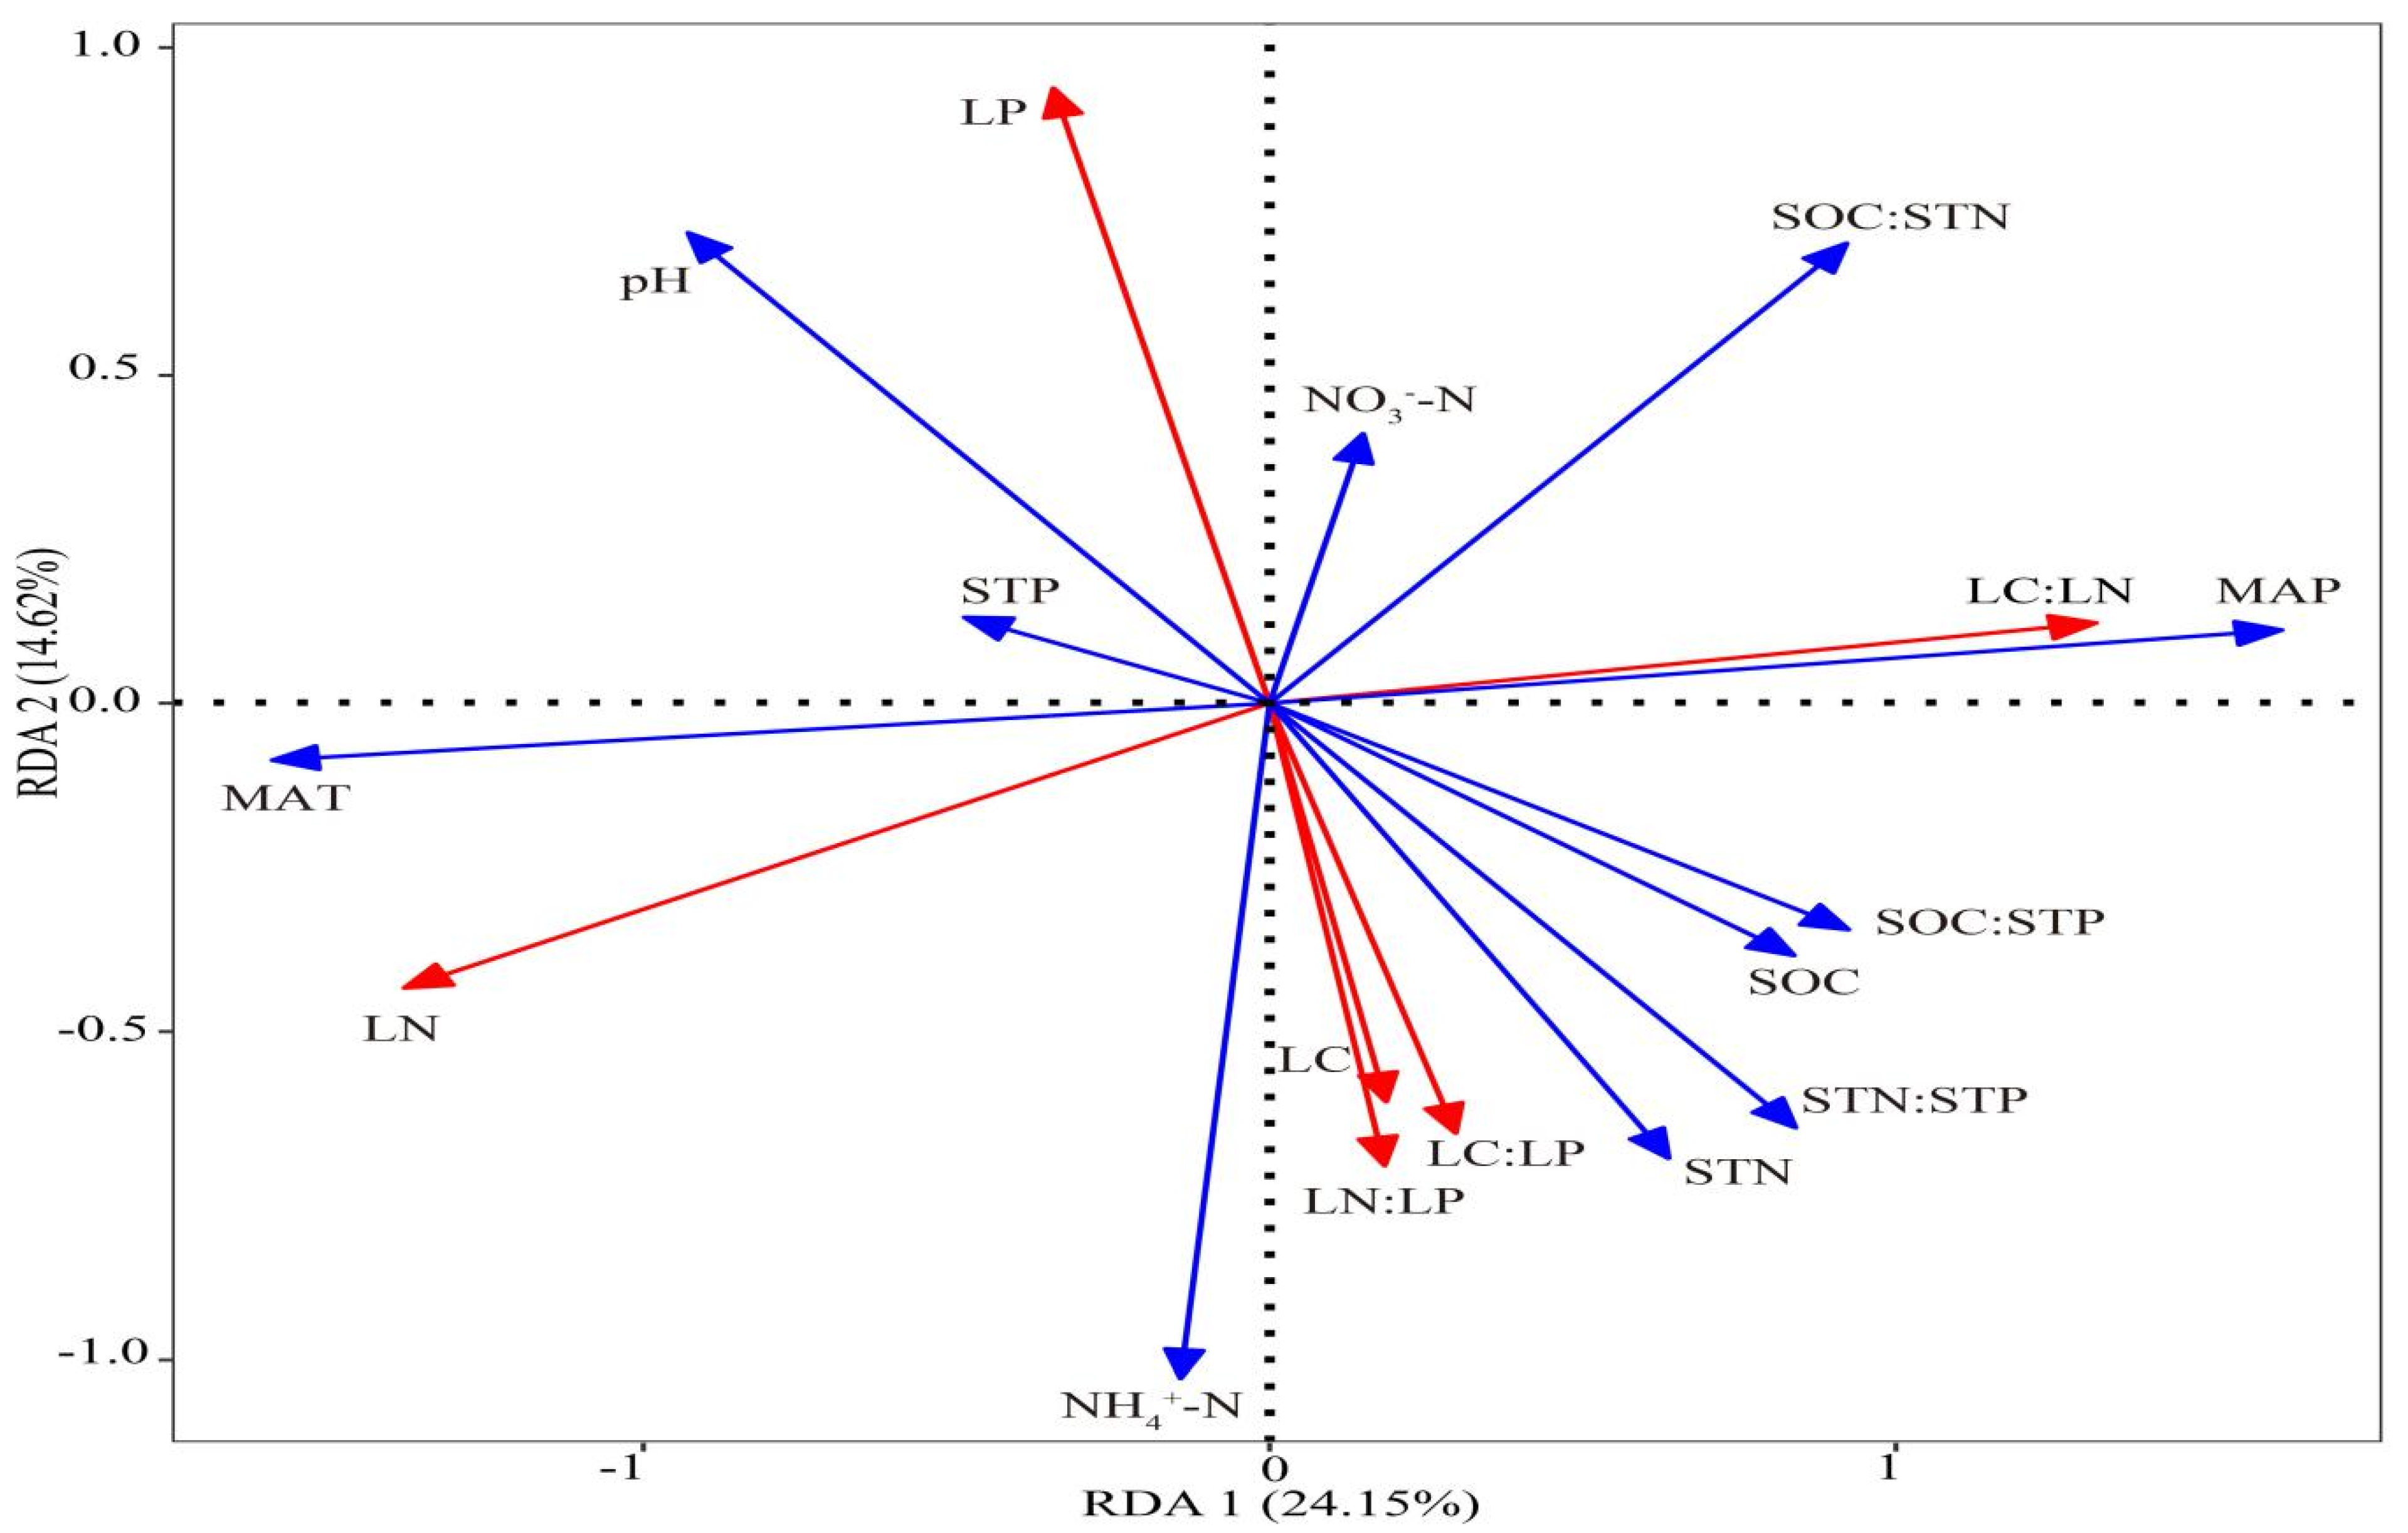
| Environmental Factors | RDA1 | RDA2 | R2 | p * | Explains (%) | Pseudo-F | p ** |
|---|---|---|---|---|---|---|---|
| SOC (g·kg−1) | 0.99426 | −0.10702 | 0.1222 | 0.078 | 1.7 | 2.2 | 0.076 |
| STN (g·kg−1) | 0.87152 | −0.49036 | 0.0965 | 0.126 | 1.5 | 2 | 0.134 |
| STP (g·kg−1) | −0.99995 | −0.01024 | 0.0406 | 0.41 | 0.3 | 0.7 | 0.604 |
| pH | −0.95203 | 0.30602 | 0.1687 | 0.024 | 4.7 | 3.5 | 0.012 |
| SOC:STN | 0.88126 | 0.47263 | 0.2418 | 0.003 | 3.9 | 3.3 | 0.016 |
| SOC:STP | 0.99858 | −0.05328 | 0.1469 | 0.043 | 2.2 | 2.6 | 0.060 |
| STN:STP | 0.95268 | −0.30397 | 0.1378 | 0.042 | 2.5 | 2.7 | 0.050 |
| NH4+-N (mg·kg−1) | −0.45172 | −0.89216 | 0.1216 | 0.076 | 0.3 | 0.7 | 0.484 |
| NO3−-N (mg·kg−1) | 0.63894 | 0.76926 | 0.0251 | 0.552 | 0.7 | 1.8 | 0.156 |
| MAT (°C) | −0.98159 | −0.19099 | 0.4647 | 0.001 | 13.7 | 7.9 | 0.002 |
| MAP (mm) | 0.98013 | 0.19838 | 0.4814 | 0.001 | 15.9 | 8.1 | 0.002 |
| pH | SOC:STN | MAT (°C) | MAP (mm) | |
|---|---|---|---|---|
| LC (g·kg−1) | −0.301 * | −0.064 | −0.139 | 0.13 |
| LN (g·kg−1) | 0.276 | −0.483 ** | 0.670 ** | −0.684 ** |
| LP (g·kg−1) | 0.219 | 0.044 | 0.099 | −0.093 |
| LC:LN | −0.370 * | 0.392 ** | −0.654 ** | 0.664 ** |
| LC:LP | −0.229 | −0.114 | −0.125 | 0.127 |
| LN:LP | −0.206 | −0.134 | −0.069 | 0.069 |
Publisher’s Note: MDPI stays neutral with regard to jurisdictional claims in published maps and institutional affiliations. |
© 2021 by the authors. Licensee MDPI, Basel, Switzerland. This article is an open access article distributed under the terms and conditions of the Creative Commons Attribution (CC BY) license (https://creativecommons.org/licenses/by/4.0/).
Share and Cite
Niu, Y.; Kang, J.; Su, H.; Adamowski, J.F.; Biswas, A.; Liu, C.; Cao, J. Elevation Alone Alters Leaf N and Leaf C to N Ratio of Picea crassifolia Kom. in China’s Qilian Mountains. Forests 2021, 12, 1325. https://doi.org/10.3390/f12101325
Niu Y, Kang J, Su H, Adamowski JF, Biswas A, Liu C, Cao J. Elevation Alone Alters Leaf N and Leaf C to N Ratio of Picea crassifolia Kom. in China’s Qilian Mountains. Forests. 2021; 12(10):1325. https://doi.org/10.3390/f12101325
Chicago/Turabian StyleNiu, Yalin, Jianfang Kang, Haohai Su, Jan F. Adamowski, Asim Biswas, Chunfang Liu, and Jianjun Cao. 2021. "Elevation Alone Alters Leaf N and Leaf C to N Ratio of Picea crassifolia Kom. in China’s Qilian Mountains" Forests 12, no. 10: 1325. https://doi.org/10.3390/f12101325
APA StyleNiu, Y., Kang, J., Su, H., Adamowski, J. F., Biswas, A., Liu, C., & Cao, J. (2021). Elevation Alone Alters Leaf N and Leaf C to N Ratio of Picea crassifolia Kom. in China’s Qilian Mountains. Forests, 12(10), 1325. https://doi.org/10.3390/f12101325