Article

Vegetation Properties in Human-Impacted Riparian Zones Based on Unmanned Aerial Vehicle (UAV) Imagery: An Analysis of River Reaches in the Yongding River Basin

1
Engineering Research Center of Groundwater Pollution Control and Remediation Ministry of Education, College of Water Sciences, Beijing Normal University, Beijing 100875, China
2
Beijing Center of Wetland Studies, Capital Normal University, Beijing 100048, China
*
Author to whom correspondence should be addressed.
Forests 2021, 12(1), 22; https://doi.org/10.3390/f12010022
Submission received: 9 December 2020 / Revised: 23 December 2020 / Accepted: 23 December 2020 / Published: 27 December 2020

Abstract

:
Riparian zones, transitional areas between aquatic and terrestrial ecosystems, have high plant species diversities. However, they are extremely vulnerable to natural factors, such as changes in river hydrological conditions (floods, droughts) and disturbances from human activities (dams, farmland encroachment, etc.). The distribution of plant life forms and variations in the degree of vegetation coverage in a riparian zone can reflect changes in the environmental conditions. In this study, we analyzed eight reaches from the four main tributaries (Dongyang River, Yang River, Sanggan River, and Yongding River) of the Yongding River Basin, which were selected based on their climate, terrain, and degree of human disturbance. One reach was located on the Dongyang River (DYR), two reaches on the Yang River (YR1 and YR2), three on the Sanggan River (SGR1, 2, and 3), and two on the Yongding River (YDR1 and YDR2). Unmanned aerial vehicle (UAV) technology was used to obtain high-resolution, true-color, multispectral images. The distributions of the plant life forms and the differences in the vegetation coverage were analyzed in the eight selected riparian zones. The results showed that grasses dominated the riparian zone and shrubs and trees were sparsely distributed along both banks of all streams, excluding SGR2 and YDR1. The areas with an extremely high vegetation coverage classification accounted for the highest proportion in the DYR (29.3%), YR2 (48.1%), SGR1 (32.9%), SGR2 (39.9%), SGR3 (85.1%), YDR1 (36.7%), and YDR2 (51.1%) reaches. Extremely low vegetation coverage accounted for the highest proportion in the YR2 reach, reaching 37.4%. This study indicated that natural factors and human activities have a serious impact on the distribution of different plants life forms and vegetation coverage classifications in the riparian zones of the Yongding River Basin. We hope that this research can provide practical assistance in the efforts of ecological restoration and the management of riparian vegetation in the Yongding River Basin.

1. Introduction

Riparian zones, transitions between aquatic ecosystems and terrestrial ecosystems, play an important role in the transfer of material, energy, and information between these two ecosystems [1,2]. In this transitional zone, vegetation plays a key role, providing many ecological functions and services, stabilizing riverbanks, regulating river water temperature, intercepting pollutants [3], providing refuge for terrestrial plants and animals, maintaining biodiversity [1], and providing recreational opportunities [4,5]. However, at this connecting region between aquatic and terrestrial systems, riparian vegetation is more susceptible to disturbance from natural factors and human activities. Changes in river hydrological conditions (floods, droughts), dam construction, farmland encroachment, etc., all have important impacts on the composition and distribution of vegetation in the riparian zone [6,7].
A plant life form refers to a group of plants that have participated in long-term adaptation to their ecological environment and have similar external morphologies, physiologies, structures, and habits. Having the same life form can reflect that the plants share similar adaptability to the environment [8,9]. Because the plant life form reflects a plant’s adaptation to its environment, consequences also exist regarding responses to natural factors, such as changes in climate and disturbances resulting from human activities [8,10,11,12]. Therefore, studying the distribution of the different life forms of plants in a riparian zone is of great significance for understanding the changes in a riparian habitat caused by natural factors or interference from human activities. Vegetation coverage is defined as the proportion of ground covered by the aerial parts of plants when viewed from directly overhead [13,14]. As an important part of the physical structure characteristics of ecological communities, vegetation coverage can adequately reflect the health status of plants [15]. In addition, it is an important parameter that is used to describe land surface carbon, water and energy exchange models, as well as the basic data required for studying regional or global issues, such as ecological environment changes, hydrological conditions, and meteorological changes. Vegetation coverage is of great significance in revealing regional or global vegetation growth statuses, evaluating land degradation [14]. Identifying changes in the vegetation coverage in riparian zones can directly reflect the changes in river hydrological conditions and the influence of human activities on riparian vegetation.
Most previous studies on riparian vegetation were based on in-site surveys [16,17]. Although these studies were very accurate, they required considerable manpower and were time-consuming, especially when considering a large area [18]. Some riparian zones may be difficult to access, leading to incomplete characterization of vegetation properties along river networks. However, without sufficient and continuous surveying, it is impossible to adequately quantify continuous processes on a large spatial scale [19,20]. The development of remote sensing technology enabled large-scale research on riparian vegetation. With the continuous advancement of remote sensing technologies, different remote sensing methods were applied in response to the varying needs of riparian vegetation research. For large- and subregional-scale research, airplane and satellite imagery was widely used [21,22,23,24,25,26,27,28]. For local-scale riparian vegetation research, unmanned aerial system (UAV) technology has been increasingly applied since 2010, due to its cost-effectiveness and ability to obtain high-resolution, spatial (up to subdecimeter) and temporal resolution images [29]. At present, research on UAV technology in riparian vegetation mainly focuses on species identification and invasive species monitoring [30,31,32,33]. Species identification is mainly applied to trees and shrubs. Herbaceous plants in the riparian zone are difficult to distinguish because of their dense distribution and similar spectral and textural characteristics. Nevertheless, the use of UAVs also has a few shortcomings. Affected by weather conditions, excessive wind speed affects its stability, and local UAV air control makes it impossible to apply consistently. In addition, the limited battery and load capacity make its operational time and spatial coverage limited, and some heavier sensors cannot be carried [34]. However, with the miniaturization of high-quality sensors, this limitation was resolved.
In recent decades, stream flows in the Yongding River Basin were drastically reduced, and the disturbances resulting from human activities continuously intensified [35,36]. Studying the distribution of different plant life forms and vegetation coverages can enable the intuitive evaluation of the vegetation status in riparian zones and the impact of the changes in stream flow and interference from human activities in the Yongding River Basin. In this study, we hypothesized that the distribution of plant life forms and vegetation coverage in the riparian zone were different under different climates, topographies, and degrees of human disturbance. We selected eight reaches from the four main streams (the Dongyang River, Yang River, Sanggan River, and Yongding River) in the Yongding River Basin, and used UAV technology to study the vegetation cover changes in the riparian zone based on the climate, terrain, and degree of human disturbance,. The objectives of the study were to (1) reveal the distribution of different plant life forms in the riparian zone, (2) describe the differences in the vegetation coverage in the riparian zone among the different reaches, and (3) evaluate the influence of natural factors and human activities on riparian vegetation based on available data. Through our research, we hope to provide assistance for the ecological restoration and management of riparian vegetation in the Yongding River Basin.

2. Materials and Methods

2.1. Study Site

The Yongding River Basin spans five provinces and municipalities, including Beijing, Tianjin, Hebei, Shanxi, and Inner Mongolia, covering an area of approximately 47,100 km2 (38°52′22.8″–41°14′45.6″, 111°58′44.4″–117°44′31″) [37]. With the Guanting Reservoir as the boundary, the Yang River and Sanggan River are located in the upper section and act as two important tributaries of the Yongding River. The Dongyang River is an important tributary of the Yang River and is located on the plateau of Inner Mongolia. The Dongyang River, Yang River, and Sanggan River are mainly located in semiarid regions. The Yang River and Sanggan River merge to form the mainstream Yongding River in Huailai County, Hebei Province. The Yongding River is mainly located in the lower reaches of the Guanting Reservoir and is mainly located in subhumid areas. The annual average temperature and rainfall in the basin are approximately 6–7 °C and 397.5 mm, respectively [36]. Temperature and rainfall vary greatly throughout the year. The Yongding River Basin is mainly dominated by plateaus and mountains, and the terrain is high in the northwest and low in the southeast (Figure 1).The main land use types identified in 2018 were agriculture (42.2%), forest (22.1%), grassland (25.7%), urban land (7.9%), water body (1.8%), and unused land (0.3%) (www.resdc.cn). The landscape mainly consists of farmland, woodland and grassland in the Yongding River Basin. In recent decades, due to the intensification of human activities, the degree of landscape fragmentation has increased [38], with the area of natural wetland obviously reducing [39]. The vegetation coverage in the upper reaches of the Yongding River Basin is relatively low, at less than 30%. In the middle and lower reaches of the Yongding River Basin, from 1978 to 1987, the vegetation coverage declined sharply. From 1987 to 1995, the vegetation coverage increased slightly but then declined rapidly [40]. In 2000, the vegetation coverage was at its lowest value in recent years, and the vegetation coverage showed an upward trend from 2000 to 2004. The vegetation coverage tended to be stable from 2004 to 2009. The main driving factor of changes in vegetation coverage is human factors, followed by climate factors [40]. In terms of plant species, a survey on the riparian zone of the Yongding River found that, according to life-form identification, only 13 species of woody plants exist in 10 families, 6 species of shrub plants are in 4 families, and herbaceous plants are dominant [41].

2.2. Data Collection

From 12 July to 17 July 2019, we selected eight reaches of the Yongding River Basin based on their different climate types, topographies and intensities of human activity interference (Figure 2). The selected reach of the Dongyang River (DYR) was located in a semiarid area and was less disturbed by human activities. The selected reach 1 of the Yang River (YR1) and reaches 1 and 2 of the Sanggan River (SGR1 and SGR2) were located in semiarid areas and were seriously disturbed by human activities. The selected reach 2 of the Yang River (YR2) and selected reach 3 of the Sanggan River (SGR3) were located at the junction of subhumid and semiarid areas and were less disturbed by human activities. The selected reach 1 of the Yongding River (YDR1) was located in the sub-humid gorge area, which was moderately disturbed by human activities. The selected reach 2 of the Yongding River (YDR2) was located in the subhumid plain area, which was moderately disturbed by human activities.
For each river reach, UAV shooting was controlled within the range of 200–300 m in width and 300–500 m in length for later extraction. An RGB (Red–Green–Blue) camera was flown on a fixed-wing UAV at a height of 100 m (DJI PHANTOM 4 RTK, 8.8 mm focal length lens, field of view (FOV) = 70°(horizontal) × 50°(vertical), shutter speed 1/2000 s, ground sampling distance (GSD) = 2.74 cm, forward overlap 80%, side overlap 70%) for RGB imagery. A six-rotor drone (DJI M600) equipped with a MicaSense Altum multispectral camera was used to acquire multispectral images at 70 m above ground level, providing 75% side overlap between flight strips and 80% forward overlap. The MicaSense Altum multispectral camera had an 8 mm focal length lens, providing fields of view of 48°and 36.8° in the horizontal and vertical directions, respectively. The ground sampling distance (GSD) of the raw imagery was 2.9 cm. Multispectral sensors measured the blue, green, red, near-infrared, red edge, and thermal infrared bands, and the center wavelength and bandwidth are shown in Table 1.
To more accurately describe the distribution of plant life forms in the riparian zone, using the UAVs to obtain images of the vegetation in the riparian zone, we also conducted in situ vegetation surveying. The on-site vegetation survey was carried out approximately two weeks after the UAV surveying, from 30 July to 5 August 2019.

2.3. Data Process

The Agisoft MetaShape 1.5.5 professional software was used for preliminary image processing to generate orthophotos and digital surface models (DSMs). On the basis of DSMs, we reacquired the surface elevation data of bare ground and removed plant height, and carried out Inverse Distance Weighted (IDW) interpolation in ArcGIS to obtain the Digital Terrain Model (DTM) of the selected river reaches. We used ArcGIS 10.2 to extract the riparian zone of the generated orthophoto (avoiding farmland as much as possible). Due to the partial data loss of the multispectral images in parts of the river reaches (YR1, SGR2, and YDR2), the range of the extracted riparian zone was smaller than that of the true color RGB image. The riparian zone extracted from each river reach is shown in Figure 2.
We used ArcGIS 10.2 for visual interpretation of the true-color RGB images to divide the vegetation in the riparian zone into trees, shrubs, and grasses groups. ENVI 5.3 was used to calculate the normalized difference vegetation index (NDVI) using the multispectral images. The formula for calculating NDVI is as follows:
NDVI = ρ NIR ρ RED ρ NIR + ρ RED
where ρNIR is near-infrared reflectance, and ρRED is the red reflectance.
Due to the good correlation between the vegetation coverage and the NDVI value, a dimidiate pixel model was used to calculate the extracted NDVI to obtain the vegetation coverage [42]. The formula used is as follows:
VC = ( NDVI NDVI soil ) / ( NDVI veg NDVI soil )
where VC is the vegetation coverage, NDVIsoil is the value of NDVI for bare soil or areas without vegetation cover, and NDVIveg is the value of NDVI for the area completely covered by vegetation. The theoretical value of NDVIsoil is 0, and it is not easily altered. Due to the influence of many factors, the value range is −0.1 and 0.2. The theoretical value of NDVIveg is 1, but it is altered by the influence of the atmosphere and vegetation type. With reference to previous research results, the 5% confidence interval of the NDVI value is intercepted. The obtained the NDVIsoil and NDVIveg values are used as input into Formula (2) to solve for the vegetation coverage. The results of the vegetation coverage dichotomy model were reclassified by ArcGIS 10.2 into different grades (0–20%: extremely low; 20–40%: low; 40–60%: medium; 60–80%: high; 80–100%: extremely high), which were outputted to a map.

3. Results

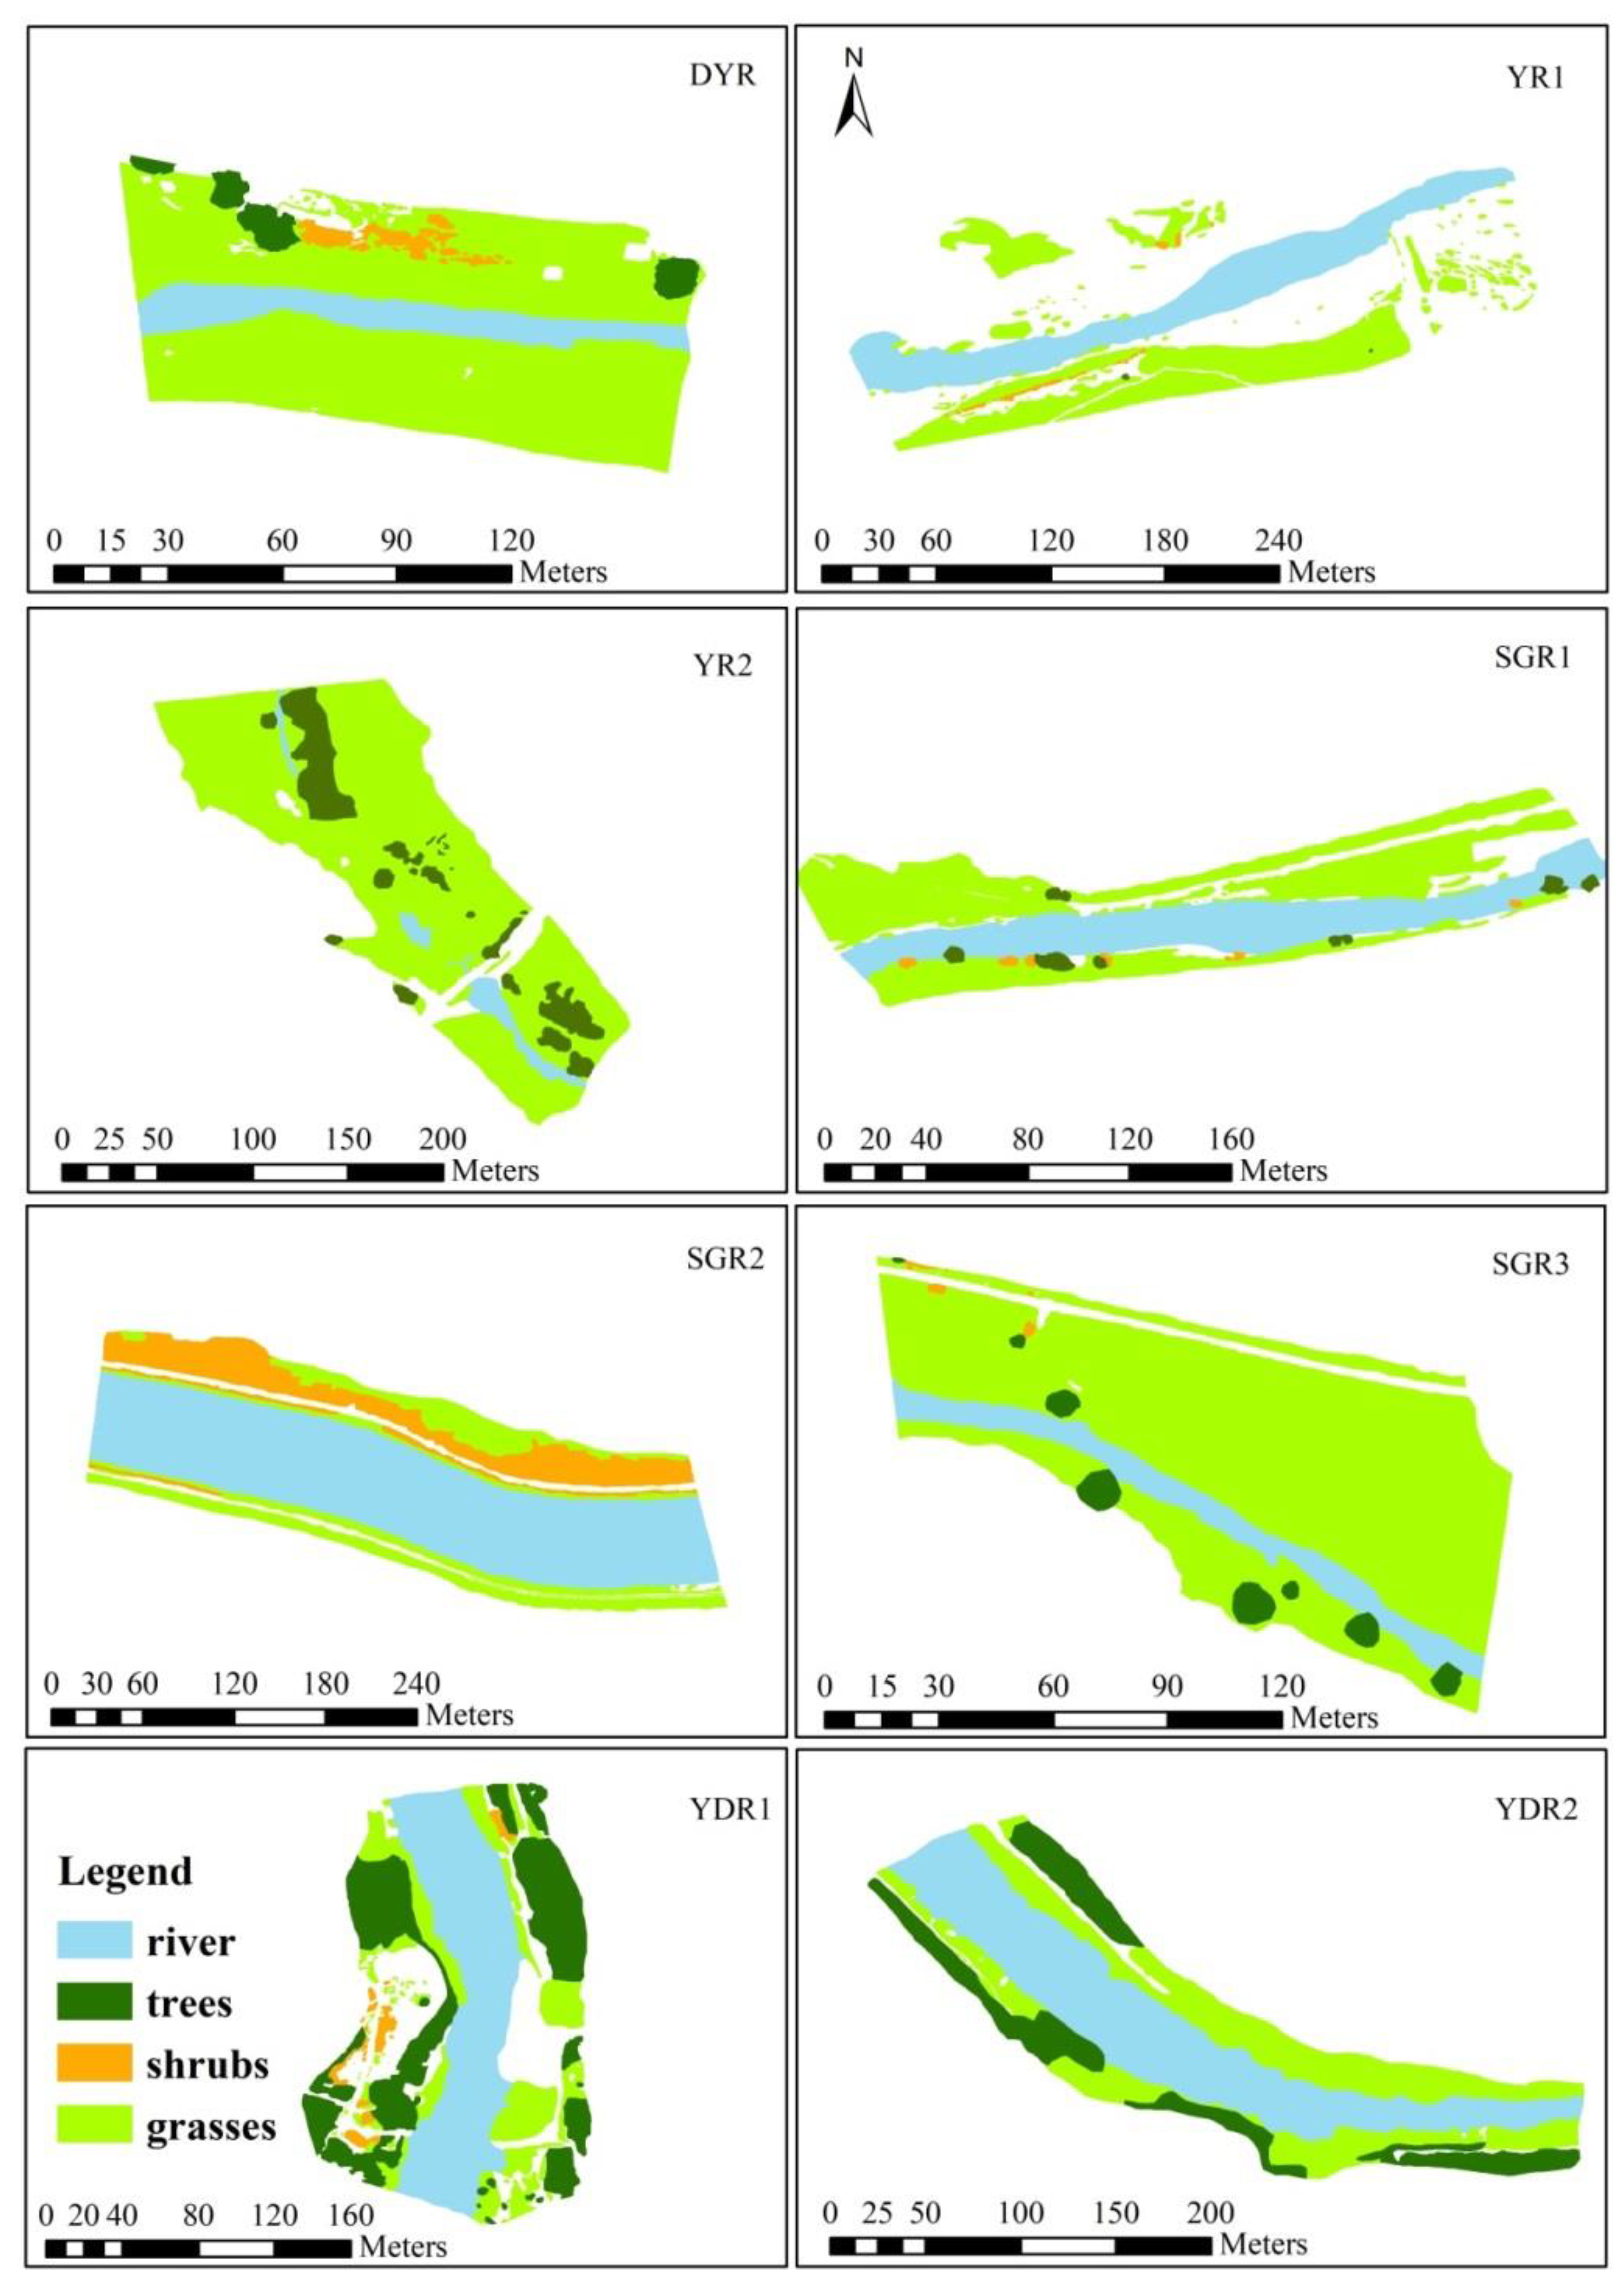
3.1. Distribution of Plant Life Forms in the Riparian Zone

As seen in Figure 3, excluding SGR2 and YDR1, the reaches were dominated by grasses, especially that of DYR, YR2, and SGR3. There were no shrubs in the riparian zones of YR2 and YDR2. Shrubs were widely distributed in the riparian zone of the SGR2 reach. There was sparse distribution of shrubs in the riparian zone of reaches DYR, YR1, SGR1, SGR3, and YDR1. The shrubs in the riparian zone of the SGR1 reach were distributed near the river water. In other reaches where there were shrubs present, the shrubs were mainly distributed in areas far away from the river water. Excluding the no-tree distribution in the riparian zone of the SGR2 reach, there were trees in the riparian zones of all reaches. Trees in the riparian zone of the YR2, SGR1, and SGR3 reaches were mainly distributed near the river. Trees in the riparian zone of the DYR, YR1, and YDR2 reaches were mainly distributed far away from the river.

3.2. The Vegetation Coverage in the Riparian Zone

From the results shown in Figure 4 and Table 2, we found that the percentage of areas classified with extremely high vegetation coverage in the riparian zone of the SGR3 reach was the highest compared with other reaches, reaching 85.06%. In the riparian zone of the DYR (29.33%), YR2 (48.11%), SGR1 (32.95%), SGR2 (39.90%), YDR1 (36.69%), and YDR2 (51.10%) reaches, the extremely high vegetation coverage class also accounted for the highest proportion. The proportion of extremely low vegetation coverage in the riparian zone of the YR1 (37.43%) reach was much higher than that of other reaches. Except for the YR1 reach, the riparian zones of all other reaches were mainly classified as having high and extremely high vegetation coverage, accounting for more than 50% of the areas.

4. Discussion

The type and distribution of vegetation across the riparian zones are affected by many factors, such as the climate, river hydrology, local geomorphology, and disturbance frequency and intensity of human activities [1,43,44,45,46]. Most of the Yongding River Basin belongs to semiarid area. Less rainfall causes the riparian zone to be dominated by herbaceous plants (DYR, YR1, YR2, SGR1, and SGR3). Based on Figure 4 and Figure S1, the reaches with low perennial average precipitation (DYR, YR1, and SGR1) had a significantly lower occurrence of areas with extremely high vegetation coverage than that of the reaches with high perennial average precipitation (YR2, SGR3, YDR1, and YDR2). Stream flow in the Yongding River Basin has declined drastically in recent decades (Figure S2), causing some streams to be cut off and vegetation along the riparian zone to seriously degrade, with the extremely low and low vegetation coverage classes occupying a large area (YR1). The riparian zones in the selected reaches generally showed small elevation differences from the near riverbank to the high land, except for YDR1, but they all exhibited a clear gradient (Figure 5). Except for a few reaches, shrubs and trees tended to be distributed in the higher portion of the terrain. In the reaches with an abundance of shrubs and trees, the vegetation coverage of the riparian zone was also relatively high (YR2, SGR2, SGR3, YDR1, YDR2). The YDR1 riparian zone located in the mountain region showed the largest proportion of trees, which was similar to studies in other regions [2].
The impact of human activities on the vegetation in the riparian zone is mainly expressed through the construction of dams to regulate water flow, ecological water replenishment, projects for riparian restoration, farmland encroachment, grazing and trampling of cattle and sheep, and the destruction of riverbeds and riparian zones caused by the illegal mining of river sands [45,47,48,49]. The southern bank of the reach selected from the Dongyang River was more severely grazed by cattle and sheep, so the vegetation cover was sparser compared to the northern bank (Figure 4 and Figure S3a). The trees and shrubs on the north shore not only increased the vegetation coverage, but also provided protection for herbaceous plants from grazers [50]. The riparian zone was already degraded due to the decrease in stream flow. It suffered further damage from the mining of river sands, which further intensified the degradation of riparian vegetation (YR1). The farmland encroachment not only reduced the width of the riparian zone and destroyed the native vegetation but also led to the construction of a road running through the riparian zone for to the movement of farming equipment, severing the connection between the aquatic ecosystem and the terrestrial ecosystem of some reaches (YR2, SGR1, SGR3, and YDR2) (Figure S3). The implementation of ecological water replenishment projects caused a rapid increase in the instantaneous flow of the stream, which intensively scoured the plants in the riparian zone, causing a large-scale plant death (Figure S3d). The riverbank scoured by these events now has sparse vegetation (SGR1). Although the implementation of ecological restoration projects strengthened the riparian zone to a certain extent, it changed its original characteristics. The installation of artificial plants in the riparian zone can increase vegetation coverage, however, it also seriously reduces the species diversity and may increase the risk of alien species invasion. It is difficult to restore the vegetation diversity in the artificial riparian zone because of the destruction of the original plant habitat. In addition, due to the beautiful scenery at the gorge reaches and the development of tourism, the riparian vegetation was further destroyed (YDR1). The number of trees in the YDR1 riparian zone increased as a result of planting a large number of jujube trees (Ziziphus jujuba Mill.) along the riparian area. The reaches that suffered little disturbance from human activities maintained a good vegetation succession from near the riverbank to the high land (DYR). Conversely, the vegetation structure of the riparian zone was destroyed, and the coverage was also reduced in the reaches where human activities seriously disturbed the vegetation (YR1, SGR1 and SGR2).

5. Conclusions

In this study, we revealed the different distributions of different plant life forms and the varied vegetation coverage across eight selected reaches and evaluated the influence of natural factors and human activities on the riparian vegetation based on available data in the Yongding River Basin, using UAV remote sensing imagery. We found that the distribution of the different plant life forms and the degree of vegetation coverage differed among reaches due to variations in the climate type and level of human disturbance.
Due to changes in stream flow and interference from human activities, the vegetation coverage in the riparian zones of some reaches (YR1, SGR1) was significantly lower than in other reaches. We anticipate that our study can provide assistance toward ecological restoration efforts and the management of riparian vegetation in the Yongding River Basin. Our research was limited to the seasons during which plant growth activity was highest. Further investigations performed in different seasons will help to further understand the riparian vegetation present in the Yongding River Basin.

Supplementary Materials

The following are available online at https://www.mdpi.com/1999-4907/12/1/22/s1, Figure S1: The distribution of the perennial average precipitation in the Yongding River Basin (www.resdc.cn), Figure S2: Long-term trends of river flow (m3/s) in the Yongding River Basin, Figure S3: The disturbances associated with human activities in the riparian zone in the eight selected reaches in the Yongding River Basin.

Author Contributions

Conceptualization, A.D.; data curation, L.C.; funding acquisition, A.D.; investigation, L.R., Y.L., and Y.G.; methodology, L.R., Y.L., and L.C.; supervision, A.D.; writing—original draft, L.R.; writing—review and editing, S.Z. and A.D. All authors read and agreed to the published version of the manuscript.

Funding

This research was funded by the Beijing Natural Science Foundation (Z170004); the National Natural Science Foundation of China (41672227); and the National Key R&D Program of China (2018YFC1800905).

Institutional Review Board Statement

Not applicable.

Informed Consent Statement

Not applicable.

Data Availability Statement

Data is contained within the article or supplementary material.

Acknowledgments

The authors wish to express their profound gratitude to the Beijing Natural Science Foundation (Z170004), the National Natural Science Foundation of China (41672227) and the National Key R&D Program of China (2018YFC1800905) for support rendered in the course of this research.

Conflicts of Interest

The authors declare no conflict of interest.

References

  1. And, R.J.N.; Décamps, H. The Ecology of Interfaces: Riparian Zones. Annu. Rev. Ecol. Syst. 1997, 28, 621–658. [Google Scholar] [CrossRef] [Green Version]
  2. Woodley, E. Building Nigeria’s Response to Climate Change: Pilot Projects for Community-Based Adaptation in Nigeria. Clim. Chang. Manag. 2011, 20, 297–315. [Google Scholar] [CrossRef]
  3. Wang, X.; Wang, Q.; Yang, S.; Zheng, D.; Wu, C.; Mannaerts, C. Evaluating nitrogen removal by vegetation uptake using satellite image time series in riparian catchments. Sci. Total. Environ. 2011, 409, 2567–2576. [Google Scholar] [CrossRef] [PubMed]
  4. Klein, L.R.; Hendrix, W.G.; Lohr, V.I.; Kaytes, J.B.; Sayler, R.D.; Swanson, M.E.; Elliot, W.J.; Reganold, J.P. Linking ecology and aesthetics in sustainable agricultural landscapes: Lessons from the Palouse region of Washington, U.S.A. Landsc. Urban Plan. 2015, 134, 195–209. [Google Scholar] [CrossRef]
  5. Vollmer, D.; Prescott, M.F.; Padawangi, R.; Girot, C.; Grêt-Regamey, A. Understanding the value of urban riparian corridors: Considerations in planning for cultural services along an Indonesian river. Landsc. Urban Plan. 2015, 138, 144–154. [Google Scholar] [CrossRef]
  6. Zaimes, G.N.; Gounaridis, D.; Symenonakis, E. Assessing the impact of dams on riparian and deltaic vegetation using remotely-sensed vegetation indices and Random Forests modelling. Ecol. Indic. 2019, 103, 630–641. [Google Scholar] [CrossRef]
  7. Zahar, Y.; Ghorbel, A.; Albergel, J. Impacts of large dams on downstream flow conditions of rivers: Aggradation and reduction of the Medjerda channel capacity downstream of the Sidi Salem dam (Tunisia). J. Hydrol. 2008, 351, 318–330. [Google Scholar] [CrossRef]
  8. Arnold, J.F. Plant Life-Form Classification and Its Use in Evaluating Range Conditions and Trend. J. Range Manag. 2007, 8, 176. [Google Scholar] [CrossRef]
  9. Bejarano, M.D.; Sarneel, J.M.; Su, X.; Bejarano, M.D. Shifts in Riparian Plant Life Forms Following Flow Regulation. Forests 2020, 11, 518. [Google Scholar] [CrossRef]
  10. Bhattarai, K.R.; Vetaas, O.R. Variation in plant species richness of different life forms along a subtropical elevation gradient in the Himalayas, east Nepal. Glob. Ecol. Biogeogr. 2003, 12, 327–340. [Google Scholar] [CrossRef]
  11. Marini, L.; Battisti, A.; Bona, E.; Federici, G.; Martini, F.; Pautasso, M.; Hulme, P.E. Alien and native plant life-forms respond differently to human and climate pressures. Glob. Ecol. Biogeogr. 2011, 21, 534–544. [Google Scholar] [CrossRef]
  12. Casillo, J.; Kunst, C.; Semmartin, M. Effects of fire and water availability on the emergence and recruitment of grasses, forbs and woody species in a semiarid Chaco savanna. Austral Ecol. 2012, 37, 452–459. [Google Scholar] [CrossRef]
  13. Gutman, G.; Ignatov, A. The derivation of the green vegetation fraction from NOAA/AVHRR data for use in numerical weather prediction models. Int. J. Remote. Sens. 1998, 19, 1533–1543. [Google Scholar] [CrossRef]
  14. Wang, X.; Jia, K.; Liang, S.; Li, Q.; Wei, X.; Yao, Y.; Zhang, X.; Tu, Y. Estimating Fractional Vegetation Cover From Landsat-7 ETM+ Reflectance Data Based on a Coupled Radiative Transfer and Crop Growth Model. IEEE Trans. Geosci. Remote. Sens. 2017, 55, 5539–5546. [Google Scholar] [CrossRef]
  15. Pyke, D.; Herrick, J.; Shaver, P.; Pellant, M. Rangeland health attributes and indicators for qualitative assessment. J. Range Manag. 2006, 55, 584–597. [Google Scholar] [CrossRef]
  16. Gibbons, P.; Freudenberger, D. An overview of methods used to assess vegetation condition at the scale of the site. Ecol. Manag. Restor. 2006, 7, S10–S17. [Google Scholar] [CrossRef]
  17. Burdon, F.J.; Ramberg, E.; Sargac, J.; Forio, M.A.E.; De Saeyer, N.; Mutinova, P.T.; Moe, T.F.; Pavelescu, M.O.; Dinu, V.; Cazacu, C.; et al. Assessing the Benefits of Forested Riparian Zones: A Qualitative Index of Riparian Integrity Is Positively Associated with Ecological Status in European Streams. Water 2020, 12, 1178. [Google Scholar] [CrossRef] [Green Version]
  18. Garófano-Gómez, V.; Martínez-Capel, F.; Bertoldi, W.; Gurnell, A.; Estornell, J.; Segura-Beltrán, F. Six decades of changes in the riparian corridor of a Mediterranean river: A synthetic analysis based on historical data sources. Ecohydrology 2012, 6, 536–553. [Google Scholar] [CrossRef]
  19. Marcus, W.A.; Fonstad, M.A. Optical remote mapping of rivers at sub-meter resolutions and watershed extents. Earth Surf. Process. Landforms 2007, 33, 4–24. [Google Scholar] [CrossRef]
  20. Palmquist, E.C.; Ralston, B.E.; Merritt, D.M.; Shafroth, P.B. Landscape-scale processes influence riparian plant composition along a regulated river. J. Arid. Environ. 2018, 148, 54–64. [Google Scholar] [CrossRef]
  21. Johansen, K.; Phinn, S.R.; Witte, C. Mapping of riparian zone attributes using discrete return LiDAR, QuickBird and SPOT-5 imagery: Assessing accuracy and costs. Remote. Sens. Environ. 2010, 114, 2679–2691. [Google Scholar] [CrossRef]
  22. Gergel, E.S.; Stange, Y.; Coops, N.; Johansen, K.; Kirby, K.R. What is the Value of a Good Map? An Example Using High Spatial Resolution Imagery to Aid Riparian Restoration. Ecosystems 2007, 10, 688–702. [Google Scholar] [CrossRef]
  23. Claggett, P.R.; Okay, J.A.; Stehman, S.V. Monitoring Regional Riparian Forest Cover Change Using Stratified Sampling and Multiresolution Imagery1. JAWRA J. Am. Water Resour. Assoc. 2010, 46, 334–343. [Google Scholar] [CrossRef]
  24. Fullerton, A.H.; Beechie, T.J.; Baker, S.E.; Hall, J.E.; Barnas, K.A. Regional patterns of riparian characteristics in the interior Columbia River basin, Northwestern USA: Applications for restoration planning. Landsc. Ecol. 2006, 21, 1347–1360. [Google Scholar] [CrossRef]
  25. Matsuura, T.; Suzuki, W. Analysis of topography and vegetation distribution using a digital elevation model: Case study of a snowy mountain basin in northeastern Japan. Landsc. Ecol. Eng. 2012, 9, 143–155. [Google Scholar] [CrossRef]
  26. Riedler, B.; Pernkopf, L.; Strasser, T.; Lang, S.; Smith, G. A composite indicator for assessing habitat quality of riparian forests derived from Earth observation data. Int. J. Appl. Earth Obs. Geoinf. 2015, 37, 114–123. [Google Scholar] [CrossRef]
  27. Tompalski, P.; Coops, N.C.; White, J.C.; Wulder, M.A.; Yuill, A. Characterizing streams and riparian areas with airborne laser scanning data. Remote. Sens. Environ. 2017, 192, 73–86. [Google Scholar] [CrossRef]
  28. Solins, J.P.; Thorne, J.H.; Cadenasso, M.L. Riparian canopy expansion in an urban landscape: Multiple drivers of vegetation change along headwater streams near Sacramento, California. Landsc. Urban Plan. 2018, 172, 37–46. [Google Scholar] [CrossRef]
  29. Huylenbroeck, L.; Laslier, M.; Dufour, S.; Georges, B.; Lejeune, P.; Michez, A. Using remote sensing to characterize riparian vegetation: A review of available tools and perspectives for managers. J. Environ. Manag. 2020, 267, 110652. [Google Scholar] [CrossRef]
  30. Michez, A.; Piégay, H.; Lisein, J.; Claessens, H.; Lejeune, P. Classification of riparian forest species and health condition using multi-temporal and hyperspatial imagery from unmanned aerial system. Environ. Monit. Assess. 2016, 188, 1–19. [Google Scholar] [CrossRef] [Green Version]
  31. Dunford, R.; Michel, K.; Gagnage, M.; Piégay, H.; Trémelo, M.-L. Potential and constraints of Unmanned Aerial Vehicle technology for the characterization of Mediterranean riparian forest. Int. J. Remote. Sens. 2009, 30, 4915–4935. [Google Scholar] [CrossRef]
  32. Michez, A.; Piégay, H.; Jonathan, L.; Claessens, H.; Lejeune, P. Mapping of riparian invasive species with supervised classification of Unmanned Aerial System (UAS) imagery. Int. J. Appl. Earth Obs. Geoinf. 2016, 44, 88–94. [Google Scholar] [CrossRef]
  33. Vasekova, B.; Nemetova, Z.; Keszeliova, A.; Stefunkova, Z. Mapping Invasive Plants in Riverbank Vegetation. IOP Conf. Ser. 2019, 221, 012109. [Google Scholar] [CrossRef]
  34. Colomina, I.; Molina, P. Unmanned aerial systems for photogrammetry and remote sensing: A review. ISPRS J. Photogramm. Remote. Sens. 2014, 92, 79–97. [Google Scholar] [CrossRef] [Green Version]
  35. Jiang, B.; Wong, C.P.; Lu, F.; Ouyang, Z.; Wang, Y. Drivers of drying on the Yongding River in Beijing. J. Hydrol. 2014, 519, 69–79. [Google Scholar] [CrossRef]
  36. Dai, D.; Xu, X.; Sun, M.; Hao, C.; Lv, X.; Lei, K. Decrease of both river flow and quality aggravates water crisis in North China: A typical example of the upper Yongding River watershed. Environ. Monit. Assess. 2020, 192, 1–13. [Google Scholar] [CrossRef]
  37. Romeo, F.V.; Piscopo, A.; Poiana, M. Effect of drying, chemical and natural processing methods on black Biancolilla olives. Grasas Aceites 2012, 63, 223–230. [Google Scholar] [CrossRef] [Green Version]
  38. Wu, B.; Feng, Z.K.; Wei, X.H.; Wang, C.B.; Wang, Y.G. Change of land use and landscape pattern in Yongding River Watershed. For. Inventory. Plan. 2011, 36, 30–34. [Google Scholar]
  39. Zhao, Y.L.; Gong, Z.N. Analysis of land cover change and its driving force in downstream of Yongding River. J. Nat. Disasters. 2012, 21, 63–71. [Google Scholar]
  40. Jia, W.J.; Wei, X.H.; Wang, X.L.; Feng, Z.K. Research on Beijing Yongding River Basin Forest Vegetation Coverage Changes. For. Inventory. Plan. 2011, 36, 22–25. [Google Scholar]
  41. Xiu, C.; Zheng, H.; Ouyang, Z.Y. Flora analysis of riparian vegetation in Yongding-Haihe river system, China. Acta. Ecol. Sin. 2014, 34, 1535–1547. [Google Scholar]
  42. Huifen, L.; Fang, M.; Chengming, Y. Estimation of Vegetation Fractional Coverage in Lugu Lake Based on the Dimidiate Pixel Model. In Proceedings of the 2013 Fifth International Conference on Measuring Technology and Mechatronics Automation, Hong Kong, China, 16–17 January 2013; pp. 532–535. [Google Scholar] [CrossRef]
  43. Garssen, A.G.; Baattrup-Pedersen, A.; Voesenek, L.A.C.J.; Verhoeven, J.T.A.; Soons, M.B. Riparian plant community responses to increased flooding: A meta-analysis. Glob. Chang. Biol. 2015, 21, 2881–2890. [Google Scholar] [CrossRef] [PubMed]
  44. Sarneel, J.M.; Bejarano, M.D.; Van Oosterhout, M.; Nilsson, C. Local flooding history affects plant recruitment in riparian zones. J. Veg. Sci. 2019, 30, 224–234. [Google Scholar] [CrossRef] [Green Version]
  45. Aguiar, F.C.; Segurado, P.; Martins, M.J.; Bejarano, M.D.; Nilsson, C.; Portela, M.M.; Merritt, D.M. The abundance and distribution of guilds of riparian woody plants change in response to land use and flow regulation. J. Appl. Ecol. 2018, 55, 2227–2240. [Google Scholar] [CrossRef]
  46. Fu, B.; Burgher, I. Riparian vegetation NDVI dynamics and its relationship with climate, surface water and groundwater. J. Arid. Environ. 2015, 113, 59–68. [Google Scholar] [CrossRef]
  47. Chen, Y.; Chen, Y.; Xu, C.; Ye, Z.; Li, Z.; Zhu, C.; Ma, X. Effects of ecological water conveyance on groundwater dynamics and riparian vegetation in the lower reaches of Tarim River, China. Hydrol. Process. 2009, 24, 170–177. [Google Scholar] [CrossRef]
  48. Zermeño-Hernández, I.; Benítez-Malvido, J.; Suazo-Ortuño, I.; Méndez-Toribio, M. Impact of adjacent land use on the ecological condition of riparian habitats: The relation between condition and vegetation properties. Appl. Veg. Sci. 2020, 23, 610–621. [Google Scholar] [CrossRef]
  49. Amy, J.; Robertson, A.I. Relationships between livestock management and the ecological condition of riparian habitats along an Australian floodplain river. J. Appl. Ecol. 2001, 38, 63–75. [Google Scholar] [CrossRef]
  50. Breckenridge, R.P.; Dakins, M.; Bunting, S.; Harbour, J.L.; Lee, R.D. Using Unmanned Helicopters to Assess Vegetation Cover in Sagebrush Steppe Ecosystems. Rangel. Ecol. Manag. 2012, 65, 362–370. [Google Scholar] [CrossRef]
Figure 1. Geographic location of the study area (DYR: selected reach of the Dongyang River; YR1 and YR2: selected reaches 1 and 2 of the Yang River; SGR1, 2, and 3: selected reaches 1, 2, and 3 of the Sanggan River; YDR1 and 2: selected reaches 1 and 2 of the Yongding River).
Forests 12 00022 g001
Figure 2. Unmanned aerial vehicle (UAV) images of the eight selected reaches.
Forests 12 00022 g002
Figure 3. The distribution of the different plant life forms in the riparian zones of the eight selected reaches.
Forests 12 00022 g003
Figure 4. Vegetation coverage of the riparian zones of the eight selected reaches (0–20%: extremely low; 20–40%: low; 40–60%: medium; 60–80%: high; 80–100%: extremely high).
Forests 12 00022 g004
Figure 5. Riparian (Digital Terrain Model) DTM of the eight selected reaches.
Forests 12 00022 g005
Table 1. The center wavelengths and bandwidths for the MicaSense Altum multispectral camera.
NameCenter WavelengthBandwidth
1Blue465 nm32 nm
2Green560 nm27 nm
3Red668 nm16 nm
4Red edge717 nm12 nm
5Near-infrared842 nm57 nm
6Thermal11 μm6 μm
Table 2. The proportion of different vegetation coverage grades in the selected eight reaches.
DYRYR1YR2SGR1SGR2SGR3YDR1YDR2
Extremely Low
0–20%
12.0%37.4%14.4%10.3%0.6%3.6%17.4%10.5%
Low
20–40%
10.7%28.4%5.4%24.5%9.2%1.6%15.3%10.9%
Medium
40–60%
20.9%10.2%10.1%15.0%23.4%2.9%13.1%12.3%
High
60–80%
27.1%7.5%22.0%17.3%26.9%6.8%17.5%15.2%
Extremely High
80–100%
29.3%16.5%48.1%32.9%39.9%85.1%36.7%51.1%
Publisher’s Note: MDPI stays neutral with regard to jurisdictional claims in published maps and institutional affiliations.

